Article

Proton, UV, and X-ray Induced Luminescence in Tb3+ Doped LuGd2Ga2Al3O12 Phosphors

1
Department of Physics, Kohat University of Science & Techn1ology, Kohat 26000, Pakistan
2
Department of Physics, Kyungpook National University, Daegu 702-701, Korea
3
Department of Nuclear Engineering (DNE), Institute of Engineering and Applied Sciences (PIEAS), Islamabad 45650, Pakistan
4
DCIS, Pakistan Institute Engineering and Applied Sciences (PIEAS), Islamabad 45650, Pakistan
5
Department of Physics, Charles E. Schmidt College of Science, Florida Atlantic University, Boca Raton, FL 33431-0991, USA
*
Author to whom correspondence should be addressed.
Crystals 2020, 10(9), 844; https://doi.org/10.3390/cryst10090844
Submission received: 9 July 2020 / Revised: 10 September 2020 / Accepted: 16 September 2020 / Published: 22 September 2020
(This article belongs to the Special Issue Xene Materials and Biomedical Applications of Nanostructures)

Abstract

:
The well-known solid-state reaction method is used for the synthesis of Tb doped LuGd2Ga2Al3O12 phosphor. XRD and SEM techniques are used for the phase and structural morphology of the synthesized phosphor. UV, X-ray and proton induced spectroscopy is used to study the luminescence properties. LuGd2Ga2Al3O12:Tb3+ phosphor shows its highest peak in green and blue region. The two major emission peaks correspond to 5D37FJ (at 480 to 510 nm, blue region) and 5D47FJ (at 535 to 565 nm, green region). Green emission is dominant; therefore, it may be used as an efficient green phosphor. The absorption spectra of the synthesized material matches well with the spectra of light emitting diodes (LEDs); therefore, it may have applications in LEDs. X-ray spectroscopic study suggests that this phosphor may have uses in medical applications, such as X-ray imaging. The synthesized phosphor exhibits 81% efficacy in comparison to the commercial plasma display panel material (Gd2O2S:Tb3+). The Commission Internationale de l’Eclairage (CIE) chromaticity diagram is obtained for this phosphor. The decay time of ms range is measured for the synthesized phosphor.

1. Introduction

Rare-earth doped yttrium aluminum garnet (YAG) is a well-known commercially used phosphor due to its brilliant luminescence properties [1,2]. YAG has been studied extensively for the past few decades. LuAG is another host material that has shown promising properties due to its diverse range of properties, such as octahedral and tetrahedral structures, the transparent nature to various types of radiations, high optical quality, better thermal chemical and stability, low temperature for the synthesis, and radiation hardness [3,4,5,6].
Owing to the promising photoluminescence properties of trivalent terbium ion, contributed to green phosphors, has been investigated for last few decades. Green emission of Tb-doped borate phosphor has been investigated [7,8]. Tb doped borates (LiBaB9015) give dominant green luminescent peak at 542 nm [9]. Tb has shown much better luminescence when doped in YAG. LuAGs possess broad peaks of emission and absorption and can be excited by blue LEDs, which make it suitable for light emitting diode (LED) applications [10,11,12].
LuGd2Ga2Al3O12 is one of the LuAG phases that is less studied. Therefore, this work consists of synthesis and luminescence study of Tb doped LuGd2Ga2Al3O12 phosphor.

2. Experimental

To get the phosphors’ final goal, firstly, it is synthesized through solid state reaction method; a well-known technique for the synthesis of phosphors [13,14]. Lutetium oxide (Lu2O3, 99.998%), gallium oxide (Ga2O3, 99.99%) gadolinium oxide (Gd2O3, 99.99%), and aluminum oxide (Al3O12) (Sigma-Aldrich, Daegu, South Korea) are weighed according to the balanced chemical equation to get a specified amount of host material LuGd2Ga2Al3O12. Different concentrations of activator, Terbium oxide (Tb2O3, 99.99%), are doped with the host. Duration of ball milling, temperature, heating rate, and cooling rates are optimized for sintering the synthesized material. After measuring mass of powders it is ball milled for 7 h in order to mix it well. For sintering purpose, the mixed powders are kept in the electric furnace. The temperature of the furnace is kept constant at 700 °C for 20 h followed by slow heating and cooling rate of 100 °C/h in the air environment. Finally, fine grinned samples of Tb3+ doped LuGd2Ga2Al3O12 phosphors are obtained.

3. Characterizations

Scanning electron microscopy (SEM) (AIS 2000C, Seron, South Korea) is used to find the shape and size of the grains and the overall morphology of the phosphors. X-ray diffraction (XRD) (Philips XPERT-MED, Amsterdam, Netherlands) is used to find the material’s crystallinity. To find luminescent properties of the synthesized material UV and X-ray induced spectroscopy (Beckman DU640 UV/Vis spectrophotometer, Kraemer Boulevard Brea, CA, USA) is used. The chromaticity diagram is obtained for the purpose of studying the white light emission. Proton beam line (45 MeV energy, 2 nA current) passes through 0.2 mm thick aluminum window, which is capping the beam pipe with 5 cm of air, loses energy up to 39 MeV [15].
Using the same spectrometer (QE65000, Ocean optics) the variation of the color with the Tb concentration is obtained using the Commission Internationale de l’Eclairage (CIE) 1931 chromaticity diagram.

4. Results and Discussion

4.1. X-ray Diffraction Analysis

XRD peaks are shown in Figure 1, which gives comparison of peaks of LuGd2Ga2Al3O12:Tb3+ phosphor with Al5Gd3O12 (PDF No. 98-002-3849). The peaks of our sample well match with the peaks of the reference material (Al5Gd3O12). It proved that the phase achieved is the required phase for the synthesized phosphor. It also verifies that the synthesized phosphors are octahedral in structure. It is proved that extra peaks of the reactants are not present in the synthesized phosphors. It proves the single-phase phosphor material as a product. Furthermore, the Bragg’s law is used for the calculation of finding lattice constants of the synthesized phosphors [16].

4.2. Scanning Electron Microscopy

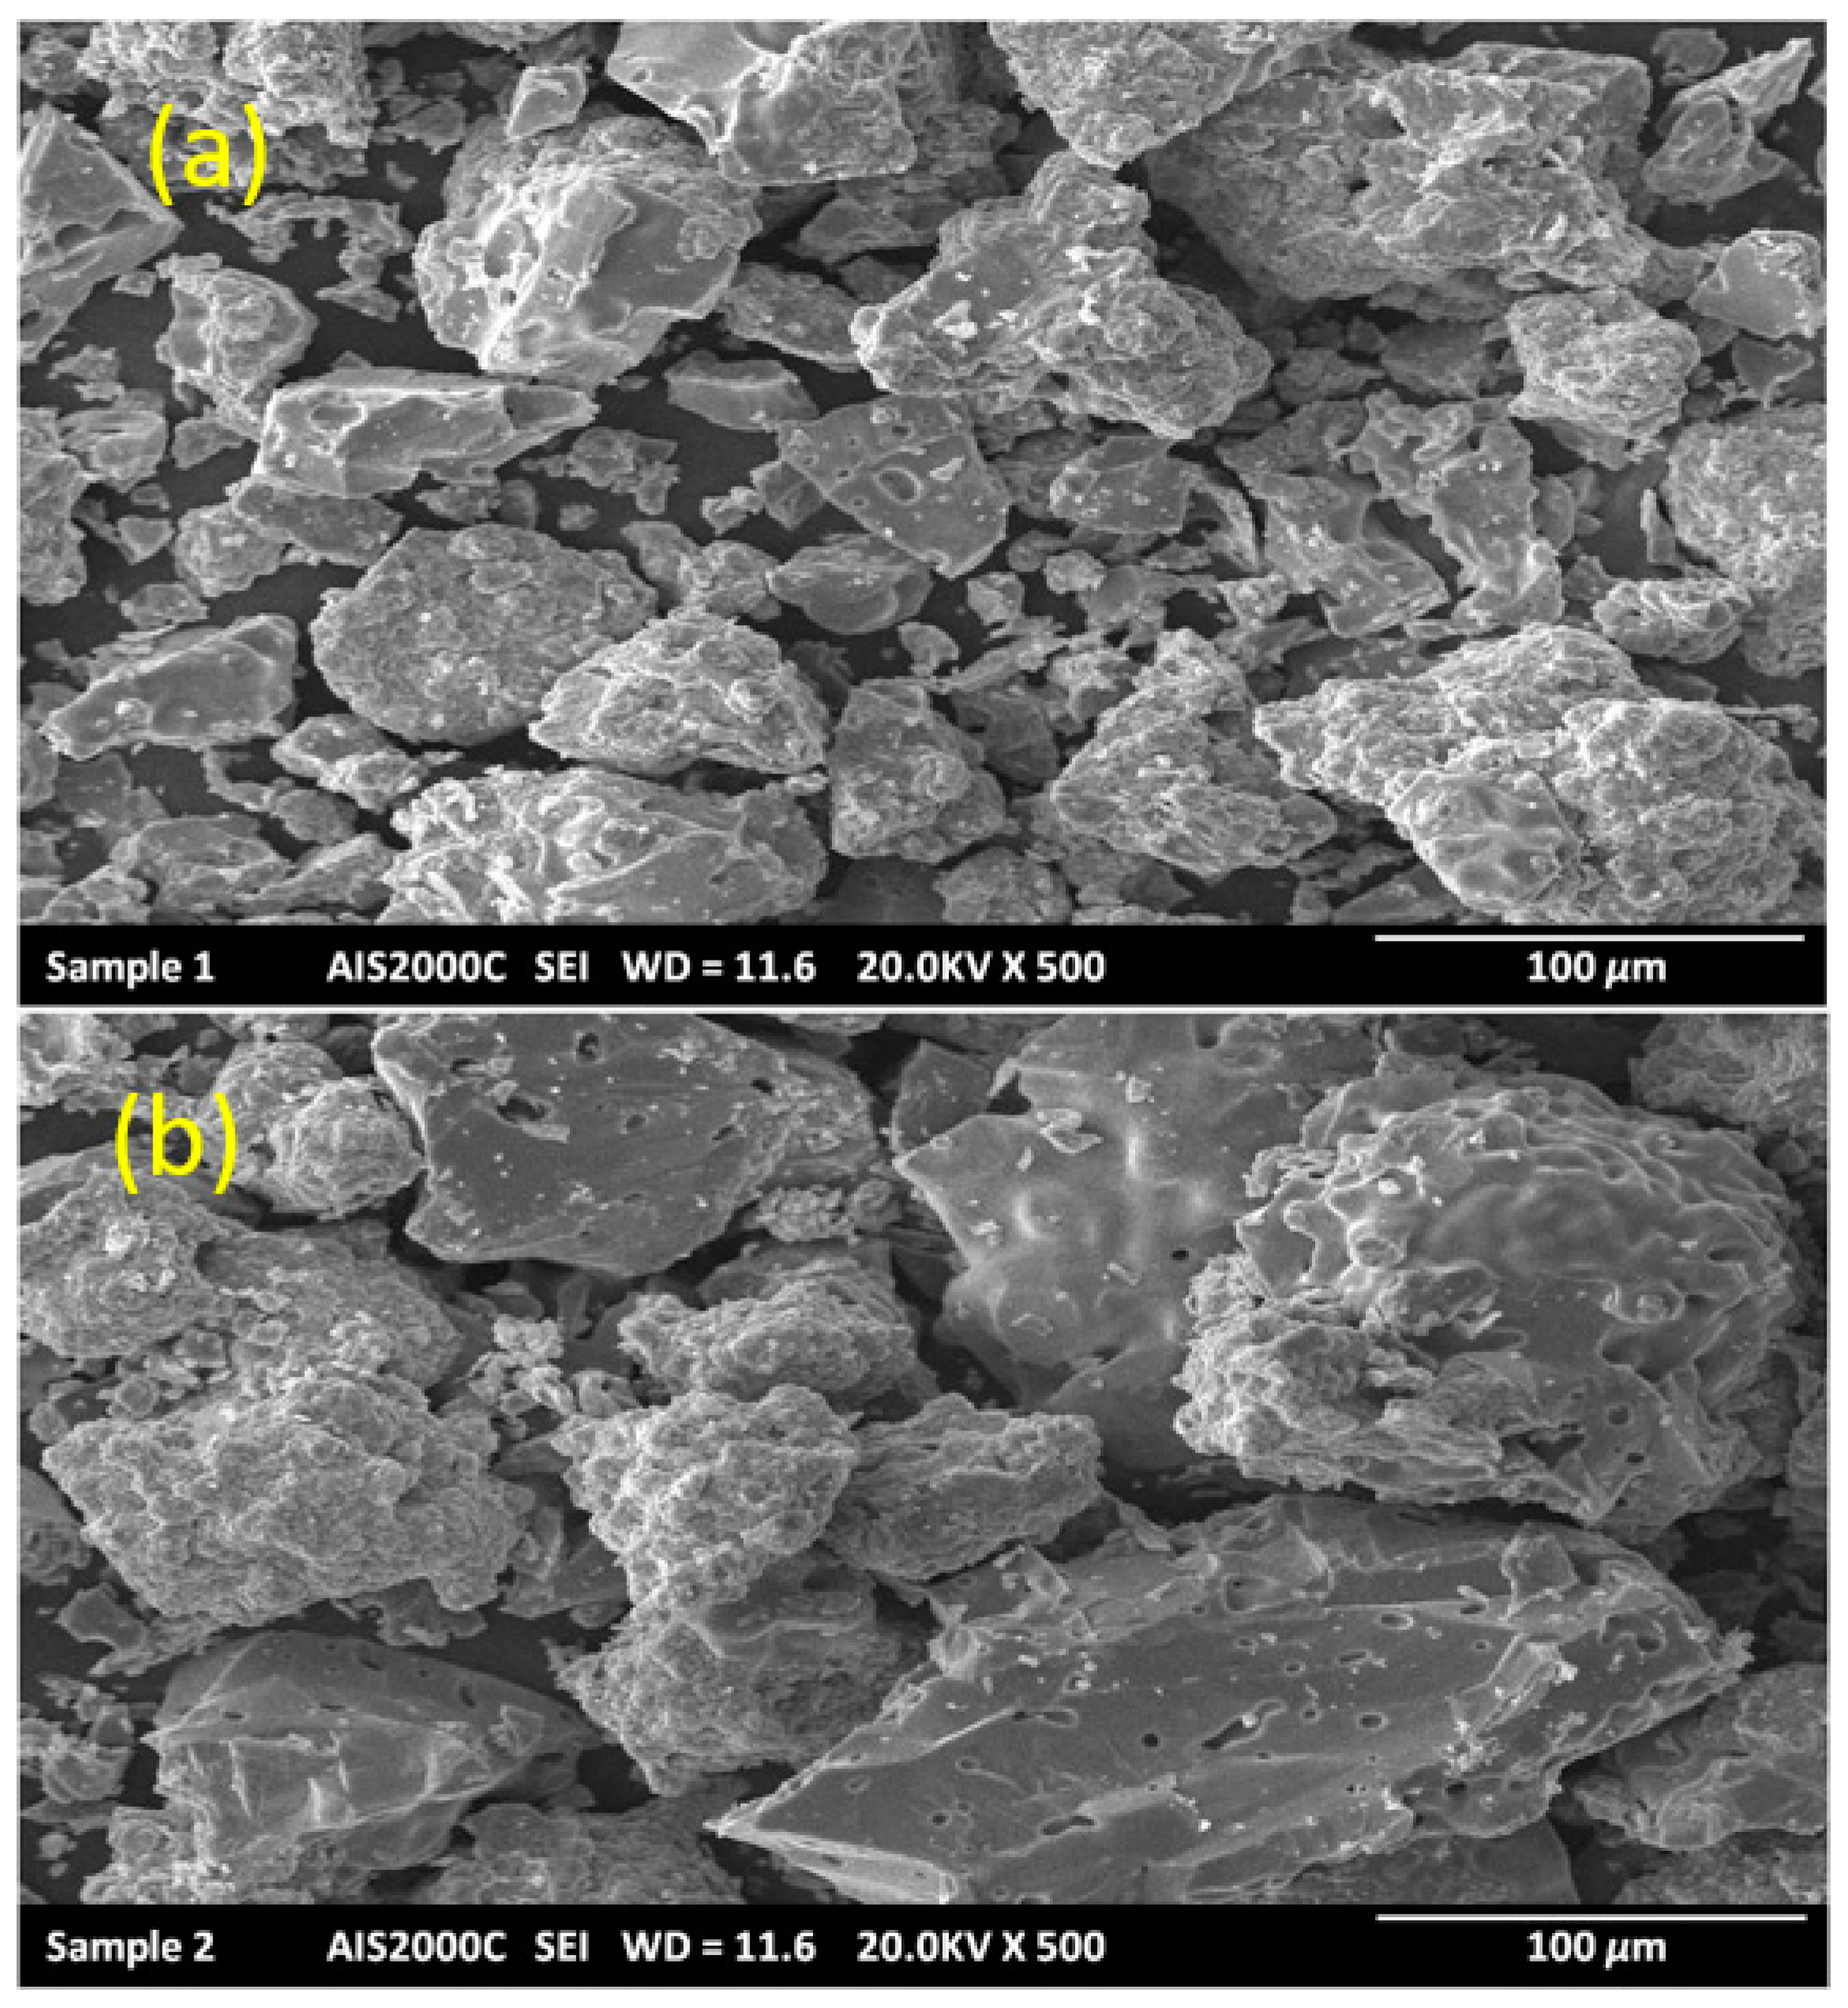
The grain shape of LuGd2Ga2Al3O12:Tb3+ (5 mol%) and LuGd2Ga2Al3O12:Tb3+ (1 mol%) powder are shown in Figure 2. These micrographs show similar nature of grains in terms of morphology and shape. The crystallinity and the grain size in the micrometer range of the phosphor are fundamental structural properties to get high luminescence [17]. Figure 2a,b shows that LuGd2Ga2Al3O12:Tb3+ (5 mol%) having small grains with irregular sharp edges, while LuGd2Ga2Al3O12:Tb3+ (1 mol%) having agglomerated large grains, as shown in Figure 2. Since large grains have less chances of reflection, when the sample is exposed to light; therefore, it has better luminescence than the LuGd2Ga2Al3O12:Tb3+ (5 mol%) [18]. LuGd2Ga2Al3O12:Tb3+ phosphors have grain size within the micrometer range, which results in a better luminescence. Phosphors, having grain size of a micrometer, are usually used for X-ray imaging in the medical field. It is research proven that the luminescent properties of LuAG phosphors are affected by size and crystalline nature of phosphors [19,20].

4.3. UV Induced Luminescence of LuGd2Ga2Al3O12:Tb3+

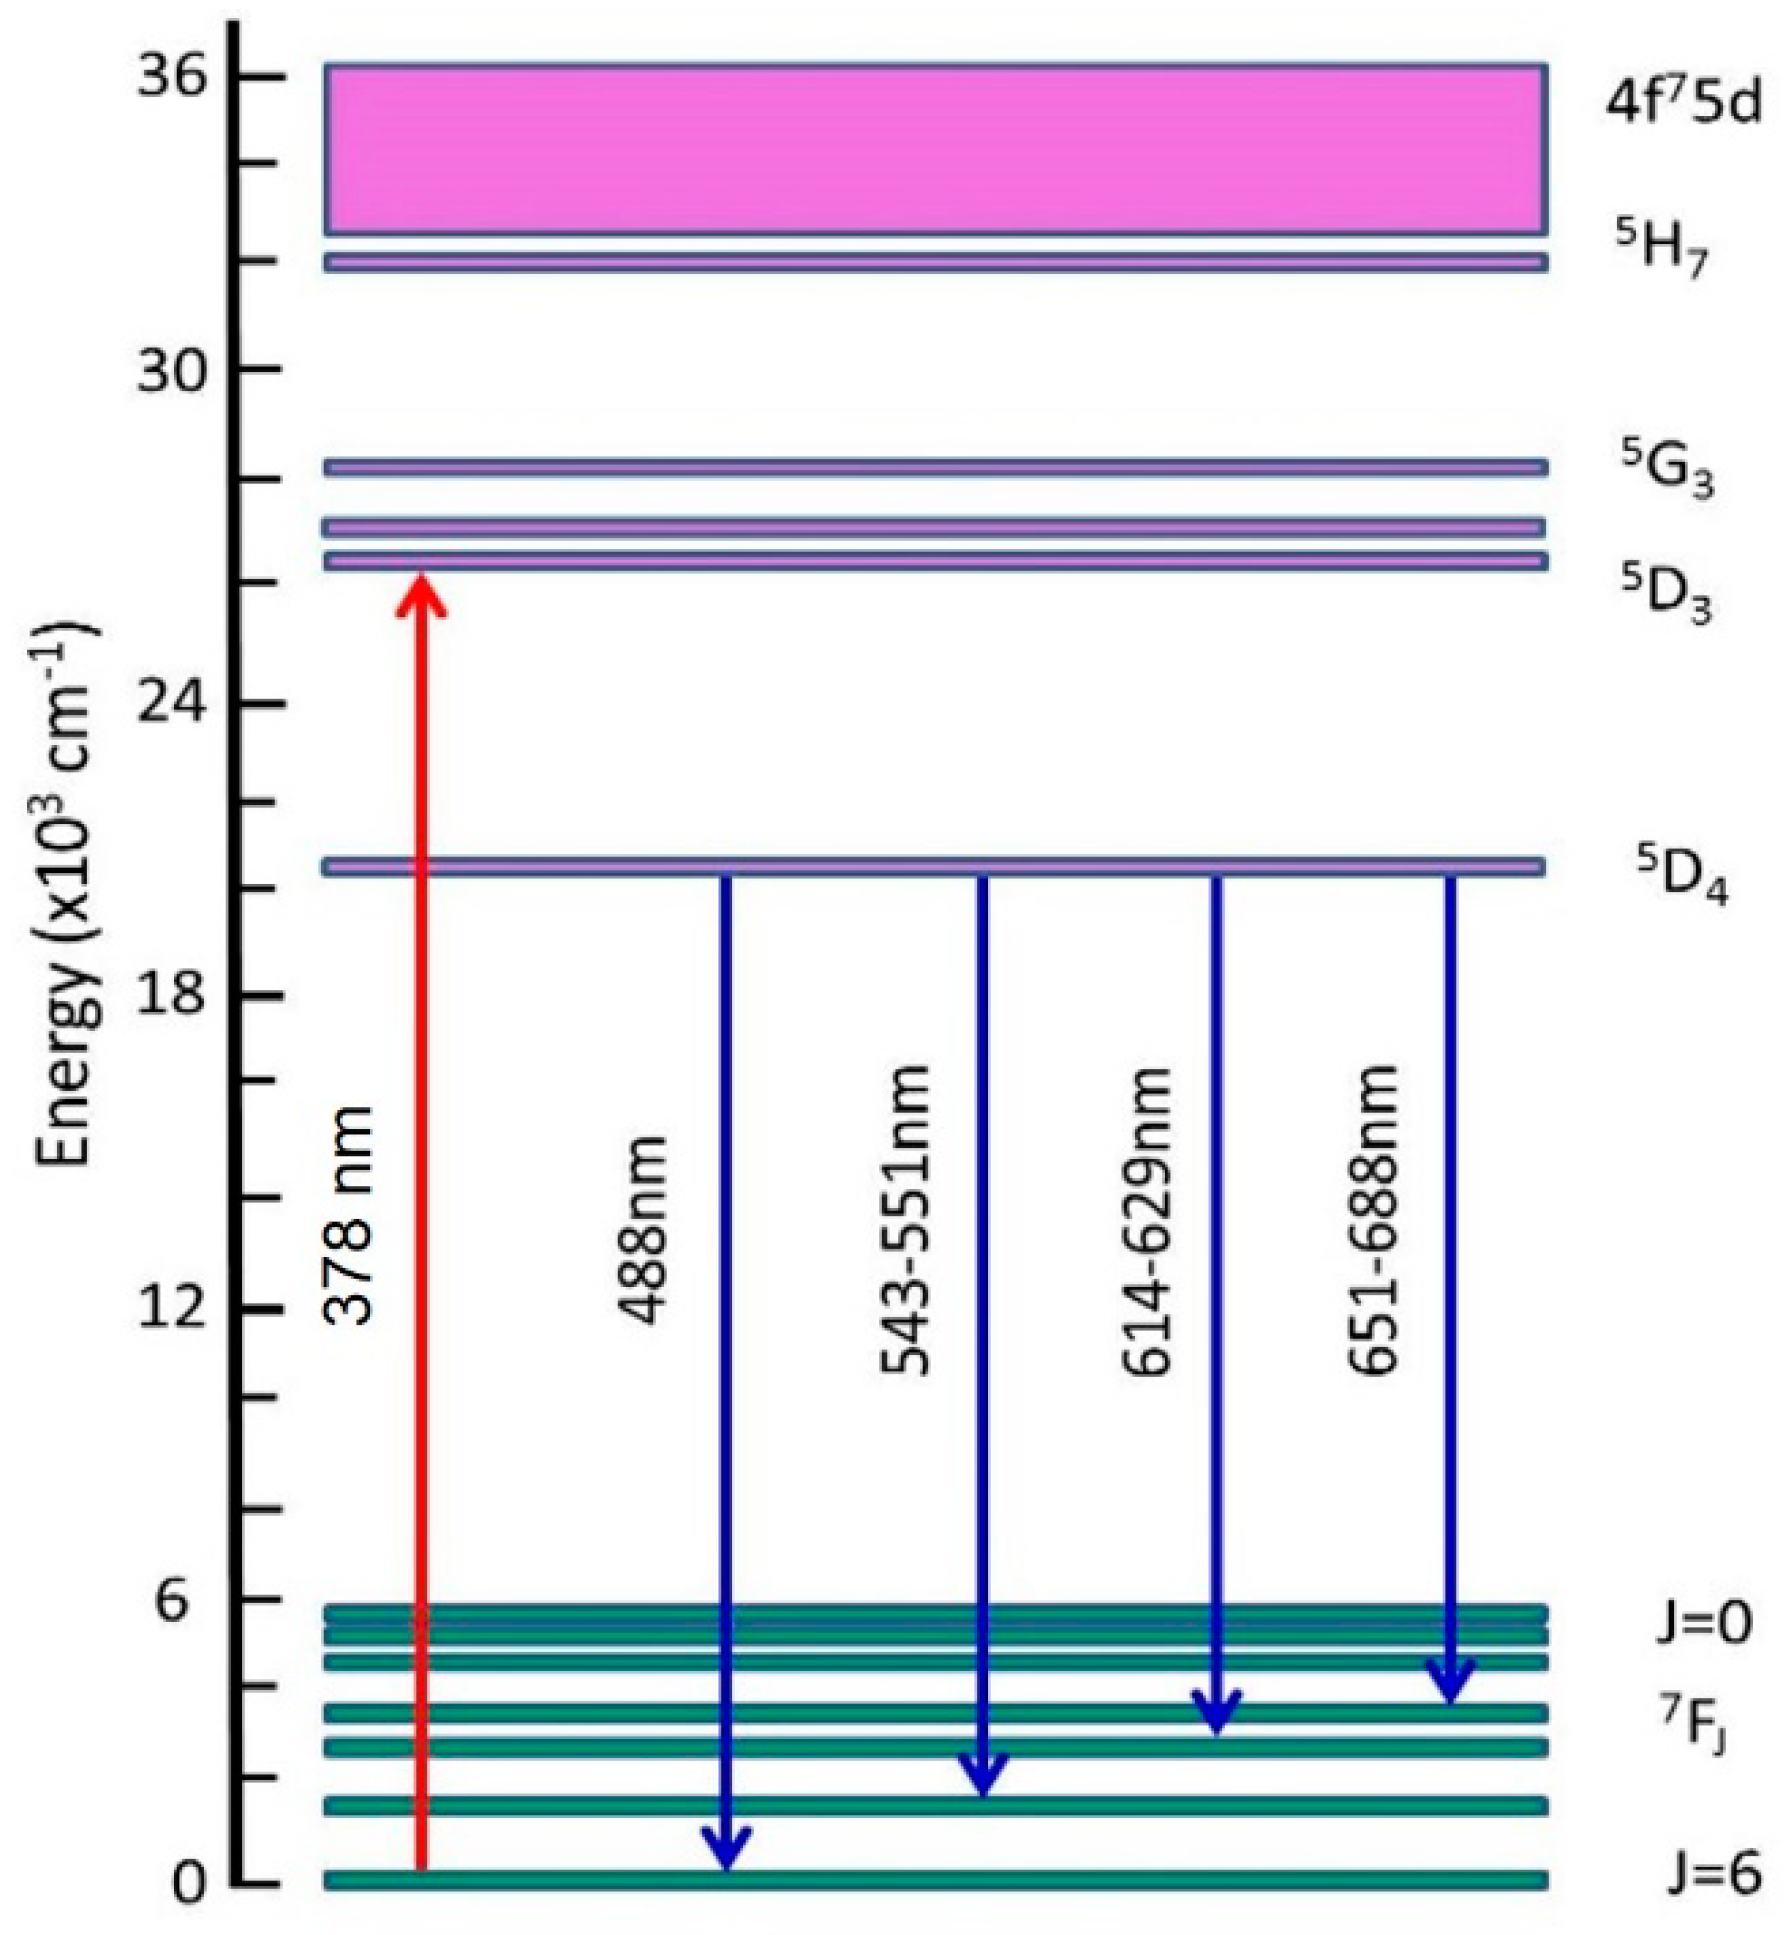
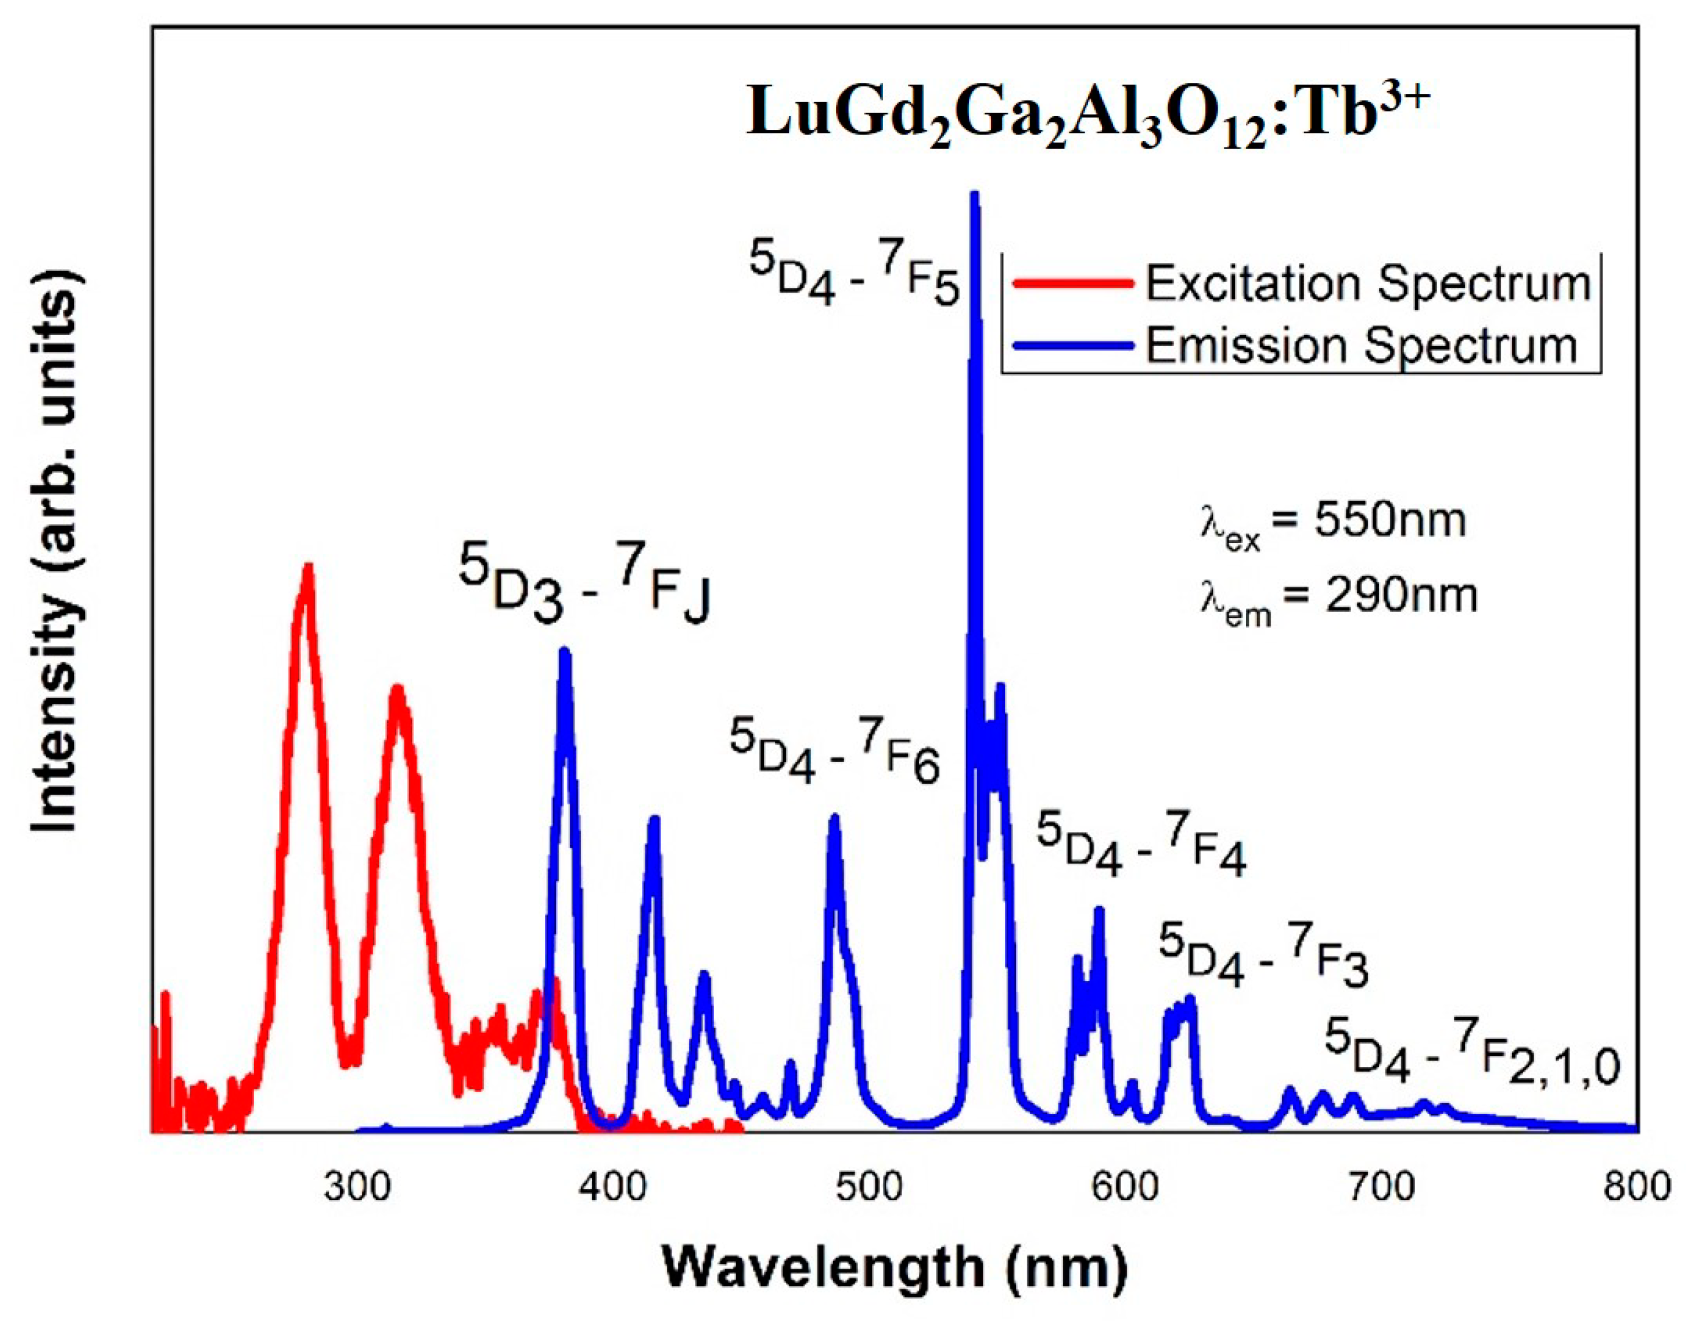
Excitation and emission transitions with energy levels of Tb3+ ion are recorded and given in Figure 3. UV-induced excitation and emission spectra are shown in Figure 4. Excitation band of LuGd2Ga2Al3O12:Tb3+ is observed at 290 nm 7F65D3 transition. Emission band is observed at 378 nm 5D47FJ transition. Where J ranges from 0 to 6.
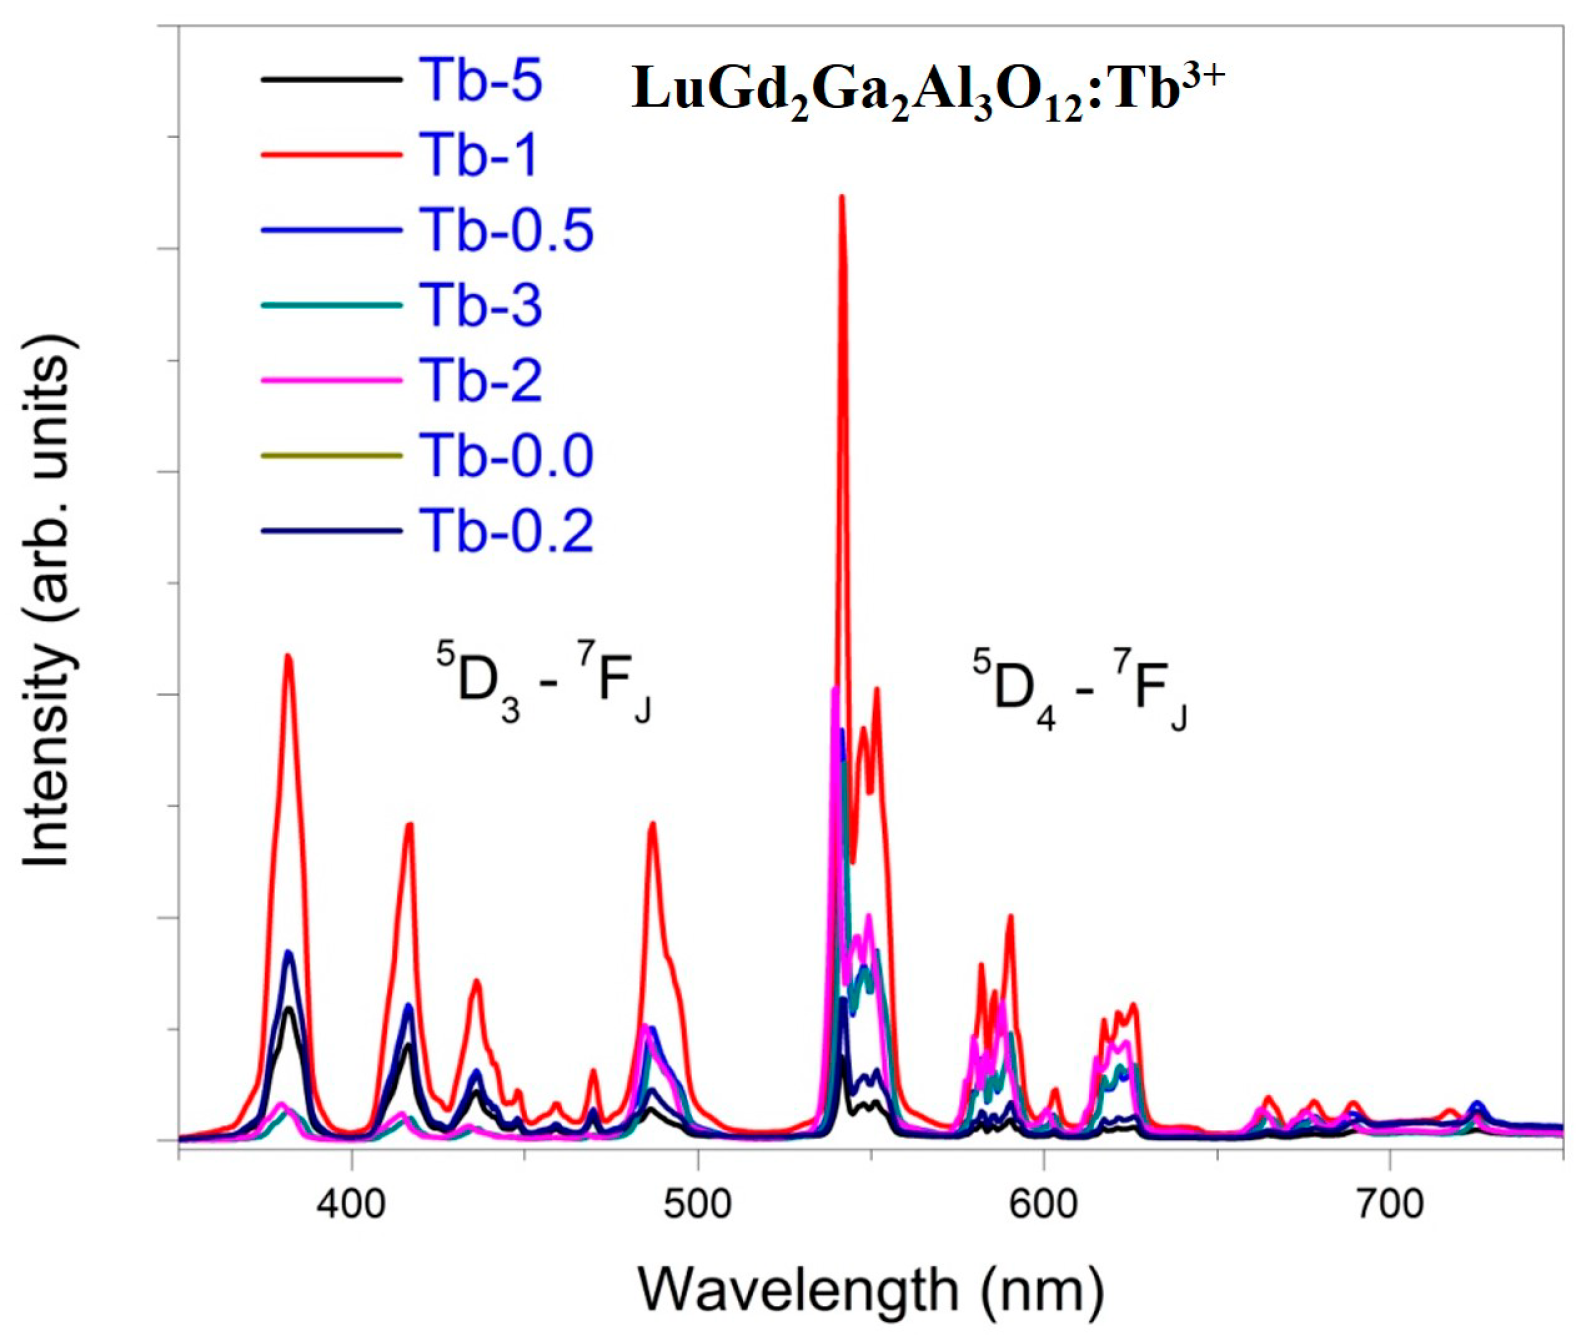
Figure 4 shows three major excitation peaks at 290 nm, 320 nm, and 378 nm. The major emission peak is observed at 550 nm. The emission spectrum of Tb3+ doped LuGd2Ga2Al3O12 phosphor by UV light, monitored (at the emission wavelength of 625 nm) is not limited to 550 nm, but it consists of other emission peaks at 380 nm, 420 nm, 480 nm, 580 nm, and 620 nm. Figure 4 also shows the green and blue emission spectrum of LuGd2Ga2Al3O12:Tb3+ phosphor. The two major emission peaks correspond to 5D37FJ (at 480–510 nm, blue region), 5D47FJ (at 535–565 nm, green region). Green emission is dominant due to the presence of Tb3+ dopant. A similar emission is published for Tb doped phosphors [21,22]. Figure 5 shows that blue emission (5D3→7FJ) intensity is decreased and green emission (5D4→7FJ) intensity is increased with increasing concentration of Tb3+. The intensity ratio (IG/IB) may play the same role as red/orange (IR/IO) intensity ratio of Eu3+ or yellow/blue (IY/IB) intensity ratio of Dy3+. It also describe the symmetry of the local environment around the optically active dopant and covalent/ ionic bonding between Tb3+ and O2−. Similar to Eu3+ or Dy3+, the Tb3+ ions may be used as a spectroscopic probe as well [23,24].

4.4. X-ray Induced Luminescence Spectroscopy

Emission spectra of LuGd2Ga2Al3O12:Tb3+ are also observed through X-ray induced spectroscopy with various concentrations of Tb3+ as shown in the Figure 6.
X-ray spectroscopy shows emission in the range of 300–650 nm. X ray spectroscopy shows highest emission peak at 550 nm, which is the result of UV Spectroscopy. The X-ray induced emission spectrum well matches with that of UV induced emission spectrum and with the published data of X-ray luminescence [25]. Figure 6 shows 1 mol% concentration of Tb3+ in LuGd2Ga2Al3O12 as the optimized concentration of Tb3+. This optimized value of 1 mol% Tb3+ is shown in Figure 7.
X-ray spectroscopic study suggests that this phosphor may be used in a medical application, such as X-ray imaging.

4.5. Optimization of Tb3+ Concentrations

Figure 7 shows different concentrations of Tb3+ (mol%) with relevant maximum emission intensities. The optimized concentrations with maximum intensity for emission peak is given, i.e., 1 mole% of Tb. Since the intensity of green color is more dominant, therefore, this phosphor might be used as green phosphor.

4.6. Proton Induced Luminescence Spectroscopy

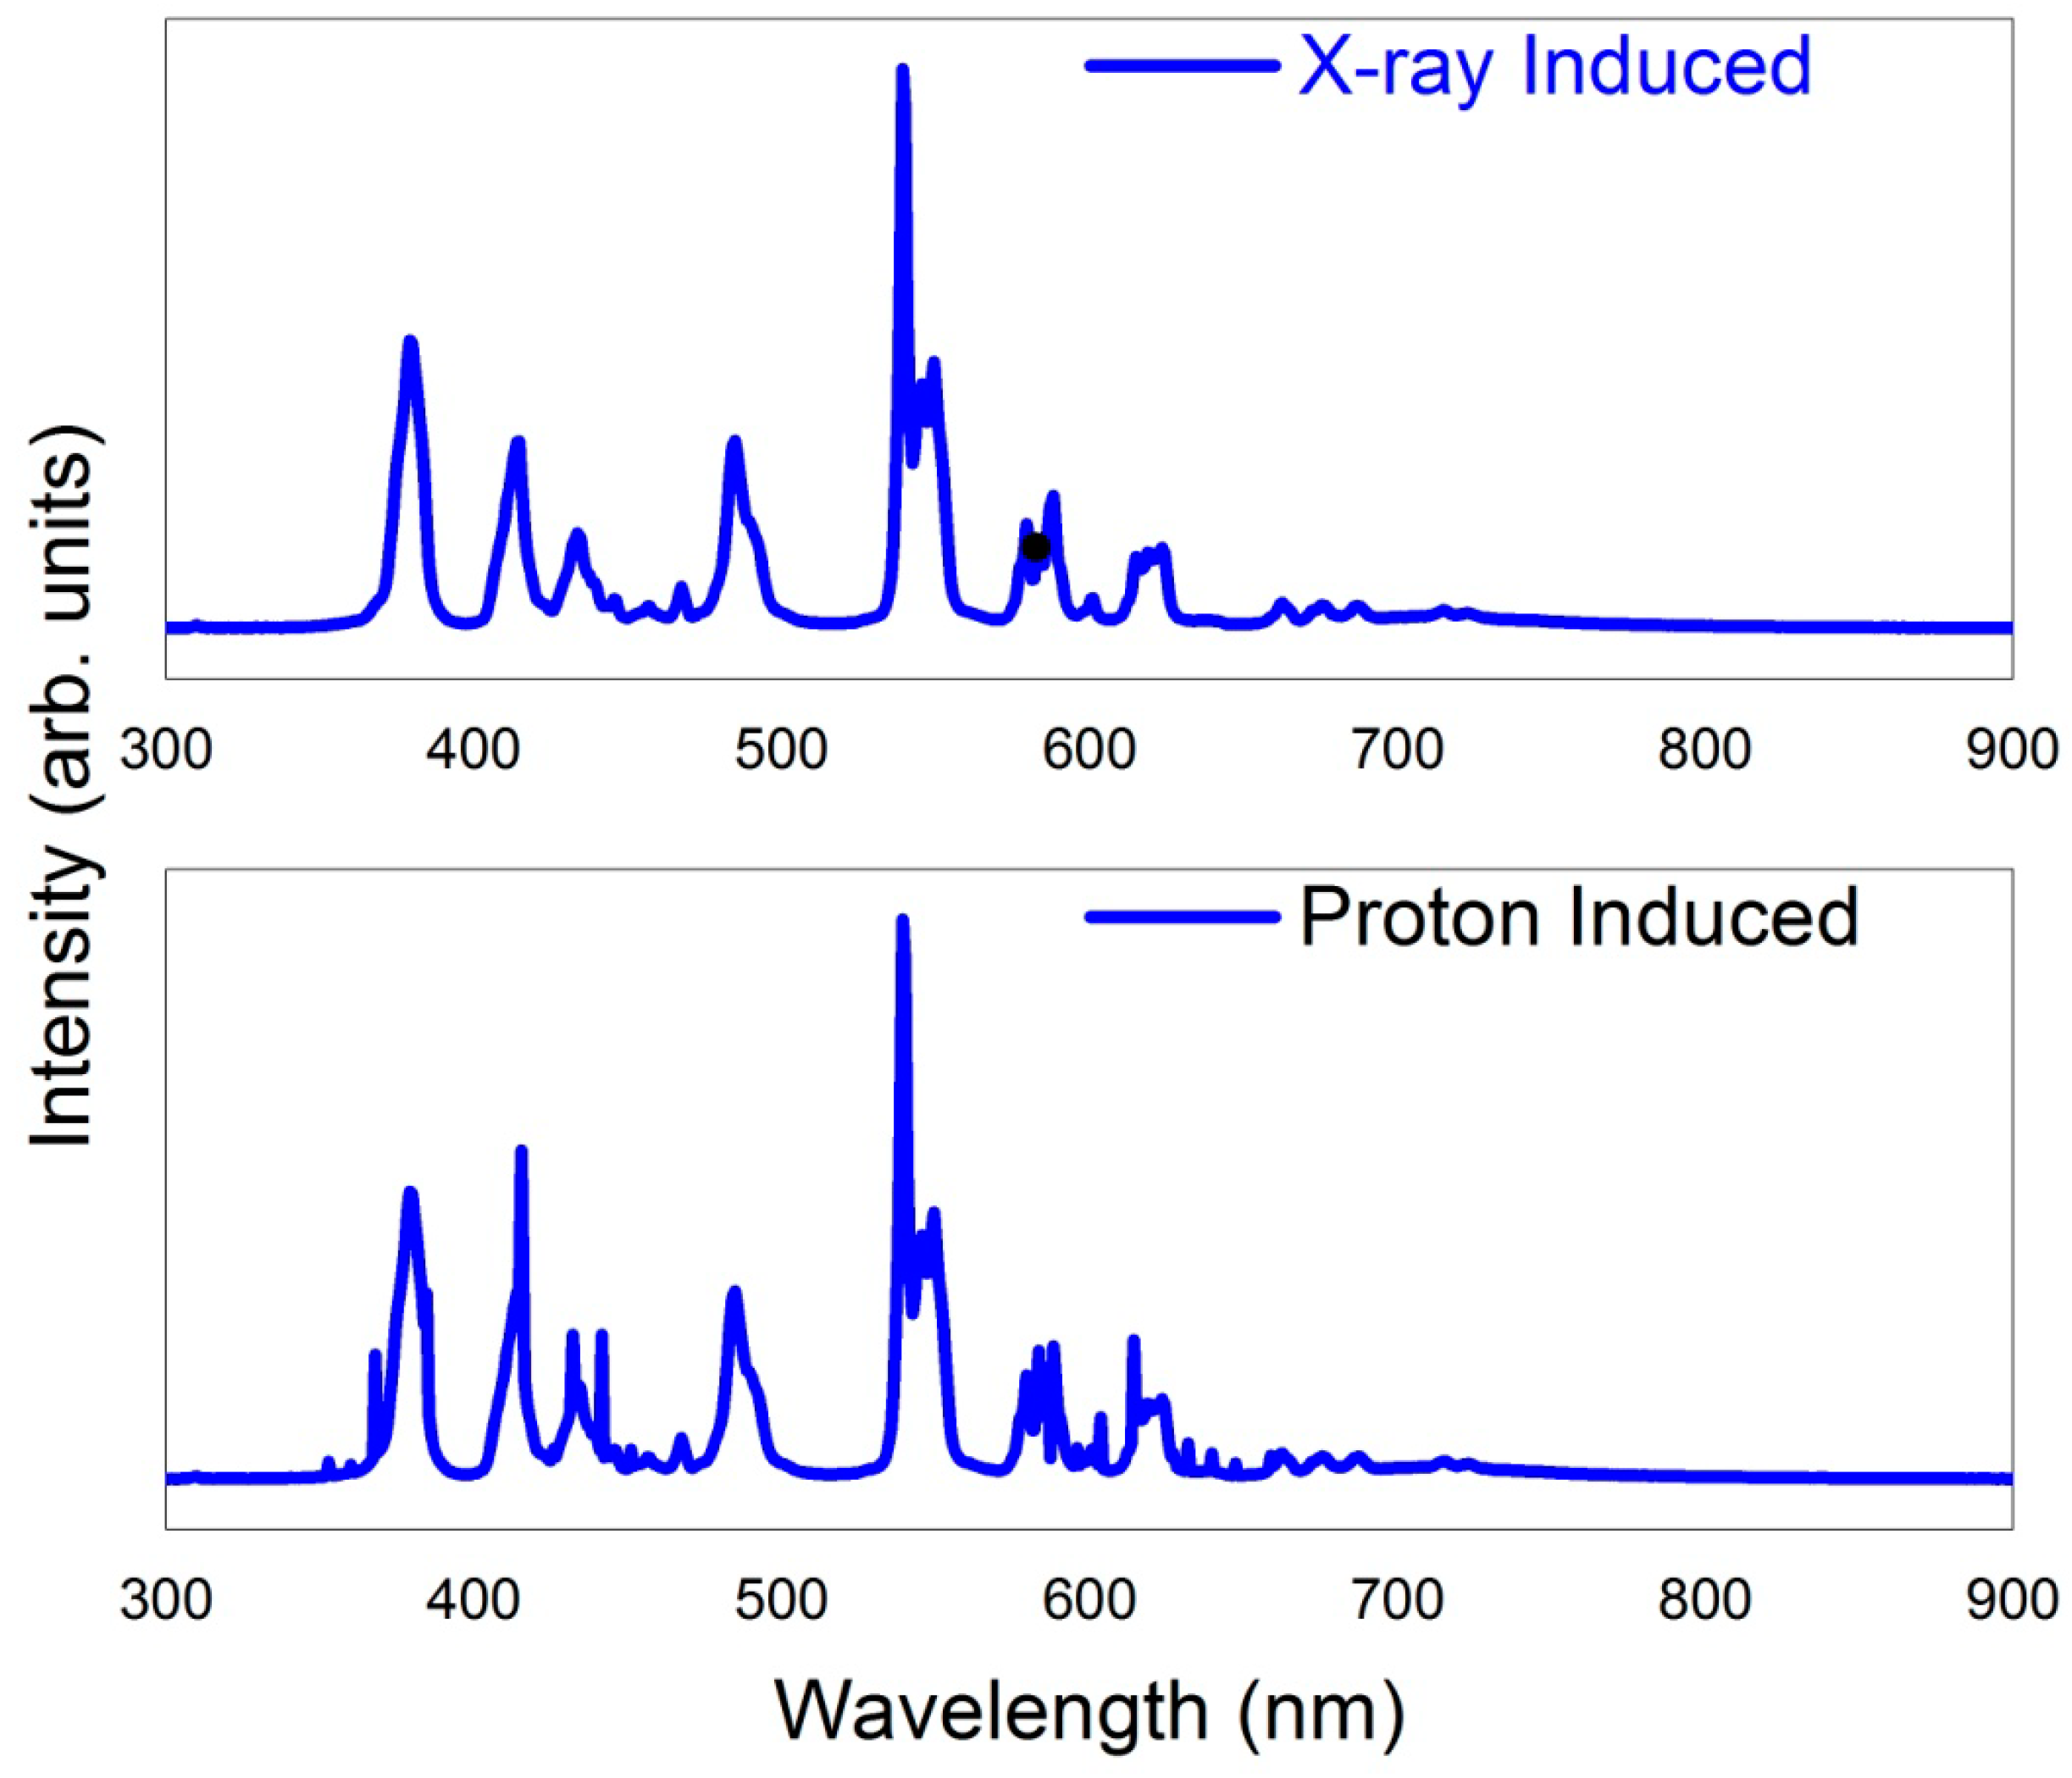
The synthesized LuGd2Ga2Al3O12:Tb3+ phosphor is excited by three major excitation sources. X-ray and proton induced emission spectra are shown in Figure 8 whereas UV-induced emission spectrum is shown in Figure 5. All three emission spectra are very similar and matches well with the literature [26,27]. This comparison shows that the emission properties do not depend on the excitation source.

4.7. Luminescence Efficiency

In order to investigate the luminescence efficacy of the synthesized phosphor, the emission spectra of LuGd2Ga2Al3O12:Tb3+ and commercially available plasma display panel (PDP) material (PDP:Gd2O2S:Tb3+) are compared in Figure 9. The light yields are obtained by integrating the area under the emission curves. All of the parameters, such as slit width, integrated time, beam intensity, and excitation wavelength are kept constant for comparison. This comparison reveals that the light yield of the synthesized phosphor is 81% of that of commercially available PDP phosphor. This encouraging result of luminescence efficacy suggests the potential application of this phosphor in the fields of PDPs and LEDs.

4.8. Decay Time Analysis

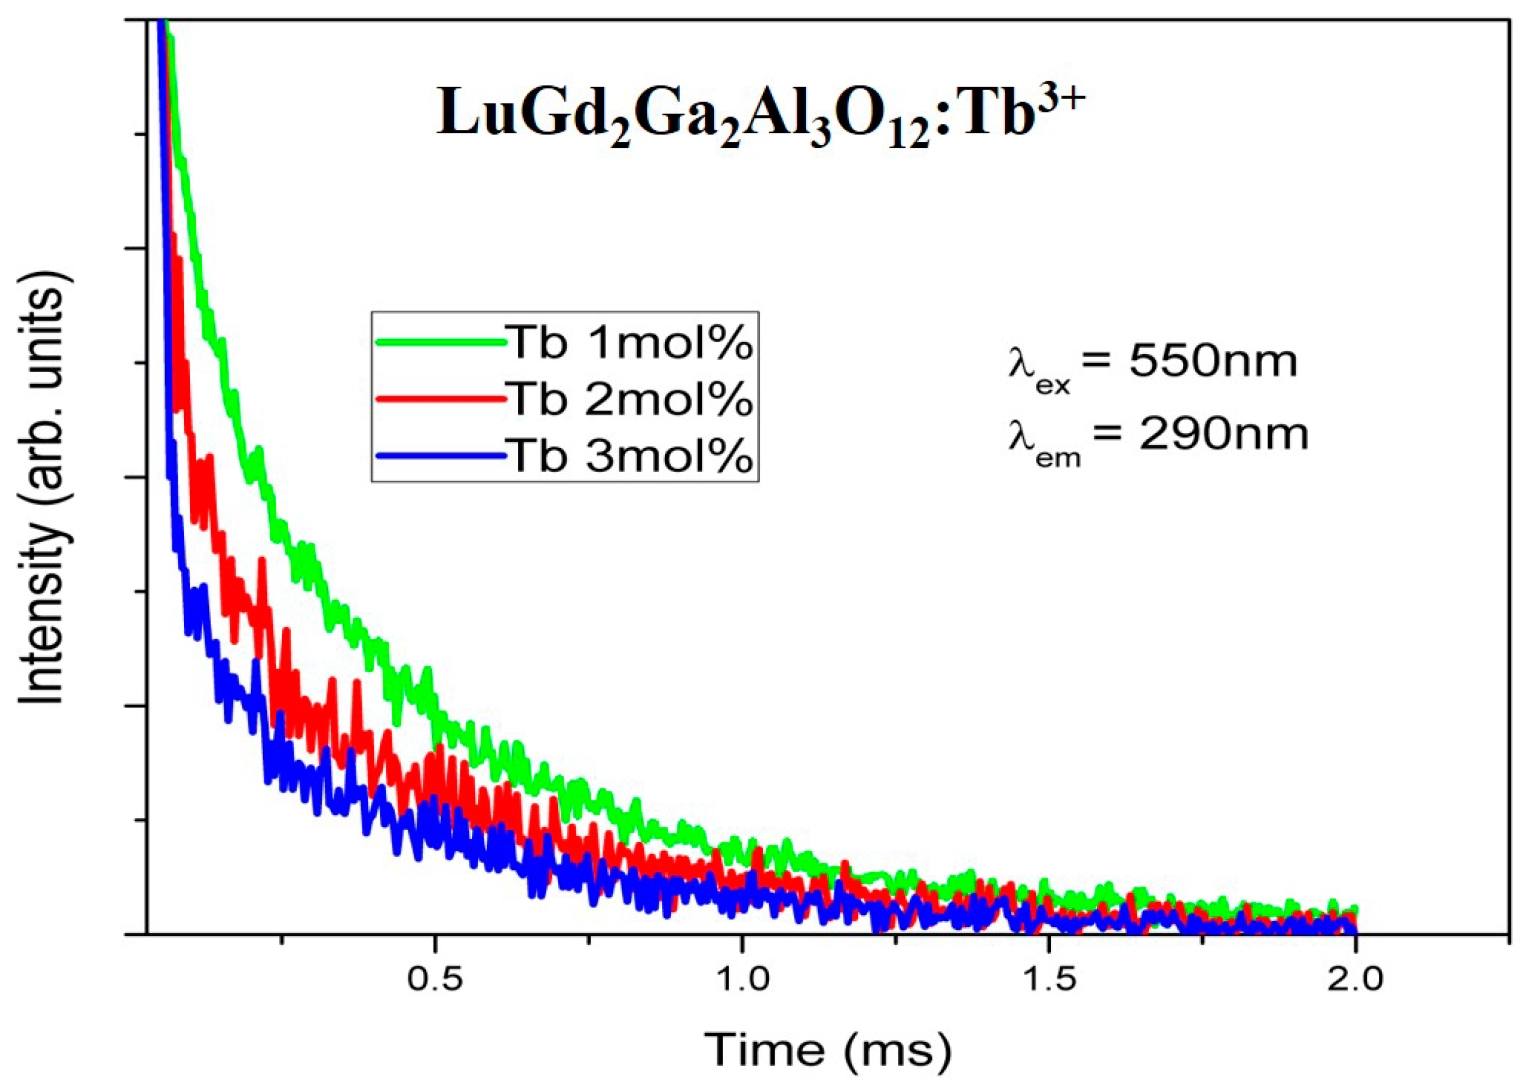
The decay time is obtained for LuGd2Ga2Al3O12 phosphors with different concentrations of Tb3+, shown in Figure 10. The decay measurement is done at emission wavelength (550 nm) and excitation wavelength (290 nm). All of the decay curves are fifit with single exponential decay equation.
I = Io exp(−t/τ)
In this equation, “A” stands for integrated area, I and Io represent intensities at times t and 0, respectively, and τ represents the decay time. The decay time becomes shorter with the increase of Tb3+ concentration. The decay time analysis is very handy in order to understand the energy transfer mechanism and luminescence quenching of Tb3+ ions. The investigation of these decay curves clarify that decay time gets shorter if Tb3+ concentration is decreased from 3 mol% to 1 mol% as mentioned in other articles [23,28]. In other words, we can say that beyond 3 mol% the concentration quenching starts, which in turn delays the emission process. The decay time measured for LuGd2Ga2Al3O12:Tb3+ (1 mol%) is to be between 2.80 ms and 2.90 ms.

4.9. Chromaticity

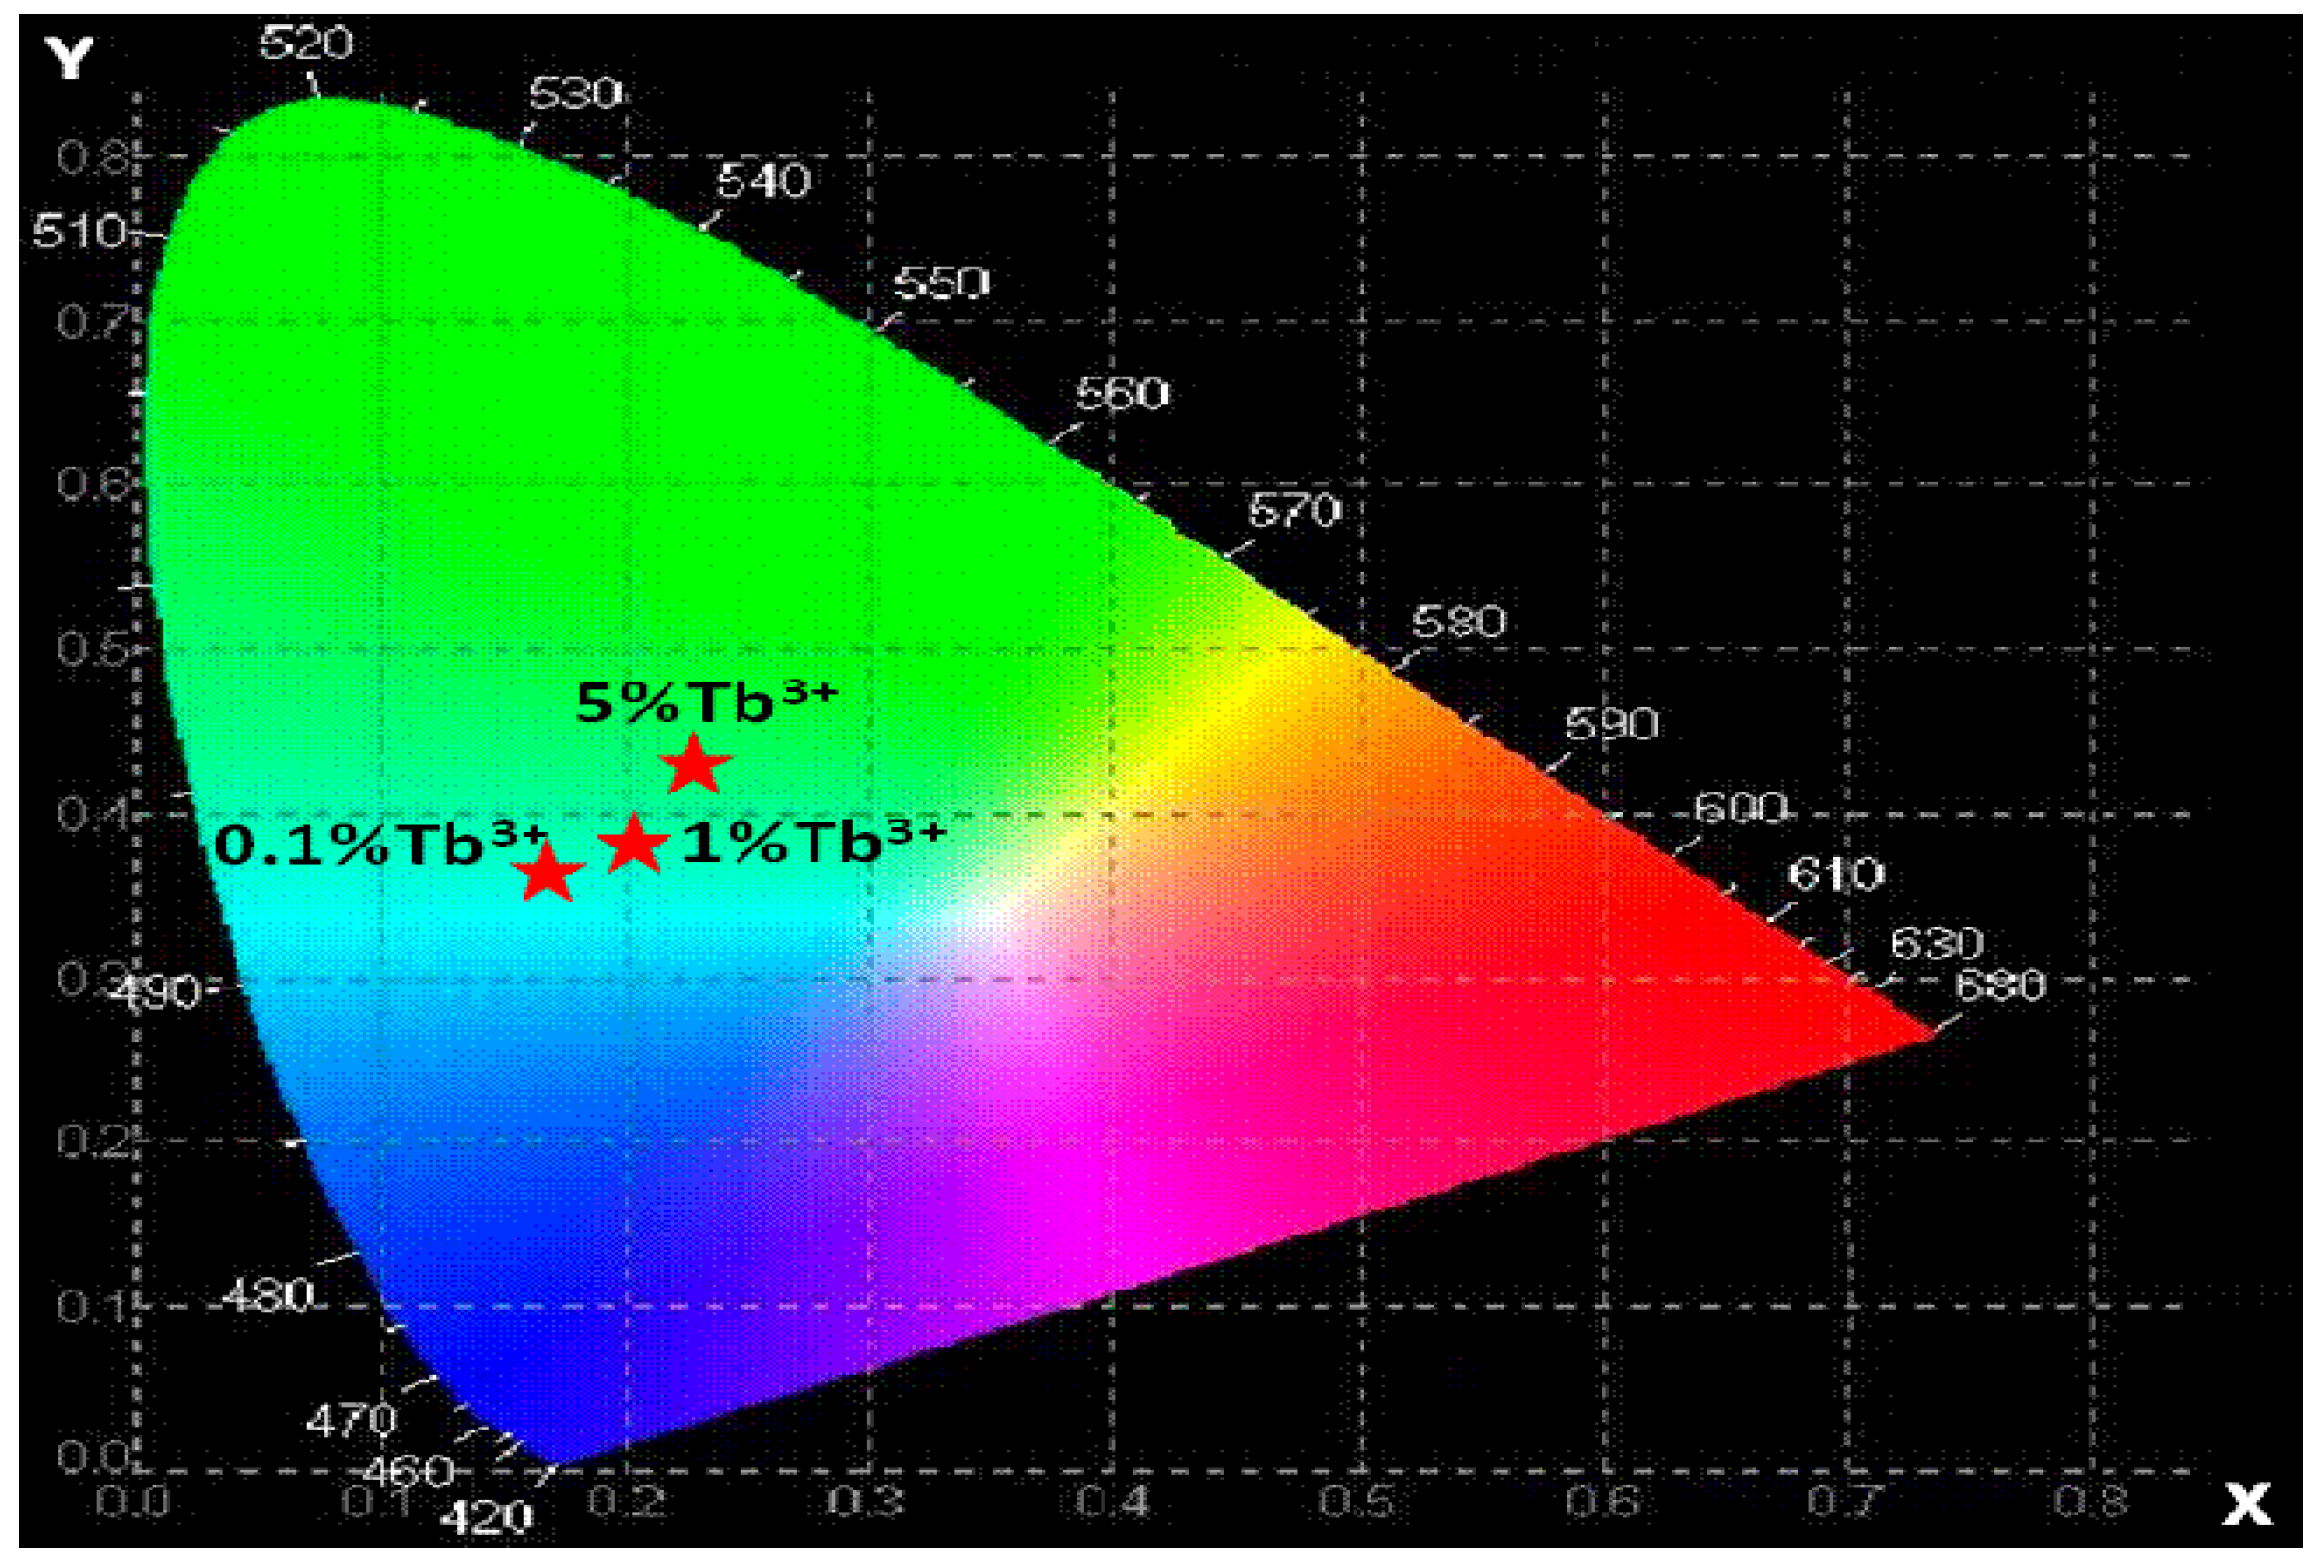
The Commission Internationale de l’Eclairage (CIE) 1931 chromaticity diagram of LuGd2Ga2Al3O12:Tb3+ is shown in Figure 11. Chromaticity is measured at three coordinates (x1 = 0.18, y1 = 0.38), (x2 = 0.2, y2 = 0.39), and (x3 = 0.22, y3 = 0.42) for LuGd2Ga2Al3O12 with 0.1 mol%, 1 mol%, and 5 mol% of Tb3+ concentrations, respectively. These values indicate that with the increase of Tb concentration from 0.1 mol% to 5 mol% of Tb3+ the bluish emission changes to greenish. This result matches well with the published materials [29].

5. Conclusions

The synthesized phosphor is investigated for its UV, X-ray, and proton induced luminescence. All three kinds of emission spectra are very similar, proving that excitation source has no effect on the emission spectrum. This phosphor shows major emission peaks in green color region and a peak in blue region as well. The green emission enhances at the cost of blue emission with the increase of Tb concentration. Absorption spectra of our material matches well with LEDs spectra; therefore, it may be used for LED applications. Grain size is in the micrometer range, having good luminescence, and may be utilized for X-ray imaging applications. The longer decay time of this phosphor is in milliseconds range, which is suitable for lighting applications. Chromaticity diagram confirms green emission, which is supported by UV and X-ray and proton-induced spectroscopy. X-ray luminescence suggests its applications in X-ray imaging.

Author Contributions

Conceptualization, U.F. and W.M.; methodology, H.J.K.; validation, U.F. and M.K.; formal analysis, U.F., S.T. and T.J.; investigation, U.F., H.J.K. and I.G.; resources, U.F., H.J.K.; original draft preparation, U.F., M.K. and I.G.; writing—review and editing, U.F., H.J.K., I.G., M.K., S.T., T.J. and W.M.; supervision, U.F., H.J.K., M.K.; project administration, U.F.; funding acquisition, W.M. All authors have read and agreed to the published version of the manuscript.

Funding

Research reported in this publication was supported by the Department of Physics of Florida Atlantic University under Start-up Funding. The content is solely the responsibility of the authors and does not necessarily represent the official views of the Florida Atlantic University.

Conflicts of Interest

The authors declare no conflict of interest.

References

  1. Tucureanu, V.; Matei, A.; Avram, A.M. Synthesis and characterization of YAG: Ce phosphors for white LEDs. Opto-Electron. Rev. 2015, 2323, 239–251. [Google Scholar]
  2. Dwivedi, J.; Kumar, P.; Kumar, A.; Singh, V.N.; Singh, B.P.; Dhawan, S.K.; Shanker, V.; Gupta, B.K. A commercial approach for the fabrication of bulk and nano phosphors converted into highly efficient white LEDs. RSC Adv. 2014, 4, 54936–54947. [Google Scholar] [CrossRef]
  3. Lin, S.; Zhao, X.S.; Li, Y.F. RGO-supported β-SiC nanoparticles by a facile solvothermal route and their enhanced adsorption and photocatalytic activity. Mater. Lett. 2014, 132, 380–383. [Google Scholar] [CrossRef]
  4. Zorenko, Y.; Gorbenko, V.; Konstankevych, I. Single-crystalline films of Ce-doped YAG and LuAG phosphors: Advantages over bulk crystals analogues. J. Lumin. 2005, 114, 85–94. [Google Scholar] [CrossRef]
  5. Park, K.; Kim, T.; Yu, Y. Y/Gd-free yellow Lu3Al5O12: Ce3+ phosphor for white LEDs. J. Lumin. 2016, 173, 159–164. [Google Scholar] [CrossRef]
  6. Xia, Y.; Huang, X.; Wu, W. Multicolor persistent luminescence realized by persistent color conversion. J. Lumin. 2019, 207, 53–57. [Google Scholar] [CrossRef]
  7. Sankar, R. Efficient green luminescence in Tb3+-activated borates, A6MM′(BO3)6. Opt. Mater. 2008, 31, 268–275. [Google Scholar] [CrossRef]
  8. Lee, T.J.; Luo, L.Y.; Diau, E.W.G. Visible quantum cutting through downconversion in green-emitting K2GdF5: Tb3+ phosphors. Appl. Phys. Lett. 2006, 89, 131121. [Google Scholar] [CrossRef] [Green Version]
  9. Luchechko, A.; Kostyk, L.; Varvarenko, S. Green-Emitting Gd3Ga5O12: Tb3+ Nanoparticles Phosphor: Synthesis, Structure, and Luminescence. Nanoscale Res. Lett. 2017, 12, 263. [Google Scholar] [CrossRef] [Green Version]
  10. Li, G.; Cao, Q.; Li, Z. Photoluminescence properties of YAG: Tb nano-powders under vacuum ultraviolet excitation. J. Alloys Compd. 2009, 485, 561–564. [Google Scholar] [CrossRef]
  11. Jain, A.; González, C.A.E.; Tejeda, E.M. Covering the optical spectrum through different rare-earth ion-doping of YAG nanospheres produced by rapid microwave synthesis. Ceram. Int. 2018, 44, 1886–1893. [Google Scholar] [CrossRef]
  12. Wang, Z.; Zou, J.; Zhang, C. Facile fabrication and luminescence characteristics of a mixture of phosphors (LuAG: Ce and CaAlSiN3: Eu) in glass for white LED. J. Non-Cryst. Solids 2018, 489, 57–63. [Google Scholar] [CrossRef]
  13. Van Krevel, J.W.H.; Hintzen, H.T.; Metselaar, R. Long wavelength Ce3+ emission in Y–Si–O–N materials. J. Alloys Compd. 1998, 268, 272–277. [Google Scholar] [CrossRef]
  14. Ozuna, O.; Hirata, G.A.; McKittrick, J. Luminescence enhancement in Eu3+-doped α-and γ-Al2O3 produced by pressure-assisted low-temperature combustion synthesis. Appl. Phys. Lett. 2004, 84, 1296–1298. [Google Scholar] [CrossRef] [Green Version]
  15. Kang, S.J.; Kim, H.J.; Hwang, Y.S. Two-dimensional beam profile monitoring by using a LYSO crystal. J. Korean Phys. Soc. 2010, 56, 2118–2121. [Google Scholar]
  16. Dorset, D.L. X-ray diffraction: A practical approach. Microsc. Microanal. 1998, 4, 513–515. [Google Scholar] [CrossRef]
  17. Zheng, Y.; Chen, C.; Zhan, Y. Luminescence and photocatalytic activity of ZnO nanocrystals: Correlation between structure and property. Inorg. Chem. 2007, 46, 6675–6682. [Google Scholar] [CrossRef]
  18. Bi, C.; Wang, Q.; Shao, Y. Non-wetting surface-driven high-aspect-ratio crystalline grain growth for efficient hybrid perovskite solar cells. Nat. Commun. 2015, 6, 1–7. [Google Scholar] [CrossRef]
  19. Rao, B.V.; Buddhudu, S. Emission analysis of RE3+ (Dy3+ or Tb3+): Ca3Ln (Y,Gd)(VO4)3 powder phosphors. Mater. Chem. Phys. 2008, 111, 65–68. [Google Scholar]
  20. Thakur, J.; Dutta, D.P.; Bagla, H. Effect of host structure and concentration on the luminescence of Eu3+ and Tb3+ in borate phosphors. J. Am. Ceram. Soc. 2012, 95, 696–704. [Google Scholar] [CrossRef]
  21. Fawad, U.; Oh, M.; Park, H. Luminescent investigations of Li6Lu (BO3)3: Tb3+, Dy3+ phosphors. J. Alloys Compd. 2014, 610, 281–287. [Google Scholar] [CrossRef]
  22. Manohara, B.M.; Nagabhushana, H.; Sunitha, D.V. Synthesis and luminescent properties of Tb3+ activated cadmium silicate nanophosphor. J. Alloys Compd. 2014, 592, 319–327. [Google Scholar] [CrossRef]
  23. Linganna, K.; Ju, S.; Basavapoornima, C. Luminescence and decay characteristics of Tb3+-doped fluorophosphate glasses. J. Asian Ceram. Soc. 2018, 6, 82–87. [Google Scholar] [CrossRef] [Green Version]
  24. Fawad, U.; Kim, H.J.; Khan, A. X-ray and Photoluminescence Study of Li6Gd (BO3)3: Tb3+, Dy3+ Phosphors. Sci. Adv. Mater. 2015, 7, 2536–2544. [Google Scholar] [CrossRef]
  25. Xu, Z.; Li, Y.; Liu, Z. UV and X-ray excited luminescence of Tb3+-doped ZnGa2O4 phosphors. J. Alloys Compd. 2005, 391, 202–205. [Google Scholar] [CrossRef]
  26. Lin, C.C.; Chen, W.T.; Chu, C.I. UV/VUV switch-driven color-reversal effect for Tb-activated phosphors. Light Sci. Appl. 2016, 5, e16066. [Google Scholar] [CrossRef] [Green Version]
  27. Zhang, B.; Zhang, J.; Guo, Y. Synthesis and photoluminescence of double perovskite La2LiSbO6: Ln3+ (Ln = Eu, Tb, Tm, Sm, Ho) phosphors and enhanced luminescence of La2LiSbO6: Eu3+ red phosphor via Bi3+ doping for white light emitting diodes. J. Alloys Compd. 2019, 787, 1163–1172. [Google Scholar] [CrossRef]
  28. Cheng, S.D.; Kam, C.H.; Buddhudu, S. Enhancement of green emission from Tb3+: GdOBr phosphors with Ce3+ ion co-doping. Mater. Res. Bull. 2001, 36, 1131–1137. [Google Scholar] [CrossRef]
  29. Liu, X.; Yan, L.; Zou, J. Tunable cathodoluminescence properties of Tb3+-doped La2O3 nanocrystalline phosphors. J. Electrochem. Soc. 2009, 157, P1. [Google Scholar] [CrossRef]
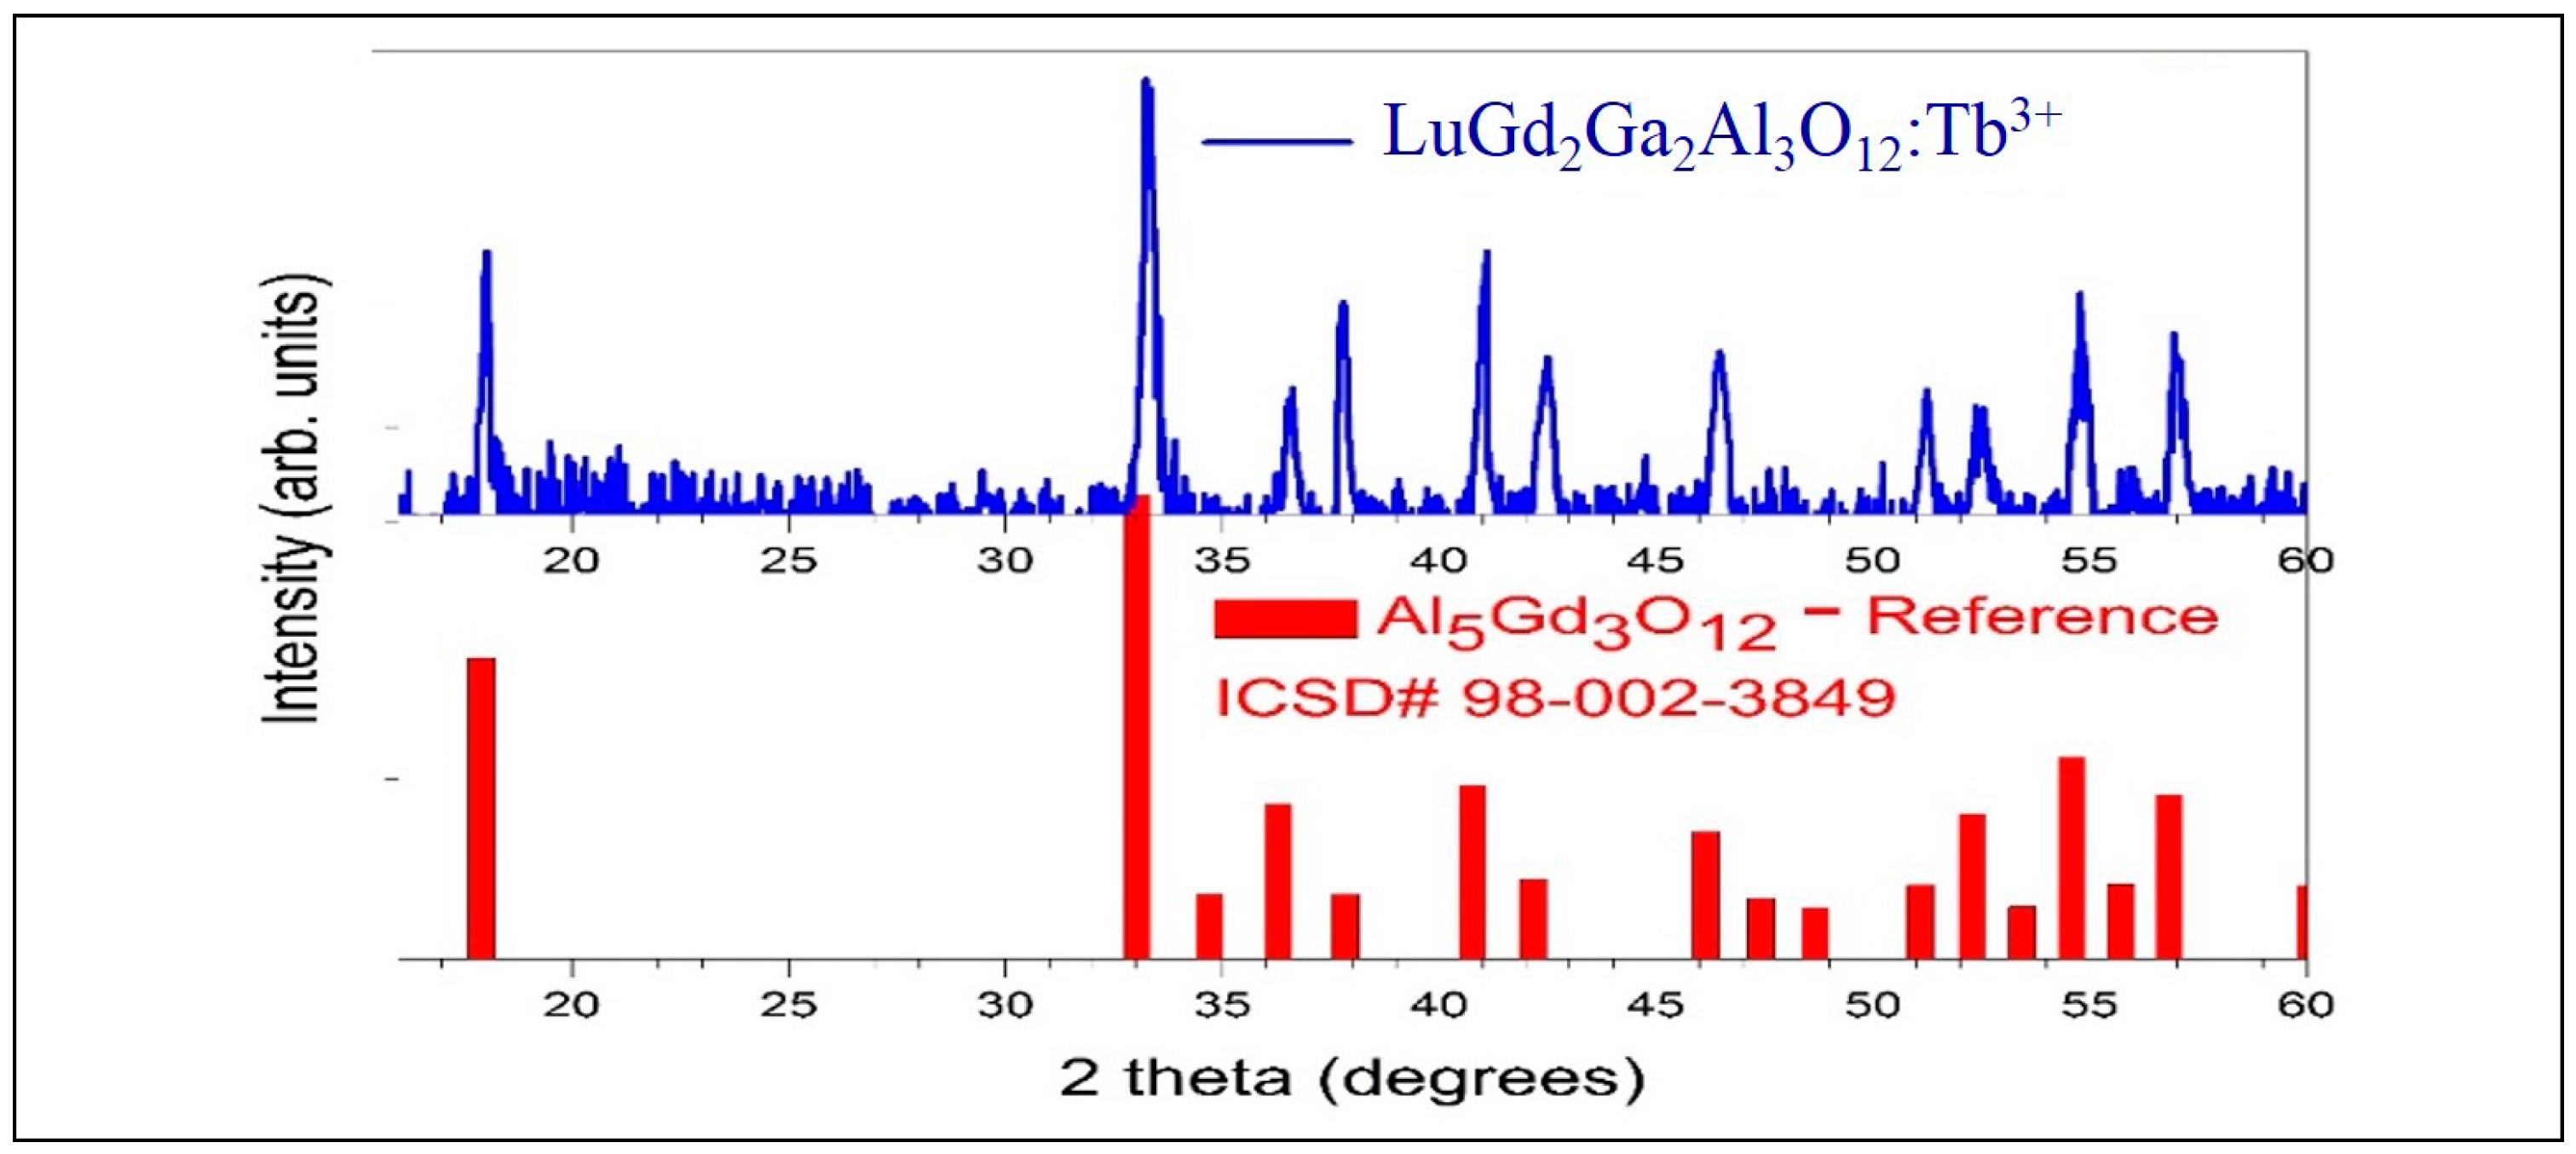
Figure 1. XRD peaks of LuGd2Ga2Al3O12:Tb3+ phosphor and reference peaks of Al5Gd3O12.
Crystals 10 00844 g001
Figure 2. SEM Micrographs of (a) LuGd2Ga2Al3O12:Tb3+ (5 mol%), (b) LuGd2Ga2Al3O12:Tb3+ (1 mol%).
Crystals 10 00844 g002
Figure 3. Energy level diagram for Tb3+.
Crystals 10 00844 g003
Figure 4. Excitation and Emission spectra of LuGd2Ga2Al3O12:Tb3+ phosphor by UV light.
Crystals 10 00844 g004
Figure 5. UV induced emission peaks of LuGd2Ga2Al3O12:Tb3+ phosphor.
Crystals 10 00844 g005
Figure 6. X-ray induced Emission spectra of LuGd2Ga2Al3O12:Tb3+ phosphor.
Crystals 10 00844 g006
Figure 7. Optimization of Tb3+ concentrations in LuGd2Ga2Al3O12 host.
Crystals 10 00844 g007
Figure 8. X-ray and proton-induced emission spectra of LuGd2Ga2Al3O12:Tb3+.
Crystals 10 00844 g008
Figure 9. X-ray induced emission spectra of LuGd2Ga2Al3O12:Tb3+ and plasma display panel (PDP) (Gd2O2S:Tb3+).
Crystals 10 00844 g009
Figure 10. Decay time graph of LuGd2Ga2Al3O12:Tb3+.
Crystals 10 00844 g010
Figure 11. Chromaticity diagram of LuGd2Ga2Al3O12:Tb3+ phosphors.
Crystals 10 00844 g011