1. Introduction
Thermonuclear fusion is a one non-carbon emitting promising source of energy, but remains one of the most challenging, as plasma has to be confined magnetically. Any imperfections can lead to high heat fluxes over the main wall [
1]. Pure tungsten grades have proved their ability to resist to such high heat fluxes. Nevertheless, repeated thermal cycles at high temperatures (up to 1800 °C) can lead to a detrimental loss of mechanical properties [
2] due to the thermally activated restoration process known as primary recrystallization [
3]. First, the ductile to brittle transition temperature (DBTT) of tungsten is shifted to higher temperatures (embrittlement issues). Second, the yield stress is lowered, which promotes plastic flow during thermal fatigue cycles. A drastic reduction of the number of cycles to failure is observed. The development of methodologies to measure/predict recrystallization kinetics of tungsten is therefore of primary importance for thermonuclear fusion [
4]. Similar issues are encountered in any applications involving high heat flux (high temperature furnaces, lighting, thin film deposition, turbines, etc.).
The rate of recrystallization is affected by the annealing temperature and the initial strain—i.e., initial microstructural state—that is a direct consequence of processing. The recrystallization temperature of pure tungsten for 3600 s annealing has been reported to be in the range 1100–1500 °C [
2,
4,
5]. It is necessary to measure the recrystallization kinetics in a temperature range closer to thermonuclear fusion applications though, which can only be done using a specific annealing set-up [
6,
7]. Nevertheless, this type of device can only process one sample at a time. The number of samples to investigate the recrystallization kinetics at a given temperature is therefore limited. The latter is mostly measured through the recrystallization-induced softening using post-mortem hardness tests. However, primary recrystallization competes with static recovery, a thermally-activated restoration process that is also driven by the stored energy of the deformed state. That makes it difficult to discriminate those two mechanisms with hardness tests [
3]. The hardness test remains an overall measurement of sample mechanical properties. To overcome such an issue, electron back-scatter diffraction (EBSD) is often employed to separate former grains that soften through static recovery from recrystallized grains [
8,
9]. The orientation distribution within a grain is used to segment the recrystallized grain through the use of suitable metrics [
10,
11].
An alternative mechanical approach would be to independently probe each grain of a microstructure to determine whether it is recrystallized or recovered. Such measurements are offered by nanoindentation testing, which permits one to measure mechanical properties over a volume of a few µm
3 or even less [
12,
13]. Zayachuk et al. [
14] clearly highlighted that nanoindentation helped to discriminate whether a tungsten grain is recrystallized or not. Hardness and pile-up heights are shown to be lower in recrystallized grains than in deformed ones. Such individual measurements are, however, time-consuming and poorly selective when determining whether a fraction is recrystallized. The statistical nanoindentation theory that replaces the analysis of individual indents with the analysis of a large set of indents might overcome this issue. It has been successfully used to measure fractions of phases in materials [
15]. The main assumption is that hardness distribution of a given phase does not overlap hardness distributions of the others [
16]. The variance of hardness distribution of a given phase is related to the self phase heterogeneity, i.e., crystal orientation, dislocation density, defects, etc. In this paper it is proposed to examine whether or not this kind of measurement can be done to measure the recrystallized or recovered fractions of rolled tungsten samples.
The first part of this paper deals with the adaptation of statistical nanoindentation theory to the measurement of fraction recrystallized and recovery parameters. The different set-ups used are then described. More precisely, two tungsten materials with different initial microstructures are compared. Results are presented in terms of hardness distribution versus annealing time and temperature. They are then post-treated to extract the fraction recrystallized and the mean hardness of the remaining recovered structure. These results are then discussed to highlight the advantages and also the limits of the new methodology to investigate recrystallization/recovery phenomena at high temperatures.
3. Materials and Methods
Samples were extracted from the middle of a tungsten plate of commercial purity complying with ITER specifications. They were annealed through a laser heating system described in Ref [
7]. This device allows the annealing of samples at up to 3000 °C, with fast heating rates. Samples were annealed at different temperatures in the range 1450 to 1600 °C for different annealing times (from 50 to 3600 s). The heating rate was set to 200 °C/s so that the time to reach 1600 °C was 8 s. At such a rate the heating time may be neglected in the estimation of the annealing time. The fully recrystallized state was achieved using an annealing treatment at 1800 °C during 600 s. Only one sample per annealing treatment was available for statistical nanoindentation analysis.
Nano-indentation grids (13 × 13) were used with a nanoindenter XP (Keysight Technologies, Santa Rosa, CA, USA) with a Berkovich diamond tip. The indentation set-up was load-controlled with a maximum force of 450 mN. Samples were mounted and polished using abrasive grits of decreasing sizes down to a final polishing step using a 1 µm diamond solution. The load was applied using the dynamic method known as continuous stiffness measurement (CSM) to continuously measure hardness versus penetration depth [
12]. The indenter was calibrated using a standard fused silica specimen. Hardness
H was computed using the Loubet’s method [
13]. Average hardness was extracted over a penetration depth range that avoids indentation size effect issues [
25]. The space between indents was set to 50 µm along x and y axes, as shown in
Figure 1. An average of the two grids performed for a given sample was used to determine the probability density function. These distributions were derived from histograms computed with 13 bins, i.e., square root of the number of data points. Each bin width was chosen according to the difference between hardness minimum and maximum values. It is worth noting that some indents may be located near grain boundaries, resulting in an artificially higher hardness than in the grain core. In such a case, the self-similarity of the indentation test is not respected. These indents were identified a posteriori and were not considered in the further statistical nanoindentation analysis [
15].
Microstructural analyses were performed using electron back-scattering diffraction (EBSD) in a scanning electron microscope (JEOL FEG 6500F). EBSD data were processed using the MATLAB toolbox MTEX [
26]. A grain was considered as a region surrounded by high angle boundaries greater than 15°. The low angle boundaries were set as 2–15° [
2,
6]. Subgrains within a grain and intragrain misorientation are the signature of the stored energy due to the prior deformation process. The orientation distribution within a grain can be used to segment the recrystallized grain through the use of suitable metrics, such as the grain orientation spread (GOS) [
10,
11]. It is proposed here to use the GOS approach with a threshold value of 2° to separate the recrystallized grains from the unrecrystallized ones [
27]. It is worth noting that quantifying accurately the fraction recrystallized using EBSD measurements is still a matter of debate [
28].
4. Results and Discussion
Initial state and fully recrystallized state hardness probability density functions are plotted in
Figure 2. Initial state mean hardness
was about 5.4 GPa with a standard deviation of 0.25 GPa, whereas fully recrystallized state mean hardness
was about 4.6 GPa with a standard deviation of 0.2 GPa. A small overlap between the two probability density functions may be pointed out, which means that the fraction recrystallized was likely non-zero for the initial state. It was actually estimated to be about 2–3%. On the contrary, the solution of the softening fraction through Equation (
2) is obviously zero. The fully recrystallized state hardness distribution was fitted using the Gaussian function described in Equation (
4). A small deviation with a perfect Gaussian function is observable, which would lead to estimating a fraction recrystallized lower than 100% from Equation (
6). It was actually estimated to be about 90%. Consequently, a fraction recrystallized lower than 3% (resp higher than 90%) is not considered hereafter.
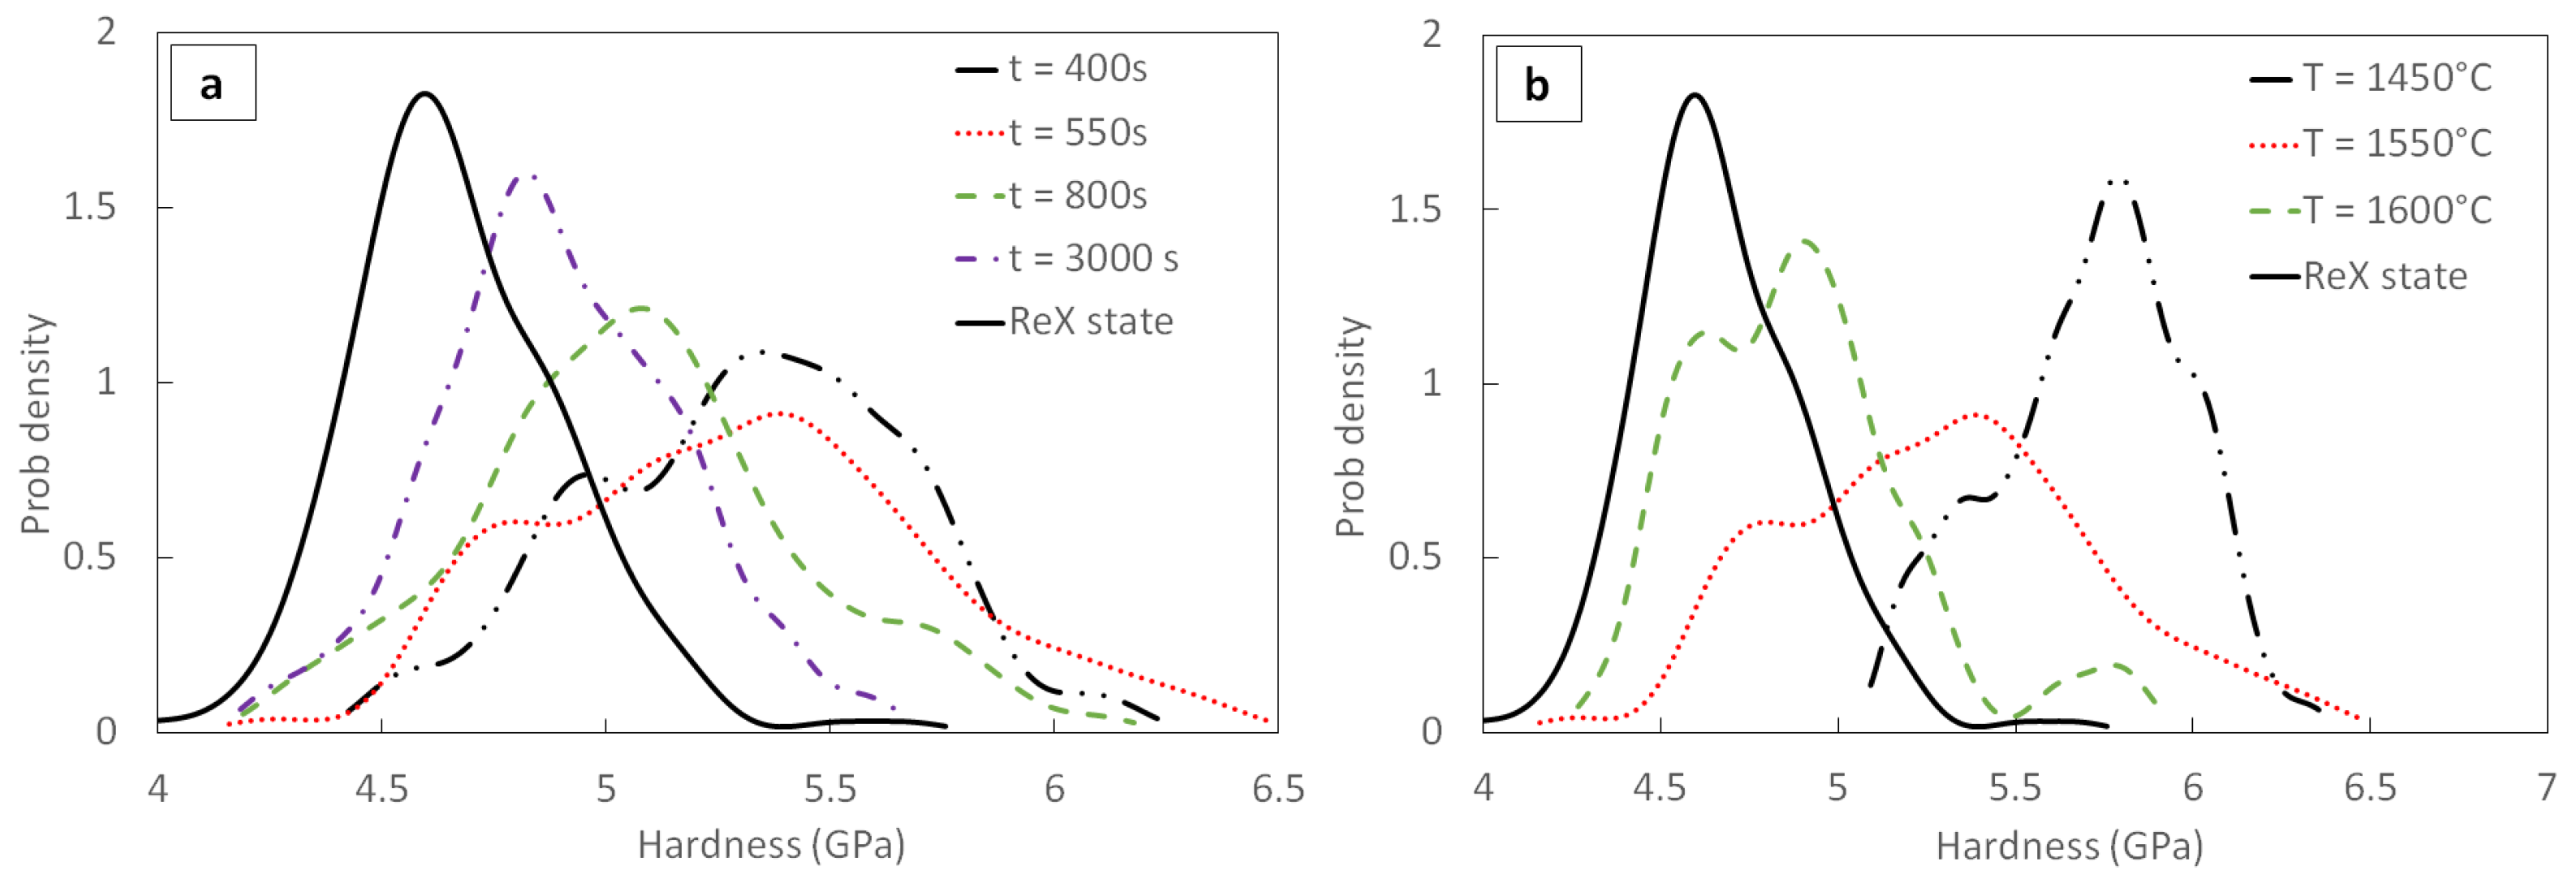
Effects of annealing time and temperature on hardness distribution are shown in
Figure 3. The curves are shifted significantly to the left for increasing annealing time and/or temperature. The frequency distribution tends to have a higher standard deviation and thus wider distribution plots compared to the fully recrystallized plots. However, the set of data is clearly not rich enough regarding microstructure heterogeneity to permit a quantitative analysis of the upper distribution tail. Therefore, results will be mostly analyzed hereafter from the mean values of the measured distributions. In that sense, the mean hardness is used to compute the softening fraction
using Equation (
2). Let us recall here that the softening fraction differs from the fraction recrystallized, since the recovery-induced softening is accounted for.
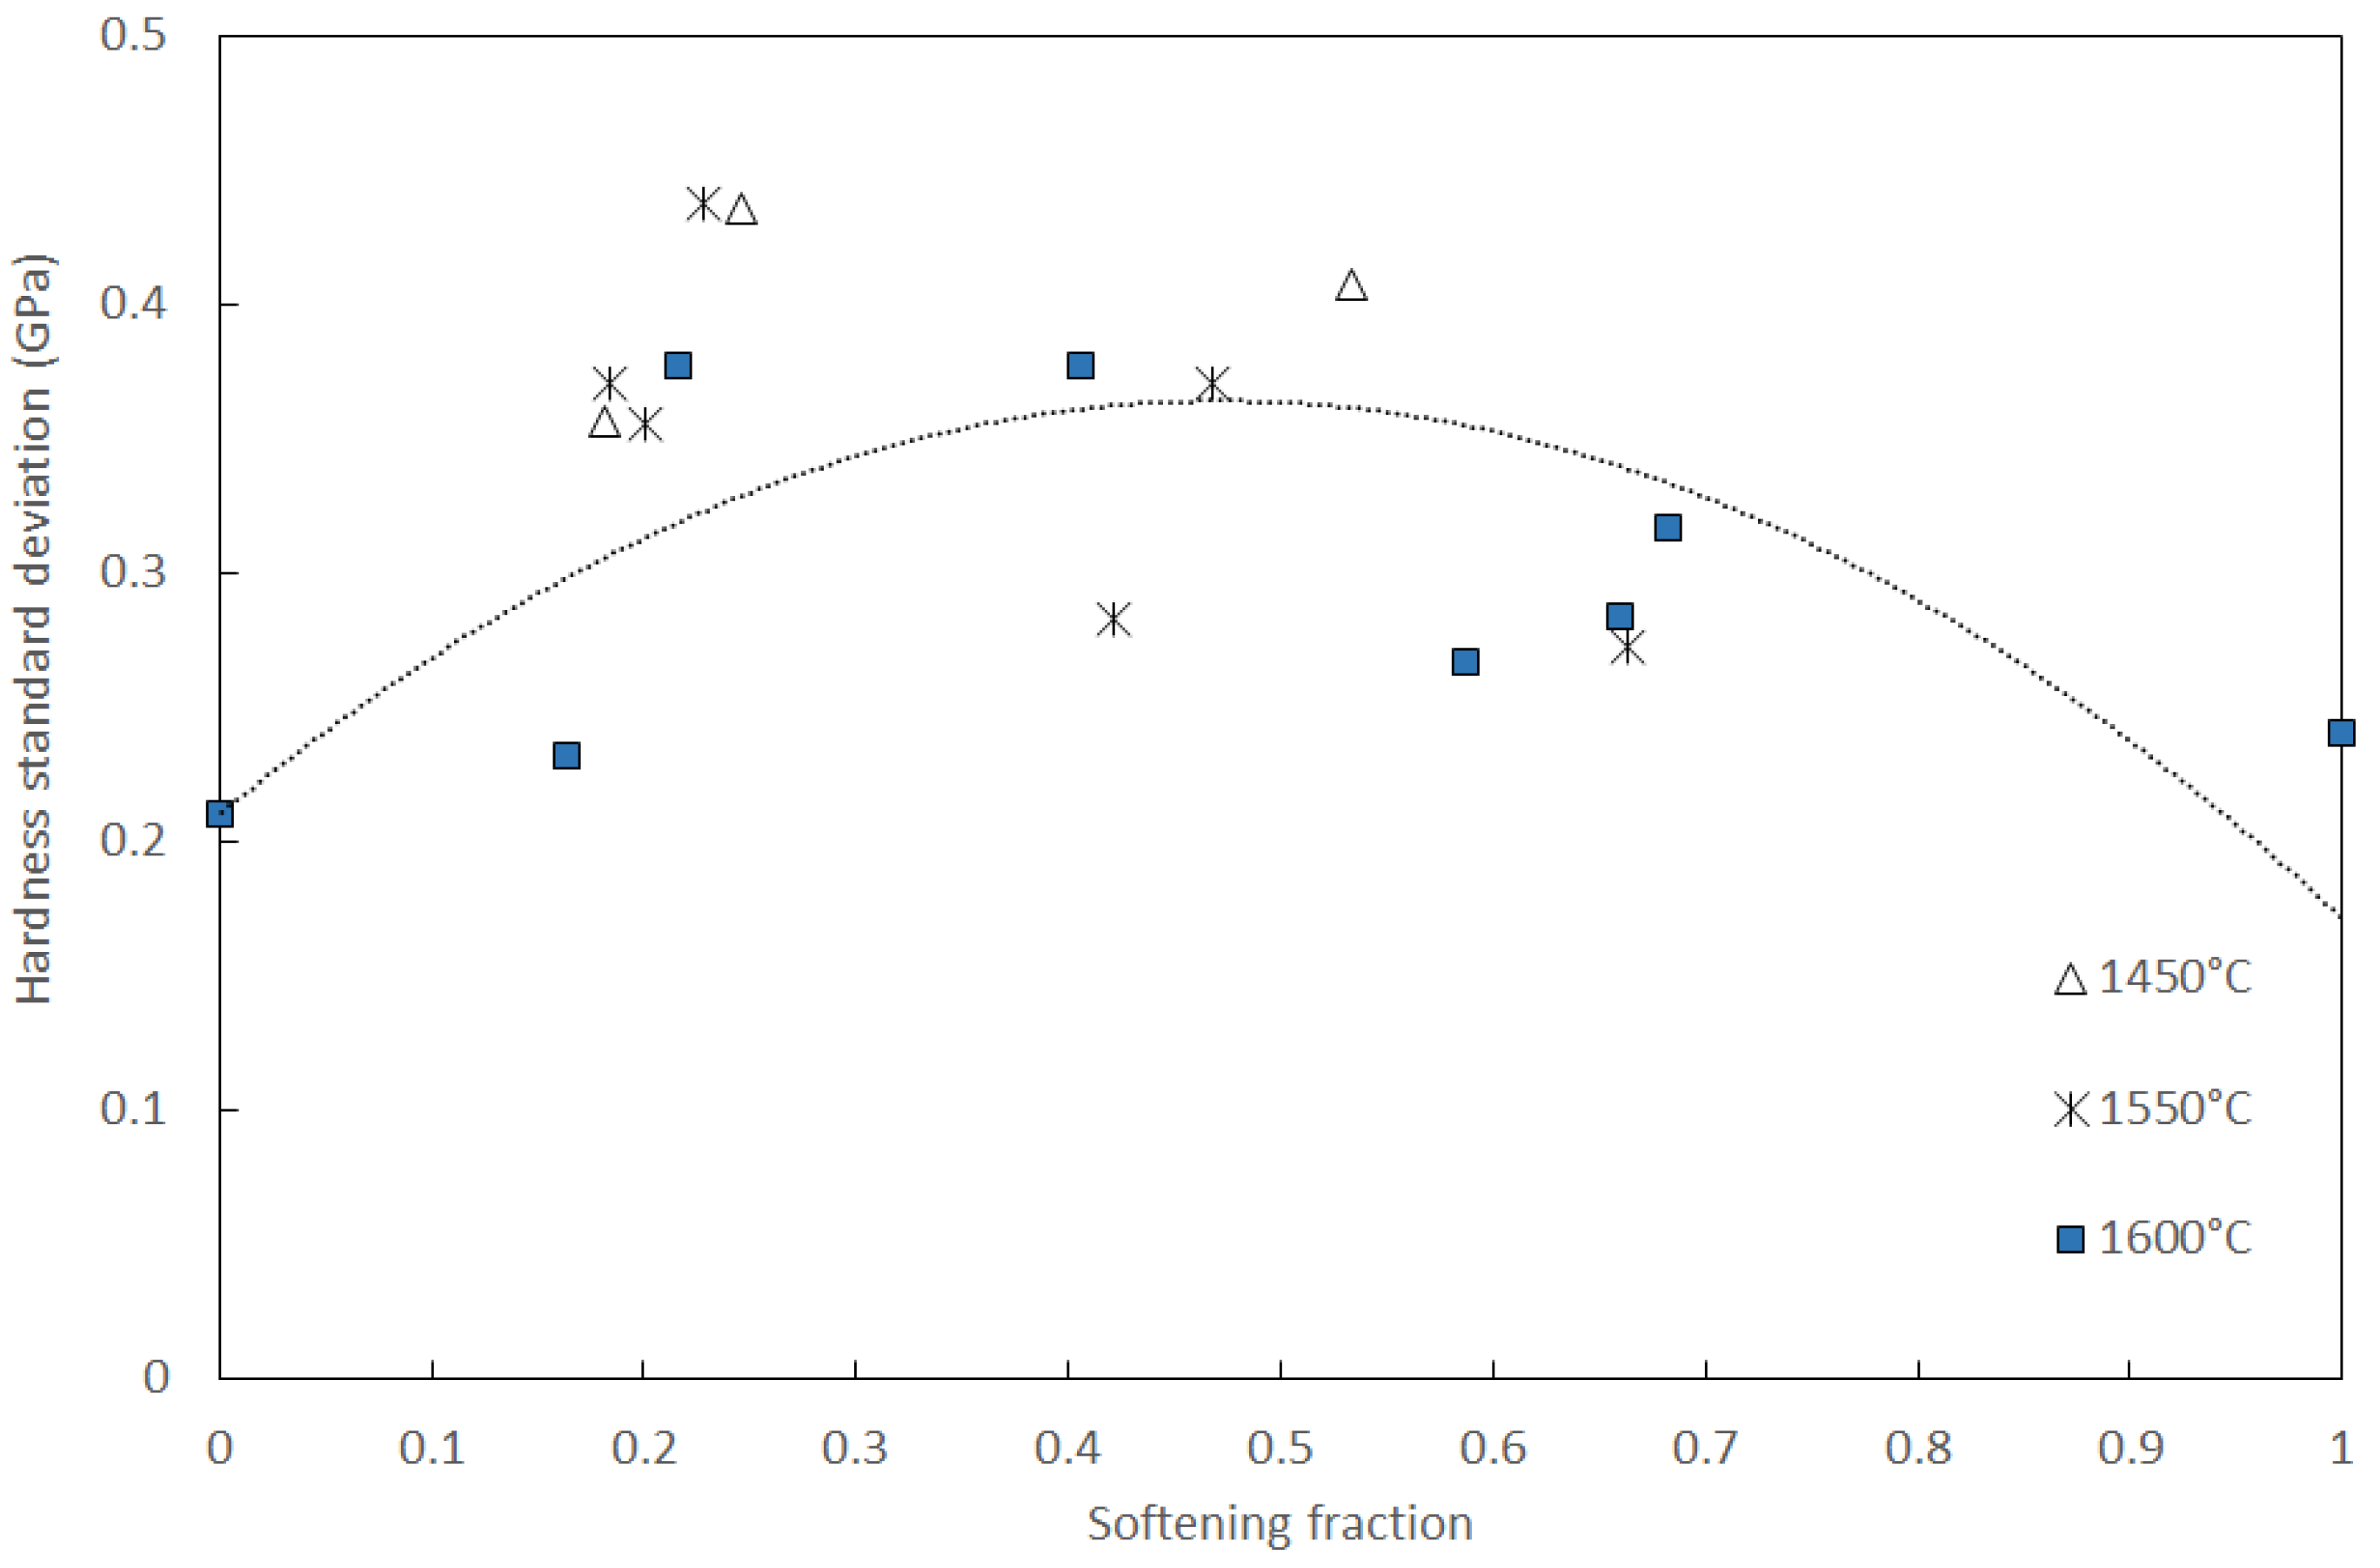
Figure 4 shows the hardness standard deviation versus the softening fraction. The standard deviation is maximum when the softening fraction approaches 50% and is minimum both for the initial state and the fully recrystallized state. It is worth noting that the trend is the same whatever the annealing temperature. The standard deviation reflects somehow the microstructure heterogeneity. Consequently hardness standard deviation may appear as a signature of recrystallization/recovery mechanisms [
29]. However, the variation remains too low to make it useful for a quantification purpose.
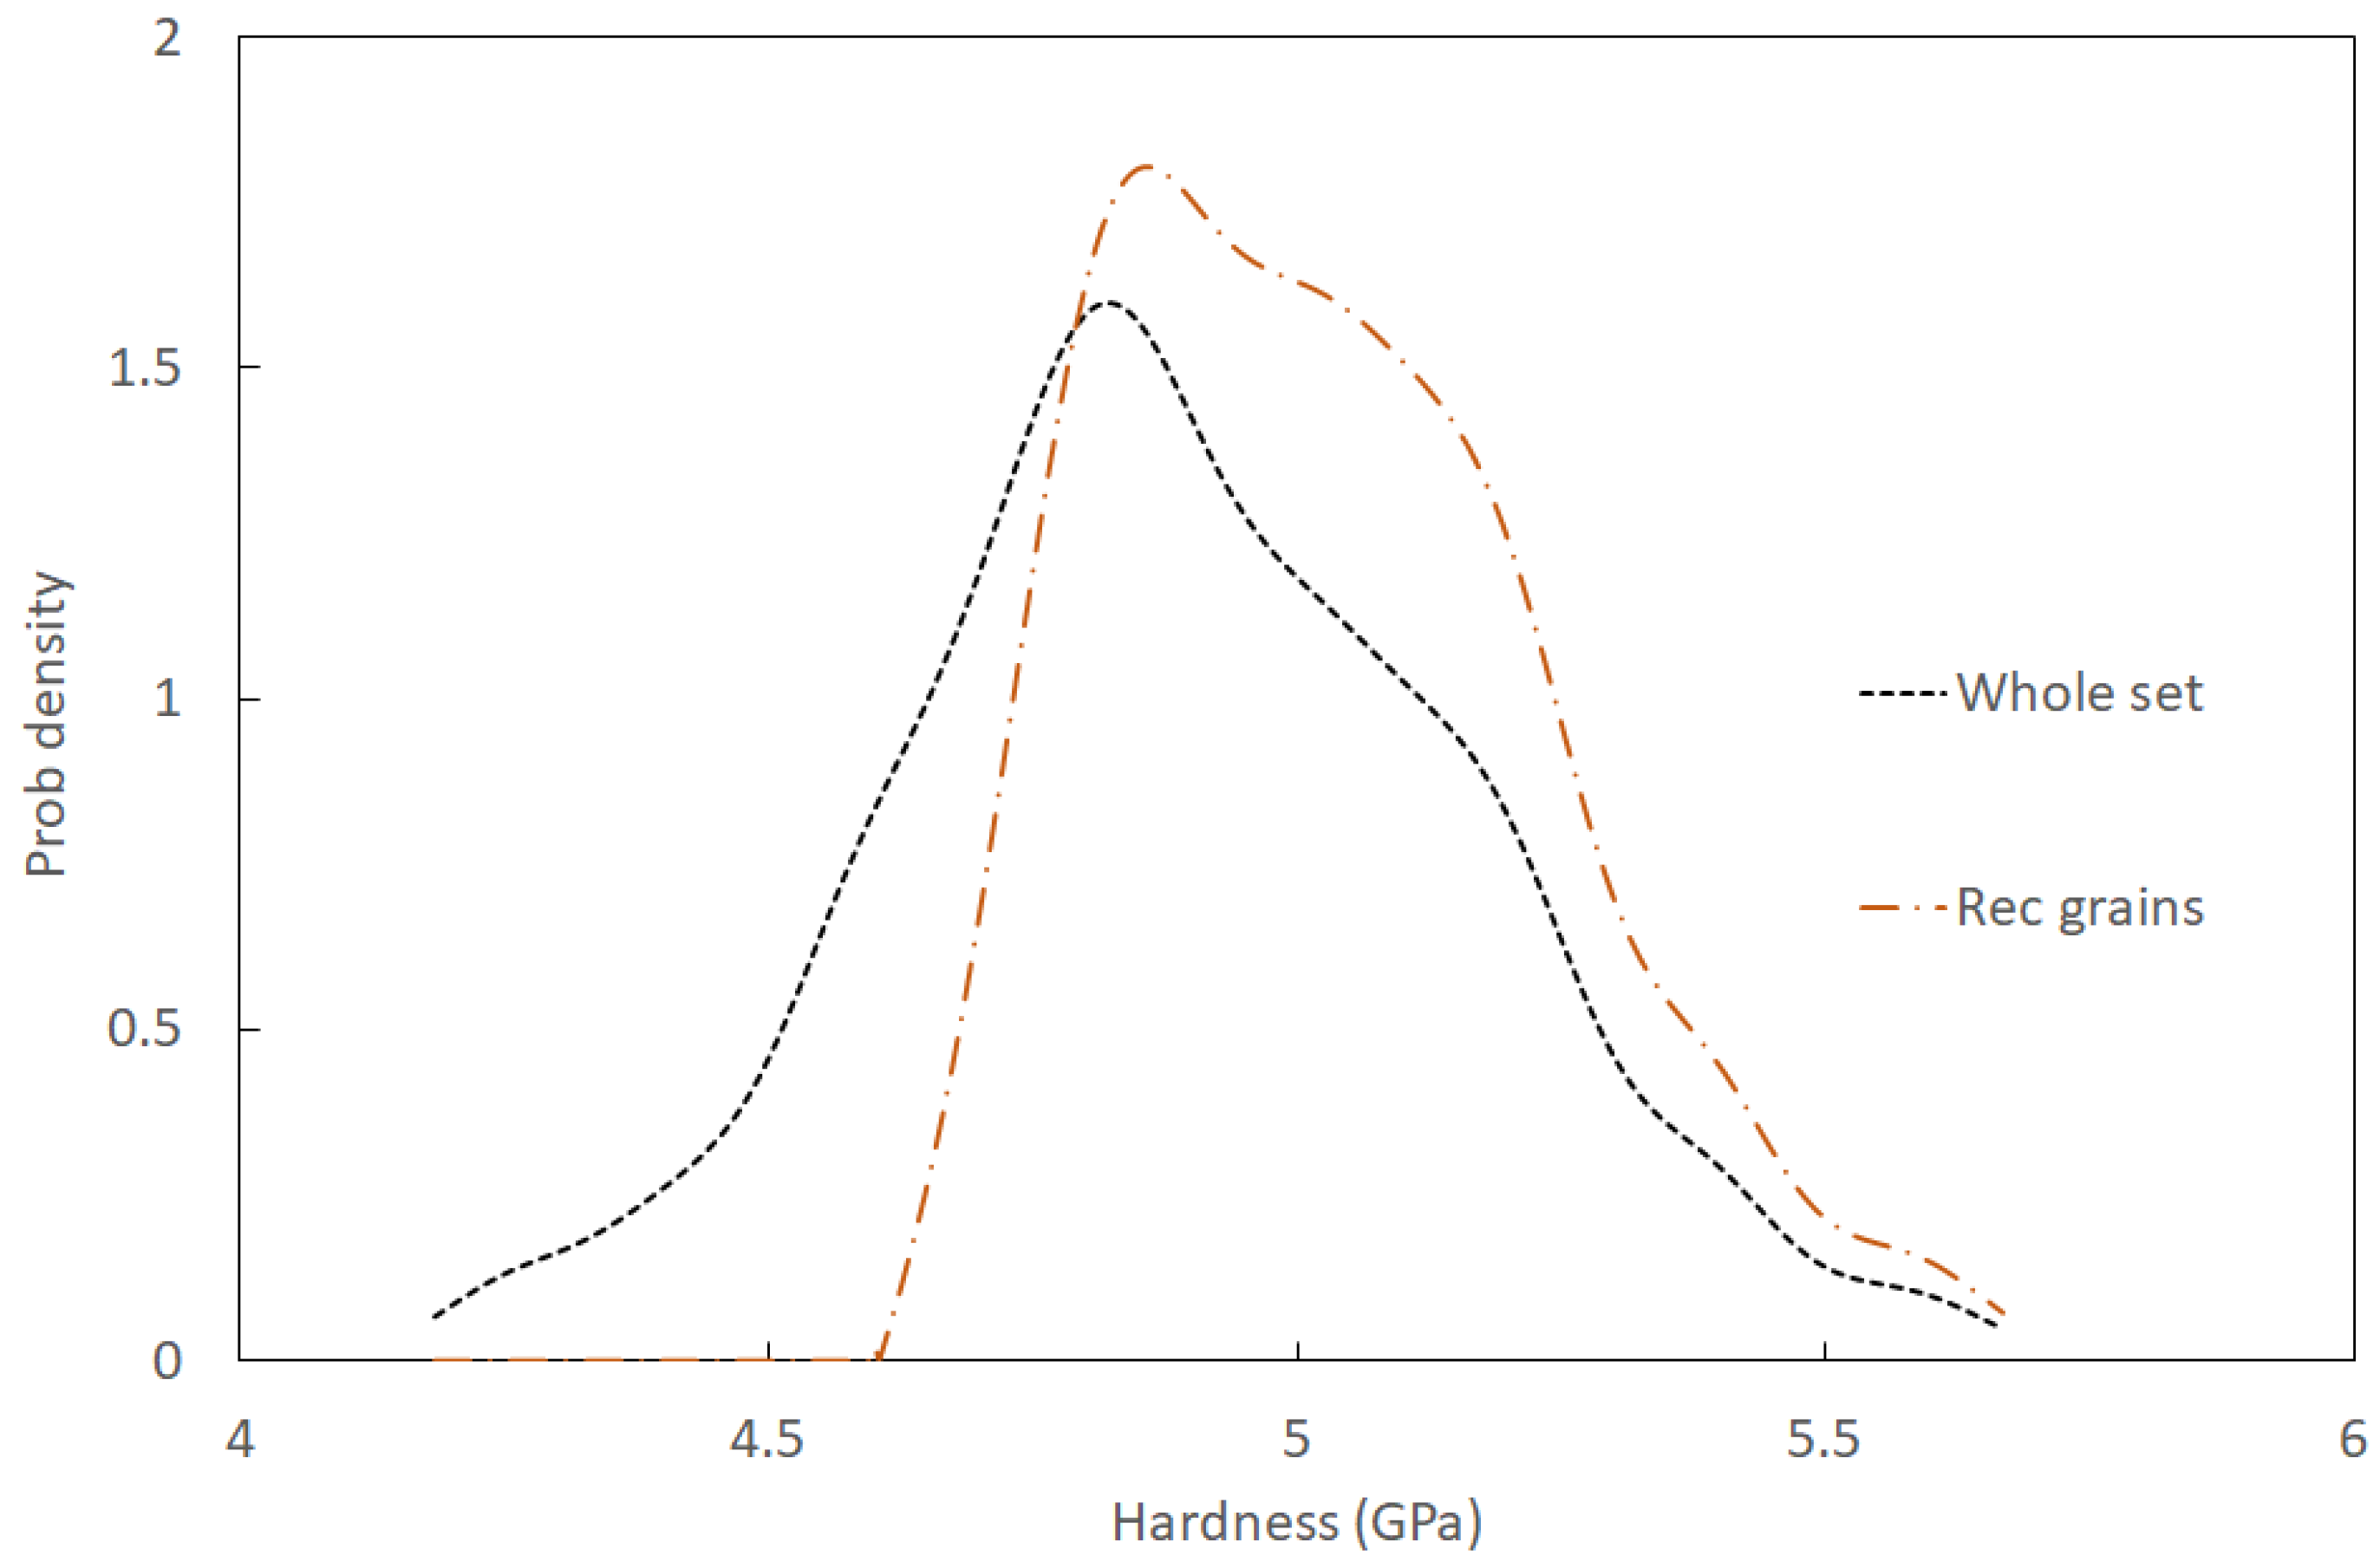
The measurement of the fraction recrystallized from statistical nanoindentation analysis lies in the quantification of the contribution of recrystallized grains to the hardness probability density function. It is first required to determine the probability density function of the fully recrystallized state as illustrated in
Figure 2. The fraction recrystallized and hardness probability density function
of recovered grains are yielded by the minimization of the cost function (
6), as shown in
Figure 5.
The softening fraction is about 65% here, whereas the fraction recrystallized computed through nanoindentation testing is about 35%. It is worth noting that the fraction recrystallized measured from EBSD lays in-between (≈50%). This difference with nanoindentation is not surprising since it is strongly dependent upon the criterion chosen to detect a recrystallized grain. For instance,
Figure 6 illustrates the microstructural evolution observed through EBSD measurements for increasing annealing time (increasing softening fraction) at T = 1550 °C. Recrystallized grains are colored regarding their orientations. Uncolored grains are unrecrystallized grains.
The time-evolution of the fraction recrystallized (T = 1550 °C) computed using the procedure above and from EBSD measurements is compared to the softening fraction (
Figure 7). The mean hardness has the same meaning as a Vickers test for which the hardness is an average value over several grains due to the indentation size [
6]. More precisely, it is a mixed value of the hardness of recovered grains and recrystallized grains, and what is computed is much more a restoration-induced softening fraction than a fraction recrystallized. Methodologies based only on Vickers macro-hardness tests usually overestimate the fraction recrystallized by neglecting the effect of recovery. Therefore, it is expected that the softening fraction will be higher than the true fraction recrystallized. The softening fraction is here up to two times larger than the fraction recrystallized estimated through the statistical nanoindentation analysis. This latter permits one to separate the contributions of recovery and recrystallization mechanisms to macroscopic softening. It is not surprising that EBSD measurements lead to in-between values, since statistical nanoindentation and EBSD methods are both based on measurements at the grain-scale. Nonetheless, the fraction recrystallized estimated from EBSD depends strongly on the chosen criterion to detect a recrystallized grain. Clearly a universal definition of the measurement of recrystallization fraction through EBSD measurement is a matter of debate [
28,
30] and is far beyond the scope of this paper.
Once the fraction recrystallized is estimated, the hardness probability density function restricted to the set of recovered grains
(
Figure 5) can be analyzed. The time-evolution of the mean value of hardness (T = 1550 °C) is plotted in
Figure 8. As expected, it decreases with time and is above the mean hardness computed on the whole set. However, the trends—i.e., the slopes—are very similar for the two sets of grains. The contribution of the recrystallization mechanism to the hardness decrease is quite low—about 0.1 GPa—whereas the contribution of the recovery mechanism is about 0.4 GPa. For the temperature range investigated in this paper—i.e., 1450–1600 °C—recovery seems to prevail in terms of softening. To get similar conclusions without using statistical nanoindentation analysis would require one to correlate EBSD measurements with Vickers measurements. However, a limitation of the present analysis deserves to be discussed here. The hardness probability density function of the fully recrystallized state has been measured on one sample, the only one that was available during the period of time of this investigation. If the nanoindentation-derived fraction recrystallized were to be underestimated, the recovery-induced hardness drop would be overestimated. At least, it may be concluded that recovery and recrystallization mechanisms overlap and that recovery has to be considered to accurately measure recrystallization kinetics of tungsten at elevated temperature.
The recovery-induced softening is characteristic of a logarithmic decrease of hardness with time that can be approached with a linear function of time [
30], as shown in
Figure 8. It is consistent with the Kuhlmann’s theory of recovery [
3]. A simpler theory is chosen here to model the recovery mechanism. Recovery is intrinsically linked to dislocations rearrangement and annihilation that may occur through various rate-controlling mechanisms, such as dislocation climb, thermally activated glide or cross-slip [
3]. There are various ways to describe recovery kinetics through the evolution of dislocation density. Let us consider the following one:
whereby
r is a temperature-dependent parameter and
is the initial dislocation density. The nanoindentation hardness is somehow related to dislocation density through the materials yield stress
. The famous Tabor relation [
31] yields:
The Taylor relation links the yield stress to the dislocation density [
32] through Equation (
9).
whereby
is the yield stress of the fully recrystallized materials. Parameters
and M are dimensionless. In the case of tungsten, the product
is close to 1. Shear modulus
is taken as 160 GPa; the burgers vector is 274 pm [
33]. The dislocation density can thus be written as a function of the nanohardness.
whereby
is the hardness of the fully recrystallized materials. The decrease of dislocation density—computed through Equation (
10)—versus time is plotted in
Figure 9. For each temperature, the variation is consistent with the exponential shape proposed in Equation (
7). It is worth noting that such an evolution is also consistent with a recovery mechanism controlled by dislocation climb that would lead to
[
3].
The recovery coefficient, as defined in Equation (
7), is plotted in
Figure 10 for temperature range 1450–1600 °C. The recovery parameter increases with temperature, as expected. From this plot and the Arrhenius equation
—where
Q is the activation energy and R is the universal gas constant—it is possible to extract the related activation energy. It is observed to be about 430 kJ/mol, which is roughly consistent with the order of magnitude of bulk self-diffusion in tungsten ≈500–650 kJ/mol [
34]. Considering a mechanism controlled by dislocation climb [
3], the activation energy would be ≈600 kJ/mol, which is again in agreement with bulk self diffusion. Moreover, some other recovery mechanisms deserve to be explored through this kind of measurement, such as subgrain coarsening. In that case, hardness might be related to the sub-grain size and boundary misorientation [
17,
21]. There is clearly a need for future works in that area. Let us note that the recrystallization activation energy might have been evaluated through the time at 50% recrystallization. Unfortunately, such an investigation was not possible in the present study, since most of the specimens were less than half-recrystallized. It is worth noting that the present paper is a first attempt in the estimation of parameters related to recovery/recrystallization mechanisms through statistical nanoindentation. Despite the observed scatter, the results are roughly consistent with literature.
Although statistical nanoindentation analysis seems to be an interesting tool to measure the fraction recrystallized, some intrinsic limitations have to be mentioned. The first one is that the overlap between the hardness distribution of the recovered matrix and that of the recrystallized grains has to remain limited. Otherwise, the recrystallization fraction might be overestimated. Hence, the estimation of the recrystallization fraction using this methodology has to be taken with caution when the overlap exceeds a given threshold. The second limitation is related to the use of statistics themselves. The application of statistical nanoindentation theory [
16] requires indentation depth to be smaller than the heterogeneity characteristic size. In a composite materials, this assumption can be checked a priori. In a material undergoing both recovery and recrystallization, the characteristic size is quite difficult to define a priori. For instance, the indentation depth used in the present work was about 1.5 µm, which corresponds to a 15 µm characteristic size. Grains with a smaller characteristic size may be missed. The best way to overcome this issue could be to perform nanoindentation tests with a smaller indentation depth. The latter has to be defined according to the characteristic size of a recrystallized grain, for instance. Nevertheless, given the average grain size, one would require a large number of nanoindentation tests to perform the statistical analysis. It might be of interest to develop a two-scale strategy to focus on regions of interest. It is worth noting that recent advances in ultrafast nanoindentation mapping clear the way for such a development [
35]. Further investigations beyond the scope of this paper deserve to be done to extend the set of data. A relation to a initial microstructural state such as texture [
36] might be fruitful. Correlating EBSD and grid nanoindentation [
24] could be a promising way to better understand the prior deformed state and the measured recrystallization/recovery kinetics. Statistical nanoindentation theory might be useful to compare the effect of various manufacturing processes, the hardness being an indirect signature of the stored energy.

 ,
, 


