Article

Hybrid Graphene-Based Photonic-Plasmonic Biochemical Sensor with a Photonic and Acoustic Cavity Structure

1
Institute & Undergraduate Program of Electro-Optical Engineering, National Taiwan Normal University, Taipei 11677, Taiwan
2
Micro/Nano Device Inspection and Research Center, National Taiwan Normal University, Taipei 11677, Taiwan
3
Department of Mechanical and Mechatronic Engineering, National Taiwan Ocean University, Keelung 20224, Taiwan
4
Department of Mechatronic Engineering, National Taiwan Normal University, Taipei 10610, Taiwan
5
Department of Mechanical Engineering, National Taiwan University, Taipei 10617, Taiwan
6
Department of Mechanical Engineering, National Yunlin University of Science and Technology, Yunlin 64002, Taiwan
7
Center for Plasma and Thin Film Technologies (CPTFT), Department of Materials Engineering, Ming Chi University of Technology, New Taipei City 24301, Taiwan
8
Center for Measurement Standards, Industrial Technology Research Institute, Hsinchu 31040, Taiwan
9
Institute of Optoelectronic Sciences, National Taiwan Ocean University, Keelung 20224, Taiwan
10
Center of Excellence for Ocean Engineering, National Taiwan Ocean University, Keelung 20224, Taiwan
*
Authors to whom correspondence should be addressed.
Crystals 2021, 11(10), 1175; https://doi.org/10.3390/cryst11101175
Submission received: 26 August 2021 / Revised: 16 September 2021 / Accepted: 17 September 2021 / Published: 28 September 2021
(This article belongs to the Section Inorganic Crystalline Materials)

Abstract

:
In this study, we propose a biochemical sensor that features a photonic cavity integrated with graphene. The tunable hybrid plasmonic-photonic sensor can detect the molecular fingerprints of biochemicals with a small sample volume. The stacking sequence of the device is “ITO grating/graphene/TiO2/Au/Si substrate”, which composes a photonic band gap structure. A defect is created within the ITO gratings to form a resonant cavity. The plasmonic-photonic energy can be confined in the cavity to enhance the interaction between light and the analyte deposited in the cavity. The finite element simulation results indicated that the current sensor exhibits very high values in resonance shift and sensitivity. Moreover, the resonance spectrum with a broad resonance linewidth can identify the molecular vibration bands, which was exemplified by the fingerprint detections of protein and the chemical compound CBP. The sensor possesses an electrical tunability by including a graphene layer, which allowed us to tune the effective refractive index of the cavity to increase the sensor’s sensing performance. In addition, our device admits a phononic bandgap as well, which was exploited to sense the mechanical properties of two particular dried proteins based on the simplified elastic material model instead of using the more realistic viscoelastic model. The dual examinations of the optical and mechanical properties of analytes from a phoxonic sensor can improve the selectivity in analyte detections.

Graphical Abstract

1. Introduction

The wavelengths of light absorbed by many molecular vibration modes and chemical bonds fall within the 3–20 μm infrared (IR) bands, and IR spectroscopy has been a popular technique for identifying the functional groups and fingerprints of biochemicals [1]. For example, the amide I and amide II bands with vibrational wavenumbers of around 1660 and 1550 cm−1 are the fingerprints for proteins to be identified [2], which can be detected from the IR spectrum. However, for conventional IR spectroscopy, the light interacts poorly with nanoscale analyte samples. Therefore, a minimum amount of analytes is required for qualitative determinations. To overcome the large dimension mismatch between light in the micrometer range and molecular dimensions in the nanometer range, surface-enhanced infrared spectroscopy, relying mainly on the surface plasmons (SPs), has been rapidly developed. The surface plasmon resonance (SPR) is the collective oscillation of free charge carriers along the interface of a metal and a dielectric material [3], which exhibits subwavelength electric field confinement (within a few hundred nanometers) in the direction normal to the interface [4]. The SPs can be further confined within few tens of nanometers if metal nanostructures are used instead of continuous metal films. The technique is referred to as the localized surface plasmon resonance (LSPR). The highly localized electric field can match the nanoscale volume of analytes to enhance light/matter interaction. Metal nanostructures, such as gratings, nanoparticles, antennas, slits, and rods, are frequently used to generate the near-field plasmons bounded on the surfaces of nanostructures. In addition to novel metals, the LSPR can also be materialized with metal oxides, highly doped semiconductors, and graphene [5].
Infrared LSPR sensors with metal nanostructures have been widely applied to detect nanoparticles and identify functional groups and fingerprints of biochemicals through the strong coupling between the resonance modes of surface plasmons and the molecular vibrational modes. For example, Spadavecchia et al. [6] used the gold nano-islands to detect DNA hybridization. The LSPR magnifies upon the hybridization of the probes with gold-particle-labeled DNA, which amplifies the resonance wavelength shift. Li et al. [7] applied a plasmonic crystal made of an Au nano-disk array to detect protein A and human IgG bilayer, and the authors evaluated the biosensing performance based on the surface sensitivity. Rodrigo et al. [2] used gold nanoantenna arrays fabricated on a CaF2 substrate to identify the amides I and II bands of the A/G-IgG protein bilayer. The extinction spectrum was compared with the results based on the graphene nano-ribbon arrays. In the meantime, the plasmonic gold nanoantenna was used for in vitro monitoring of the conformational change between the α-helix and β-sheet at the amide I vibration of a polypeptide monolayer [8]. Chen et al. [9] proposed an array of a gold nanoantenna with a shape of an unsymmetrical cross, which produces a dual-band perfect absorber with wavenumbers separated by more than 1000 cm−1. The experimental results showed the device can simultaneously detect the C-H and C=O vibrational bands of a 4-nm-thick PMMA thin film. Despite the above-mentioned successes in biosensing, the metallic nanostructures with LSPR still have some shortcomings. First, the spectral resonance linewidth may be narrow, which will make fingerprint detection difficult. Secondly, the field confinement of the metal is comparatively poor in the mid-infrared [2].
Graphene, as a two-dimensional material, has attracted a great amount of attention in the field of sensing in recent years for its high sensitivity, high surface to space ratio, high carrier mobility, and tunability. Compared to common metals, graphene under the infrared illuminations can confine more light energy—up to two orders of magnitude—near the surface where an electric field attenuates at a short distance, allowing less energy to dissipate into a substrate [2]. The study on the graphene plasmon applications in the detections of molecular fingerprints and nanomaterials has been increasing tremendously in recent years. Various types of graphene-incorporated structures have been proposed, wherein the unpatterned or patterned graphene is in combination with dielectrics, metal films, or metal nanostructures. For example, plasmonic structures with a stacking sequence “nano-ribbon graphene/silicon dioxide/silicon substrate” were employed separately to detect the fingerprints of proteins [2] and to identify the vibrational modes of chemical bonds [10]. In [2], the results based on patterned graphene were compared with the results obtained by using a gold nanoantenna array. It was found that 90% of the surface plasmonic energy is confined within 15 nm from the graphene surface, compared to about 500 nm from the gold surface. In addition, for the amide I band, the mid-IR signal modulation corresponding to the graphene sensor is nearly three times the value of the gold sensor. Chen et al. [11] demonstrated that acoustic graphene plasmons (AGPs) exist in the nano-gap between graphene and metal, which was applied to detect the fingerprints of a nano-scale protein inserted inside the gap. An AGP resonator comprising a graphene layer and gold nano-ribbon array separated by a nano-gap was proposed for identifying the fingerprints of silk protein [12]. In addition to the extremely localized plasmonic energy, the electrical tunability is another important feature of graphene. The Fermi levels (and in consequence, conductivity) of graphene can be manipulated by applying various bias voltages. Therefore, by adjusting the Fermi level of graphene, the plasmonic resonance can be tuned to a desired vibrational mode, which enables a possible broadband fingerprint detection. The trace of molecular fingerprints by modulating the graphene’s Fermi levels was reported in [2,13].
With the advantages of high energy confinement, small modal volume, high quality factor, and high sensitivity, the photonic crystals (PTCs) and hybrid photonic-plasmonic crystals with a defect design, used as an alternative to the graphene/metal plasmon surface-enhanced biochemical IR sensors, have received tremendous attention in biochemical detection. Most studies have focused on the liquid sensing of 1-D PTC nanobeam cavities, due to its relatively simple geometrical configuration and an easy lab-on-chip fabrication. A gradual variation of the pore’s diameters in the central portion of a nanobeam is frequently used as the defect to confine the photonic energy. Typical nanobeam applications in biochemical detections include glucose concentration identification [14,15], molar ratio determination of chemicals [16], detection of low-concentration protein [17], and oligonucleotides detection by nanobeams patterned on the porous silicon substrate [18]. A comprehensive review of the sensing applications of nanobeam cavities was provided by Qiao et al. [19]. There are also many other types of photonic/plasmonic crystals cavities for biochemical sensing, for example, tuberculosis detection based on the photonic bandgap with the blood sample as the defect layer [20], 2-D photonic crystal cavity for cancerous cell detection [21], cancer biomarker detection and drug diagnostics using 2-D silicon PTC microcavities coupled with waveguides in the telecom wavelength band [22], resonance recognition for an artificial organic substance by using 2-D hybrid photonic-plasmonic crystal cavities [23], glucose sensing by placing a dielectric nanowire on the metal grating with a nano-trench cavity [24], and protein detection by using gold gratings deposited on silicon substrate with a graphene-laced cavity [25]. Most of the afore-mentioned works detected biochemicals based solely on the resonance shift, a result due to the variation in the refractive index (RI), which may post a selectivity problem because it is quite common that different biochemicals may have a nearly identical RI value. Therefore, to further provide a more reliable molecular identification, it is generally desirable that a resonance spectrum can reveal not only the resonance shift but also the energy absorption bands corresponding to the molecular structures. The design of photonic/plasmonic cavities primarily emphasizes a high quality factor (Q) and a low modal volume (Vm). A high value of Q/Vm is crucial for the optical filters, optical switches, and for the particle detection with a very low concentration. However, a high Q/Vm ratio is not necessarily beneficent for the sensing applications. It is because a high-Q cavity may lack extensive light/analyte interaction and consequently results in a small resonance shift (causing a low sensitivity, S) and a narrow resonance linewidth (failing to encompass the molecular vibration bands). Therefore, a tradeoff between S and Q is sometimes common for maximizing the sensing performance, which is signified by the sensing evaluation parameter, figure of merit (FOM) defined as FOM = S × Q/λr, with λr being the resonance wavelength.
Phononic crystals (PNCs), in the same fashion as PTCs, consist of periodic arrangements of materials with different mechanical properties, such as mass densities, viscosity, and elastic constants. Similar to the PTCs with photonic band gaps, PNC structures have phononic band gaps as well. With a design of defect, the acoustic energy can be confined in the cavity to enhance the phononic sensing performance. The PNC sensors have attracted considerable attention in the past decade [26,27,28,29,30]. More recently, photonic-phononic crystals (also known as phoxonic crystals) with both photonic and phononic bandgaps have been increasingly used in sensing applications [15,31,32,33]. The dual examinations of the optical and mechanical properties of an analyte from a phoxonic sensor can reduce the sensing uncertainty and improve the selectivity in analyte detection. In the current study, the acoustic sensing of biochemicals was illustrated by examining the resonance shifts of collage and HIV-1 protease. It has to be mentioned that these two particular proteins are taken to be elastic solids, which neglects the viscous damping properties that are commonly exhibited in the polymers.
In this study, we propose a graphene-based infrared hybrid plasmonic-photonic sensor with a photonic cavity to detect the molecular fingerprints of biochemicals. The stacking sequence of the device is a “ITO grating/graphene/TiO2/Au/Si substrate” that can be fabricated through standard nanofabrication. The ITO grating is used as the photonic crystal bandgap structure, and a defect is created within the gratings to work as an optical resonator and as the sample chamber, which the target analyte is filled in. The height of the analyte layer is the same as the height of the gratings. The surface under the sensor’s gratings is covered with a monolayer graphene to generate surface plasmons. The plasmonic and photonic energy can be confined in the cavity to enhance the interaction between light and the analyte deposited in the cavity. The integration of graphene into the photonic cavity can provide electrical tunability to improve the sensing performance of the device. The design of the sensor’s prototype is based on the photonic band gap theory, and the resonance wavelength and linewidth have been optimized to accommodate the frequency range of molecular vibrations. The results based on the finite element (FE) simulations indicated that our newly designed sensor possesses many advantages, such as allowing sensing with a small sample size, large resonance shift, high sensitivity, multi-mode sensing, graphene’s tunability, and broadband fingerprint identification. The calculated results showed that the resonance wavelength shift is as large as 1323 nm with an effective sensitivity as high as 6682 nm/RIU. The broadband recognitions of molecular vibration modes of biochemicals were exemplified by the detention of amide I and II bands of AG/IgG protein and the detection of three vibrational bands of the chemical compound 4,4′-Bis(N-carbazolyl)-1,1′-biphenyl (CBP), wherein the detected vibration bands span over a wavenumber from 1450 to 1660 cm−1. It is worth mentioning that the AG/IgG protein and CBP are treated as solid layers in this study. It should be noted that in general the sensing of liquid biomolecules is preferred over sensing solid substances. In addition to the above-mentioned features, our cavity-based sensor can be used not only for photonic sensing but also for phononic sensing, which offers another advantage over other types of biochemical sensors.
The rest of this paper is organized as follows. The design of the sensor is presented in Section 2. The Fermi level-dependent complex conductivity of graphene and the wavenumber-dependent complex permittivities of analytes A/G-IgG protein and CBP based on the Lorenzian model are also described in this section. In Section 3, both the photonic and phononic results based on the finite element analysis are given in Section 3.1 and Section 3.2, respectively. The band diagrams of the perfect structure and the defect modes of the cavity-coupled structure are included. The photonic sensing is the focus of Section 3.1. The defect mode with the resonance wavelength close to the molecular vibration wavelength was singled out for sensing analytes protein and CBP. The molecular fingerprints were recognized from the resonance spectra. The effective sensitivity and FOM were calculated and compared with the published results. The effect of the Fermi levels on the electrical tunability of graphene was also demonstrated in this subsection. Meanwhile, the acoustic sensing is described in Section 3.2, in which the acoustic sensing of collage and HIV-1 protease is reported. The influence of mechanical properties on the resonance spectra and shifts is illustrated. Finally, important results are summarized in Section 4.

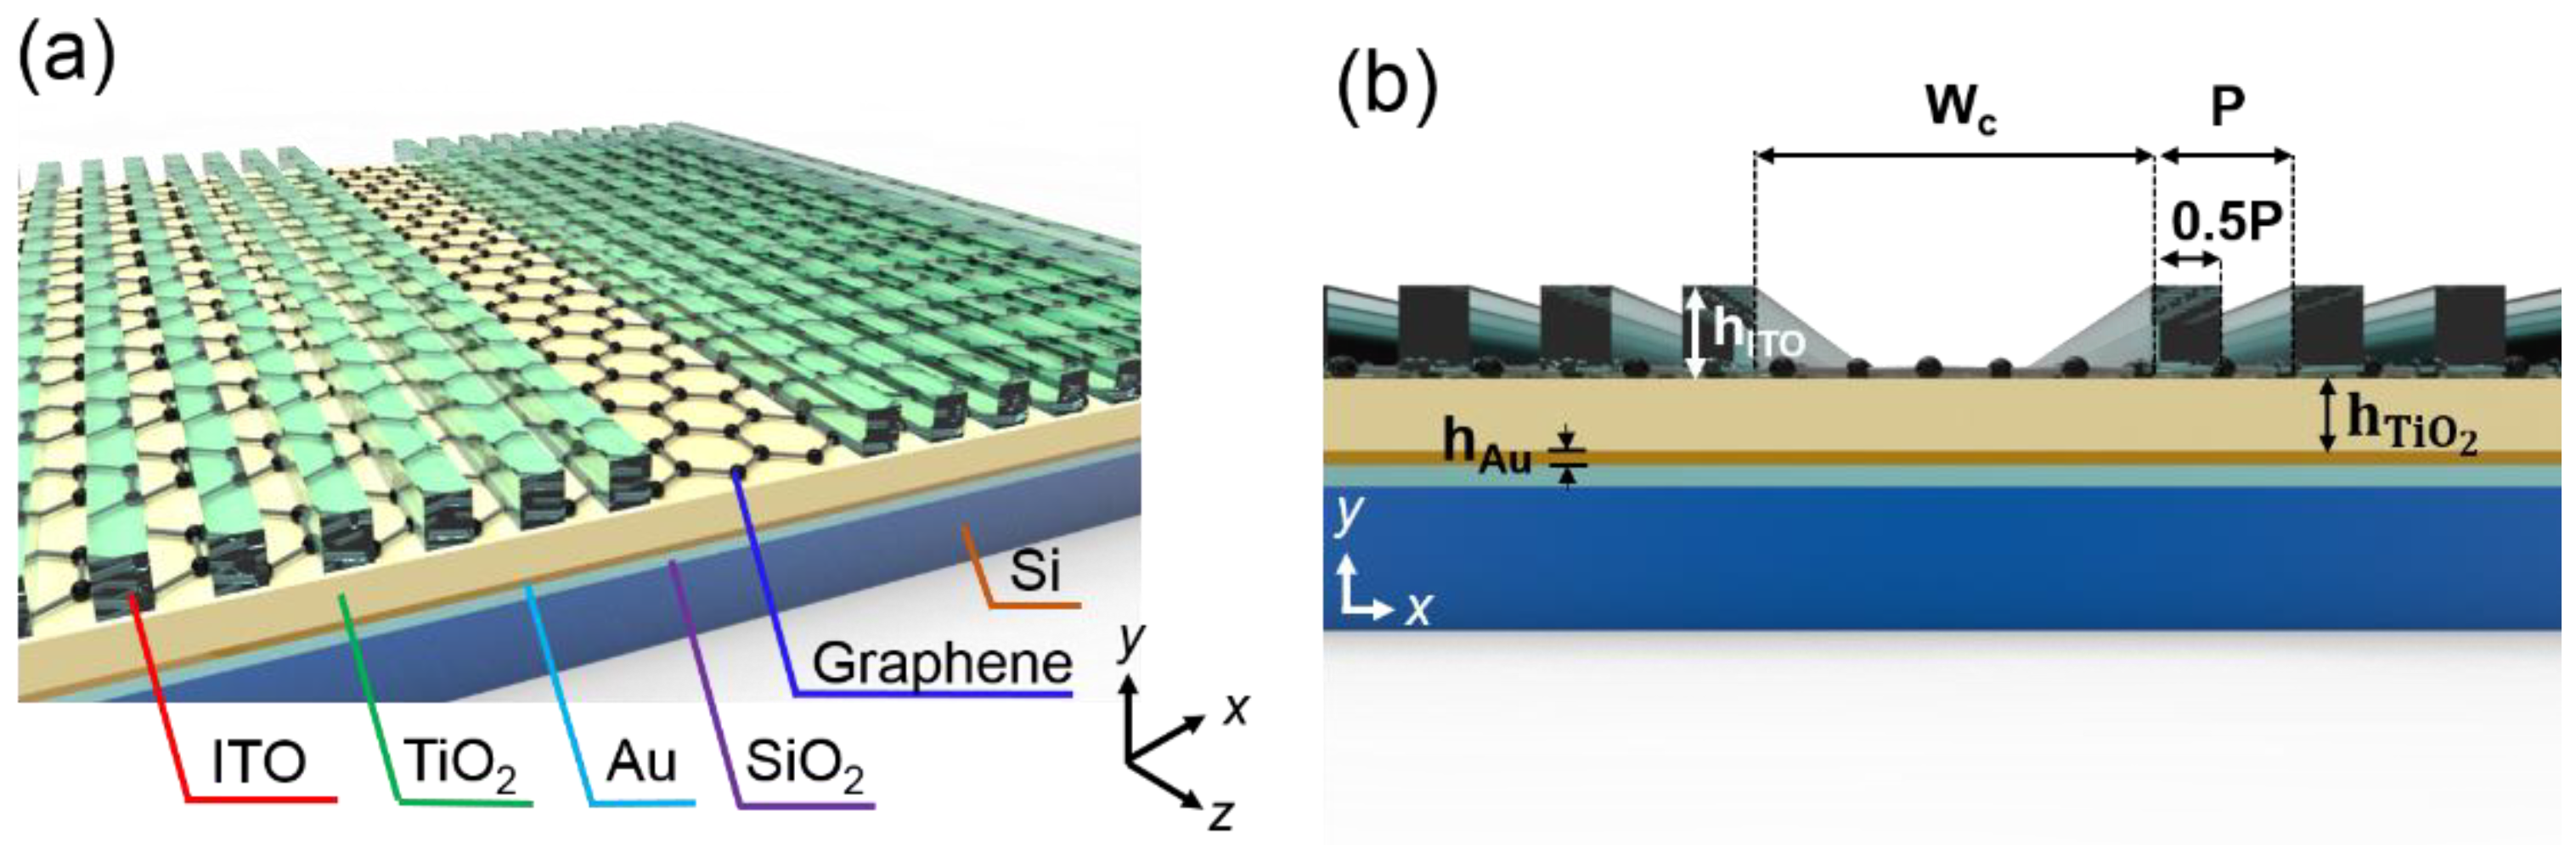
2. Device Design and Materials

The design concept and the resulting geometrical profile of the proposed biochemical sensor are given in Section 2.1. The photonic properties of graphene and analytes are shown in Section 2.2 and Section 2.3, respectively.

2.1. The Design of the Biochemical Sensor

The three-dimensional structural illustration of the resonant-cavity plasmonic-photonic biochemical sensor that we proposed and its sectional view are shown in Figure 1a,b, respectively. The structure of the device and the function of each material component are described as below. The device is built on a silicon wafer. A thin layer of gold is plated on the SiO2 substrate to enhance the reflectivity and confine most of the light energy in the structure. Above the layer of gold is a thicker TiO2 dielectric layer working as the waveguide for wave propagation; TiO2 has a relatively high refractive index near the 6-μm wavelength range, which is employed to downsize the structure. Monolayer graphene is placed on the surface of the lamellar structure, which generates surface plasmons that interact with the analyte and improve the sensing performance. Then, a periodic grating structure is generated with indium tin oxide (ITO) on the graphene layer. ITO is a transparent glass material in the visible-wavelength range, but it behaves like a metallic material in the mid-infrared wavelength range. Therefore, ITO gratings can effectively confine the plasmonic energy in the cavity. Nonetheless, unlike metal gratings, ITO gratings produce a much broader resonance linewidth, which makes molecular fingerprint detection more feasible. Finally, a non-periodic defect area is created in the center of the gratings to form a resonant cavity. The above-mentioned elements compose a plasmonic-photonic bandgap structure with a defect. The light energy of specific mid-wavelength infrared can be confined in the cavity. It is worthwhile to mention that the proposed device also possesses phononic bandgaps and can be employed for acoustic sensing. All the components of the device are taken to be linear, homogeneous, and isotropic in both the optical and mechanical properties.
Our primary goal is to design a cavity-based sensor capable of detecting molecular fingerprints, such as the amide I and amide II bands, the fingerprint of protein, having vibrational wavenumbers of around 1660 and 1550 cm−1 (wavelengths of about 6.02 and 6.45 μm, and frequencies of about 49.8 and 46.5 THz). The FE software COMSOL Multiphysics [34] was employed to conduct the photonic and phononic analyses. According to the FE photonic simulation, the amides I and II bands can be detected with a sensor having the following geometric parameters:
Wc = 5000 nm, P = 2000 nm, hAu = 100 nm, hTiO2 = 750 nm, hITO = 1000 nm
where Wc, P, hAu, hTiO2, and hITO are the cavity length, ITO grating period, gold layer thickness, TiO2 thickness, and the height of the ITO grating. The sensor with the above-listed geometric aspects provides a broadband fingerprint detection. The simulation results suggested that the sensor can also identify, in addition to the fingerprint of protein, the fingerprint of CBA having three vibrational bands with wavenumbers between 1450 cm−1 and 1504 cm−1. Furthermore, the newly designed sensor can produce not only the photonic bandgap but also the phononic bandgap, which makes dual photonic-acoustic sensing possible.
The proposed sensor can be fabricated through standard nanofabrication. An Au bottom metal contact and a TiO2 layer are sequentially deposited on the Si (100) wafer substrates by thermal evaporation and ion-gun-assisted E-beam evaporation, separately. A single layer graphene film grown on a copper foil by chemical vapor deposition (CVD) then can be transferred onto the surface of the TiO2 layer, whose surface is modified by atmospheric plasma treatment using a PDMS-assisted wet transfer method. The ITO as a top transparent conducting layer can be deposited on the lamellae by the E-beam evaporation as well. Then, the ITO thin film is etched by employing electron beam lithography to complete the gratings and the resonant cavity. Finally, the cavity structure coupled with the graphene layer can be integrated into a chip. The chip performs voltage scanning on the graphene layer in order to modulate graphene’s Fermi levels to provide graphene-enabled tunability.

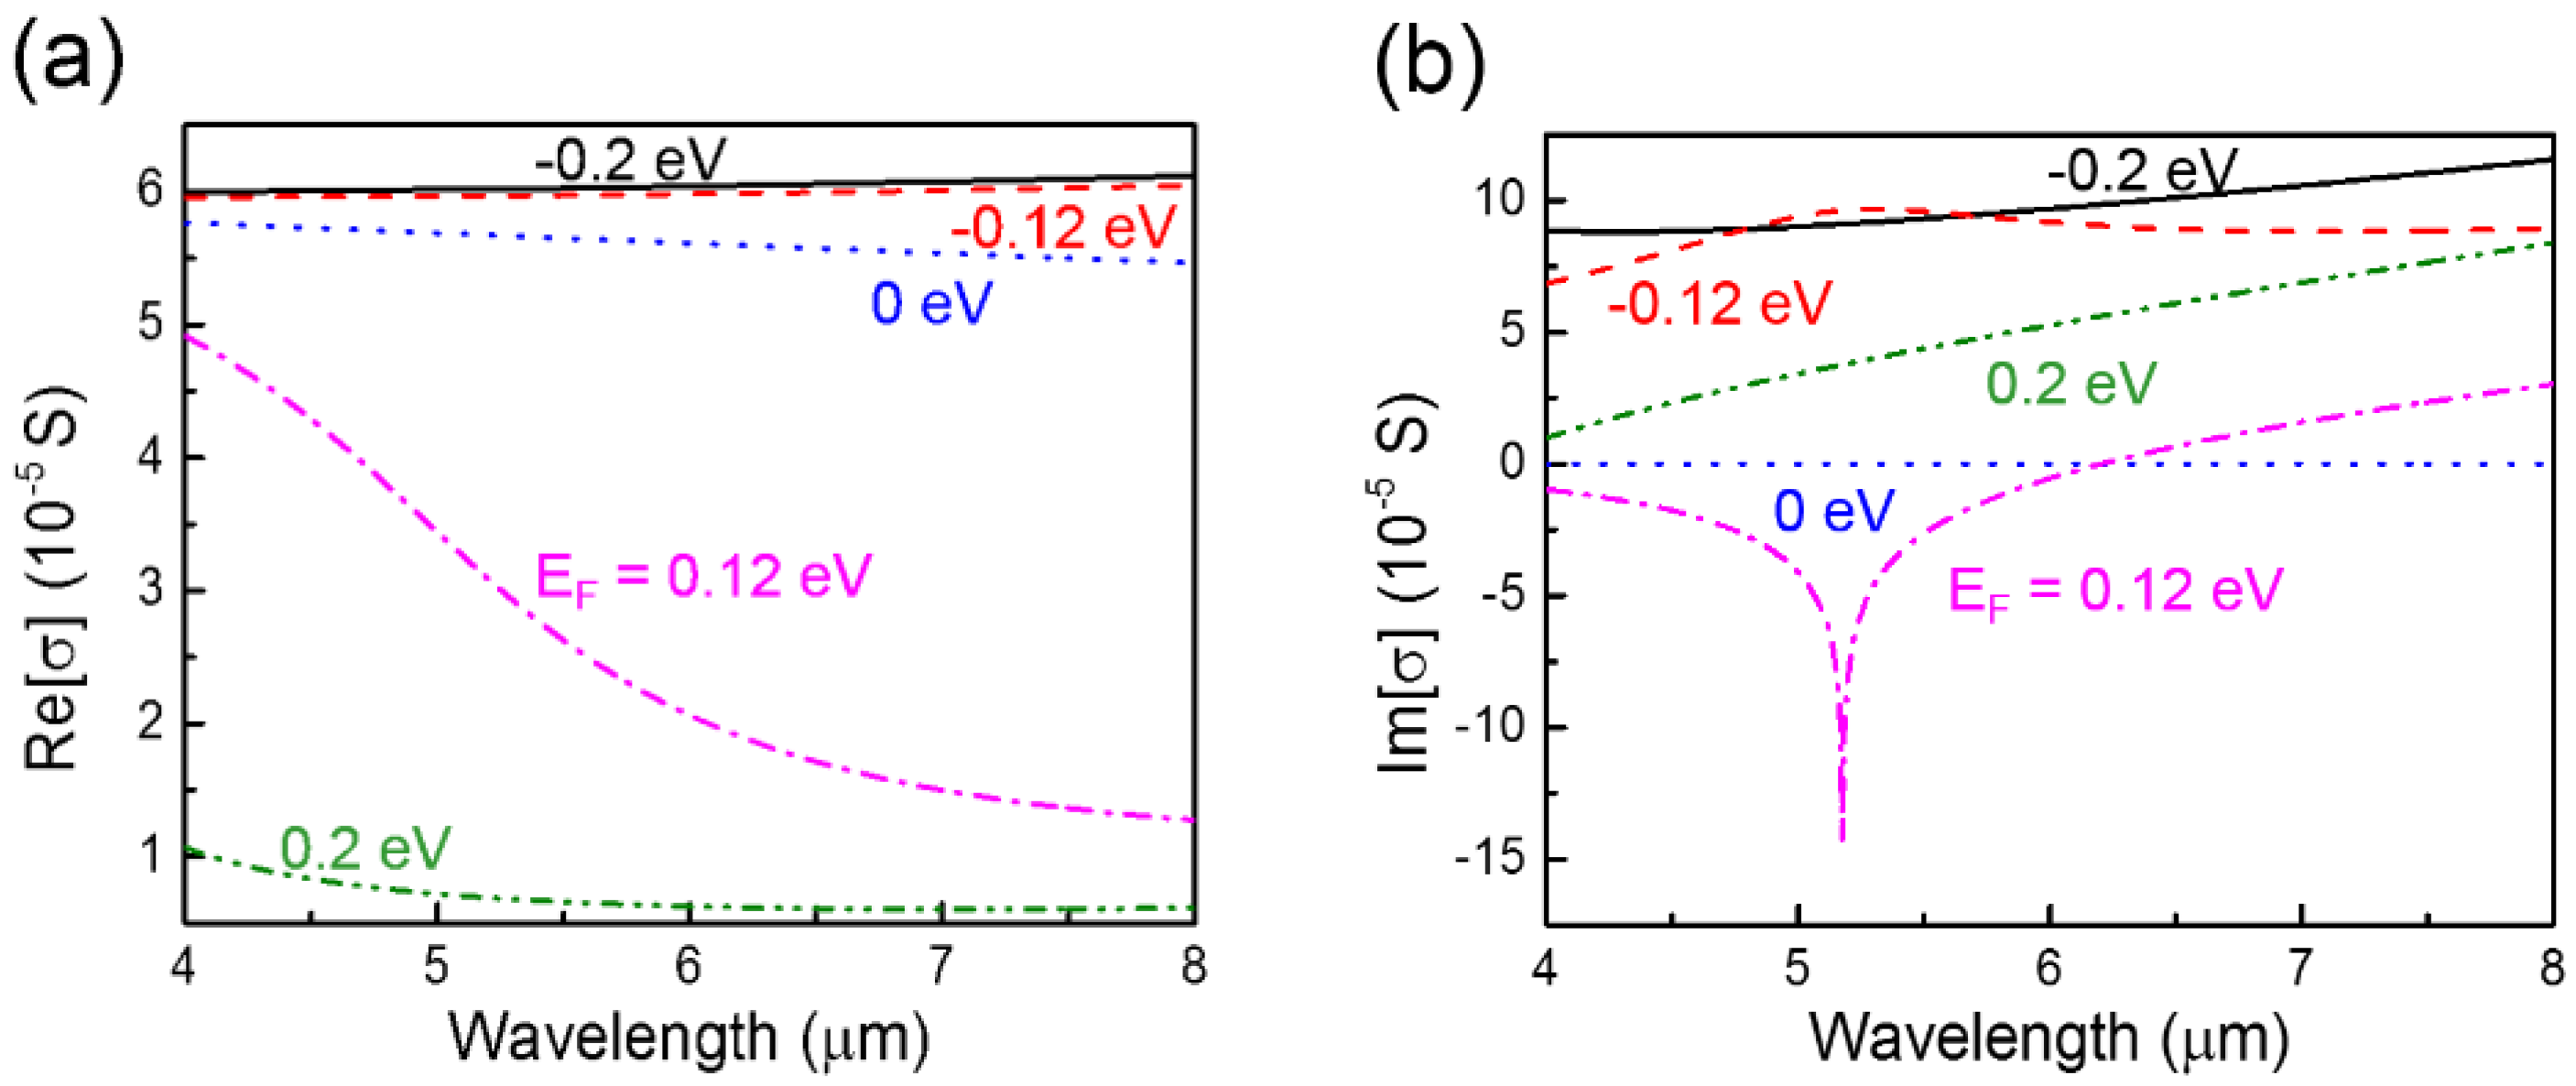
2.2. Complex Conductivity of Graphene

The graphene layer placed between the TiO2 layer and the gratings allows us to change graphene’s Fermi levels by applying different bias voltages and thereby change graphene’s complex conductivity and the sensor’s optical responses [35,36,37]. The relation between Fermi’s levels and graphene’s complex conductivity can be described with intraband transition and interband transition, respectively [38,39]. Figure 2a,b show the relations of the real and imaginary parts of graphene’s conductivity, respectively, with various Fermi’s levels and different wavelengths in the 4–8 μm range. It appears that in this range, graphene has a larger real part of conductivity when Fermi’s level is larger in the negative value. A similar tendency can be observed for the imaginary part of graphene’s conductivity. As the real and imaginary parts of graphene’s conductivity become larger, graphene’s metallic properties also become more prominent.
By altering graphene’s Fermi level in the mid-infrared wavelength range, graphene can be used as a tunable plasmonic material. We used this property to optimize the biosensor’s detection sensitivity and to modulate the resonance wavelength. In order to study the performance of the proposed sensor with various Fermi’s levels, we carried out the numerical simulation with the finite element method (FEM). Because the graphene layer is extremely thin, graphene is treated as a boundary layer with surface current (Js). The relation between the surface current and electric field E is Js = σE [36].

2.3. Dielectric Functions of Biochemical Analytes

In this study, we designed a sensor capable of identifying the molecular fingerprints of biochemicals, which was demonstrated by the detection of molecular vibration modes of A/G-IgG protein and CBP. The wavenumber-dependent relative permittivities of both analytes can be modeled by using the Lorenz series:
ε r ( ω ) = ε + k = 1 s k 2 ω k 2 ω 2 + i ω γ k
Two Lorenz oscillators were employed to describe the permittivity of A/G-IgG protein [2], and the permittivity of CBP was modeled with three oscillating terms [5]. The parameters in Equation (2) can be found in the corresponding literature for protein [2] and CBP [5]. The refractive index n and extinction coefficient κ can be determined from the relation ε r = ( n + i κ ) 2 . The coefficient functions n and κ are plotted against the wavelength and wavenumber in Figure 3a,b for A/G-IgG protein and CBP, respectively. The peaks of the extinction coefficient curves are correlated with the molecular vibrational absorption bands, which are marked by gray bars.

3. Results and Discussion

Our device can provide both photonic and phononic sensing. The FE results of the photonic and acoustic analyses are presented in Section 3.1 and Section 3.2, respectively. Pertinent discussion about the significance of the results is also included.

3.1. Optical Results

The resonant cavity was employed to confine photonic-plasmonic energy to strengthen the interaction between light and an analyte. Light can be effectively trapped in a resonant cavity only when a PTC has bandgaps. Therefore, we firstly conducted the eigen-analysis for the perfect structure and the corresponding defect structure to design a cavity structure suitable for molecular fingerprint detections. Then, the identification of biochemicals from the resonance spectra and the evaluation of the sensing performance were reported. Finally, the effect of graphene’s tunability on the sensing performance of the device was presented.

3.1.1. Modal Analysis for Perfect PTC and Defect Structure

The eigenmode analysis can be conducted based on the unit cell model for the perfect crystal. The calculated energy band diagram with band curves below the light cone is shown in Figure 4a. It is noted that there are six band curves. The electromagnetic wave polarizations related to the energy band modes, either transverse electric (TE) polarization or transverse magnetic (TM) polarization, are also indicated in Figure 4a. The energy band diagram reveals that there are four band gaps marked in gray. The frequency range of the third band gap is 45.76–57.03 THz, which is large and encompasses our target frequency range of about 46–50 THz.
The existence of band gaps in the perfect PTC allows us to create a defect as a cavity to confine energy. We designed a 5-μm-long grating-free zone in the center area of the periodic structure to break the periodicity, and thus an optical resonant cavity was created. The modal analysis was also employed to find the defect modes for the defect structure that has 20 gratings, with 10 gratings on each side of the cavity. Five resonant defect modes (modes A to E) were obtained and indicated in the band diagram of the perfect PTC (Figure 4a). Modes A and B are located in the third band gap, and modes C, D, and E are located in the fourth band gap, a higher energy band gap. The images of the electric field distribution corresponding to these five modes are shown in Figure 4b. We calculated the ratio of the energy stored in the optical resonant cavity to the total energy of the system. The percentage of the energy stored in the cavity in each mode is compared in Figure 4c. The results indicate that modes B, D, and E have relatively higher ratios of the energy stored in the cavity than other two modes. Among these three defect modes, the resonance frequency of mode B is within our desired frequency range. We, therefore, targeted mode B to trace the fingerprints of A/G-IgG protein and CBP, although its ratio of energy stored in the cavity is less than mode D. It is worth mentioning that mode D could be employed to detect the fingerprints of biochemicals with higher molecular vibration frequencies.

3.1.2. Detection of Molecular Fingerprints and Sensing Performance Evaluation

The sensing performance of the device in the fingerprint detection was studied. The complex refractive indexes of the analytes, A/G-IgG protein, and CBP are shown in Figure 3a,b. External excitations were applied separately to the structure with a bare cavity and to the structure with cavity filled with analyte. The resulting energy spectra corresponding to the bare cavity and analyte-filled cavity are compared in Figure 5, wherein Figure 5a,b respectively illustrate the resonance spectra for protein and CBP. It is noted that the excited modes corresponding to defect modes B and D were generated. It can be found from Figure 4c that these two modes happen to be the modes having higher cavity-stored energy ratios. It is also noted, from the bare-cavity resonance spectrum shown in Figure 5, that the resonance linewidth of mode B is broad, which makes a broadband fingerprint detection possible.
A close examination of Figure 5 reveals that cavity mode B can detect both the fingerprints of protein and CBP. There are noticeable dips (enclosed by circles) observed along the resonance curves of mode B when analytes are placed in the cavity. By comparing Figure 5 with Figure 3, it is noted that the locations of these resonance dips (i.e., associated with energy absorption peaks) are almost identical with the wavelengths where the extinction coefficient reaches maximum values (indicated by gray bars). Since the sharp rise of the extinction coefficient is related to the molecular vibrational modes, the energy absorption peaks (i.e., the dips along the resonance curves) represent the molecular fingerprints. The broad resonance linewidth of the current device makes it possible for broadband fingerprint detections. The vibrational modes of these two analytes with wavenumbers between 1450 cm−1 and 1660 cm−1 were all detected. That is, the energy absorption peaks that are separated by a wavelength difference as large as about 880 nm (from 6.02 μm to 6.90 μm) were captured, although at the expense of quality factor Q and FOM. Unlike the resonance associated with mode B, excited mode D does not carry any fingerprint information for the analytes considered. Nonetheless, mode D is capable of detecting the fingerprints of the analytes with higher molecular vibration frequencies, which implies that our device is capable of multi-mode sensing.
In addition to the importance of the fingerprint displaying in the resonance curves, the resonance shift alone is also a valuable information in many sensing applications, such as concentration determination and substance identification among a limited number of substances with a significant RI difference. It is noted that the resonance spectra of mode B disperse into several peaks and dips in the molecular vibration zone as displayed in Figure 5. To estimate the resonance wavelengths and resonance shifts, resonance spectra associated with mode B were fitted using a single-peak Lorenz fitting function as illustrated in Figure 5 by using dashed curves. It can be observed from Figure 5 that mode D has large resonance wavelength shifts in both biochemical sensing. Meanwhile, mode B has even larger resonance shifts, which implies a large value of sensitivity. The effective sensitivities and FOMs corresponding to modes B and D in sensing both protein and CBP were calculated and are presented in Table 1 as given below.
In this table, the following data are listed: the resonance wavelengths corresponding to bare cavity (λb) and analyte-filled cavity (λa), resonance wavelength shift (Δλr) (= λa − λb), effective RIs corresponding to bare cavity (neff,b) and analyte-filled cavity (neff,a), change in effective RI (Δneff) (= neff,a − neff,b), the full width at half maximum (FWHM) of resonance for the analyte-filled cavity, the calculated effective sensitivity (Seff) (= Δλr/Δneff), and the FOM (= Seff/FWHM). The effective RIs for both the empty cavity and analyte-filled cavity were calculated by using the mode analysis module in COSMOL. Sensitivity is one of the important parameters for judging the performance of a sensor. In this study, we employed the effective sensitivity instead of conventional sensitivity (S) (= Δλr/Δn). The conventional sensitivity, according to its definition, takes into account only the change in the RIs (Δn) of analytes. However, it is noted that the effective RI (neff) considers the effect of both the resonant cavity structure and optical properties of samples. Therefore, the effective sensitivity defined here can reflect more realistically the influence of analytes upon the optical properties of the resonant cavity-based sensors than the conventional sensitivity. Table 1 shows that, for mode B, the values of effective sensitivity for sensing A/G-IgG protein and CBP are 7000 and 6682 (nm/RIU), respectively. For mode D, the values of effective sensitivity for protein and CBP are 2864 and 3005 (nm/RIU), respectively. It is noted that those sensitivity values are significantly larger than 714 nm/RIU, a value reported by Zhu et al. [40]. The FOMs corresponding to mode B are 4.56 and 4.40 (1/RIU) for protein and CBP. Meanwhile, FOMs associated with mode D are 23.1 and 20.2 (1/RIU) for protein and CBP. Although those FOM values, especially in the fingerprint detection mode B, are typically smaller than the FOM based on different sensing, such as glucose concentration determination [15], they are comparable to the FOM values reported from other fingerprint detection studies [2]. It is a challenge in designing a fingerprint-detectable sensor to have high values in both sensitivity and FOM. The broadband fingerprint detection can be accomplished only if the resonance has a broad linewidth (that is, having a large FWHM), which in general will diminish the value of FOM (=Seff/FWHM).

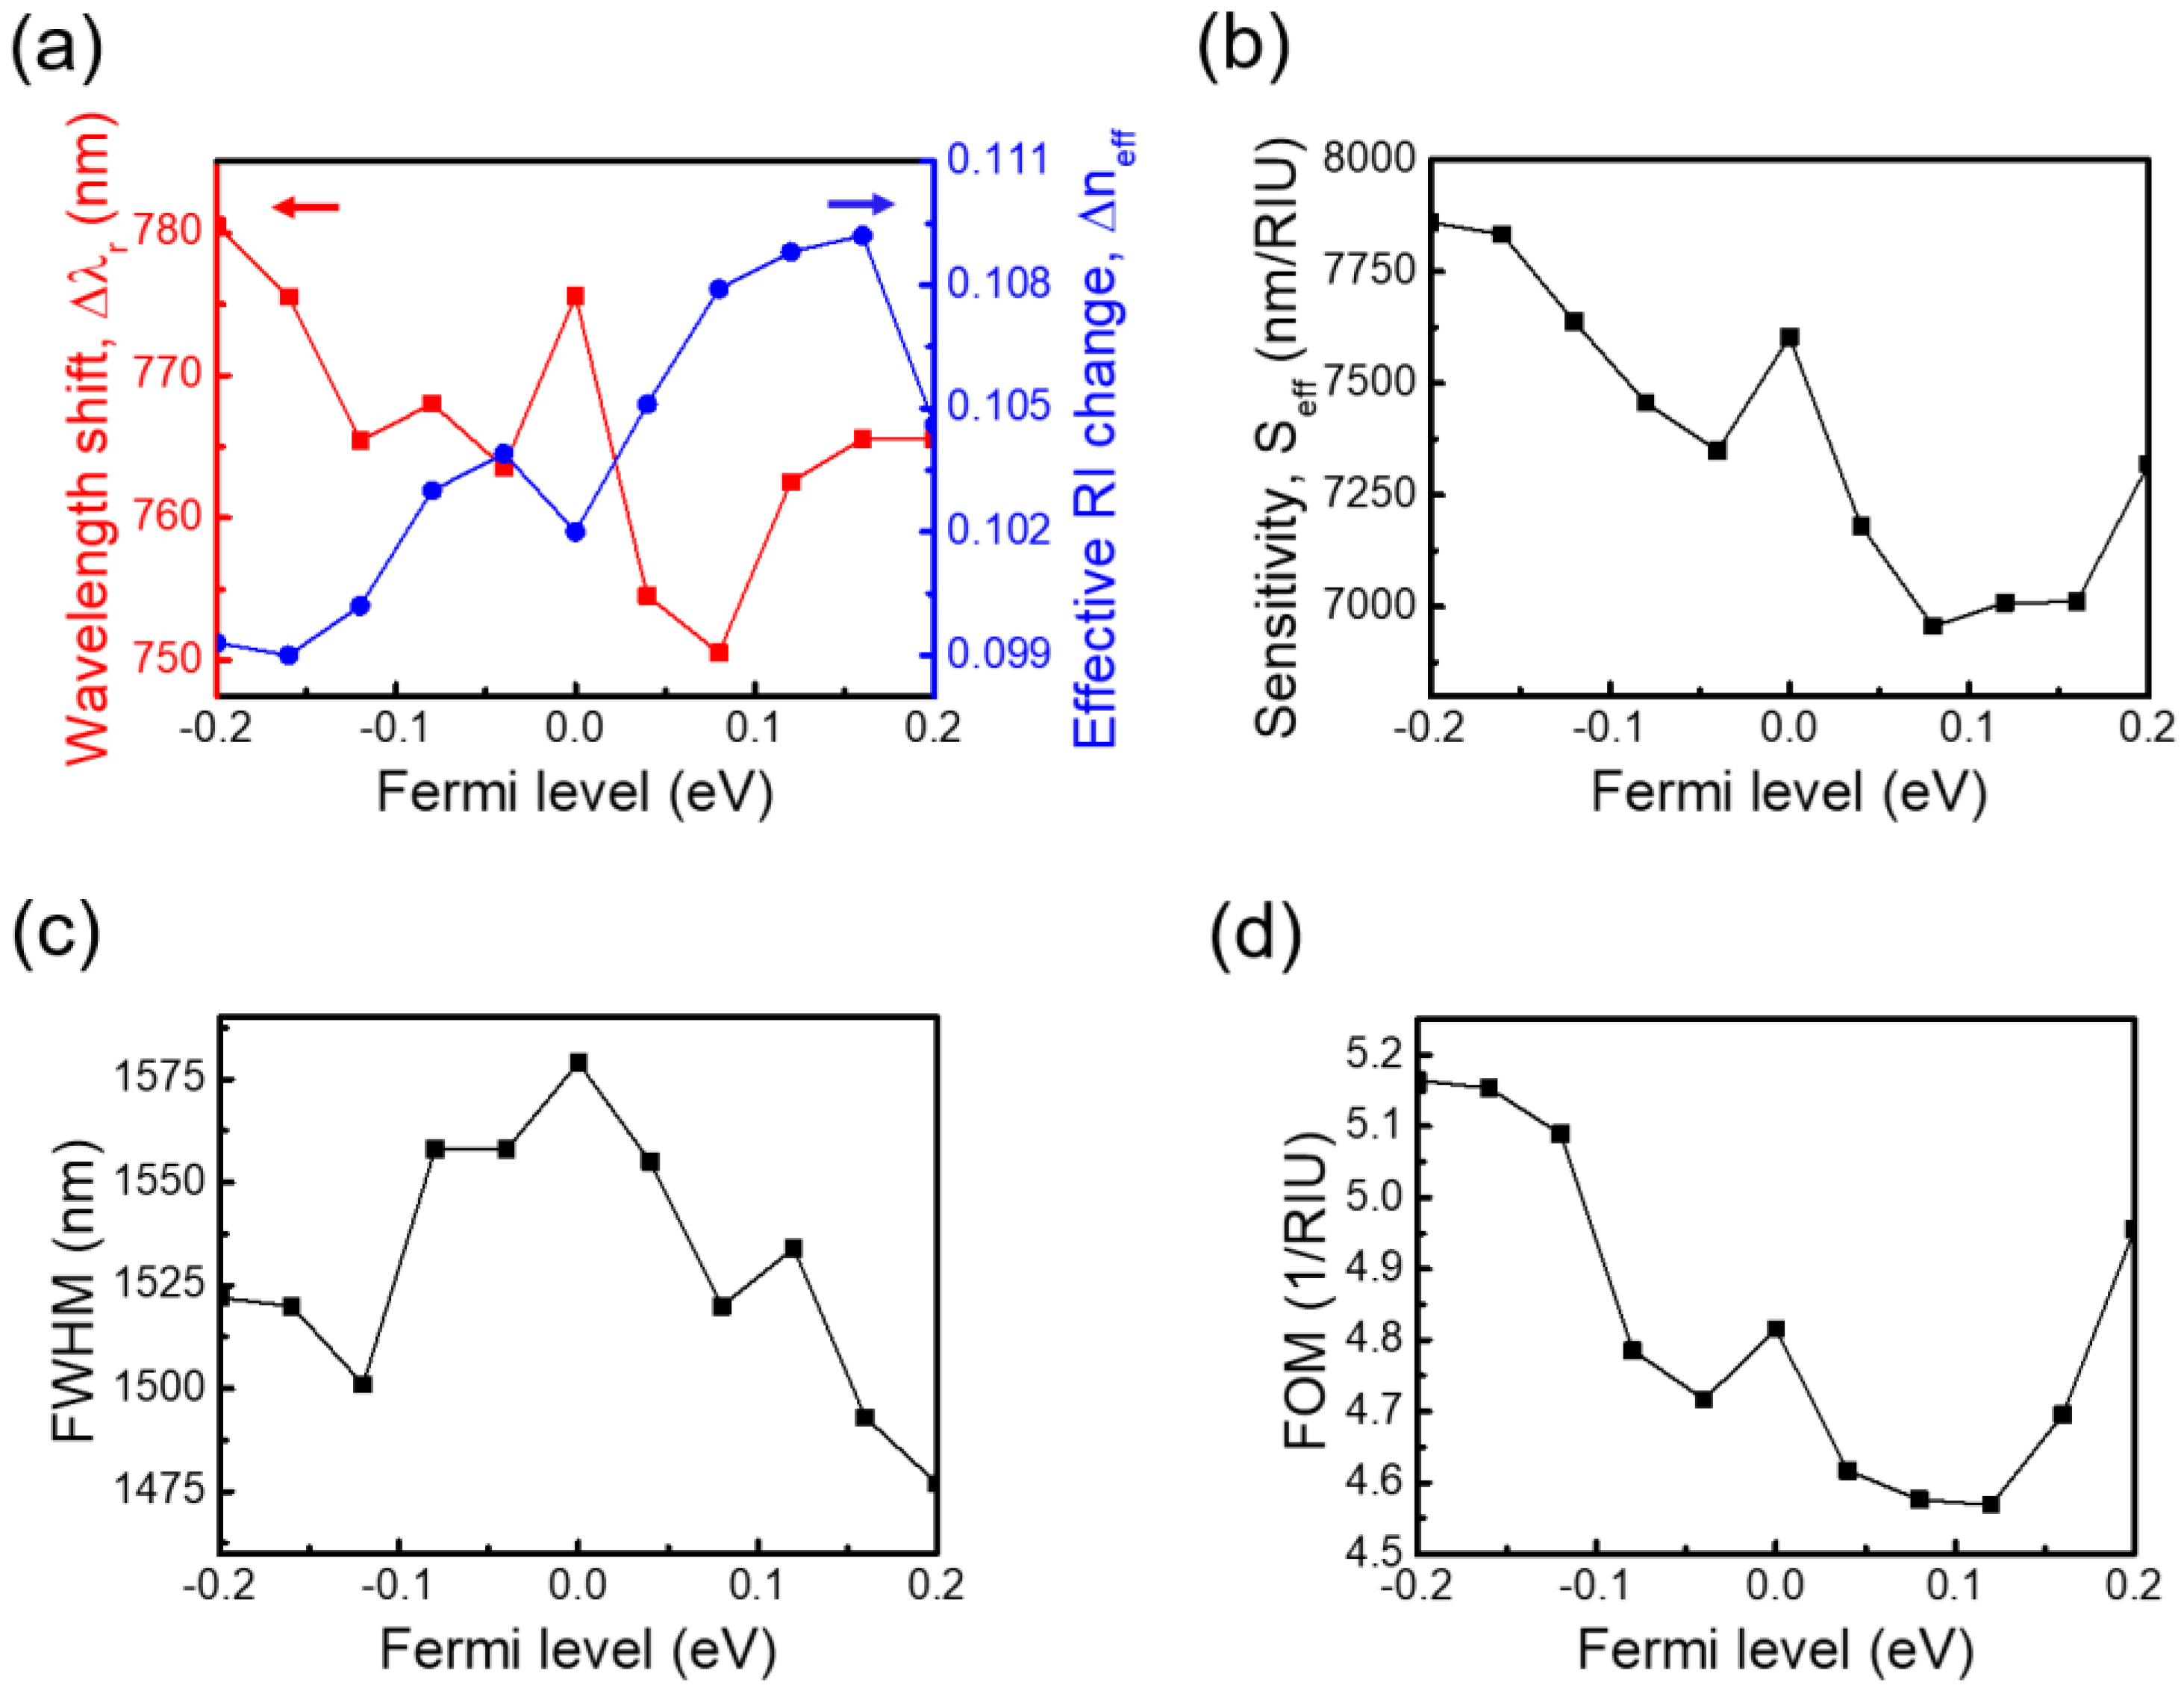
3.1.3. Effect of Graphene’s Tunability on the Sensing Performance

In this study, we consider that different bias voltages are applied to graphene to change its Fermi’s levels, and consequently the resonant cavity’s optical properties are changed as well. The range of the Fermi levels considered is from −0.2 to 0.2 eV. The complex conductivities of graphene corresponding to various Fermi’s levels are shown in Figure 2. We analyzed the influence of Fermi’s level on the tunability of the plasmon resonance by evaluating the sensing performance of mode B in the protein detection. First, the resonance wavelength shifts and effective RI changes corresponding to various Fermi’s levels are shown in Figure 6a. The results reveal that Fermi’s levels have significant effects on both the resonance wavelength shifts and cavity’s effective RIs. As a result, the effective sensitivity is also greatly affected by Fermi’s levels; the maximum variation ratio in effective sensitivity is more than 12% as indicated in Figure 6b. In addition, the influences of Fermi’s level on the resonance FWHM and the sensor’s FOM are illustrated in Figure 6c,d, respectively. It is noted that the maximum variation ratios in FWHM and FOM are about 6.5% and 12%, respectively. In general, the graphene with Fermi’s level of −0.2 eV yields the best results in the resonance wavelength shift, effective sensitivity, and FOM. This consequence is not a surprise. It is noted from Figure 2 that graphene at Fermi’s level of −0.2 eV has the nearly largest values in both the real and imaginary parts of conductivity for the wavelengths of interest, and graphene under this Fermi’s level behaves more like metals than under other Fermi’s levels. Therefore, the plasmonic effect of graphene at Fermi’s level of −0.2 eV becomes more prominent and consequently increases the sensing performance of the device. It is worth mentioning that Figure 6 shows the relations between the sensing parameters and Femi’s level do not vary smoothly. The main reason for this phenomenon is due to the complexity of wavelength-dependent conductivity at various Fermi’s levels as shown in Figure 2. Figure 6 demonstrates that by modulating graphene’s Fermi level not only the sensor’s performance can be increased, but also it is possible to shift the resonance wavelength for a possible broadband fingerprint detection.

3.2. Accoustic Results

The newly designed sensor possesses dual photonic-phononic bandgaps. Therefore, it is possible to use our proposed device to conduct phononic sensing for biochemicals. Firstly, the eigen-analysis for the perfect structure and defect structure was conducted to construct a band diagram and find defect modes. The defect modes determined from the modal analysis were seen to be consistent with the resonant defect modes obtained by using an elastic incidence wave. Then, the elastic wave of external excitation was applied to perform the phononic sensing of two proteins, namely collagen and HIV-1 protease, which was characterized by different resonance shifts.

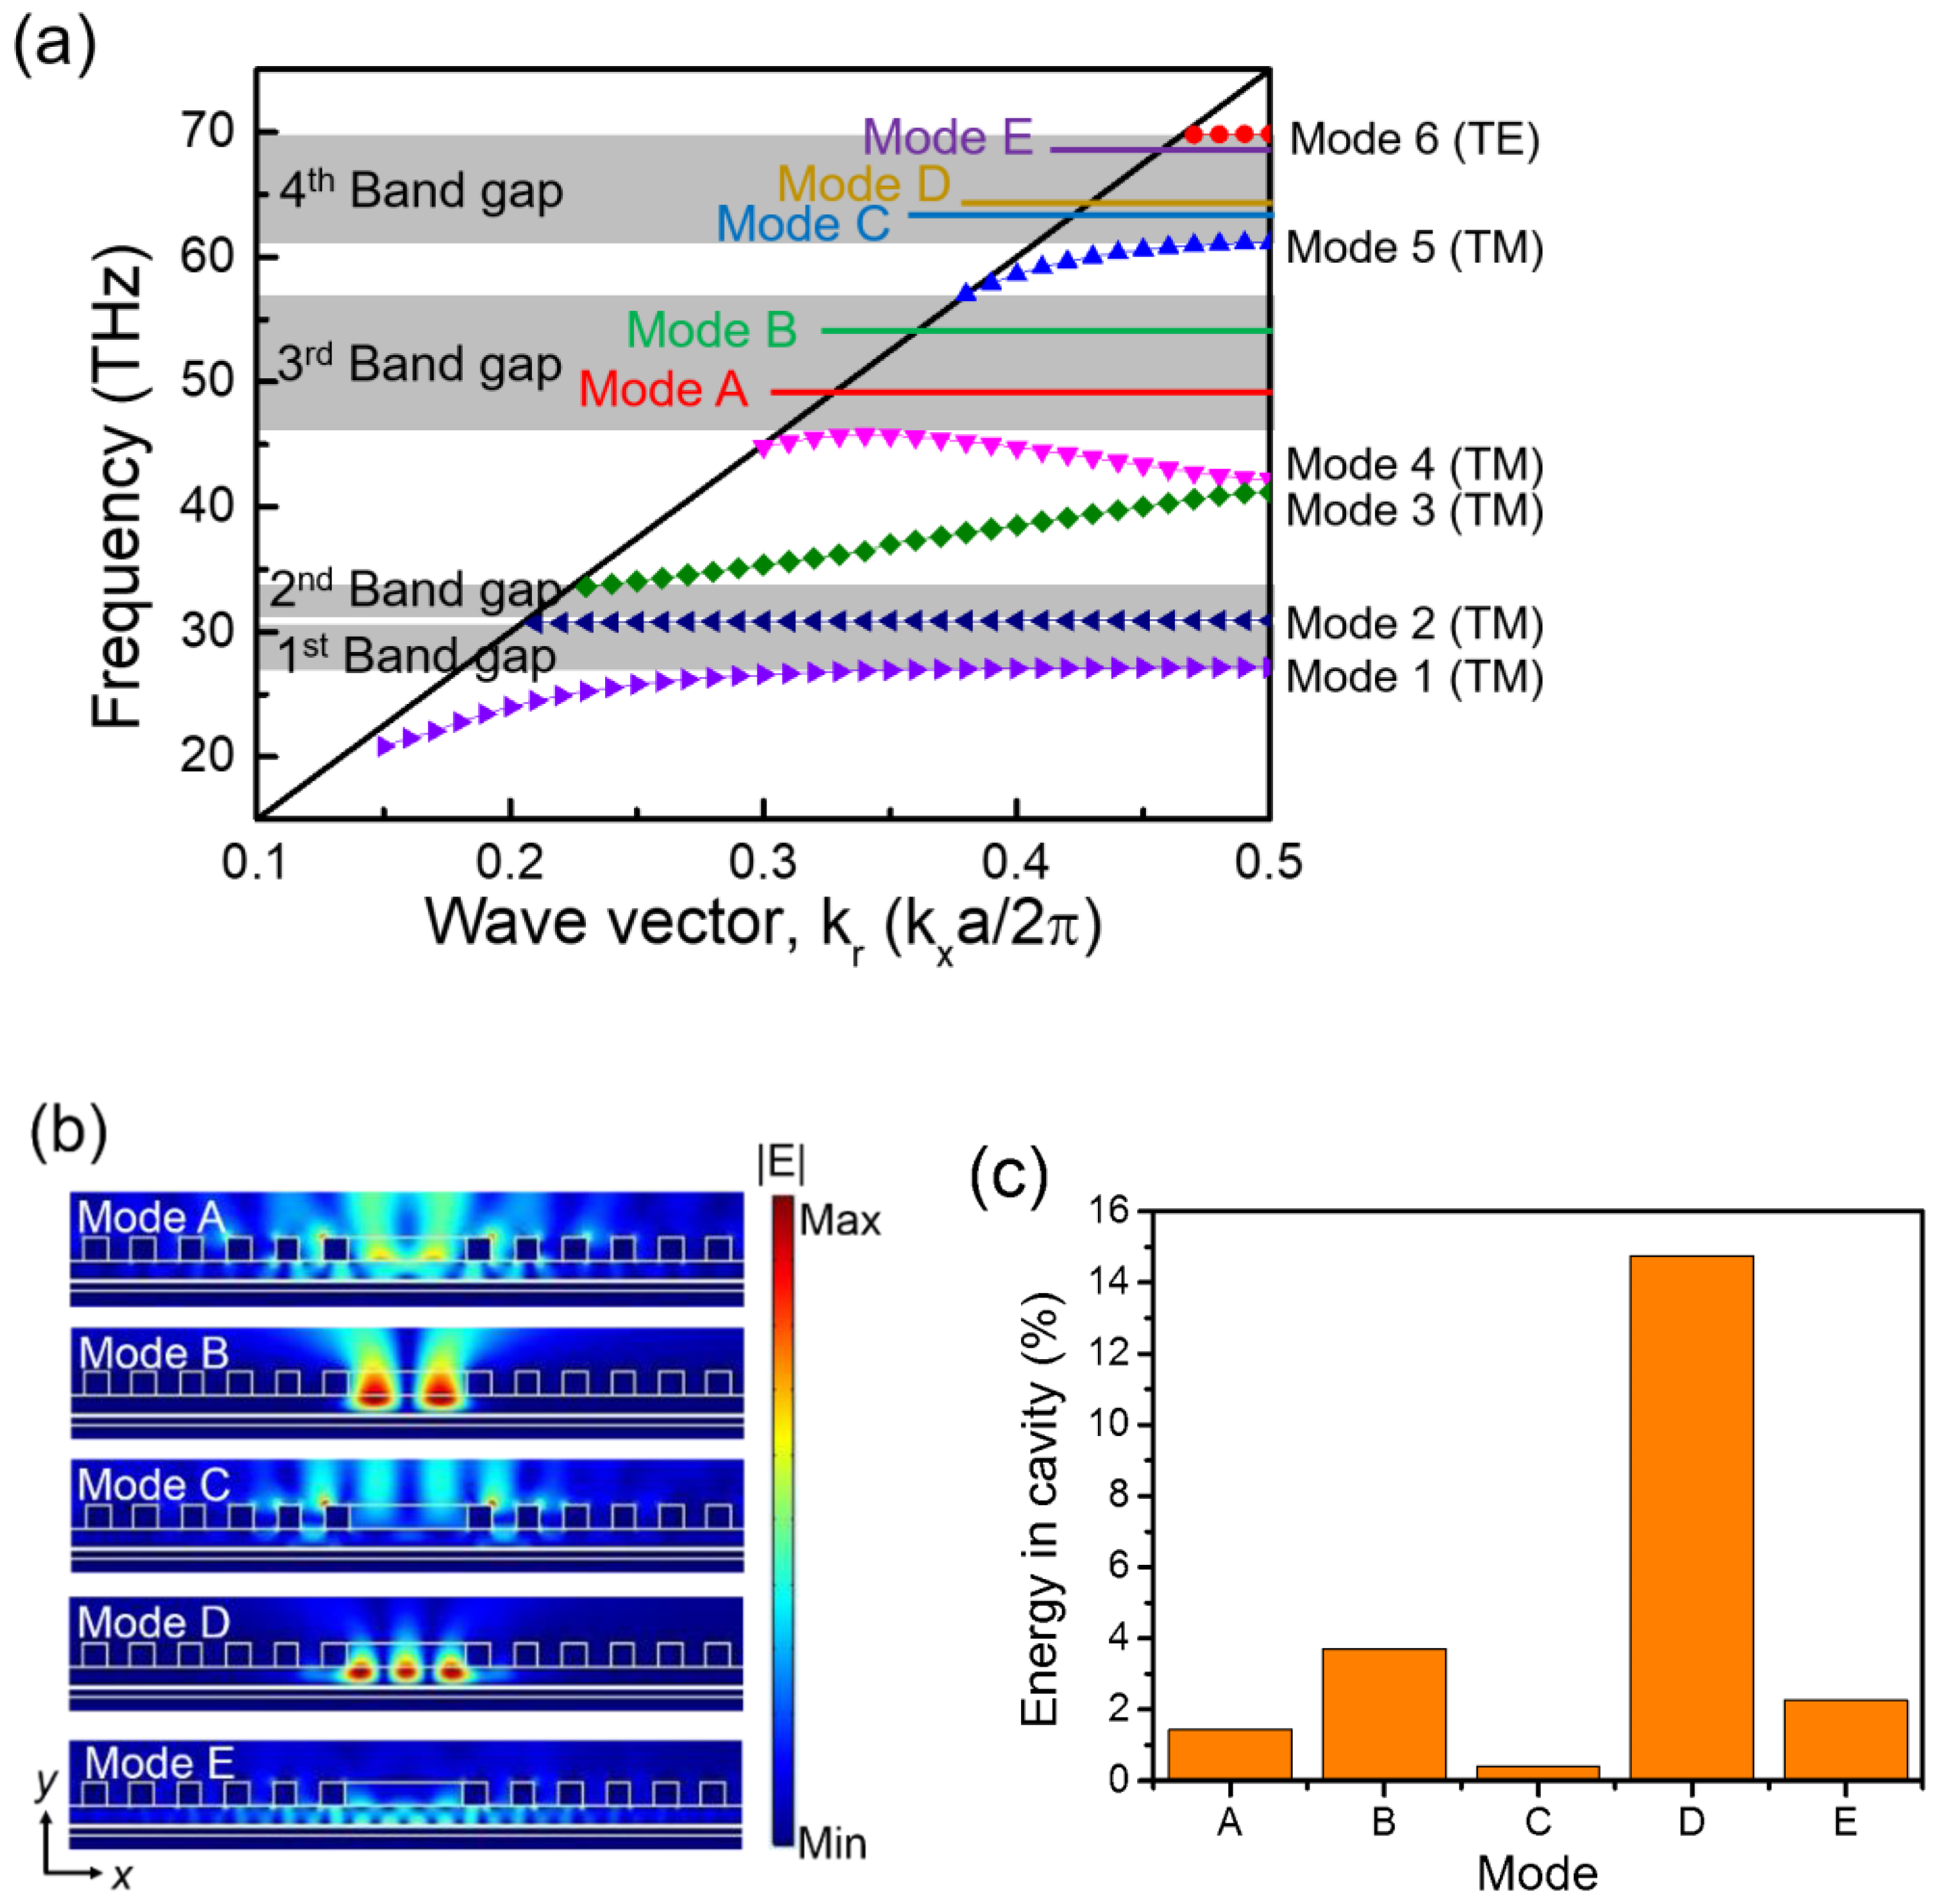
3.2.1. Band Diagram and Defect Modes

The existence of the bandgap is essential for a cavity structure. Firstly, we conducted the elastodynamic eigen-analysis based on the unit cell model of the perfect crystal. All components of the sensor were treated as elastic materials. The resulting band diagram is shown in Figure 7a, in which the phononic dispersion curves are indicated by dotted lines, and two band gaps were observed. The modal analysis was also employed to find the defect modes for the defect structure that has 20 gratings, with 10 gratings on each side of the cavity. Three defect modes were found, named as mode A’, mode B’, and mode C’, in the low-frequency bandgap as indicated in Figure 7a. The resonance frequencies for these three defect modes are 0.712, 0.822, and 1.01 GHz, respectively. The images of the displacement distribution corresponding to these three modes are shown in Figure 7b. These three vibrational modes are characterized by having one, two, and three standing wave packets. The displacement is concentrated in the softer layers of TiO2 and gold, beneath the cavity. These defect modes are seen to be localized in the perfect position to vibrate the analyte in the cavity. The defect modes obtained from modal analysis can be generated by an externally excited elastic wave. The wave was applied at the left end of the defect structure and propagated along the longitudinal direction of the device. The resulting elastic strain energy spectrum is shown in Figure 7c, from which it is noted that mode C’ has a much higher energy density than the other two modes. Therefore, we focus on the acoustic sensing performance of mode C’ hereafter.

3.2.2. Acoustic Sensing of Proteins

Two sample materials, collagen and HIV-1 protease, with different mechanical properties were tested to examine the acoustic sensing characteristics of the sensor. The Young’s modulus, Poisson’s ratio, and mass density for collagen and HIV-1 protease are 32.0 MPa, 0.47, 1700 kg/m3 [41] and 2000 MPa, 0.3, 1473.9 kg/m3 [42], respectively. It is noted that these two proteins are taken to be solids with elastic properties, which neglects the frequency-dependent storage modulus and loss modulus existing in the polymeric materials. Therefore, the highly idealized elastic results presented hereafter should be treated with caution, which may have a large difference from the results based on the more realistically viscoelastic analysis. Furthermore, these two particular samples offer only the preliminary study on the possible phononic sensing of our proposed device, and hence the results do not imply that the current design is ready for a practical usage. The strain energy spectra for the collagen and HIV-1 protease are shown in Figure 8a,b, in which the spectrum associated with the bare cavity is also included for evaluating the shift in resonance frequency. Here, we consider the resonance shifts of the higher energy mode C’. Figure 8a indicates that the resonance peak corresponding to collagen moves from 1.01 GHz to 0.981 GHz with a resonance shift of −0.029 GHz. Meanwhile, for the HIV-1 protease, the resonance peak moves from 1.01 GHz to 0.995 GHz with a shift of −0.015 GHz as displayed in Figure 8b. The FE simulation predicted that collage, having a larger mass density and a smaller stiffness, yields a larger resonance shift than the HIV-1 protease. This outcome can be justified by using the free vibration of a simple spring-mass system as follows.
The free vibration frequency (ω) of an equivalent spring-mass system is ω = (k/m)1/2. Here, k and m are seen as the effective stiffness and effective mass of a complicated structure like our device. The effective stiffness is related to Young’s modulus. According to the afore-mentioned frequency formulation, the resonance frequency of the analyte-free sensor is ωb = (kb/mb)1/2, where kb and mb are the effective stiffness and mass of the sensor with the bare cavity. When an analyte is added to the cavity, the effective stiffness and mass of the sensor become k = kb + Δk and m = mb + Δm, where Δk and Δm are the added stiffness and added mass due to the inclusion of the analyte. A variation of the resonance frequency (Δω) caused by the small variations in effective stiffness and mass (i.e., Δk and Δm) can be derived as:
Δ ω ω b = 1 2 ( Δ k k b Δ m m b )
Note that collagen has a smaller Young’s modulus and a larger mass density than HIV-1 protease, that is, a smaller added stiffness and a larger added mass compared to the HIV-1 protease. Therefore, based on Equation (3), it is clear that collagen has a larger reduction in resonance frequency than the HIV-1 protease, which is consistent with the FE result.

4. Conclusions

In this work, we demonstrated a graphene-based hybrid plasmonic-photonic biochemical sensor that can be used to detect molecular fingerprints. The device is a photonic/phononic bandgap structure equipped with a resonant cavity, wherein most of the energy is confined. The device can be used to conduct both photonic and acoustic sensing. The sensor we proposed has a resonance wavelength shift as large as 1323 nm with an effective sensitivity as high as 6682 nm/RIU. The resonance spectrum has a large resonance linewidth that can offer a broadband fingerprint detection. The molecular fingerprints can be unequivocally identified from the energy absorption peaks in the resonance spectrum. The broadband recognition of the molecular vibration modes of biochemicals were exemplified by the detection of molecular vibration bands of protein and CBP. The detected vibration bands cover a range of wavenumbers from 1450 to 1660 cm−1. Moreover, the graphene-enabled electrical tunability is another important feature of our device. By manipulating the Fermi level, the sensor’s performance can be increased. In addition to the above-mentioned features of photonic sensing, our cavity-based sensor also possesses phononic bandgaps that can be used for phononic sensing, which offers another advantage over other types of biochemical sensors. The acoustic sensing ability was illustrated by testing collagen and HIV-1 protease. Different resonance shifts were observed for the materials having different mechanical properties. The dual photonic-phononic sensing provided by our sensor can further improve the selectivity in analyte detection.
Despite the fact that numerical analysis indicates our proposed device has ability in dual photonic/phononic sensing and molecular fingerprint detection, there are still many challenges that need to be overcome for the maximization and realization of our current design. For example, the deviation in geometry due to the fabrication process may greatly affect the performance of the device. Therefore, a study on the influence of fabrication tolerance is an important task. The graphene’s tunability of our cavity-based sensor is not very significant; there is a need to restructure the design to increase the graphene’s tunability for a larger resonance shift. In the current phononic protein sensing, the analysis is based on the elastic model, which neglects the effect of viscous damping. The viscoelastic analysis is required to obtain more realistic results and reduce the possible discrepancy that exists between the numerical analysis and experimental results. The uncoupled approach was adopted in the current photonic/phononic analysis. A coupled analysis can be conducted to exploit the optomechanical effect for enhancing the performance of the photonic sensing, especially for a flexible phoxonic crystal. Another important aspect is that the liquid sensing of proteins is more favorable than the sensing of solid substances. Therefore, a modification of our design for photonic/phononic liquid sensing should be considered.

Author Contributions

C.-S.Y., N.-N.H. and T.-R.L. initiated the work. Y.-S.C. and Y.-C.H. performed the numerical simulation and modeling supervised by C.-S.Y., C.-H.L., J.-C.H., N.-N.H. and T.-R.L. The manuscript was written by C.-S.Y., Y.-S.C. and N.-N.H. The fabrication process was discussed by J.-T.H., C.-Y.C., C.-R.Y. and Y.-T.L. All authors have discussed the results and commented on the manuscript. All authors have read and agreed to the published version of the manuscript.

Funding

This study was supported by the Minister of Science and Technology, Taiwan, grant MOST 107-2112-M-003-014-MY3, 105-2221-E-019-049-MY3, 108-2221-E-019-055-MY3, and 108-2221-E-019-057-MY3, respectively.

Acknowledgments

The insightful comments and suggestions from the reviewers are much appreciated. The authors also want to thank Yen-Fu Lin, Qi-Yan Zheng, and Tzu-Yu Hung for the valuable discussions.

Conflicts of Interest

The authors declare no conflict of interest.

References

  1. Alvarez-Ordóñez, A.; Prieto, M. Fourier Transform Infrared Spectroscopy in Food Microbiology; Springer: Boston, MA, USA, 2012. [Google Scholar]
  2. Rodrigo, D.; Limaj, O.; Janner, D.; Etezadi, D.; Garcia de Abajo, F.J.; Pruneri, V.; Altug, H. Mid-infrared plasmonic biosensing with graphene. Science 2015, 349, 165–168. [Google Scholar] [CrossRef] [Green Version]
  3. Hong, Q.; Luo, J.; Wen, C.; Zhang, J.; Zhu, Z.; Qin, S.; Yuan, X. Hybrid metal-graphene plasmonic sensor for multi-spectral sensing in both near- and mid-infrared ranges. Opt. Express 2019, 27, 35914–35924. [Google Scholar] [CrossRef]
  4. Isaac, T.H.; Barnes, W.L.; Hendry, E. Determining the terahertz optical properties of subwavelength films using semiconductor surface plasmons. Appl. Phys. Lett. 2008, 93, 241115. [Google Scholar] [CrossRef] [Green Version]
  5. Autore, M.; Li, P.; Dolado, I.; Alfaro-Mozaz, F.J.; Esteban, R.; Atxabal, A.; Casanova, F.; Hueso, L.E.; Alonso-González, P.; Aizpurua, J.; et al. Boron nitride nanoresonators for phonon-enhanced molecular vibrational spectroscopy at the strong coupling limit. Light Sci. Appl. 2018, 7, 17172. [Google Scholar] [CrossRef]
  6. Spadavecchia, J.; Barras, A.; Lyskawa, J.; Woisel, P.; Laure, W.; Pradier, C.M.; Boukherroub, R.; Szunerits, S. Approach for plasmonic based DNA sensing: Amplification of the wavelength shift and simultaneous detection of the plasmon modes of gold nanostructures. Anal. Chem. 2013, 85, 3288–3296. [Google Scholar] [CrossRef]
  7. Li, J.; Ye, J.; Chen, C.; Hermans, L.; Verellen, N.; Ryken, J.; Jans, H.; Van Roy, W.; Moshchalkov, V.V.; Lagae, L.; et al. Biosensing using diffractively coupled plasmonic crystals: The figure of merit revisited. Adv. Opt. Mater. 2014, 3, 176–181. [Google Scholar] [CrossRef]
  8. Semenyshyn, R.; Hentschel, M.; Stanglmair, C.; Teutsch, T.; Tarin, C.; Pacholski, C.; Giessen, H.; Neubrech, F. In vitro monitoring conformational changes of polypeptide monolayers using infrared plasmonic nanoantennas. Nano Lett. 2018, 19, 1–7. [Google Scholar] [CrossRef] [PubMed]
  9. Chen, K.; Adato, R.; Altug, H. Dual-band perfect absorber for multispectral plasmon-enhanced infrared spectroscopy. ACS Nano 2012, 6, 7998–8006. [Google Scholar] [CrossRef] [PubMed]
  10. Farmer, D.B.; Avouris, P.; Li, Y.; Heinz, T.F.; Han, S.J. Ultrasensitive plasmonic detection of molecules with graphene. ACS Photonics 2016, 3, 553–557. [Google Scholar] [CrossRef]
  11. Chen, S.; Autore, M.; Li, J.; Li, P.; Alonso-Gonzalez, P.; Yang, Z.; Martin-Moreno, L.; Hillenbrand, R.; Nikitin, A.Y. Acoustic graphene plasmon nanoresonators for field-enhanced infrared molecular spectroscopy. ACS Photonics 2017, 4, 3089–3097. [Google Scholar] [CrossRef] [Green Version]
  12. Lee, I.-H.; Yoo, D.; Avouris, P.; Low, T.; Oh, S.-H. Graphene acoustic plasmon resonator for ultrasensitive infrared spectroscopy. Nat. Nanotechnol. 2019, 14, 313. [Google Scholar] [CrossRef] [PubMed]
  13. Vasić, B.; Isić, G.; Gajić, R. Localized surface plasmon resonances in graphene ribbon arrays for sensing of dielectric environment at infrared frequencies. J. Appl. Phys. 2013, 113, 013110. [Google Scholar] [CrossRef]
  14. Wang, B.; Dündar, M.A.; Nötzel, R.; Karouta, F.; He, S.; van der Heijden, R.W. Photonic crystal slot nanobeam slow light waveguides for refractive index sensing. Appl. Phys. Lett. 2010, 97, 151105. [Google Scholar] [CrossRef] [Green Version]
  15. Huang, N.-N.; Chung, Y.-C.; Chiu, H.-T.; Hsu, J.-C.; Lin, Y.-F.; Kuo, C.-T.; Chang, Y.-W.; Chen, C.-Y.; Lin, T.-R. Dual photonic-phononic crystal slot nanobeam with gradient cavity for liquid sensing. Crystals 2020, 10, 421. [Google Scholar] [CrossRef]
  16. Amoudache, S.; Pennec, Y.; Rouhani, B.D.; Khater, A.; Lucklum, R.; Tigrine, R. Simultaneous sensing of light and sound velocities of fluids in a two-dimensional phoXonic crystal with defects. J. Appl. Phys. 2014, 115, 134503. [Google Scholar] [CrossRef]
  17. Liang, F.; Clarke, N.; Patel, P.; Loncar, M.; Quan, Q. Scalable photonic crystal chips for high sensitivity protein detection. Opt. Express 2013, 21, 32306–32312. [Google Scholar] [CrossRef]
  18. Rodriguez, G.A.; Markov, P.; Cartwright, A.P.; Choudhury, M.H.; Afzal, F.O.; Cao, T.; Halimi, S.I.; Retterer, S.T.; Kravchenko, I.I.; Weiss, S.M. Photonic crystal nanobeam biosensors based on porous silicon. Opt. Express 2019, 27, 9536–9549. [Google Scholar] [CrossRef]
  19. Qiao, Q.; Xia, J.; Lee, C.; Zhou, G. Applications of photonic crystal nanobeam cavities for sensing. Micromachines 2018, 9, 541. [Google Scholar] [CrossRef] [Green Version]
  20. Aly, A.H.; Mohamed, D.; Zaky, Z.A.; Matar, Z.S.; Abd El-Gawaad, N.S.; Shalaby, A.S.; Tayeboun, F.; Mohaseb, M. Novel biosensor detection of tuberculosis based on photonic band gap materials. Mater. Res. 2021, 24, e20200483. [Google Scholar] [CrossRef]
  21. Panda, A.; Devi, P.P. Photonic crystal biosensor for refractive index based cancerous cell detection. Opt. Fiber Technol. 2020, 54, 102123. [Google Scholar] [CrossRef]
  22. Chakravarty, S.; Chen, X.; Tang, N.; Lai, W.-C.; Zou, Y.; Yan, H.; Chen, R.T. Review of design principles of 2D photonic crystal microcavity biosensors in silicon and their applications. Front. Optoelectron. 2016, 9, 206–224. [Google Scholar] [CrossRef]
  23. Liu, T.L.; Russell, K.J.; Cui, S.; Hu, E.L. Two-dimensional hybrid photonic/plasmonic crystal cavities. Opt. Express 2014, 22, 8219–8225. [Google Scholar] [CrossRef] [PubMed]
  24. Cheng, P.-J.; Huang, Z.-T.; Li, J.-H.; Chou, B.-T.; Chou, Y.-H.; Lo, W.-C.; Chen, K.-P.; Lu, T.-C.; Lin, T.-R. High-performance plasmonic nanolasers with a nanotrench defect cavity for sensing applications. ACS Photonics 2018, 5, 2638–2644. [Google Scholar] [CrossRef]
  25. Yang, C.-S.; Chung, Y.-C.; Cheng, Y.-S.; Hsu, Y.-C.; Chen, C.-F.; Huang, N.-N.; Chen, H.-C.; Liu, C.-H.; Hsu, J.-C.; Lin, Y.-F.; et al. Electrically tunable plasmonic biosensors based on cavity-coupled structure with graphene. IEEE J. Sel. Top. Quantum Electron. 2021, 27, 4601208. [Google Scholar] [CrossRef]
  26. Lucklum, R.; Li, J.; Zubtsov, M. 1D and 2D phononic crystal sensors. Procedia Eng. 2010, 5, 436–439. [Google Scholar] [CrossRef] [Green Version]
  27. Lucklum, R.; Ke, M.; Zubtsov, M. Two-dimensional phononic crystal sensor based on a cavity mode. Sens. Actuators B Chem. 2012, 171, 271–277. [Google Scholar] [CrossRef]
  28. Oseev, A.; Mukhin, N.; Lucklum, R.; Zubtsov, M.; Schmidt, M.-P.; Steinmann, U.; Fomin, A.; Kozyrev, A.; Hirsch, S. Study of liquid resonances in solid-liquid composite periodic structures (phononic crystals)—Theoretical investigations and practical application for in-line analysis of conventional petroleum products. Sens. Actuators B Chem. 2018, 257, 469–477. [Google Scholar] [CrossRef]
  29. Lucklum, R.; Mukhin, N.; Rouhani, B.D.; Pennec, Y. Phononic crystal sensors: A new class of resonant sensors—chances and challenges for the determination of liquid properties. Front. Mech. Eng. 2021, 7, 705194. [Google Scholar] [CrossRef]
  30. Khateib, F.; Mehaney, A.; Amin, R.M.; Aly, A.H. Ultra-sensitive acoustic biosensor based on a 1D phononic crystal. Phys. Scr. 2020, 95, 075704. [Google Scholar] [CrossRef]
  31. Lucklum, R.; Zubtsov, M.; Oseev, A. Phoxonic crystals—a new platform for chemical and biochemical sensors. Anal. Bioanal. Chem. 2013, 405, 6497–6509. [Google Scholar] [CrossRef]
  32. Amoudache, S.; Moiseyenko, R.; Pennec, Y.; Rouhani, B.D.; Khater, A.; Lucklum, R.; Tigrine, R. Optical and acoustic sensing using Fano-like resonances in dual phononic and photonic crystal plate. J. Appl. Phys. 2016, 119, 114502. [Google Scholar] [CrossRef] [Green Version]
  33. Ma, T.X.; Wang, Y.S.; Zhang, C.; Su, X.X. Theoretical research on a two-dimensional phoxonic crystal liquid sensor by utilizing surface optical and acoustic waves. Sens. Actuators A Phys. 2016, 242, 123–131. [Google Scholar] [CrossRef]
  34. COMSOL Multiphysics® Modeling Software. Available online: https://www.comsol.com/ (accessed on 16 August 2021).
  35. Emani, N.K.; Kildishev, A.V.; Shalaev, V.M.; Boltasseva, A. Graphene: A dynamic platform for electrical control of plasmonic resonance. Nanophotonics 2015, 4, 214–223. [Google Scholar] [CrossRef] [Green Version]
  36. Gallagher, P.; Yang, C.-S.; Lyu, T.; Tian, F.; Kou, R.; Zhang, H.; Watanabe, K.; Taniguchi, T.; Wang, F. Quantum-critical conductivity of the Dirac fluid in graphene. Science 2019, 364, 158–167. [Google Scholar] [CrossRef] [PubMed]
  37. Geim, A.K.; Novoselov, K.S. The rise of graphene. Nat. Mater 2007, 6, 183–191. [Google Scholar] [CrossRef] [PubMed]
  38. Llatser, I.; Kremers, C.; Cabellos-Aparicio, A.; Jornet, J.M.; Alarcón, E.; Chigrin, D.N. Graphene-based nano-patch antenna for terahertz radiation. Photonics Nanostruct.-Fundam. Appl. 2012, 10, 353–358. [Google Scholar] [CrossRef] [Green Version]
  39. Yao, Y.; Kats, M.A.; Genevet, P.; Yu, N.; Song, Y.; Kong, J.; Capasso, F. Broad electrical tuning of graphene-loaded plasmonic antennas. Nano Lett. 2013, 13, 1257–1264. [Google Scholar] [CrossRef]
  40. Zhu, W.; Xu, T.; Wang, H.; Zhang, C.; Deotare, P.B.; Agrawal, A.; Lezec, H.J. Surface plasmon polariton laser based on a metallic trench Fabry-Perot resonator. Sci. Adv. 2017, 3, e1700909. [Google Scholar] [CrossRef] [Green Version]
  41. Yang, Y.; Chiao, Y.A.; Wang, Y.; Voorhees, A.; Han, H.C.; Lindsey, M.L.; Jin, Y.F. Mathematical modeling of left ventricular dimensional changes in mice during aging. Yang T, Chiao Y A, Wang Y; et al. Mathematical modeling of left ventricular dimensional changes in mice during aging. BMC Syst. Biol. 2012, 6, 1–12. [Google Scholar] [CrossRef] [Green Version]
  42. Hsu, C.-F. Application of Finite Element Method in Protein Normal Mode Analysis. Master’s Thesis, University of Massachusetts Amherst, Amherst, MA, USA, 2013. [Google Scholar]
Figure 1. The geometrical shape of the proposed resonant-cavity plasmonic-photonic biochemical sensor: (a) the three-dimensional illustration of the sensor; (b) the sectional view of the sensor.
Crystals 11 01175 g001
Figure 2. The relations of (a) the real part and (b) the imaginary part of graphene’s conductivity, respectively, with respect to the wavelength at various Fermi’s levels.
Crystals 11 01175 g002
Figure 3. Complex refractive indices for (a) A/G-IgG protein and (b) CBP.
Crystals 11 01175 g003
Figure 4. (a) The energy band diagram of the periodic structure of a perfect crystal and the defect modes within the band gaps; (b) the electric field distribution of the five resonant defect modes; (c) the percentage of the energy stored in the resonant cavity in each mode.
Crystals 11 01175 g004
Figure 5. Fingerprint detection (marked by blue circles) and resonance shift (marked by red arrows) estimation, determined from the resonance spectra corresponding to (a) bare cavity and protein-filled cavity; (b) bare cavity and CBP-filled cavity (EF = 0.12eV).
Crystals 11 01175 g005
Figure 6. Influence of Fermi’s level on (a) resonance wavelength shifts (red line) and changes in effective refractive indexes (blue line); (b) effective sensitivity; (c) FWHMs; (d) FOMs (mode B and protein detection are considered here).
Crystals 11 01175 g006
Figure 7. (a) Acoustic dispersion curves of the periodic structure of a perfect crystal and the defect modes within the band gaps; (b) the deformation and displacement distributions corresponding to the three resonant defect modes; (c) the strain energy spectrum of the excited defect structure.
Crystals 11 01175 g007
Figure 8. Resonance frequency shifts associated with mode C’, determined from the elastic strain energy spectra for the bare cavity and analyte-filled cavity: (a) cavity filled with collagen; (b) cavity filled with HIV-1 protease.
Crystals 11 01175 g008
Table 1. The effective sensitivities and FOMs of modes B and D in sensing A/G-IgG protein and CBP (EF = 0.12 eV).
ModeAnalyteλb
(nm)
λa
(nm)
Δλr
(nm)
neff,bneff,aΔneffFWHMSeff
(nm/RIU)
FOM
(1/RIU)
BProtein546462277631.0391.1480.109153470004.56
BCBP5464678713231.0391.2370.198152066824.40
DProtein468049752951.2531.3560.103124286423.1
DCBP468052635831.2531.4470.194149300520.2
Publisher’s Note: MDPI stays neutral with regard to jurisdictional claims in published maps and institutional affiliations.

