1. Introduction
In crystal growth, the induction time is defined as the time interval between the establishment of the supersaturated state and the formation of detectable nuclei. The metastable-zone-width (MSZW) limit is defined as the time taken at a given cooling rate between the establishment of the supersaturated state and the formation of detectable nuclei. Nucleation is the initial process for the formation of crystals in liquid solutions. Thus, both the induction time and MSZW data are related to the nucleation rate of the crystallized substance in solutions. In classical nucleation theory (CNT) [
1,
2,
3], the nucleation rate is expressed in the Arrhenius form, governed by two nucleation parameters, including the interfacial free energy and pre-exponential nucleation factor. The interfacial free energy is the energy required to create a new solid/liquid interface for the formation of crystals in liquid solutions, while the pre-exponential factor is related to the attachment rate of solute molecules to a cluster in the formation of crystals. The influences of impurities on the nucleation parameters have long been investigated using induction time or MSZW data with the addition of different impurities in solutions for a variety of compounds [
4,
5,
6,
7,
8,
9,
10,
11,
12,
13,
14].
The nucleation parameters of a crystallized substance have been traditionally determined from induction time data by assuming
, where
is nucleation rate [
1]. Recently, various methods have been proposed to calculate the nucleation parameters from MSZW data [
15,
16,
17,
18,
19,
20,
21]. Although the induction time and MSZW processes are two different temperature-controlling methods for determination of the nucleation parameters in a crystallization system, a model should be available to relate the induction time and MSZW data with the nucleation parameters. Furthermore, as a cooling process is applied first to reach the desired operating temperature and then a constant temperature is adopted in the induction time measurements, there always exists a lag time between the prepared supersaturated solution being at a higher temperature and it being cooled to the desired lower constant temperature. For simplicity, the lag time is usually neglected in determining the nucleation parameters from the induction time data.
The nucleation process can behave differently. For certain systems, induction time cannot even be considered due to sharp phase transition, while for some cases there is induction time governed by different material properties. For example, by evaporating a cellulose nanocrystal-based cholesteric drop, the drop edges are pinned to the substrate, which leads to nonequilibrium sliding of the individual cholesteric fragment with active ordering [
22]; following the induction period of cholesteric collagen tactoids, phase separation goes through the nucleation process during which multiple chiral nuclei spontaneously emerge and grow throughout the continuous isotropic phase [
23]. In the present work, a model was proposed based on CNT to relate the induction time and MSZW data with the nucleation parameters for the systems with an experimentally measurable nucleation point. The proposed model was then applied to determine the nucleation parameters for the aqueous
l-glycine solutions in the presence of
l-arginine impurity from the induction time and MSZW data. The effects of lag time on the nucleation parameters within the induction time data were investigated.
l-glycine was adopted in this work as it is the simplest amino acid and is often used as a model compound in the study of solution nucleation [
24,
25,
26,
27,
28,
29,
30].
l-arginine is another amino acid which was randomly chosen as impurity in the aqueous
l-glycine solutions.
2. Theory
The nucleation rate according to CNT is expressed as [
1,
2,
3]
where
is the nucleation pre-exponential factor,
is the interfacial free energy,
is the Boltzmann constant,
is the molecular volume,
is the temperature, and
is the supersaturation.
A model is derived based on CNT to determine and by relating the induction time and MSZW data with as follows. If a solution saturated at is cooled to at a constant cooling rate within the time period to and then the temperature is kept at within the time period to , the nucleation event for this combined process is assumed to be detected at . If is small compared to , this combined process can be regard as the induction time process with consideration of the lag time , which is the time required for the solution saturated at to cool to at cooling rate . Thus, and the lag time is given by . This combined process for corresponds to the induction time process without consideration of the lag time. On the other hand, this combined process for corresponds to the MSZW process.
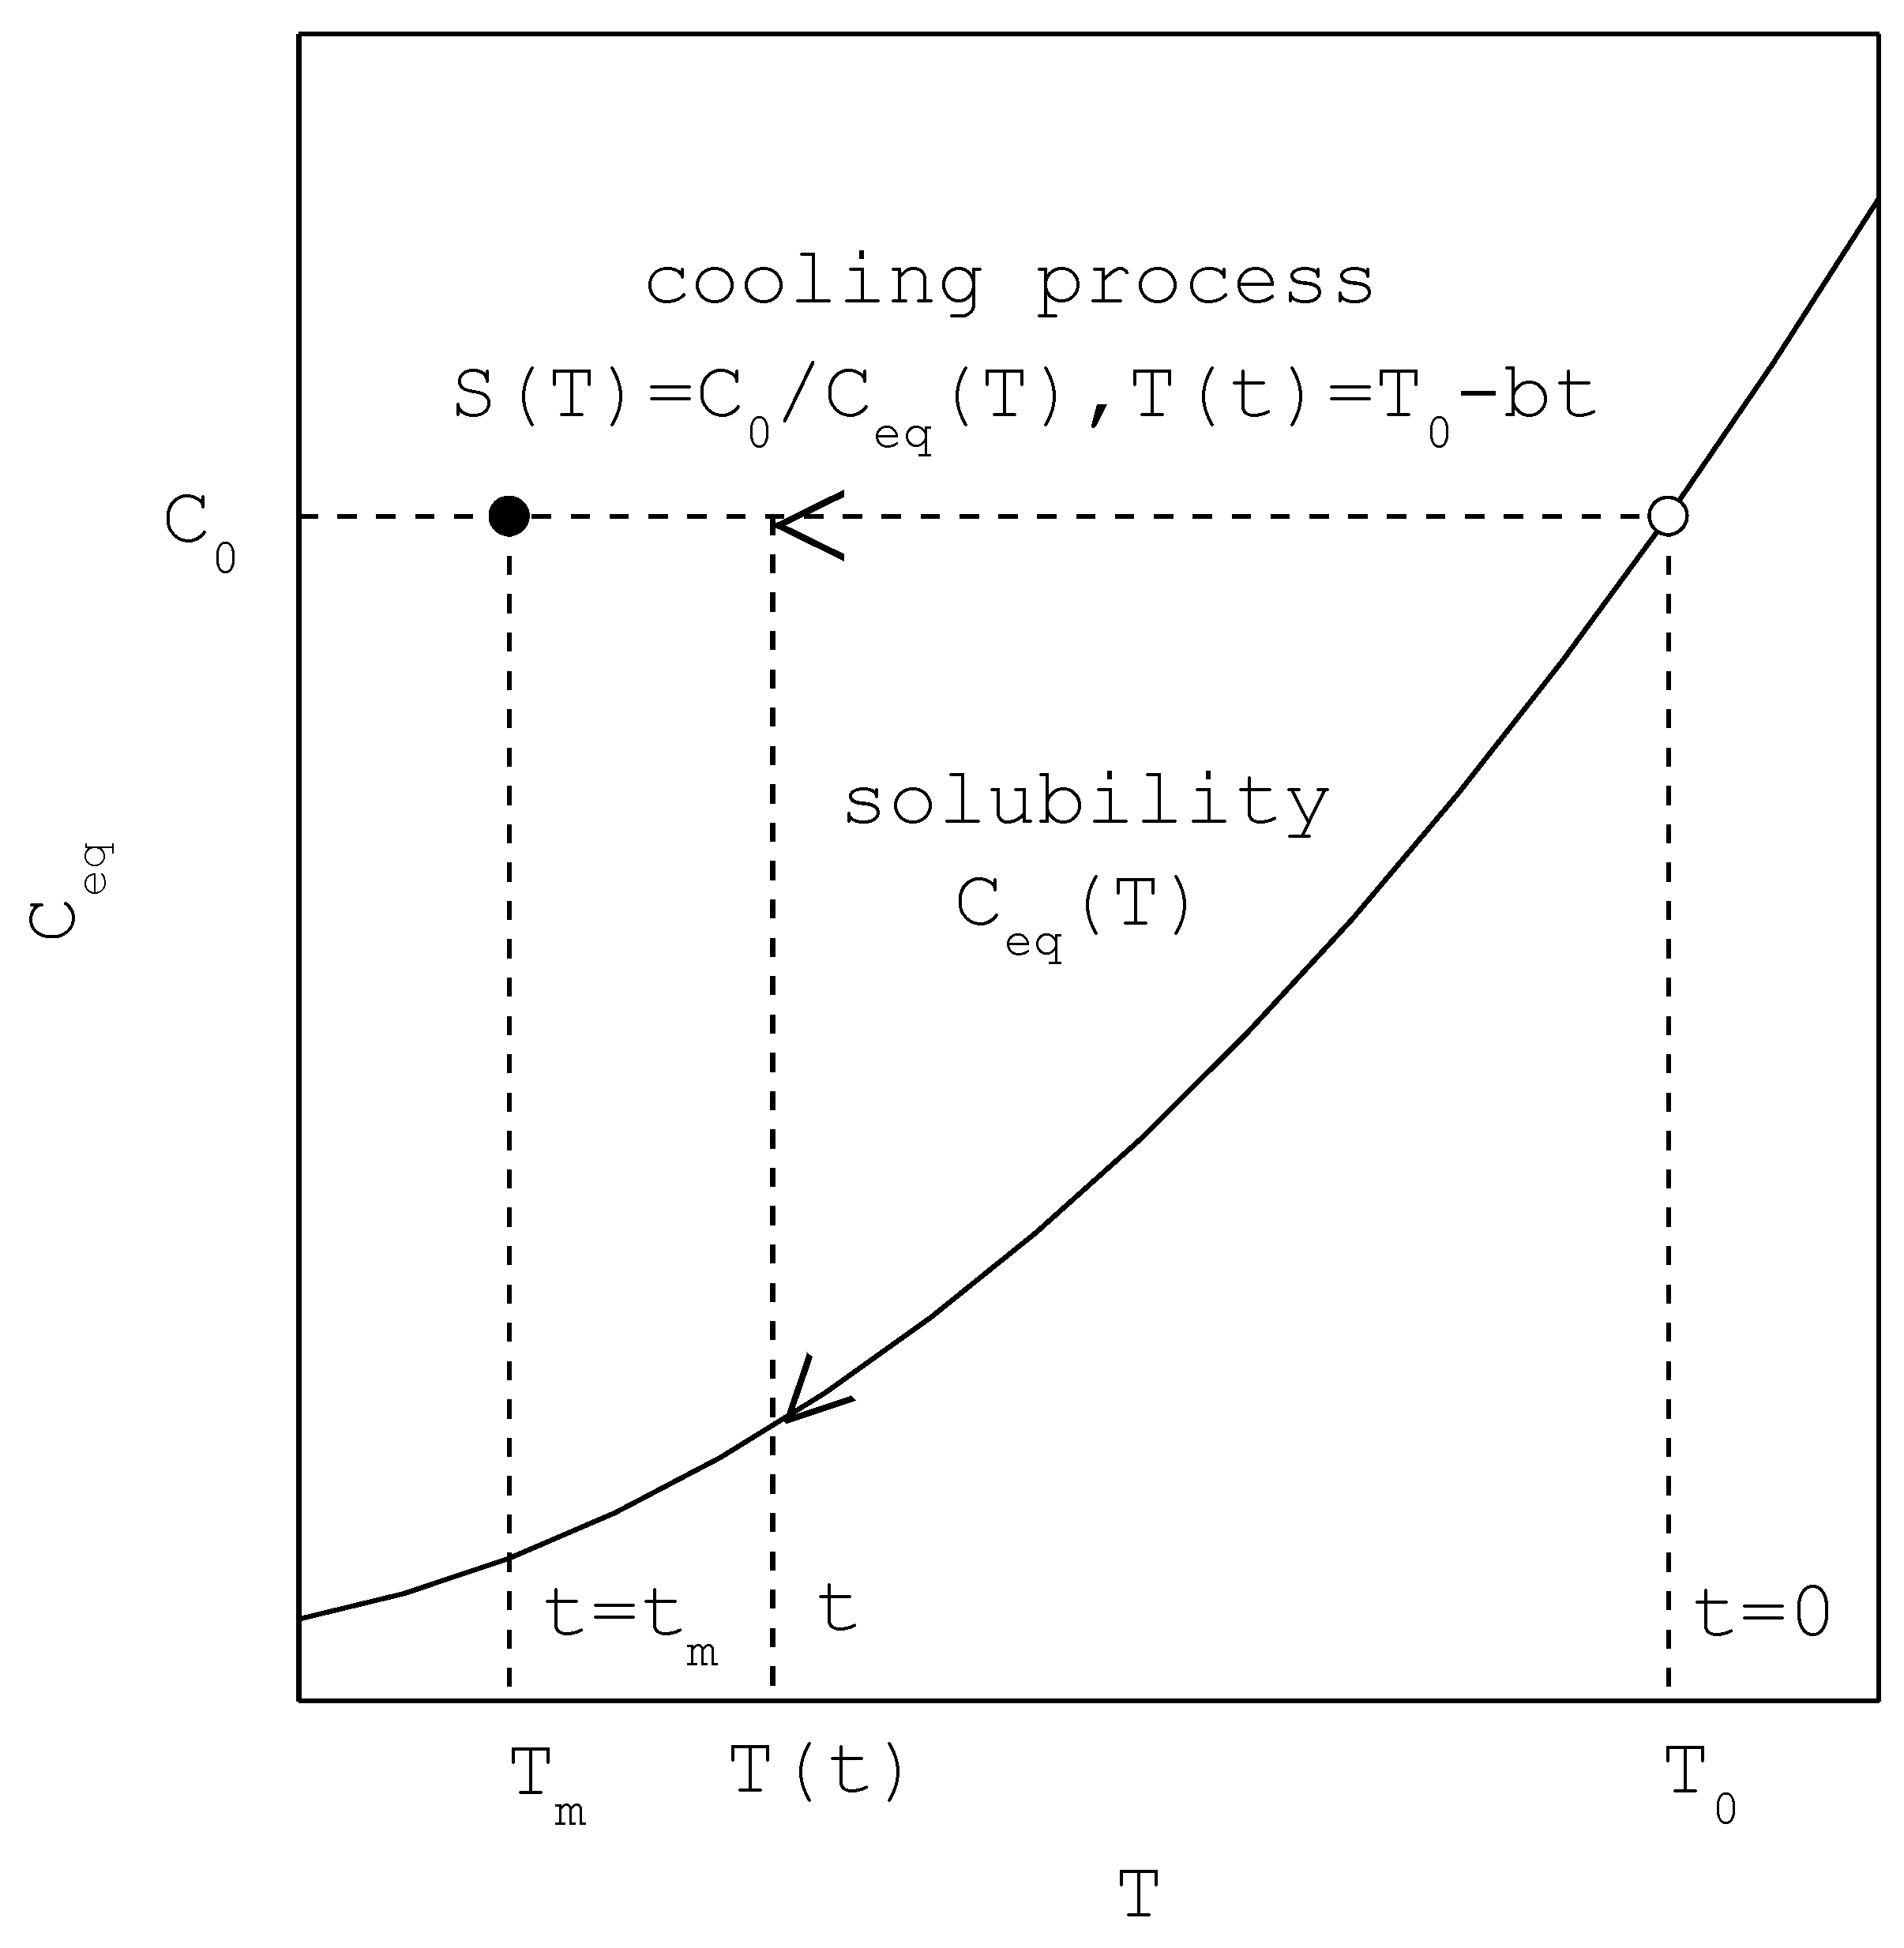
Figure 1 depicts the MSZW process for a saturated solution of
cooled at a constant cooling rate
, where
is the initial saturated temperature at
,
is the nucleation temperature at
,
is the saturated concentration at
,
is the saturated concentration at
,
is the solubility, and
is the supersaturation. As
generally decreases with decreasing temperature,
increases and subsequently
increases with time. For the nucleation point at
,
is the supersaturation at
defined as
. The nucleation rate at
is given by
Note that both and are measures of the MSZW.
As the first appearance of nuclei can be regarded as a random process, the stochastic process of nucleation can be described by the Poisson’s law [
32,
33,
34]. For the combined process described above, as the temperature is cooled from
to
within the time period
to
,
increases and
increases with time; and as the temperature is kept at
within the time period
to
, the supersaturation remains the same at
and
remains the same at
. Based on the given reasoning, the average number of expected nuclei
in a solution volume
within the time period
to
is proposed in this study as
where the first term on the right-hand side represents the average number of expected nuclei generated within the time period
to
and the second term on the right-hand side represents the average number of expected nuclei generated within the time period
to
.
Based on the two-point trapezoidal rule for computing the value of a definite integral, one can derive [
35]
where
and
represent the nucleation rate at
and
, respectively. Note that
at
when
and
.
According to the single nucleus mechanism (SNM) proposed by some researchers through experimental validation [
32,
33,
34], a single primary nucleus is formed in a supersaturated solution, which grows out to a particular size and undergoes secondary nucleation by crystal-stirring-impeller or crystal-wall collision. Based on the assumptions that the growth time between the formation of nucleus and growth to the minimum size for secondary nucleation is negligible, and one secondary nucleation is enough to generate detectable crystal volume increase in a negligible amount of time, the nucleation event is detected after the secondary nucleation of the single primary nucleus. Thus, the nucleation event for the combined process occurs at
when the first nucleus is formed. By substituting
in Equation (3), combining Equations (2)–(4) leads to
Thus, Equation (5) can be applied to determine the nucleation parameters from the induction time data, , with consideration of the lag time, . A plot of versus should give a straight line, the slope and intercept of which permit determination of and , respectively.
Equation (5) for
reduces to
Which corresponds to the conventional method adopted in determination of
and
from the induction time data without consideration of the lag time. Equation (5) for
reduces to
Which can be applied to determine and from the MSZW measurements, where a solution saturated at is cooled at a constant rate from to and the nucleation event is detected at .
If the temperature-dependent solubility is described in terms of the van’t Hoff Equation (1), one obtains
where
is the heat of dissolution and
is the gas constant. Substituting
in Equation (8) into Equation (7) yields
A plot of
versus
based on the MSZW data should give a straight line, the slope and intercept of which permit determination of
and
, respectively. Equation (9) is consistent with the result developed by Shiau and Wu [
21] in determination of
and
from the MSZW data.
3. Experimental Methods
Deionized water,
l-glycine (>99%, Alfa Aesar) and
l-arginine (>98%, ACROS) were used to prepare the desired supersaturated solution for the specified impurity concentration. The experimental apparatus adopted by Shiau and Lu [
18] was used in the study of nucleation, which consists of a 250 mL crystallizer equipped with a magnetic stirrer at a constant stirring rate of 350 rpm, immersed in programmable thermostatic water. A turbidity probe with a near-infrared source (Crystal Eyes manufactured by HEL limited, Hertford, UK) was used to detect the nucleation event.
The solubility of
l-glycine in water from 303 K to 318 K was measured in this work. The solubility measurements indicated that the solubility of
l-glycine in water was nearly not influenced by the presence of
l-arginine ranging from
, which corresponds to
. The measured solubility of
l-glycine in water was consistent with the solubility data reported by Park et al. [
36]. In terms of the van’t Hoff equation for the measured solubility, one obtains
with
and
in this work.
For the induction time and MSZW experiments, a 200 mL aqueous l-glycine solution at the desired concentration was held at 5 K above the saturated temperature for 20 min to ensure a complete dissolution at the beginning of the experiments, which was also confirmed by the turbidity measurement. In the induction time experiments, the induction time and lag time data were measured by rapidly cooling the supersaturated solution at various supersaturations to 303 K. In the MSZW experiments, MSZW data were measured by cooling the solution saturated at 318 K with different constant cooling rates. Each run was carried out at least three times at each condition for the solubility, the induction time, and the MSZW measurements.
Although
l-glycine can be crystallized in different polymorphs, including α-form, β-form and γ-form, α-form is usually obtained from pure aqueous
l-glycine solutions [
24,
25,
26,
27,
28,
29,
30]. In this work, the final dried crystals at the end of the experiments were analyzed using Raman spectroscopy (P/N LSI-DP2-785 Dimension-P2 System, 785 nm, manufactured by Lambda Solutions, INC., Seattle, WA, USA) to validate the polymorph of the
l-glycine crystals. By comparing with the Raman spectra of α-form crystals reported by Murli et al. [
37], it was found that α-form
l-glycine crystals were formed from aqueous
l-glycine solutions in this work for various supersaturations without and with the presence of
l-arginine impurity.
Figure 2 shows some Raman spectra of the
l-glycine crystals obtained in this work at
and
for
and
, respectively.
4. Results and Discussion
The induction time data of aqueous
l-glycine solutions were measured for various supersaturations at 303 K in the presence of
l-arginine for various impurity concentrations,
. The average induction times are listed in
Table 1. The average lag times for the induction time data are listed in
Table 2, which were measured based on
adopted for cooling the heated supersaturated solution to the desired constant temperature. The lag time corresponds to the time required for the heated solution to be lowered to 303 K. Thus, as the temperature range
increases, the lag time increases. The MSZW data of aqueous
l-glycine solutions saturated at
were measured for various
in the presence of
l-arginine for
. The average MSZWs are listed in
Table 3. Note that
,
, and
for
l-glycine.
Table 1 indicates that
increases significantly with increasing
for each
and decreases with increasing
for each
. Thus,
l-arginine exerts a nucleation inhibition effect in aqueous
l-glycine solutions, which increases with increasing
.
Table 2 indicates that
, increases slightly with increasing
for each
and remains nearly independent of
. Note that
corresponds to the temperature range for a solution saturated at
cooled to 303 K, where
increases with increasing
and remains nearly independent of
. For example,
is quite significant compared with
at
for
. On the other hand,
is negligible compared with
at
for
.
Figure 3 shows plots of
against
for each
according to Equation (6) based on the induction time data without consideration of the lag time.
Figure 4 shows plots of
against
for each
according to Equation (5) based on the induction time data with consideration of the lag time. Calculated values of
and
from the slope and intercept of the best-fit plots for each
are listed in
Table 4. Note that the regression coefficient,
, with the lag time is generally greater than that without the lag time for each
, which indicates that Equation (5) with the lag time fits the induction time data better than Equation (6) without the lag time.
As indicated in
Table 4, one can note that the value of
with the lag time,
, is lower by about 2% than that without the lag time,
, while the value of
with the lag time,
, is lower by about 15% than that without the lag time,
. These findings are consistent with
and
derived in
Supplementary Materials.
Table 3 indicates that
increases with increasing
for each
and increases with increasing
for each
. Thus, as similar to the results from the induction time data,
l-arginine exerts a nucleation inhibition effect in aqueous
l-glycine solutions, which increases with increasing
.
Figure 5 shows plots of
against
for various
according to Equation (9) based on the MSZW data. Calculated values of
and
from the slope and intercept of the best-fit plots for each
are listed in
Table 5.
The values of
and
obtained from the MSZW data in
Table 5 are consistent with those obtained from the induction time data in
Table 4. They all indicate that, as
increases,
increases slightly while
decreases quite significantly. For example, as
increases from 0 to
,
only increases slightly in the range of 10% to 30%, while
decreases significantly in the range of 50% to 60%. It is speculated that the presence of
l-arginine in the aqueous
l-glycine solution leads to some
l-arginine molecules adsorbed on the nucleus surface of
l-glycine, which suppresses nucleation and results in a higher
compared to that without
l-arginine adsorbed on the nucleus surface of
l-glycine. On the other hand, the presence of
l-arginine in the aqueous
l-glycine solution suppresses nucleation and results in a lower
compared to that without
l-arginine in the aqueous
l-glycine solution. As the effects of
l-arginine impurity on
and
become more profound at a greater concentration of
l-arginine impurity, a greater
results in a higher
and a lower
. This trend is consistent with the finding reported by Heffernan et al. [
8] for the nucleation of curcumin in propan-2-ol due to the presence of demethoxycurcumin and bisdemethoxycurcumin.


