Article

Co-Deposition Mechanisms of Calcium Sulfate and Calcium Carbonate Scale in Produced Water

1
Oil and Gas Pollution Control and Reservoir Protection Key Laboratory, College of Chemistry and Chemical Engineering, Xi’an Shiyou University, Xi’an 710065, China
2
State Key Laboratory of Petroleum Pollution Control, CNPC Research Institute of Safety and Environmental Technology, Beijing 102206, China
*
Author to whom correspondence should be addressed.
Crystals 2021, 11(12), 1494; https://doi.org/10.3390/cryst11121494
Submission received: 13 October 2021 / Revised: 23 November 2021 / Accepted: 24 November 2021 / Published: 1 December 2021

Abstract

:
Co-precipitation of mineral-based salts during scaling remains poorly understood and thermodynamically undefined within the water industry. This study focuses on investigating calcium carbonate and calcium sulfate mixed precipitation in scaling. Scaling is often observed in the produced water supply as a result of treatment processes. Co-precipitation results were compared with experimental results of a single salt crystallization. Several parameters were carefully monitored, including the electrical conductivity, pH value, crystal morphology and crystal form. The existence of the calcium carbonate scale in the mixed system encourages the loose calcium sulfate scale to become more tightly packed. The mixed scale was firmly adhered to the beaker, and the adhesion of the co-deposition product was located between the pure calcium sulfate scale and the pure calcium carbonate scale. The crystalline form of calcium sulfate was gypsum in both pure material deposition and mixed deposition, while the calcium carbonate scale was stable in calcite form in the pure material deposition. In the co-deposition, apart from calcite form, some calcium carbonate scale crystals had metastable vaterite form. This indicated that the presence of SO42− ions reduced the energy barrier of the calcium carbonate scale and hindered its transformation from a vaterite form to a calcite one, and the increase in HCO3 content inhibited the formation of calcium sulfate scale.

1. Introduction

The scaling problem caused by poor water stability and compatibility qualities can occur during fluid flow in a reservoir or wellbore as well as in the wellhead in petroleum operations [1,2,3]. Scale formation has been recognized as a major operational problem [4,5,6], which causes extremely serious consequences, such as reducing the oil production rate, oil well productivity, and turnover time of electric submersible pumps as well as plugging the perforations, premature failure of downhole equipment, and damage to the formation [7,8,9]. Frequent pipeline cleaning and replacement have increased the production and maintenance costs of oil and gas fields [10,11]. Moreover, the scaling causes of produced water are complex, and mixed scales are dominant, especially calcium deposits [12,13]. Many case histories on oil well scaling by calcium carbonate and calcium sulfate have been reported [11,14,15]. Problems pertaining to oil well scaling in the North Sea fields have been reported and are similar to cases in Russia, where scale has severely plugged wells [9,16]. After investigation, the main components of mixed scales in some oil wells in the Northern Shaanxi in China were identified as calcium sulfate and calcium carbonate. It is difficult to treat this type of mixed scale in the field [10,17].
With regard to scaling, kinetics and thermodynamics have been focused on in studies for many years. For pure salts, exhaustive material is available mainly for calcium carbonate (CaCO3) and dihydrate calcium sulfate (CaSO4·2H2O), which are the main contributors to fouling [13,18,19,20]. In fact, recent research has focused on the possibility of controlling or reducing this problem through several methods, mainly chemical treatments [10,21]. However, there are also many non-chemical treatment options that include the use of magnetic, electronic and electrolytic processing equipment [6,22,23,24,25]. Each of these fouling control methods has its own advantages, and many factors need to be considered before choosing the appropriate option [10,26,27]. However, due to the complexity of mixed scale, there are few studies on its deposition mechanism and interaction of mixed scale [28]. Current scaling methods base their scaling trend predictions largely on the deposition mechanism of single scales [23,29], ignoring the influence of multi-ion interaction on the deposition process. Thus, there are some limitations and some errors in the prediction results [11,30,31]. It is therefore of great significance to study the mechanism of scale co-deposition in produced water for better formulation of scale control and scale prevention measures.
In order to study the co-precipitation mechanism of calcium sulfate and calcium carbonate scale in the produced water, this study takes the produced water of the Northern Shaanxi Oilfield as the research object and prepares a certain concentration of simulated water to ensure that the Ca2+ content is unchanged, and there is an equivalent amount of anion that could completely react with it (in theory). The deposition processes of the single calcium carbonate scale, the single calcium sulfate scale, and their mixed scale were compared and analyzed through the changes in conductivity value, pH value, crystal morphology and crystal form of scale sample.

2. Background Theory

2.1. Crystallization

It is known that the scale formation process can be divided into three stages, namely, the scale induction, nucleation, and crystal growth periods [32]. The scale induction period refers to the period when the solution is sufficiently saturated to generate the first scale crystal [33,34]. The nucleation stage and the growth stage of scale crystal are the most important periods for scale formation. The scaling process is affected by many factors, and the scaling mechanism is very complex [35], but its main cause is the supersaturation of scaling ions in the solution [14,27]. The general process of scaling can be described as follows:
(1)
In a supersaturated solution, the kinetic pathway of mineral scale deposition begins with the electrostatic interaction between dissolved anions and cations leading to ion pairing, and a large number of ion pairs gather together to form large molecular assemblies or prenuclear aggregates [24,36].
(2)
At a higher supersaturation, the ion pair concentration increases and aggregates to form larger particles. In this process, the aggregation is in a dynamic equilibrium state of dissolution and aggregation in the solution [1]. The polyelectrolyte can be adsorbed on the surface of the molecular aggregation, affecting its growth and dissolution kinetics [17].
(3)
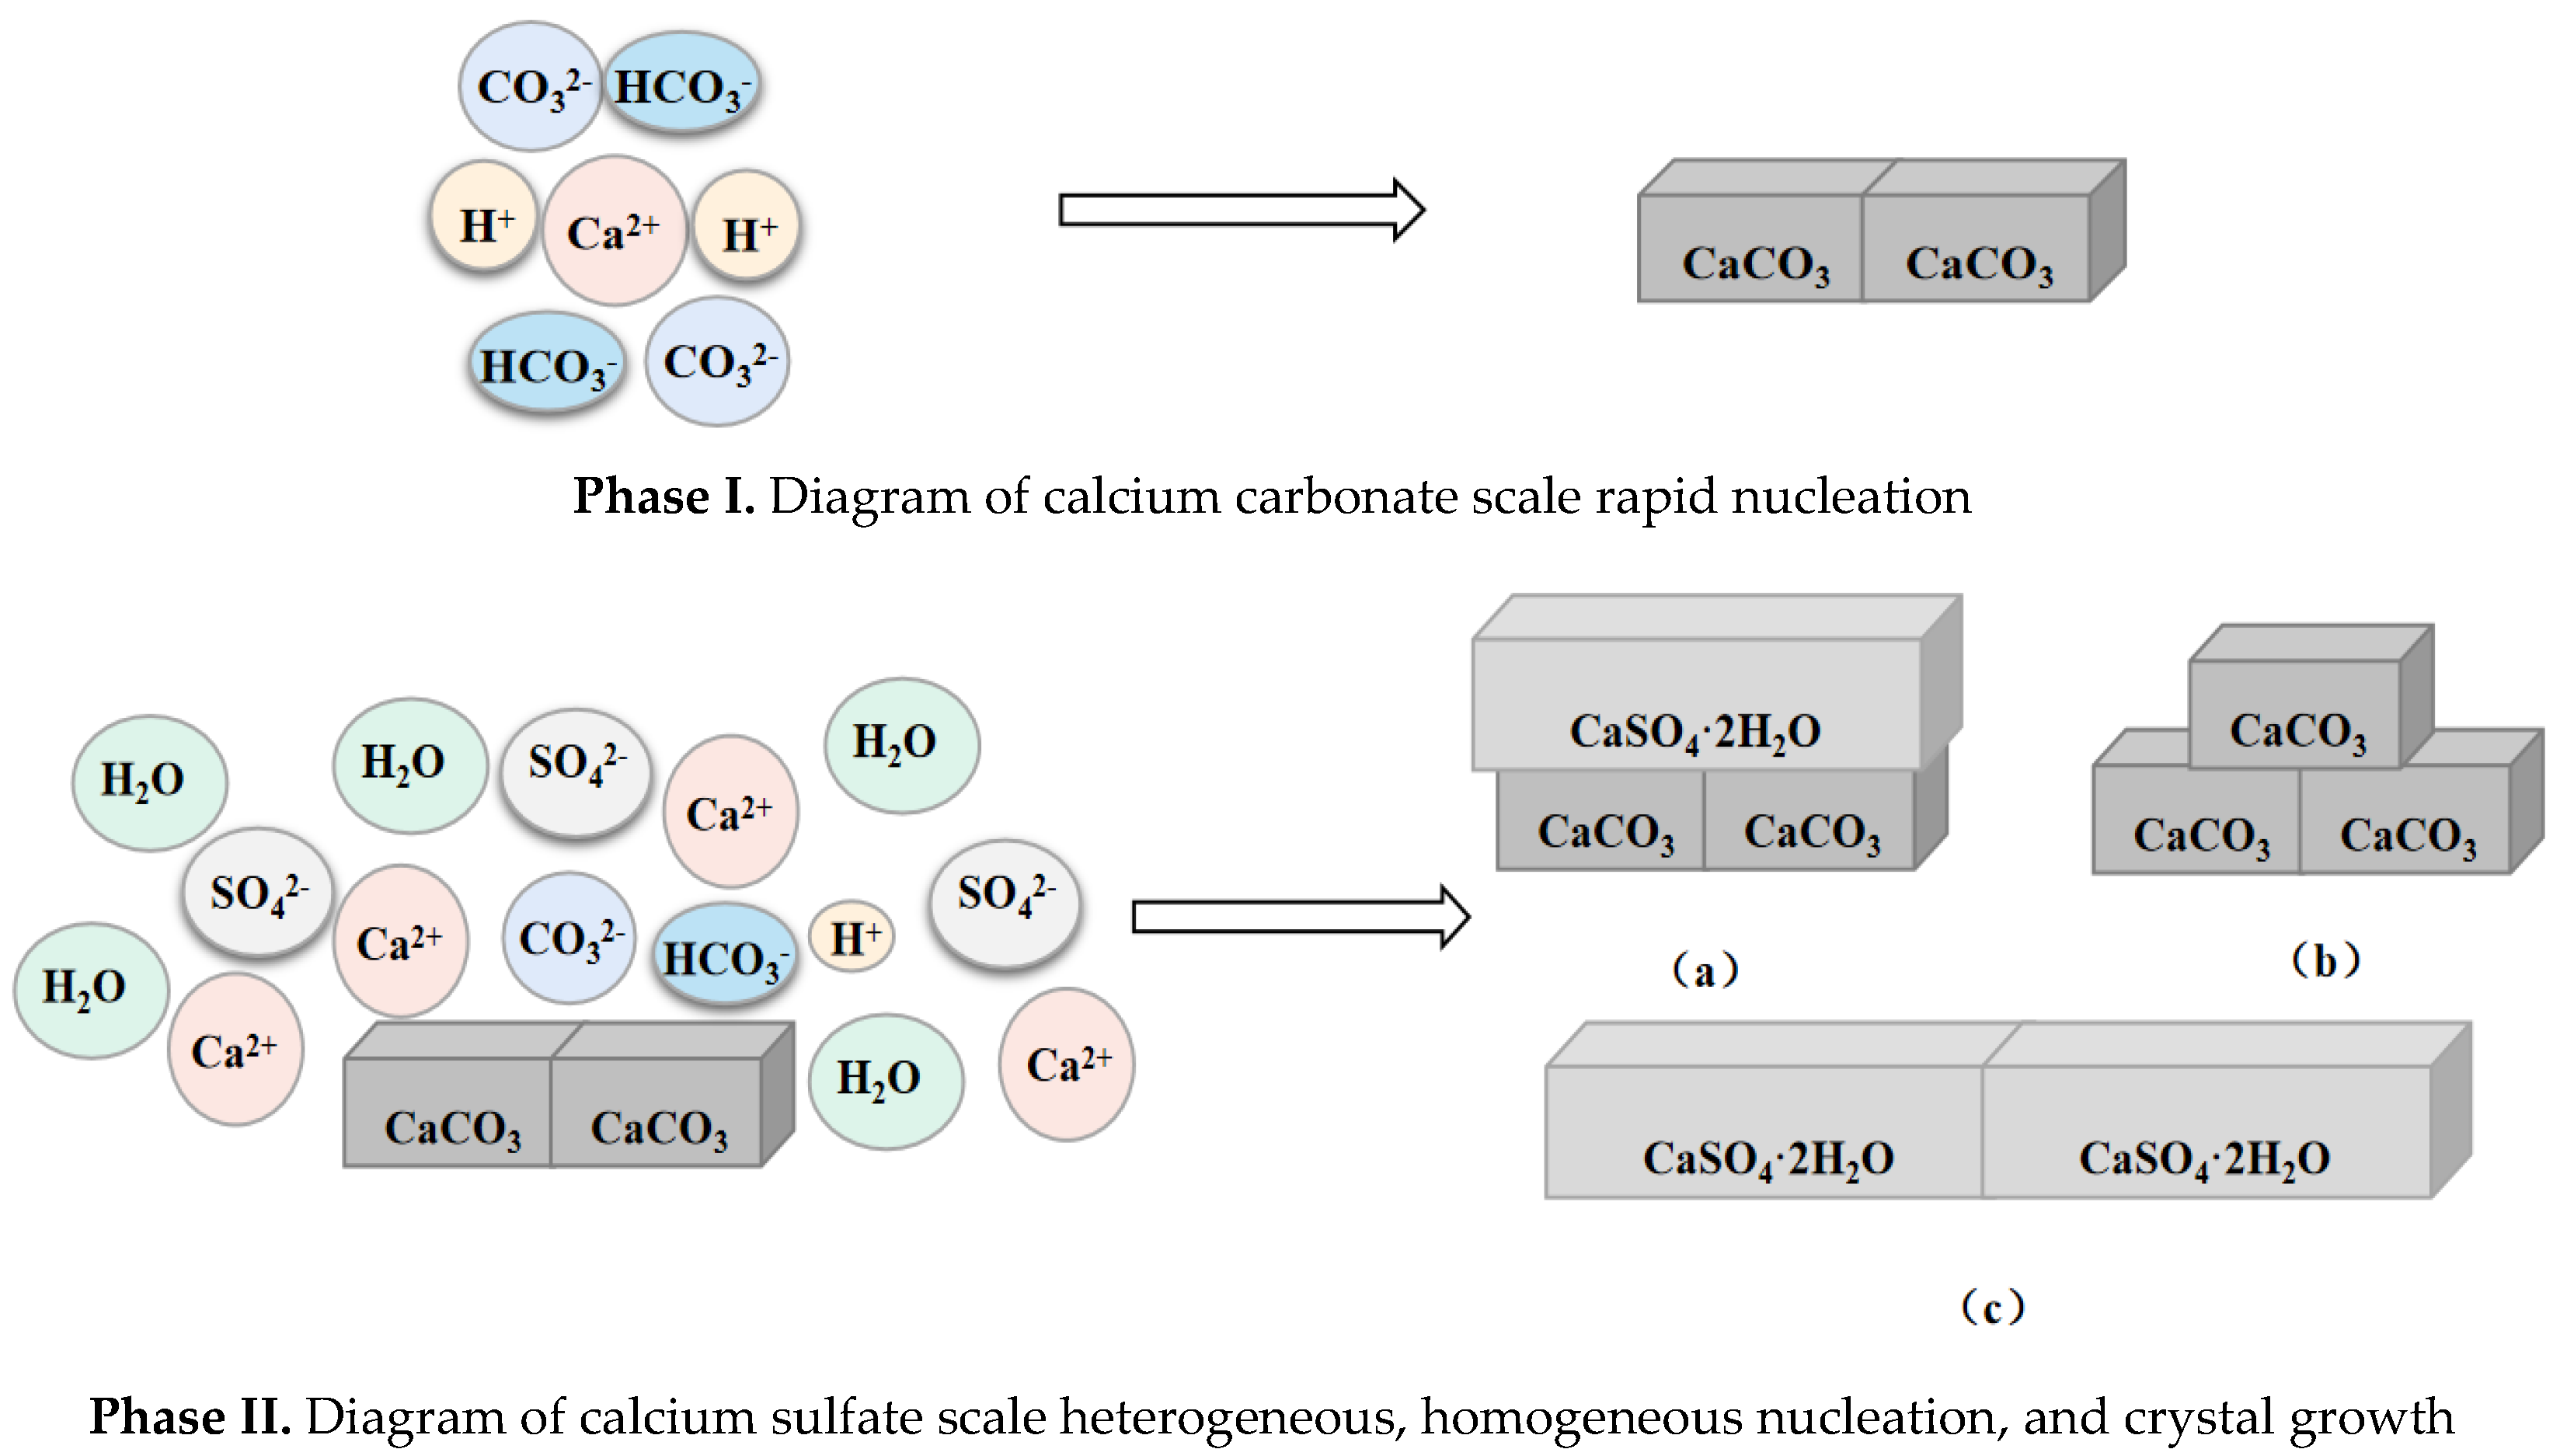
When the aggregate length reaches the critical size, determined by the supersaturation of the solution, these larger particles will no longer continue to dissolve, and the solid particles begin to nucleate [37]. At this stage, the nucleation of the main particles in solution occurs by homogeneous nucleation, while that of aggregates adsorbed on a surface occurs by heterogeneous nucleation. These two nucleation processes may exist at the interface of heterogeneous nucleation, and it is difficult to distinguish the specific nucleation sites (typically dust, impurities, or other material surfaces) of a substance [38]. Once the particles achieve nucleation, there are several potential sediment growth mechanisms, either in the macroscopic surface or in the solution.
(4)
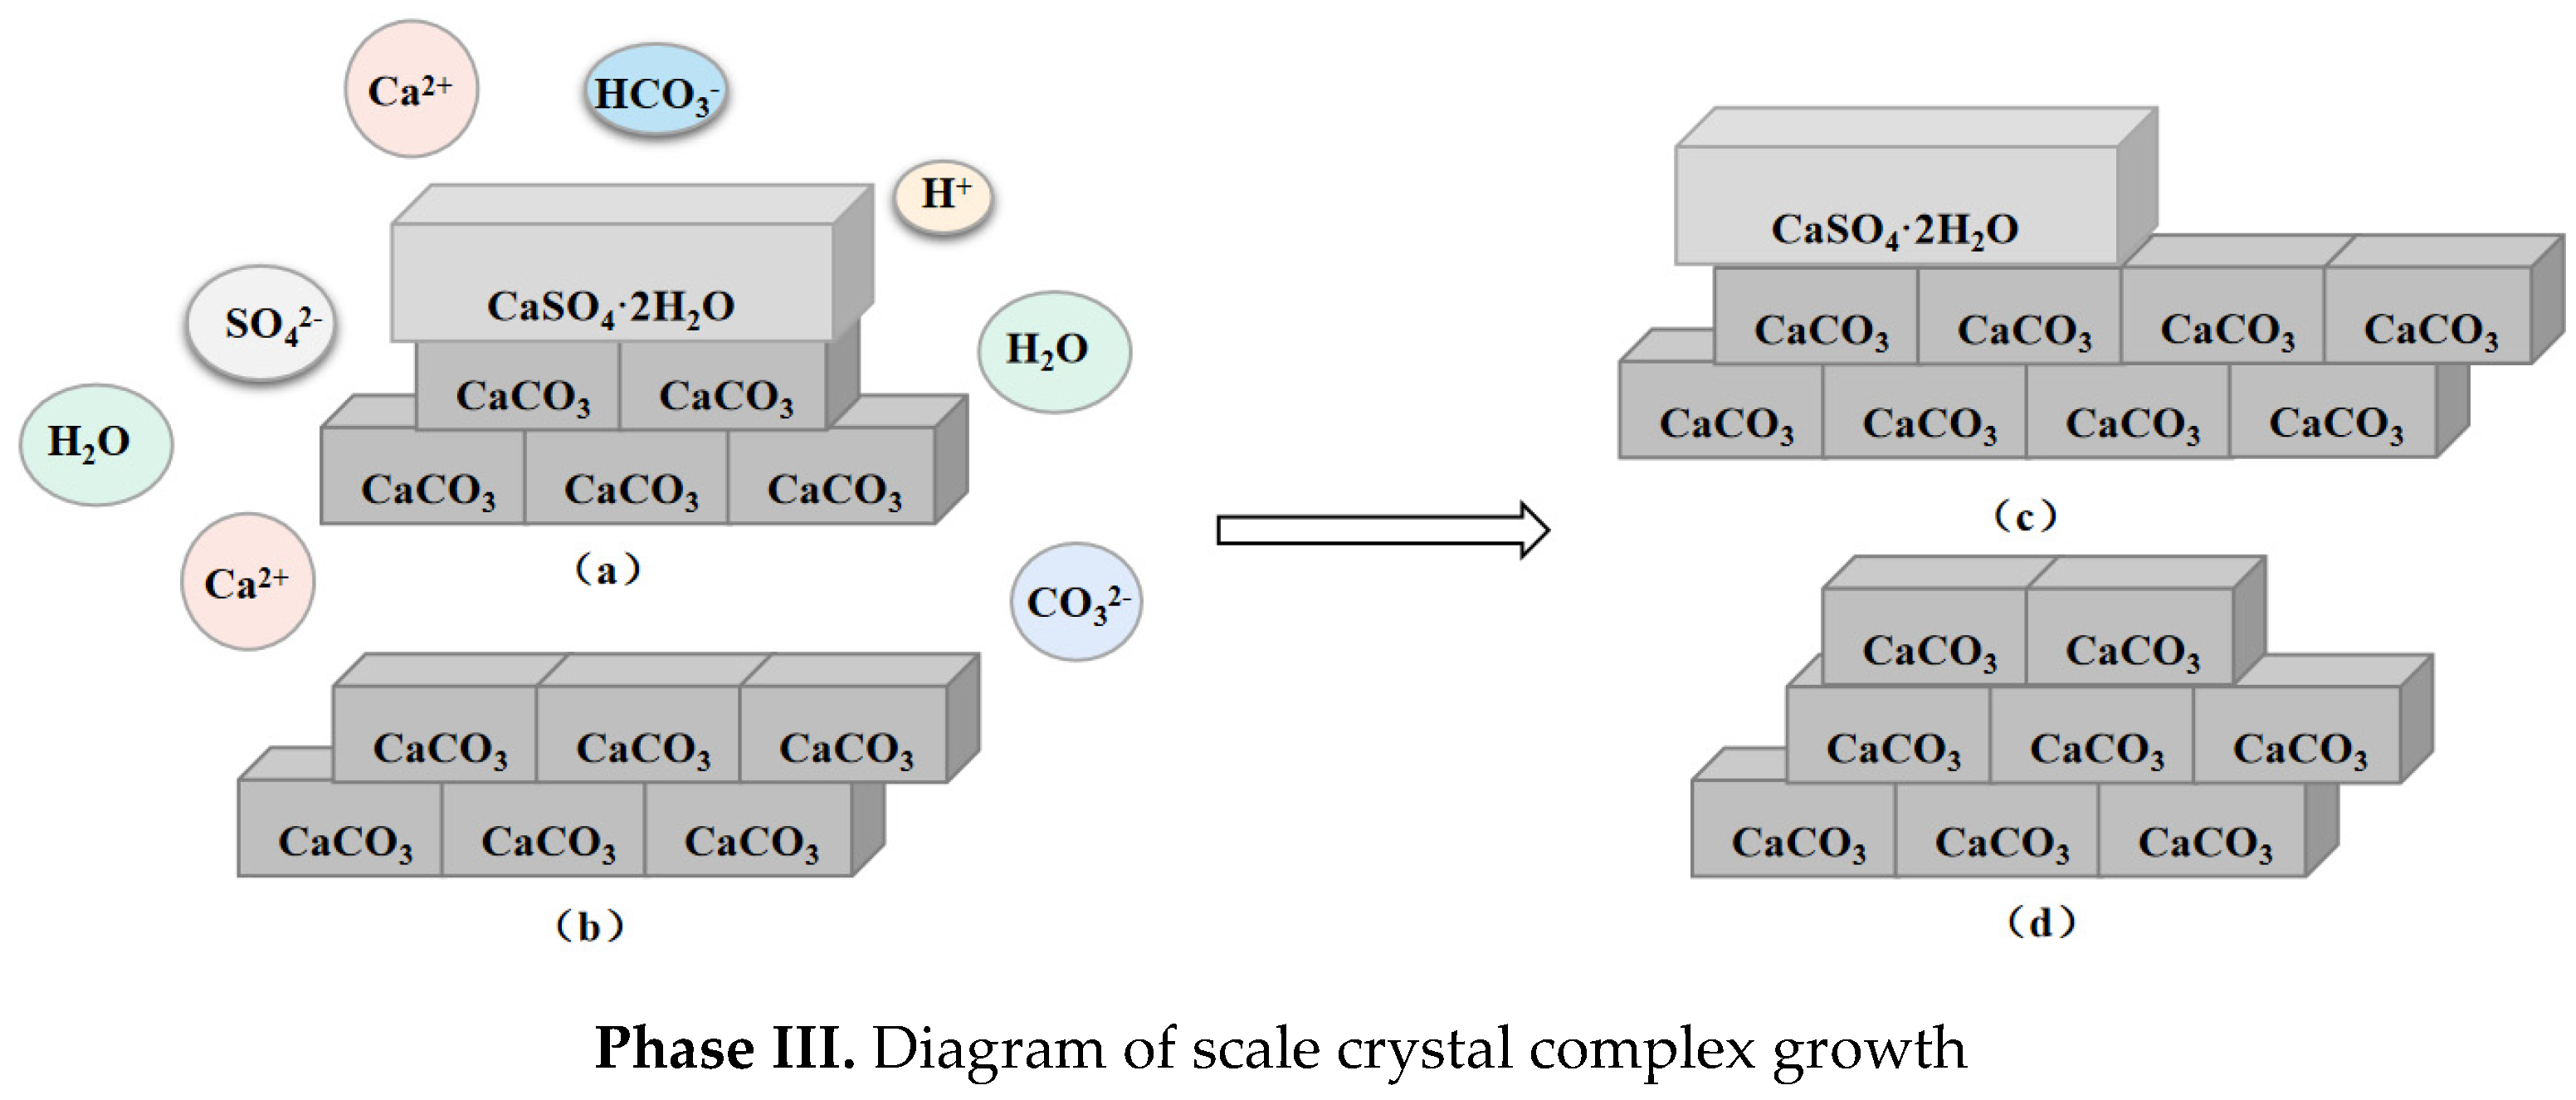
The crystal nucleus continues to grow and aggregate in the supersaturated solution. At the same time, the particles continue to grow on the surface of the scale layer after nucleation, and finally scaling occurs.

2.2. Calcium Sulfate and Calcium Carbonate

Calcium sulfate has three different crystal forms, which are distinguished by the number of bound water: dihydrate calcium sulfate or gypsum (monoclinic crystal), hemihydrate calcium sulfate (hexagonal crystal), and anhydrite calcium sulfate (orthorhombic crystal) [39]. Among them, hemihydrate is dominant at approximately 100 °C [22]. Gypsum and anhydrite are the main precipitation forms below 100 °C [40]. Gypsum is the most difficult to dissolve and the most easily precipitated form of calcium sulfate below 40 °C [40,41]. Calcium carbonate also has three different forms, namely vaterite, aragonite, and calcite [30]. Among them, calcite belongs to the trigonal crystal system and is a thermodynamically stable phase. Aragonite belongs to the orthorhombic crystal system and is a metastable phase [40,42,43]. The vaterite belongs to the hexagonal system, which is a thermodynamically unstable phase with extremely unstable properties.
When calcium sulfate and calcium carbonate are co-deposited, the main reactions occur as follows:
Ca 2 + + SO 4 2 + 2 H 2 O CaSO 4 2 H 2 O   { K 1 }
Ca 2 + + 2 HCO 3 CaCO 3 + H 2 O + CO 2   { K 2 }
Among them, the Equation (2) can be seen as Equation (3) + Equation (4) + Equation (5).
Ca 2 + + CO 3 2 = CaCO 3 K 3 = 1 / K sp ( CaCO 3 )
HCO 3 H + + CO 3 2 K 4 = 1 / K a 2 ( H 2 CO 3 )
HCO 3 + H + H 2 O + CO 2 K 5 = 1 / K a 1 ( H 2 CO 3 )
It is known that when T = 35 °C, K1 = 4.29 × 10⁻⁵; K2 = K3 × K4 × K5 = 4.11 × 10⁻⁹.
According to the dissolution product rule [23], when c(Ca2+) × c(SO42−) > K1, calcium sulfate precipitation occurs in the solution, and when c(Ca2+) × c(HCO3)2 > K2, calcium carbonate precipitation is produced in solution. Since the solubility of insoluble salts is affected by many factors, there may be errors in this relation.

2.3. Previous Work on Co-Precipitation

Published studies have shown that in the case of mixed precipitation, the following two possibilities can exist:
(1)
The presence of salt will affect the thermodynamics of the solution, and then affect the crystallization kinetics of other salts [17,41,44].
(2)
The salt obtained by the mixed precipitation method and the salt obtained by the pure precipitation reaction can have different morphologies and crystal forms [12,17,38,45].

3. Experimental Methods and Materials

3.1. Materials

Analytical grade anhydrous calcium chloride (CaCl2), anhydrous sodium sulfate (Na2SO4), and anhydrous sodium bicarbonate (NaHCO3) were used in experiments with deionized water (UPC-III, 40 L pure water machine). The experimental equipment parts were soaked in a concentrated sulfuric acid potassium dichromate solution to remove impurities, then washed several times with tap water and deionized water.

3.2. Solution Preparation

The experiment was divided into four experimental groups listed in Table 1, namely Group 1, Group 2, Group 3 and Group 4. In every experimental group, the pH value and electrical conductivity were monitored in real-time. All solutions were sealed and stored in oven for 12 h, preheated to 35 °C.

3.3. Experiments and Analysis Methods

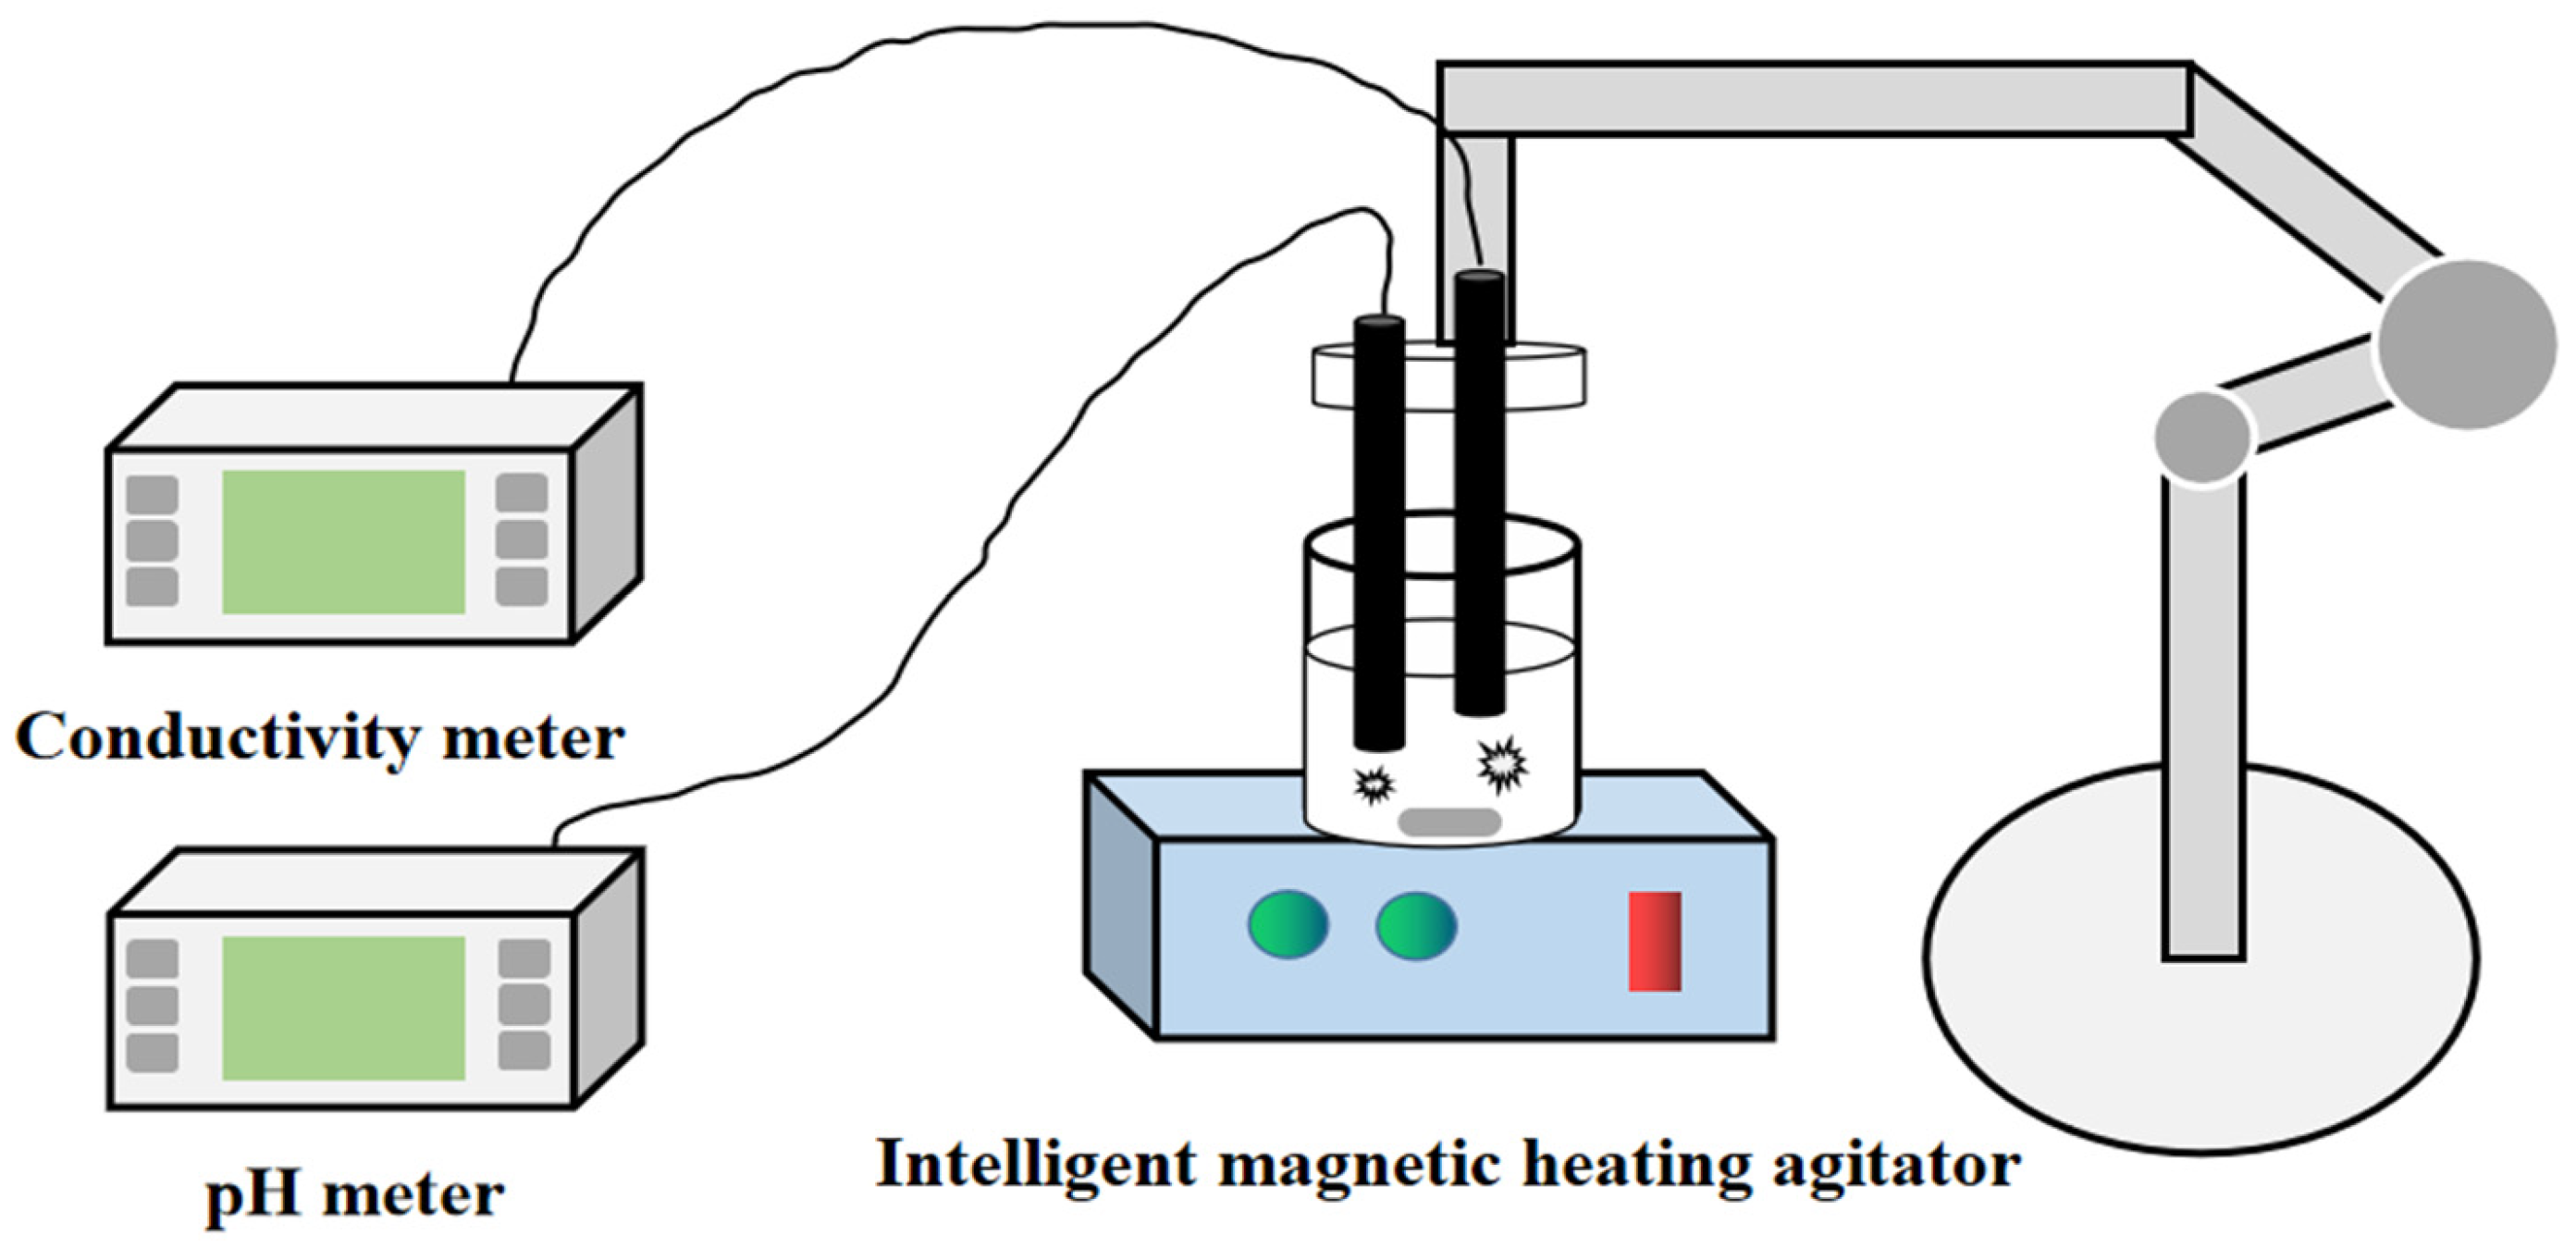
3.3.1. Determination of Conductivity and pH Value

The experimental apparatus is represented in Figure 1. The electrical conductivity was measured using a Metler-Toledo conductivity meter (S230-K, Shanghai Youyi Instrument Co., Ltd., Shanghai, China). The pH meter (PHS-25, Shanghai INESA & Scientific Instrument Co., Ltd., Shanghai, China) was used to determine the pH of solution throughout the experiment. The electrode head of the corrected conductivity meter and acidity meter was inserted into the mixed solution, and the constant temperature magnetic stirrer was set at 35 °C and 250 r/min. The real-time monitoring of conductivity and pH changed during the deposition process. An intelligent magnetic heating agitator was used to maintain the solution at constant temperature and keep the solution homogeneous.
The process of combining conductive ions into non-conductive substances in the solution system before and after the experiment is reflected in the change of conductivity [15,46]. When there is precipitation in the solution, the content of the free ions in the solution decreases, and the conductivity of the solution decreases. Therefore, the decreased rate of conductivity can be used to reflect the change in the crystallization rate. According to the scale deposition-aggregation mechanism, the scale deposition process can be divided into three stages, namely, the scale induction stage, the scale crystal nucleus formation stage, and the scale crystal growth stage [11,47,48]. The nucleus formation stage and the growth stage of scale crystal are single-layer reactions, which are controlled by surface reactions and should conform to the first-order reaction rate equation [44,49]. The relationship between the ion concentration and time in the solution can be expressed as Equation (6).
c = c 0 e K t
where k (μS/cm) in the mixed solution was linearly related to the concentration of scaling ions, as shown in Equation (7).
c = B k + D
The conductivity of the scale crystal nucleation process and scale crystal growth process display a linear fit with time, as shown in Equation (8).
l n k = l n c 0 K t
where c0 and c are the sums of free ions concentration initially and in real time in mixed solution (mol/L), respectively. B and D are identified to be constants, and K is the reaction rate constant of nucleus growth.
The formation of calcium sulfate scale is pH independent, and the pH value is relatively stable in its formation process [12]. However, during calcium carbonate germination, pH will decrease simultaneously because the concentration of carbonate in the solution is pH-dependent and the pH of the solution changes during the run due to the fact that carbonate is depleting by precipitation. Therefore, pH was used to follow the CaCO3 precipitation.

3.3.2. Microscopic Observation

The changes in the crystalline morphology of the scaling were observed using a Nikon confocal microscope (C2+, Shanghai Qianxin Instrument Co., Ltd., Shanghai, China). Magnification of 40 times was used to observe the morphology of scale crystals at 10, 40, 70, and 100 min.

3.3.3. Analysis by XRD

The crystal phase of prepared samples was verified using power X-ray diffraction (XRD) with Cu Kα radiation at a wavelength of 0.1546 nm (model D/max RA, Rigaku Co., Tokyo, Japan). The data were collected by scanning over angles (2θ) ranging from 20° to 80°. X-ray diffraction analysis indicated the crystalline form of scaling.

4. Results and Discussion

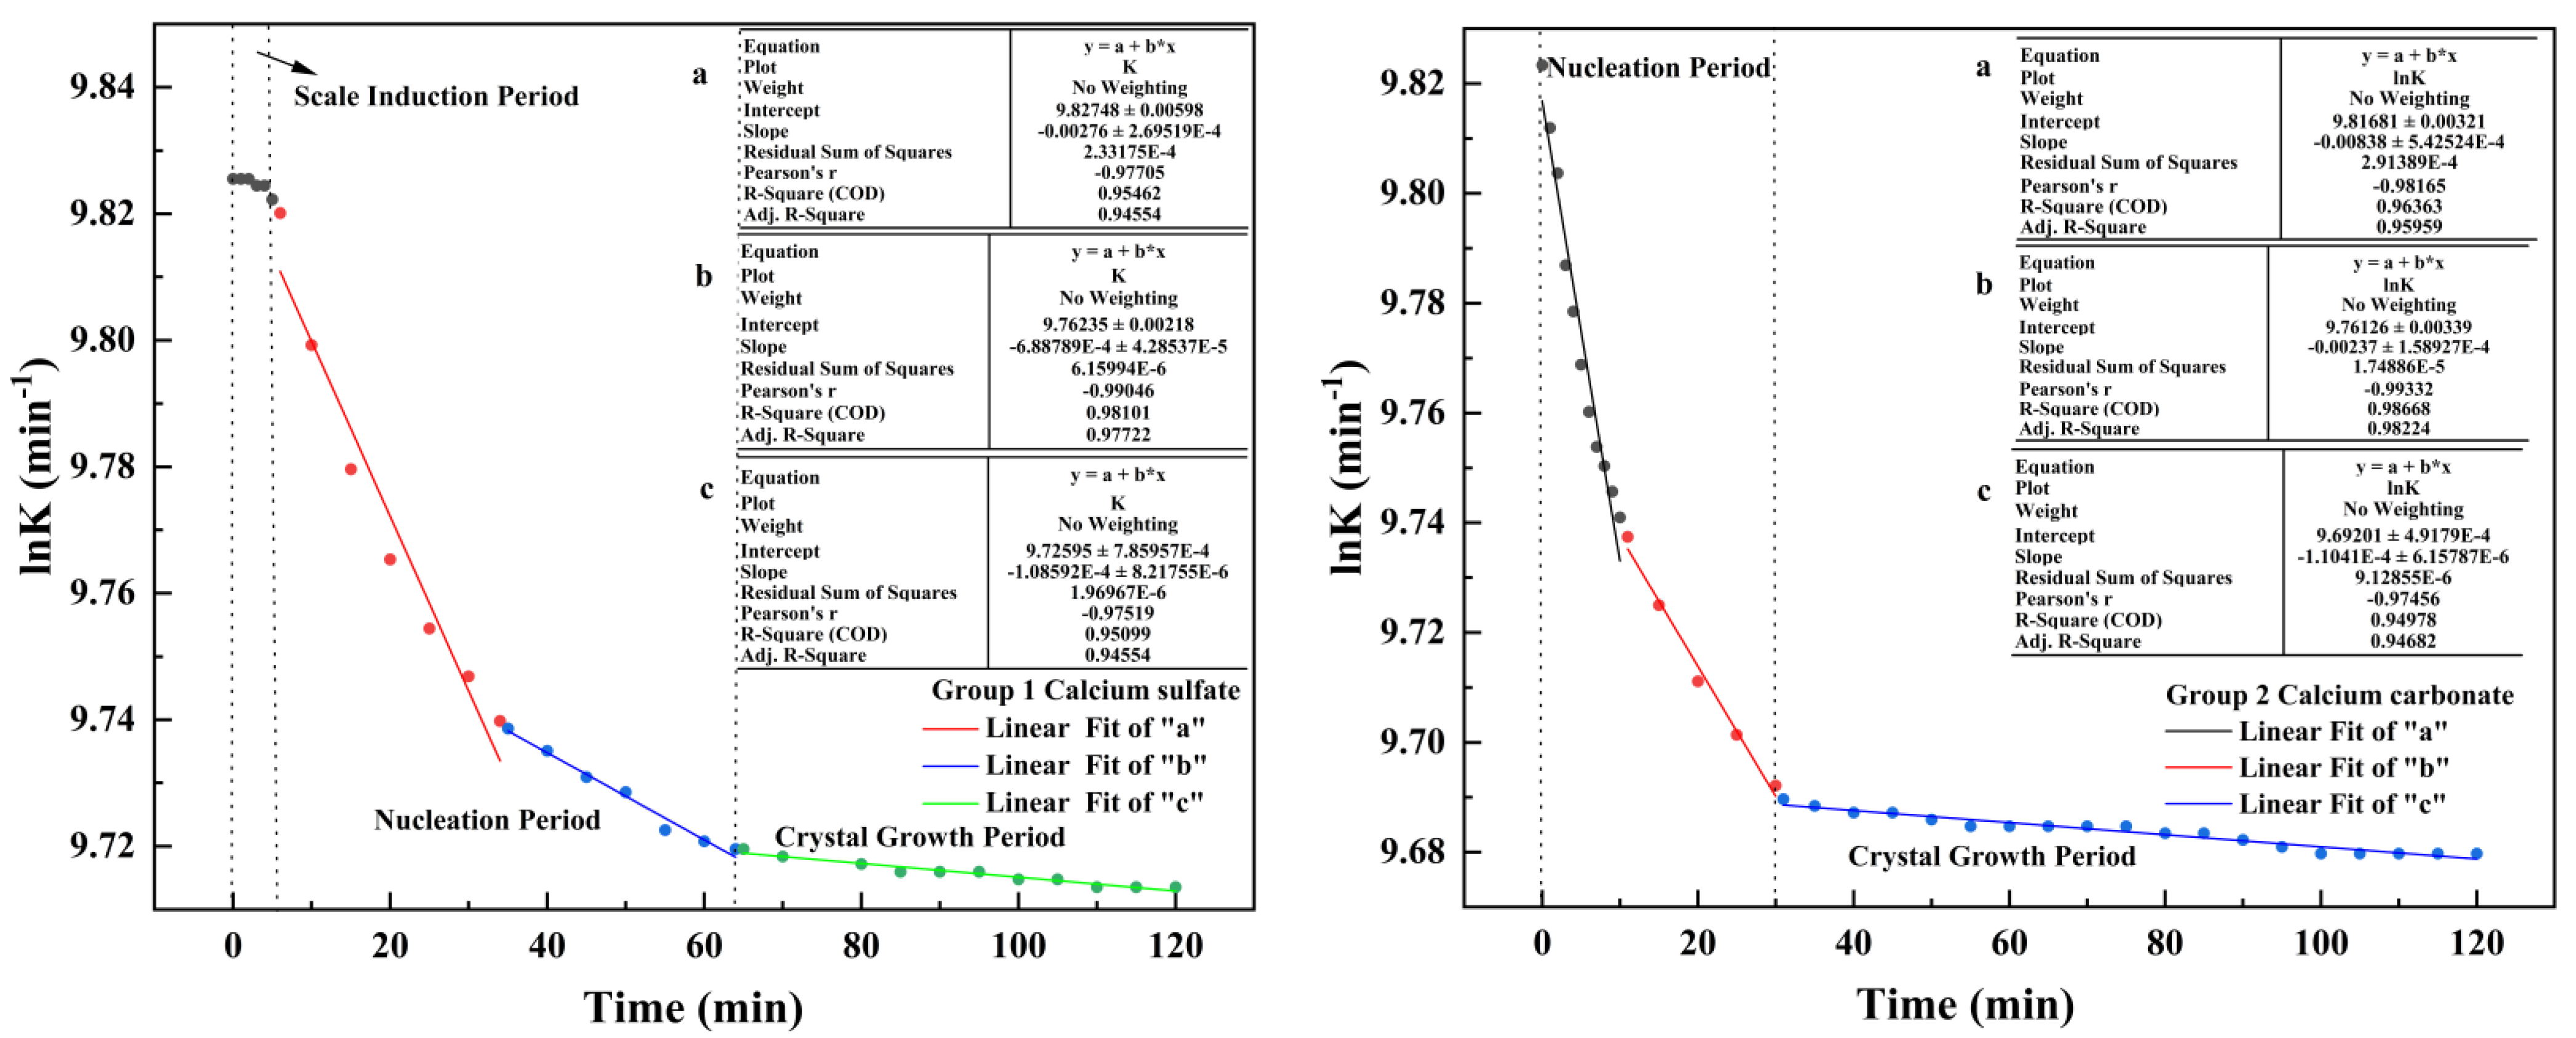
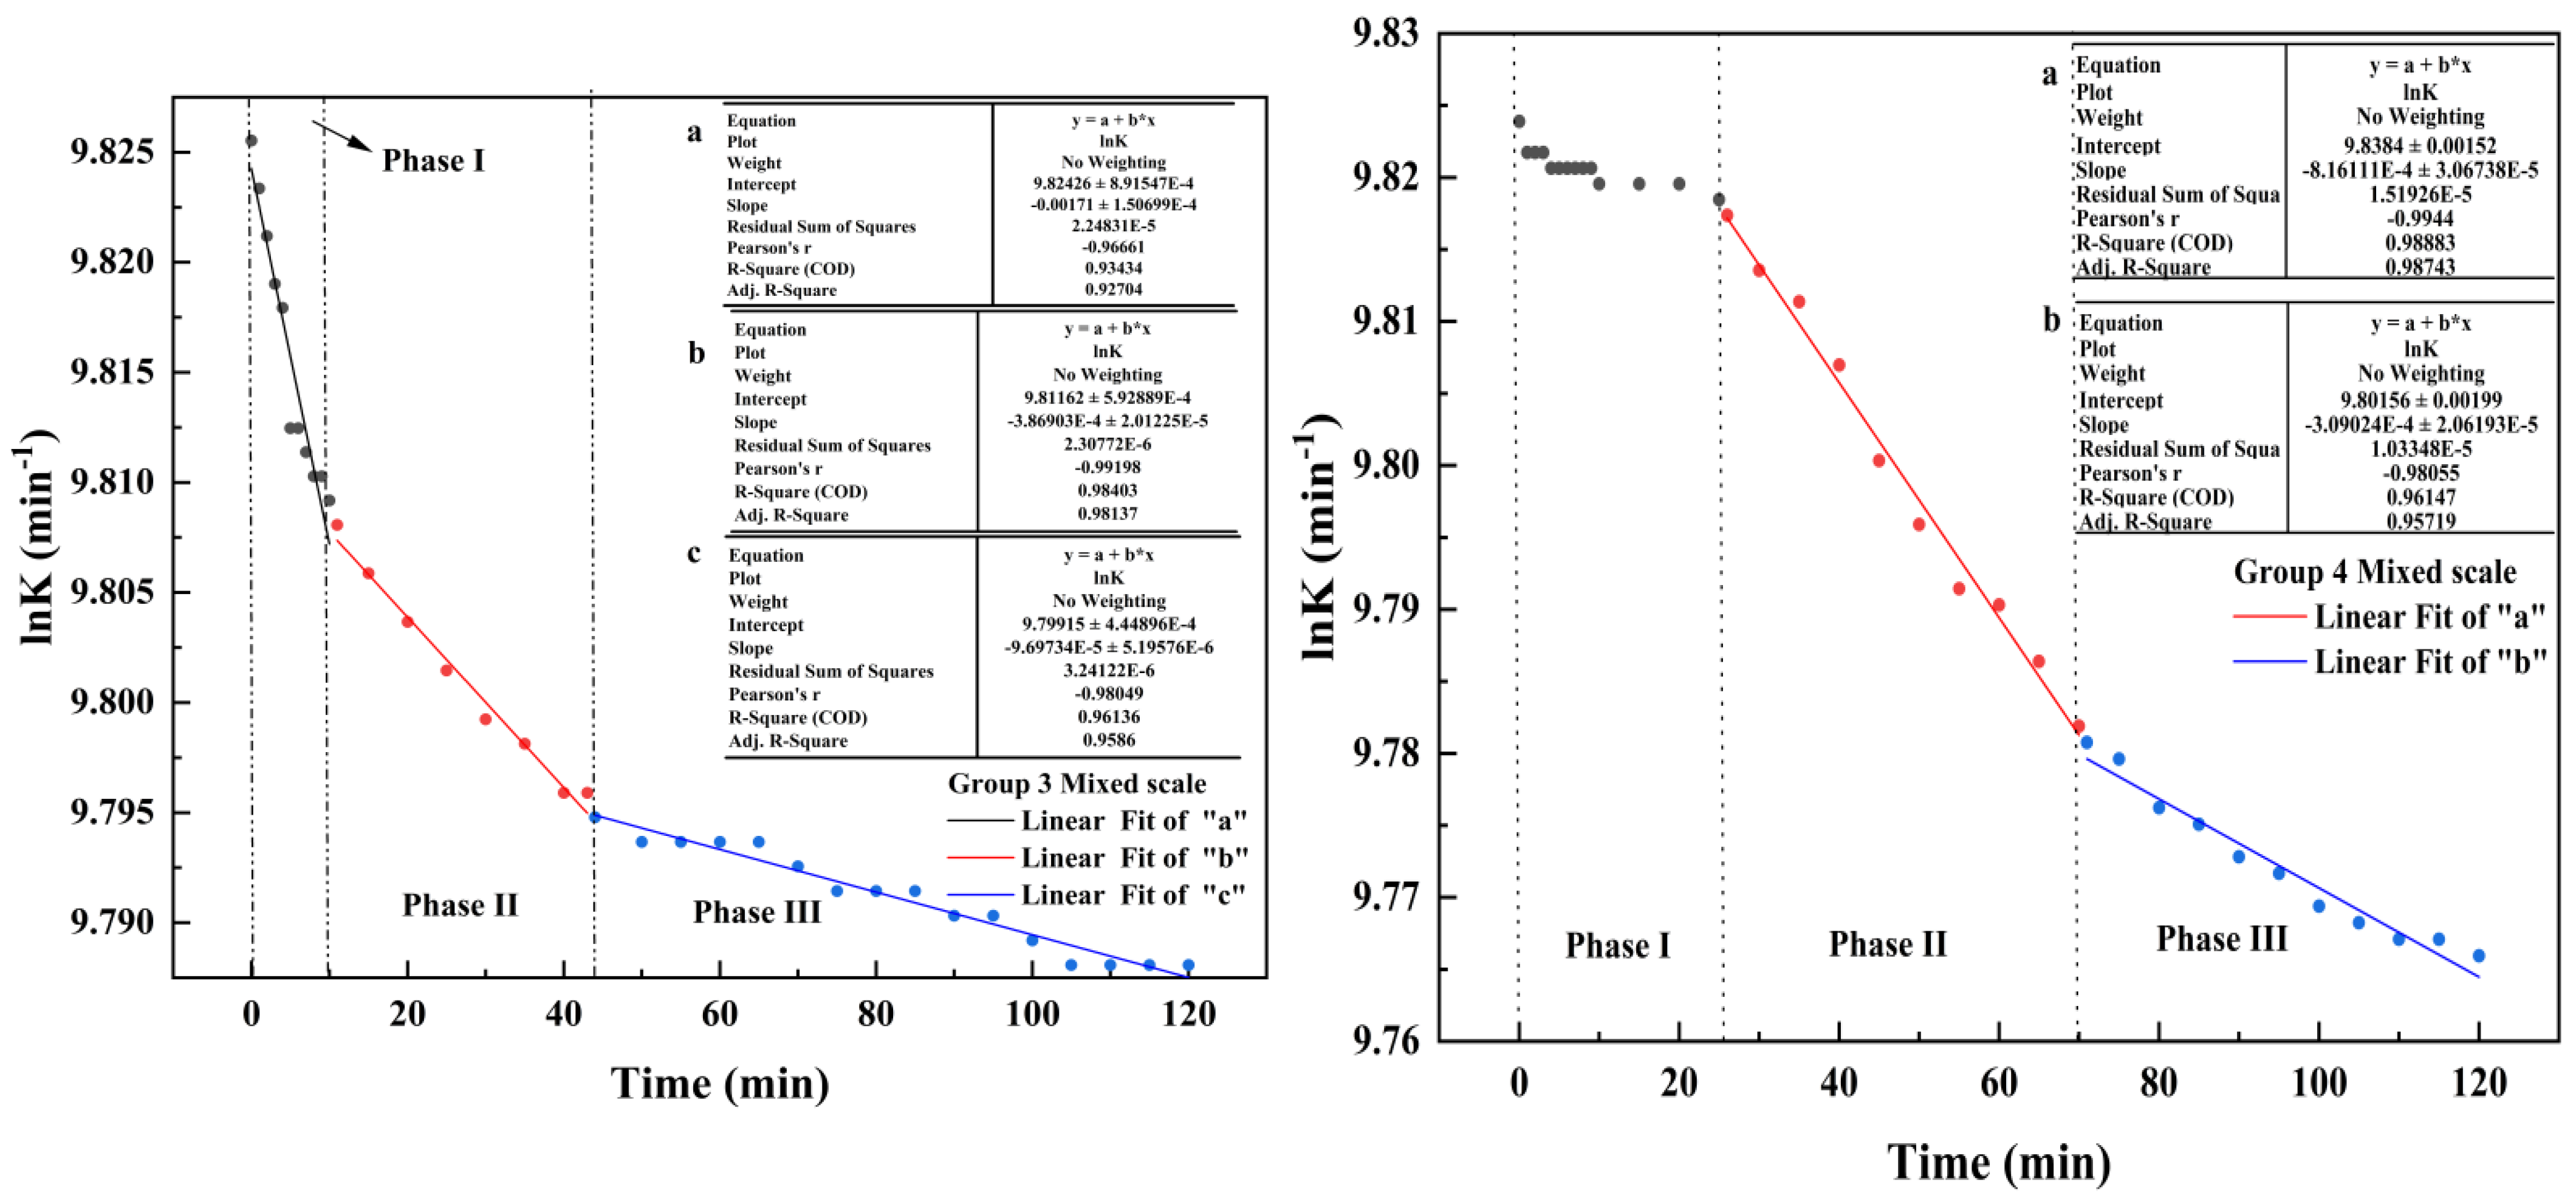
4.1. Changes in Electrical Conductivity during Scale Deposition

From Figure 2 and Figure 3, it can be seen that the conductivity value was stable in the initial 0–3 min when pure calcium sulfate scale was deposited in Group 1. According to the scale crystal deposition-aggregation mechanism, this was the induction period of calcium sulfate crystal. A large number of ion pairs were formed between sulfate ions and calcium ions, then the ion pairs aggregated with each other, and finally a large number of aggregates were formed. However, the aggregates did not reach the critical size and could not precipitate from the saturated solution, so no scale crystals were produced. The conductivity value began to decrease between 3–6 min, and a large number of aggregates gradually formed, reached the critical size, and generated crystal nuclei. Between 6–34 min, a large number of aggregates that had reached the critical size precipitated, and a large number of grains began to generate. This stage is a rapid nucleation stage. With the continuous precipitation of scale crystals, the supersaturation of the solution decreased during the period from 34–64 min, and the rate of conductivity decline slowed down. In short, 6–64 min, for the nucleation stage. After 64 min, the supersaturation of the solution was low, and spontaneous nucleation was difficult. The ion pair formed by sulfate and calcium was adsorbed on the surface of the formed scale crystal, and the formed scale crystals were complexed with each other to form a larger scale crystal, which is the crystal growth stage.
Different from the calcium sulfate scale, when pure calcium carbonate was deposited in Group 2, it can be observed that there was no induction period associated with the precipitation and the process was initiated almost immediately. The deposition rate of the calcium carbonate scale was higher than that of the calcium sulfate scale. From the crystal nucleation theory, it could be seen that under the driving of excessive saturation, calcium ions combined with carbonate ions ionized by bicarbonate, and formed a large number of ion pairs, which could be a direct nucleation, or first formed small clusters before nucleation, small clusters directional aggregation to formed amorphous calcium carbonate crystals, and then further grew into a stable phase structure of calcium carbonate [50,51,52]. The rapid formation stage of calcium carbonate grains was 0–10 min, the slow formation stage of calcium carbonate crystal nuclei was 10–30 min, and the scale crystals grew up gradually between 30–120 min.
Groups 3 and 4 compose the co-deposition processes of mixed scale, which were more complicated than that of pure material deposition. The scale deposition process of Groups 3 and 4 could be divided into three stages. In Group 3, the amount of HCO3- and SO42− was set to be able to consume the same amount of Ca2+ (in theory). In the first stage, 0–10 min, the conductivity decreased rapidly. In the second stage, 10–30 min, the rate of conductivity decline slowed down. In the third stage, after 30 min, the decline trend of conductivity tended to be stable. In Group 4, the amount of HCO3 ion was small and less than that of SO42− ion. In the first stage, 0–25 min, the conductivity of the mixed solution showed an initial, slow downward trend. In the second stage, 25–70 min, the conductivity decreased faster. In the third stage, after 70 min, the conductivity resumed a slow downward trend.
Since gypsum solubility is much higher than that of CaCO3, one must conclude that the decrease of conductivity at the initial reaction time in Groups 3 and 4 corresponds to CaCO3 germination. In addition, by comparing Groups 3 and 4, it could be seen that the conductivity value of the final mixed solution in Group 3 is higher when it is stable, while the amount of HCO3 in the mixed solution in Group 3 is larger. In seeded crystal growth studies, Nancollas et al. [53] suggested that an interface process involving the formation of an adsorbed surface layer of hydrated calcium and sulfate ions controls CaSO4 growth. Sheikholeslami et al. [38,45] suggested that the carbonate effect might be that the presence of CO32− may be interfering with this interface process and resulting in lower rates of precipitation and higher solubility. Therefore, it could be speculated that the increase of HCO3 content may inhibit the formation of calcium sulfate scale in the co-deposition process of mixed scale by increasing CO32− content. [49,54,55].

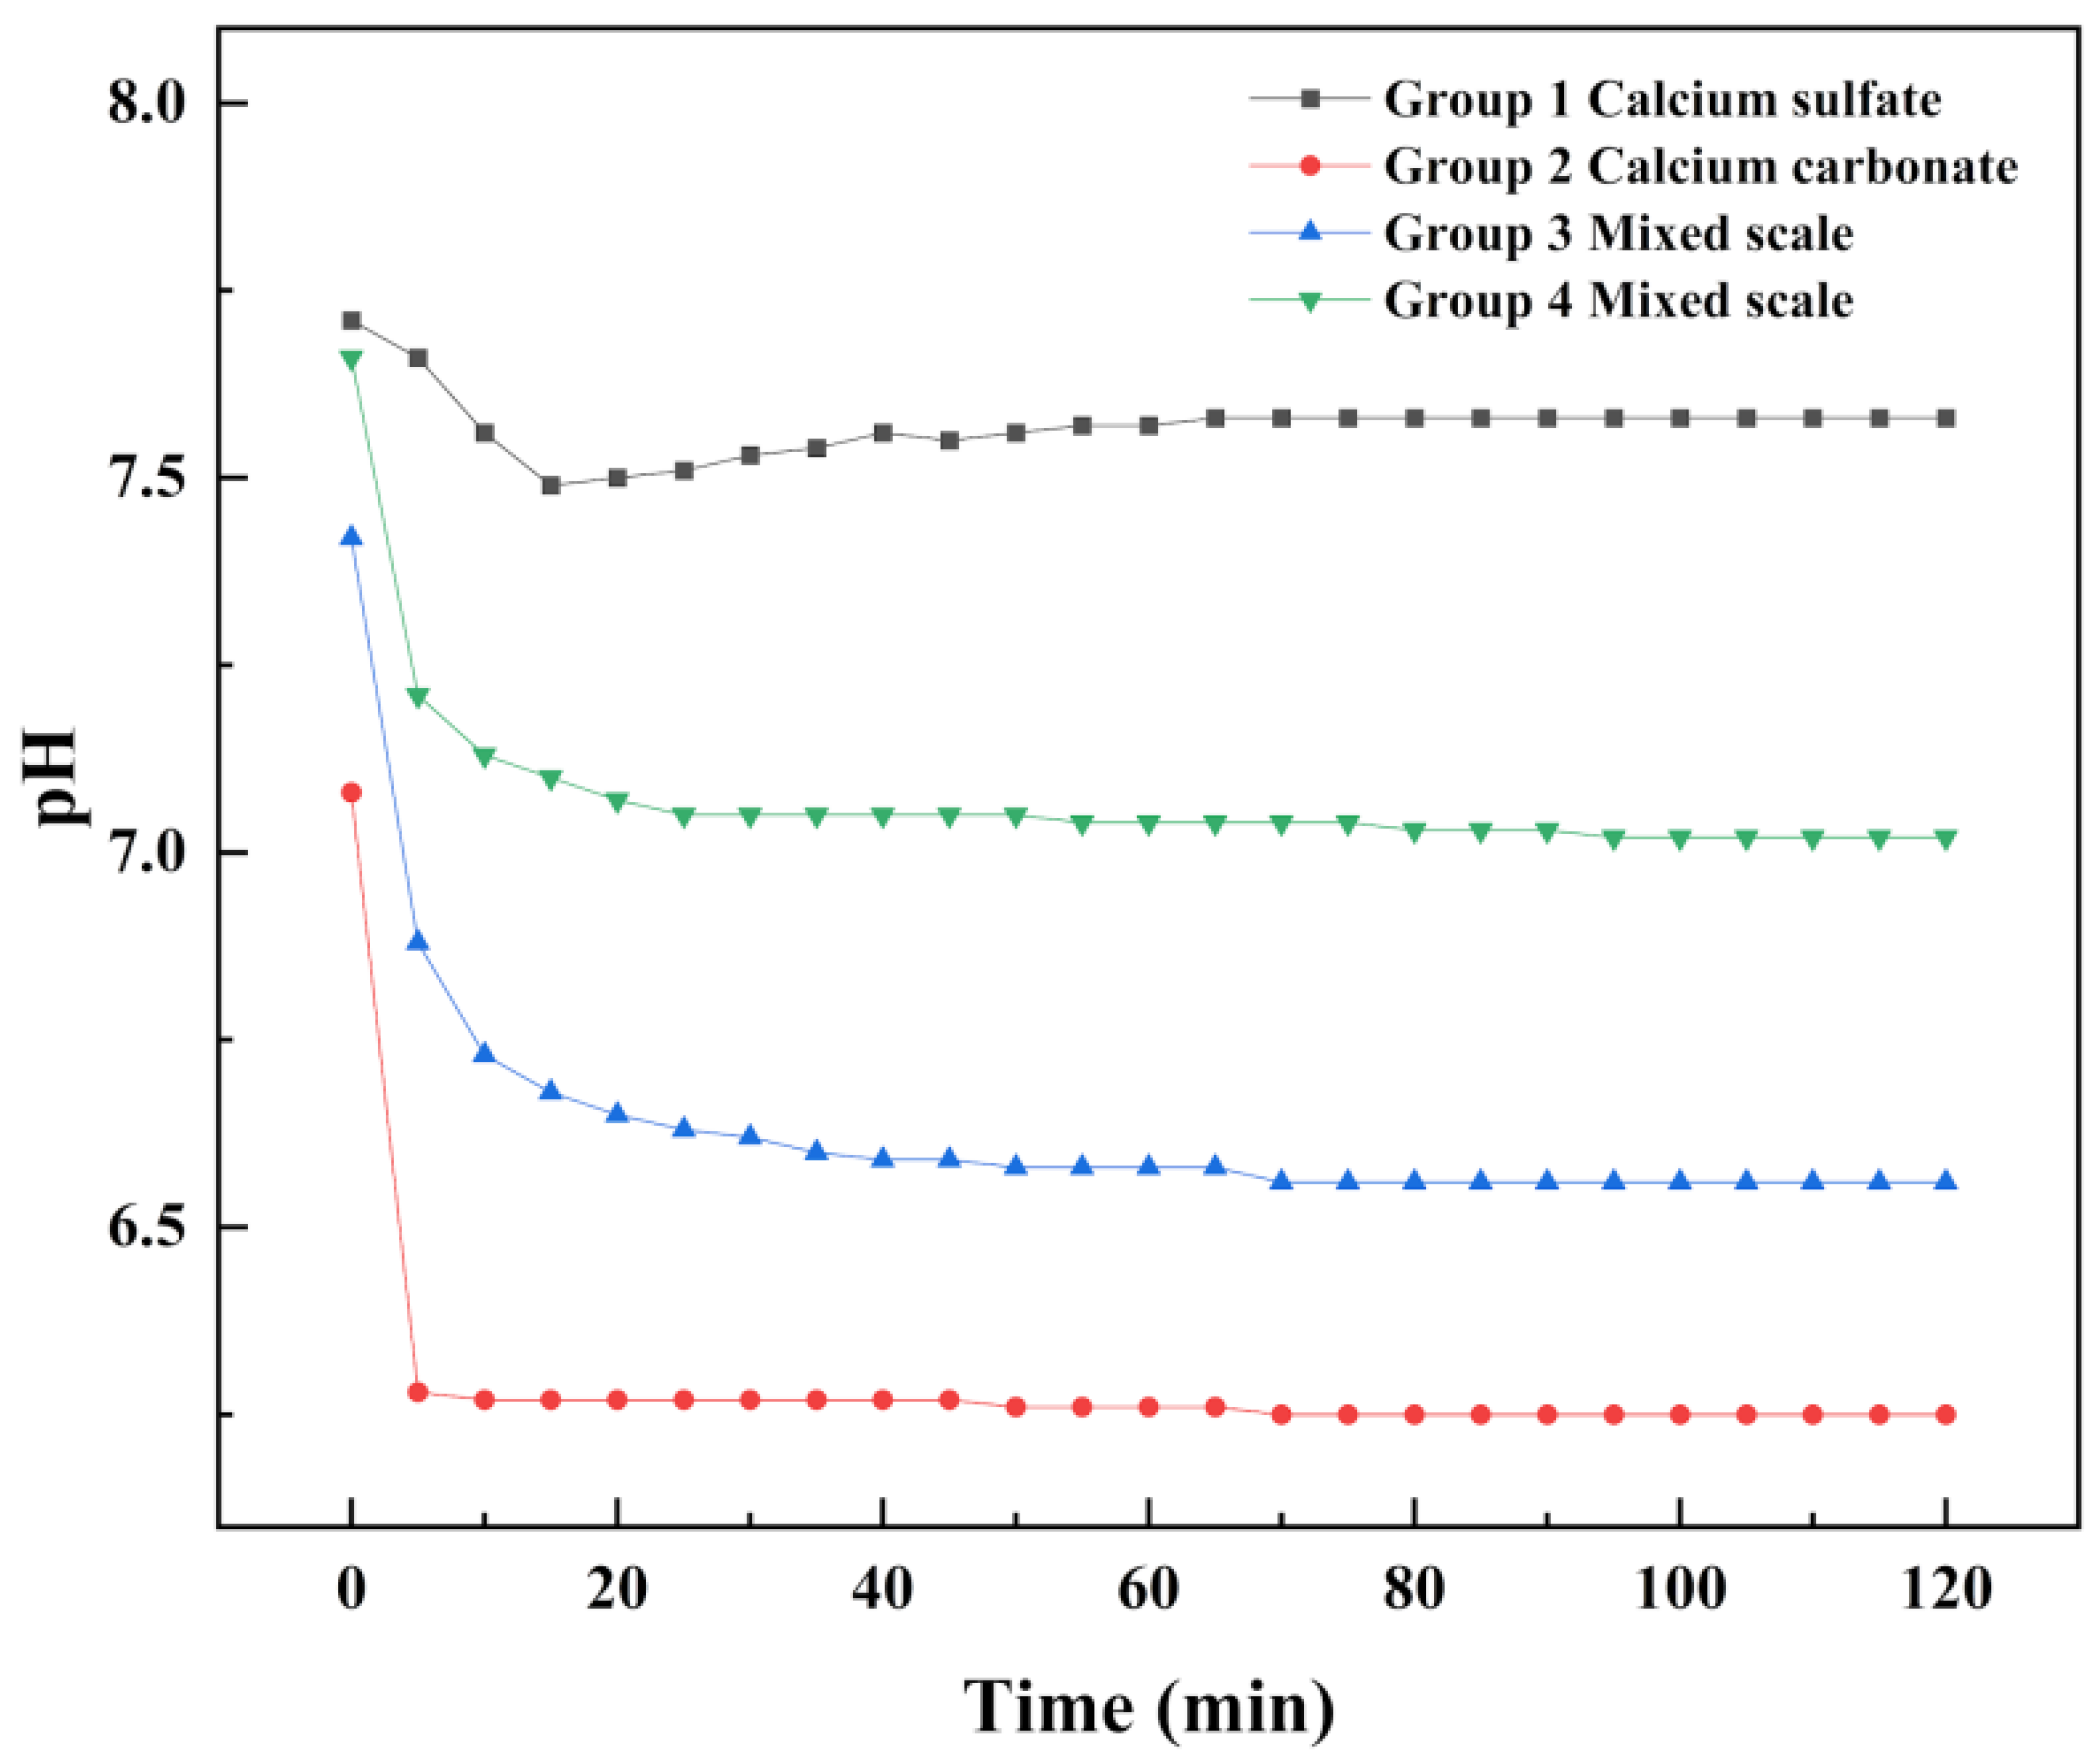
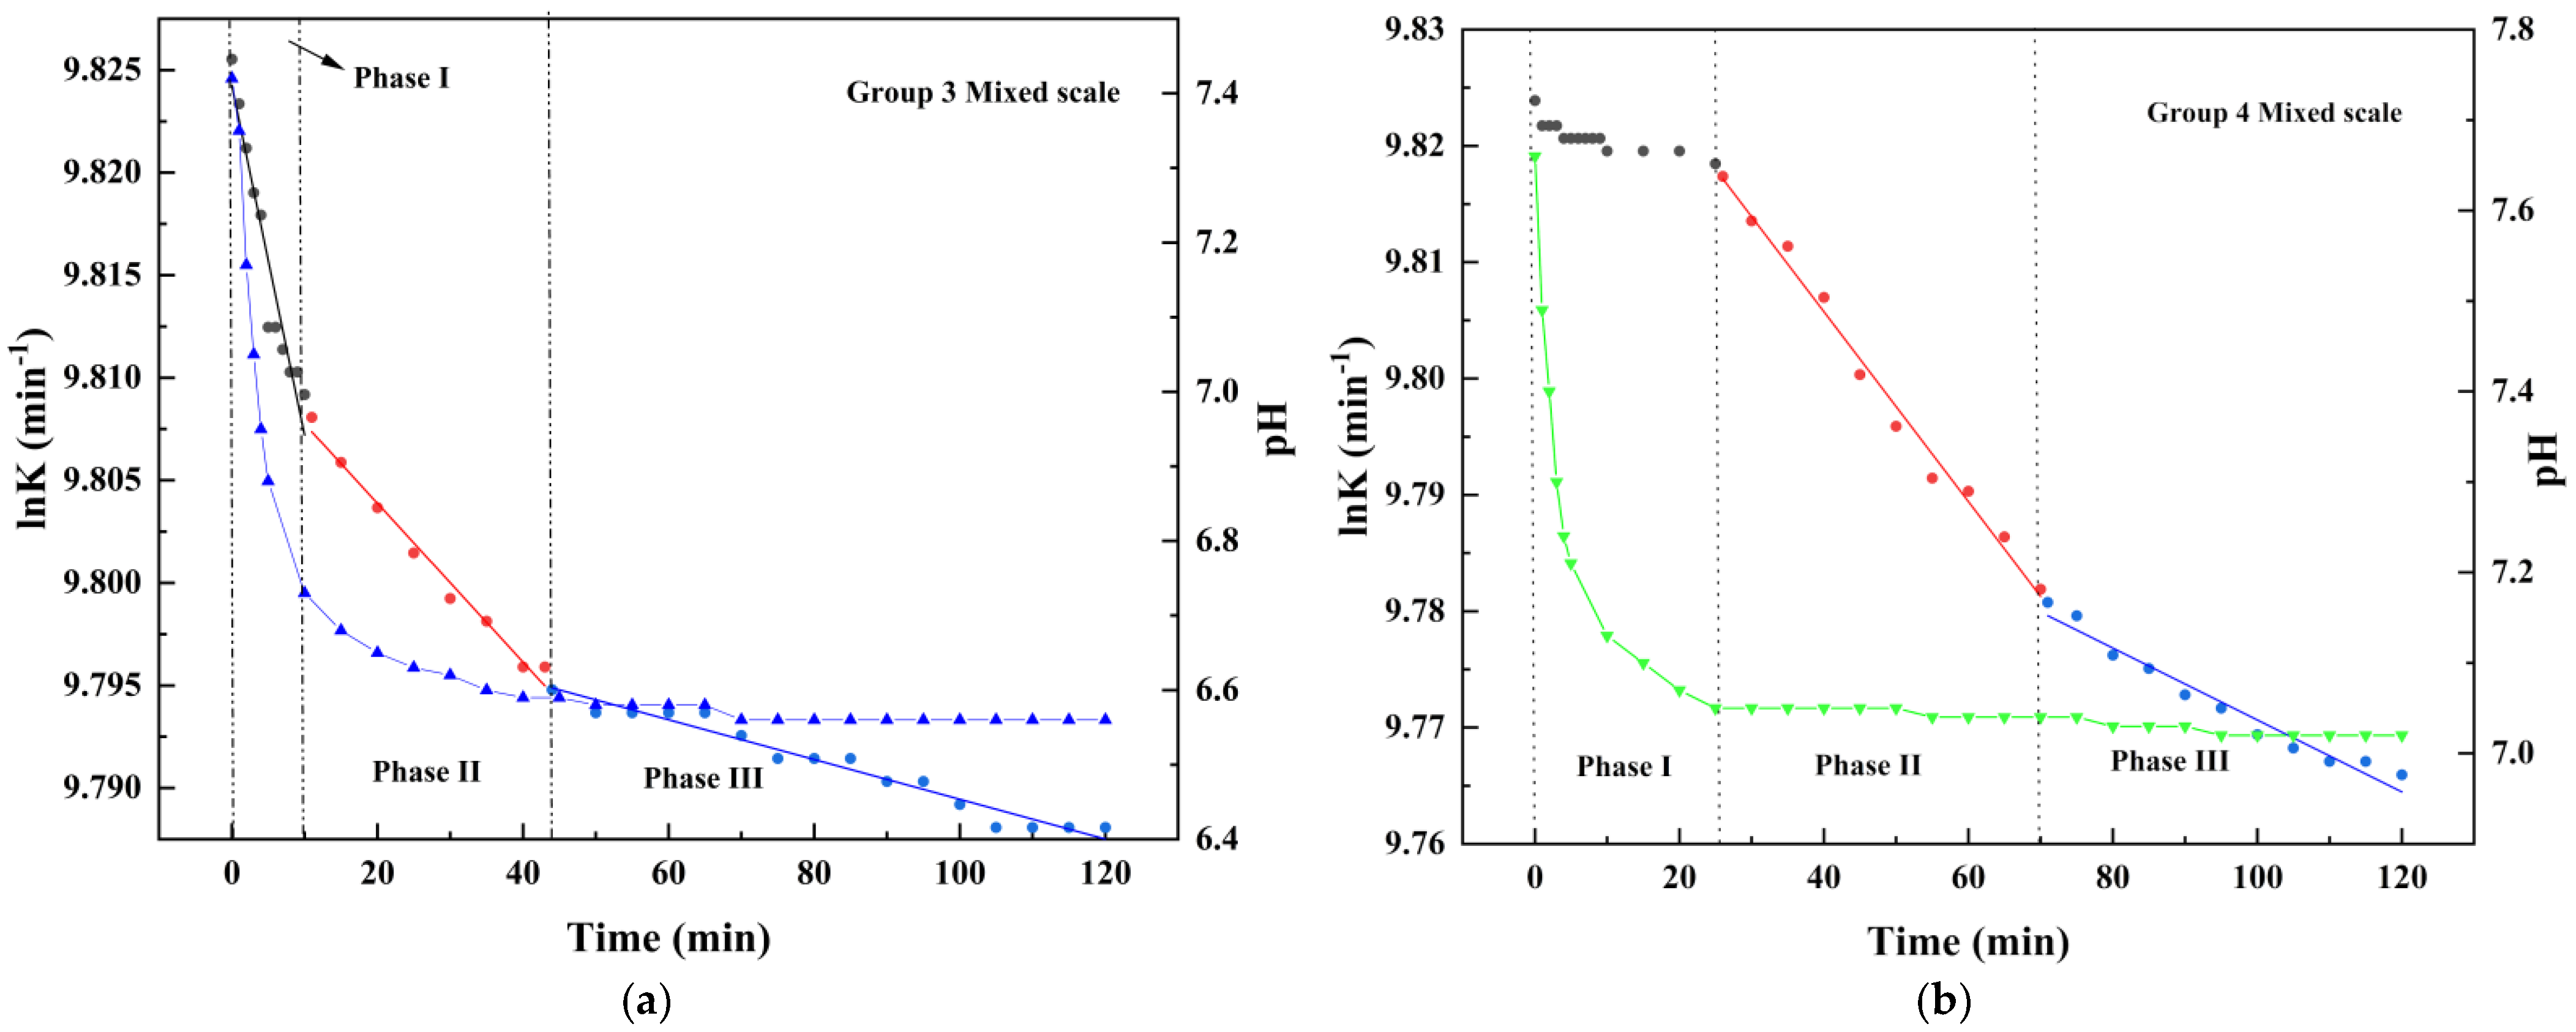
4.2. Changes of pH Value in Scale Deposition Process

It can be seen in Figure 4 that when pure calcium sulfate scale was deposited in Group 1, the pH curve of the solution first decreased, then slowly increased, and then gradually stabilized. The overall fluctuation of the pH value is small and remains weak alkaline. In Group 2, when pure calcium carbonate scale was deposited, the pH value of the solution decreased rapidly and remained stable after 5 min, the solution changed from neutral to acidic. For mixed scale co-deposition in Groups 3 and 4, the pH value of the solution decreased rapidly at the beginning of the reaction. In Group 3, the solution changed from neutral to weakly acidic. In Group 4, the solution gradually changed from weak alkaline to neutral. The comparison of Groups 1, 2, 3, and 4 showed that the pH value of the solution decreased with the increase of HCO3 content in the solution. At the same time, it was observed in the experiment that once HCO3 was added, milky white precipitate and a large number of bubbles could be observed immediately in the solution. According to Equation (2), calcium carbonate precipitate was generated at this time. This is because the Ksp value of calcium carbonate is small. When Ca2+ and CO32− meet, Ca2+ will quickly consume CO32− to generate calcium carbonate precipitation Equations (3) and (4) are thereby promoted to the right, promoting the conversion of HCO3 to CO32−, increasing the content of H+, and the acidity of the mixed solution. HCO3 and H+ combine to generate water and carbon dioxide gas Equation (5). Therefore, when the mixed scale is co-deposited, the pH value of the solution immediately decreases significantly at the beginning of the reaction, and a large number of small bubbles are generated.
When the pH value of the solution tends to be stable, it indicates that calcium carbonate crystals are basically formed. Combined with the curve of the conductivity logarithm and pH value of the mixed solution of group 3 and group 4 with time in Figure 5, we seem to be able to make a general explanation of the scale deposition during the co-deposition process. In Group 3, in the first stage, the pH and conductivity of the solution decreased rapidly, so this stage was the rapid nucleation stage of calcium carbonate. In the second stage, the pH value of the solution decreased slowly and gradually stabilized, while the decrease rate of the conductivity value was slower than that in the first stage, but it was still in a state of rapid decline. Therefore, there was nucleation and growth of calcium carbonate crystals in this stage, and the nucleation rate slowed down. At the same time, calcium sulfate crystals gradually formed. In addition, studies have shown that [56,57,58] the water quality greatly affects induction times and precipitation of calcium sulfate. In addition, an excess of cations (or other ions) plays an ever-increasing role as a result of the affinity that calcium sulfate has with precipitating other particulate matter in preference to, say, the heat-transfer surface. The species will tend to do this before homogeneous nucleation becomes a viable option. Therefore, at this stage, calcium sulfate crystals were heterogeneous nucleation by calcium sulfate molecules attached to the generated calcium carbonate crystals. The third stage, the pH value of the solution was basically unchanged, indicating that calcium carbonate crystals have been basically generated [17]. However, the conductivity value continued to decrease, indicating that calcium sulfate crystals continued to generate at this time, and were still mostly a heterogeneous nucleation process.
In Group 4, in the first stage, the pH of the solution decreased rapidly to a stable value, while the electrical conductivity decreased slowly at first and then maintained a stable value, indicating that calcium carbonate crystals had been basically generated at this stage, but calcium sulfate crystals had not been nucleation, and calcium sulfate crystals seemed to be in the induction period at this stage. In the second stage, the pH value of the solution was basically stable, while the conductivity value decreased rapidly, which proved that the calcium sulfate crystal was rapidly nucleating at this stage. There was a small amount of calcium carbonate crystal in the solution, so there must be the heterogeneous nucleation process of calcium sulfate crystal, and driven by supersaturation, there must be the homogeneous nucleation process of calcium sulfate crystal. In the third stage, the pH of the solution remained unchanged, while the conductivity continued to decrease, and the downward trend slowed down compared with the previous stage. Therefore, calcium sulfate crystals continued to nucleate and grow at this stage.

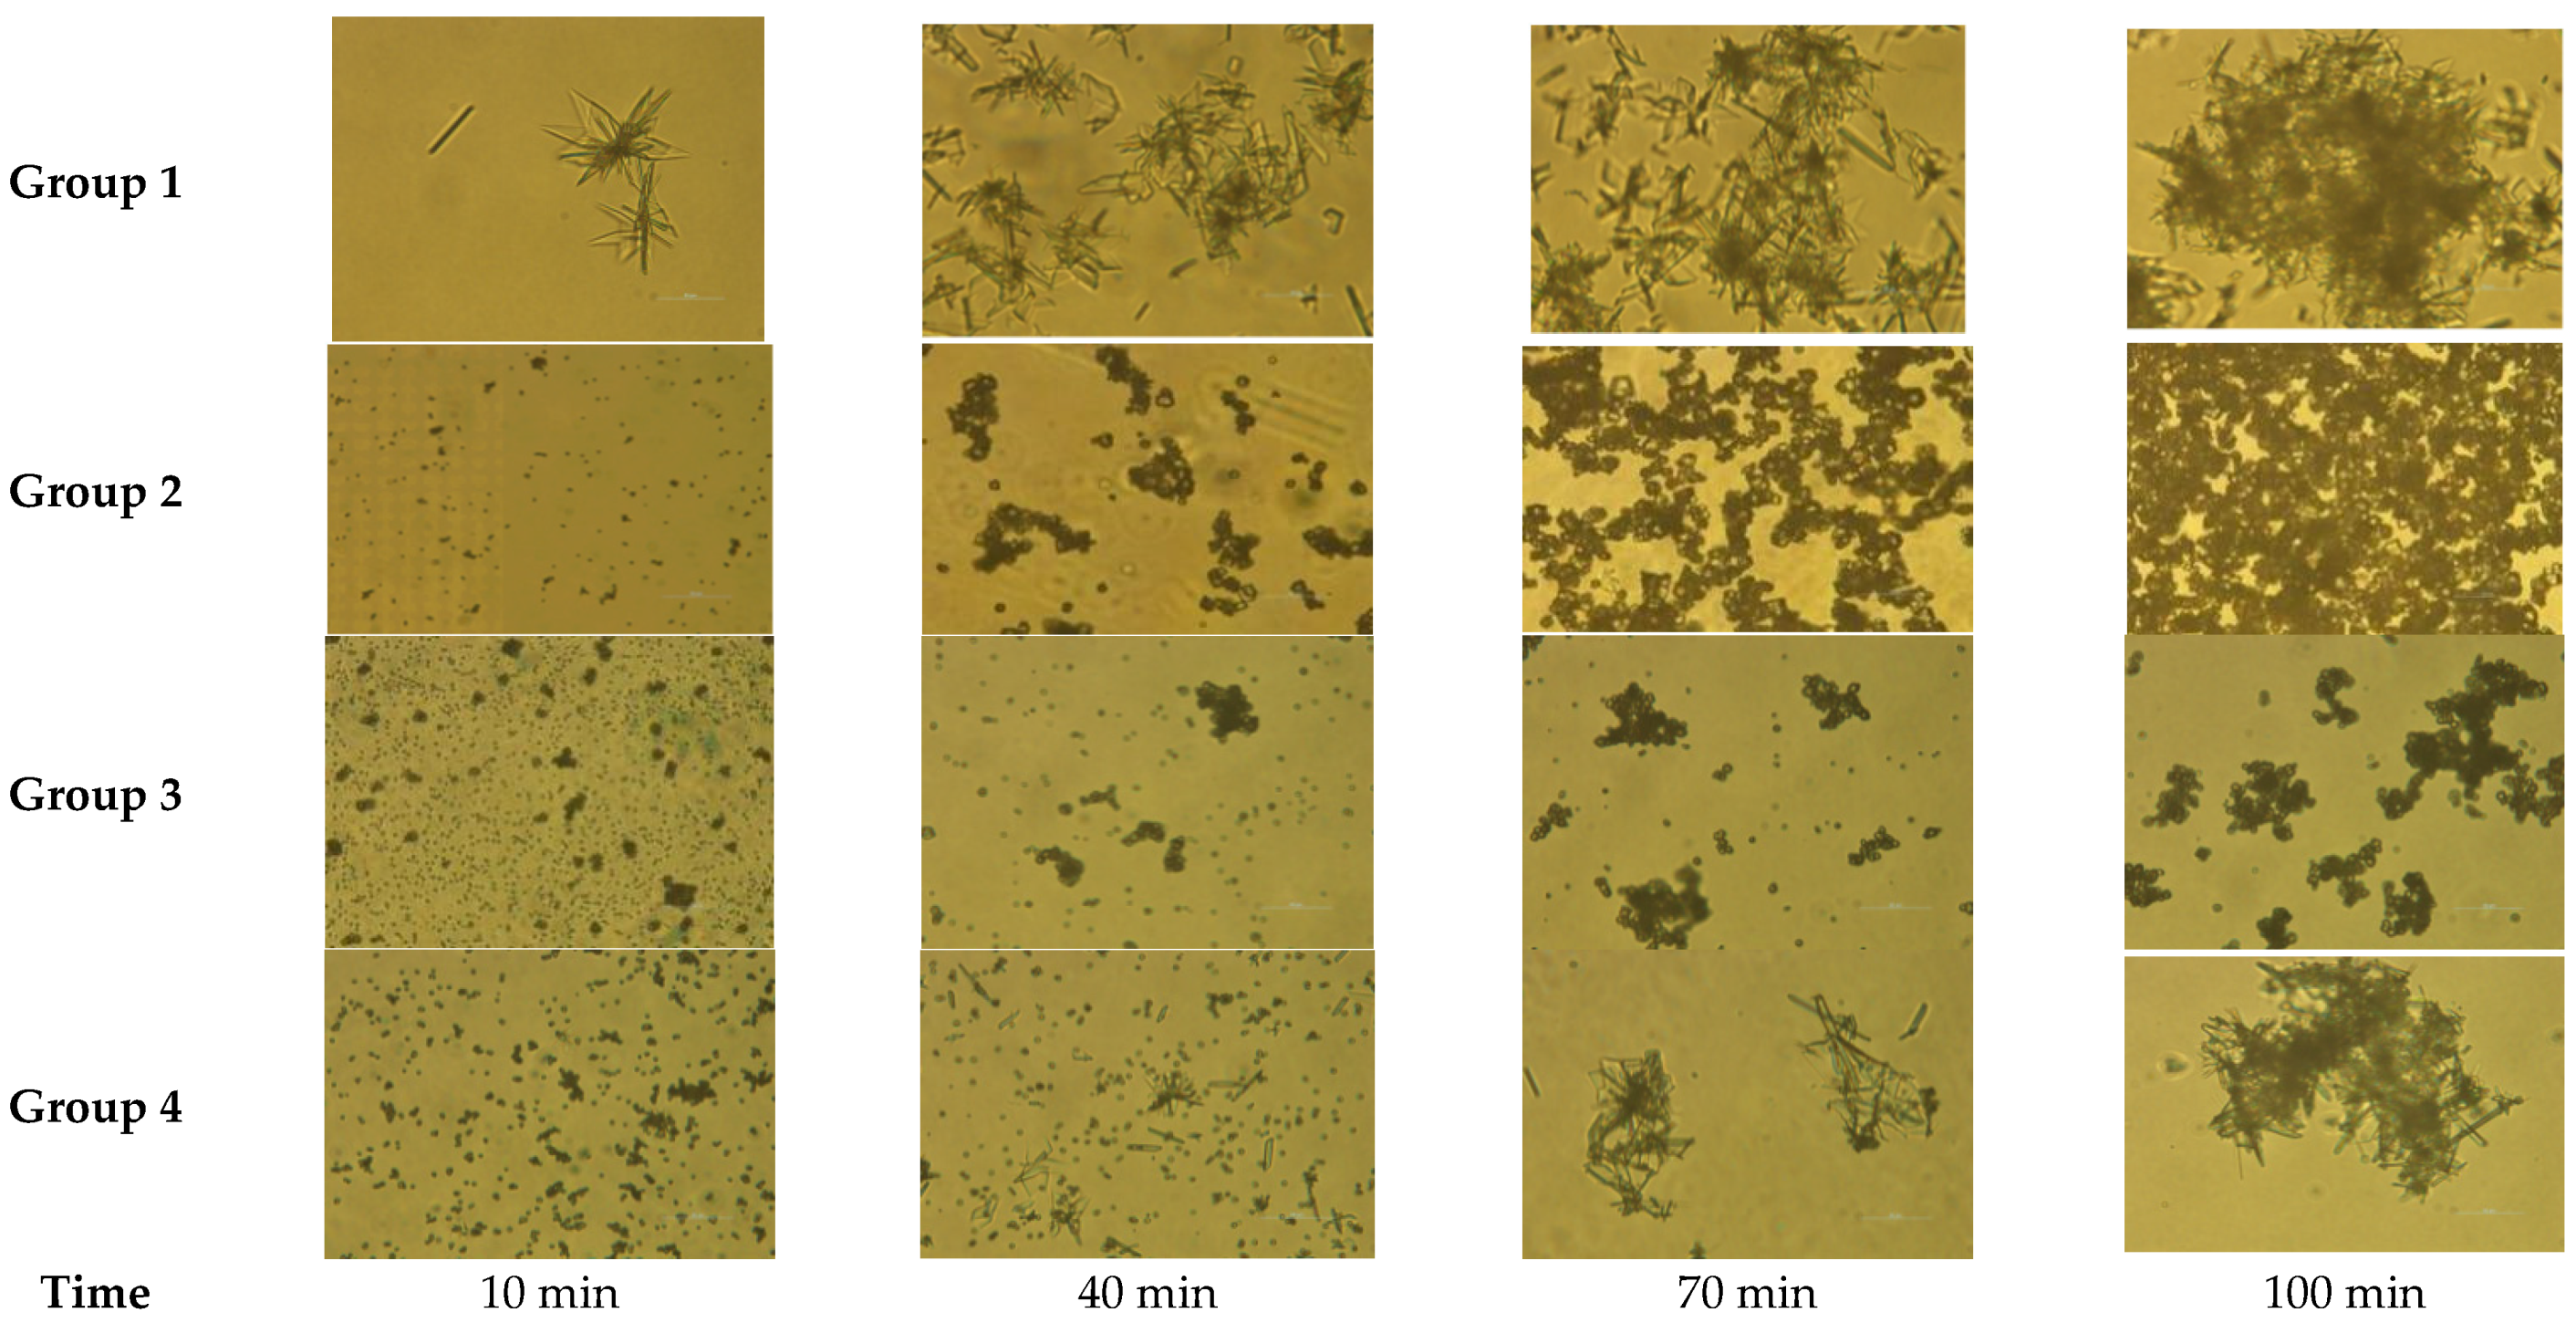
4.3. Changes of Crystal Morphology in Scale Deposition Process

As shown in Figure 6, scale formation followed the general scale growth process. After 10 min of the reaction, there were obvious crystal nuclei in each solution. Over time, the nucleation crystals continued to grow and aggregate, and the grain size increased until it finally became stable. It was also determined that the crystal morphology of calcium sulfate was a needle-like scale whisker, which was typical of calcium sulfate dihydrate or gypsum. Nancollas et al. [41], who performed batch tests on calcium sulfate dihydrate crystal growth, found similar structures. In addition, the crystal morphology of calcium carbonate consisted of fine particles, its crystal size was much smaller than that of the calcium sulfate crystals. The pure calcium sulfate scale had strong fluidity, which did not easily adhere to the wall of the beaker, and was easy to clean. In contrast, the calcium carbonate scale firmly adhered to the beaker and physical effort was required to remove it. In the mixed scale co-deposition stage, there was no obvious calcium sulfate whisker in Group 3, and the morphology of the scale crystal was similar to that of the pure calcium carbonate crystal. In Group 4, obvious calcium sulfate whiskers could be observed, granular crystal nuclei were attached to the needle crystal complex growth, and the needle crystal was smaller and shorter. When mixed, the precipitate adhered firmly to the beaker wall with a small uniform layer, and there were not many crystals floating freely in the solution. The scale particles were finer and more uniform.
This study shows that the structure of pure calcium sulfate crystals is weak and the adhesion is not strong, while the structure of pure calcium carbonate is hard and tough. Moreover, as Bramson et al. [44,58] said, pure calcium sulfate deposits were found to be far less adherent than deposits containing co precipitated calcium carbonate. The co precipitated calcium carbonate seems to act as bonding cement, considerably enhancing the strength of the calcium sulfate scale layer.

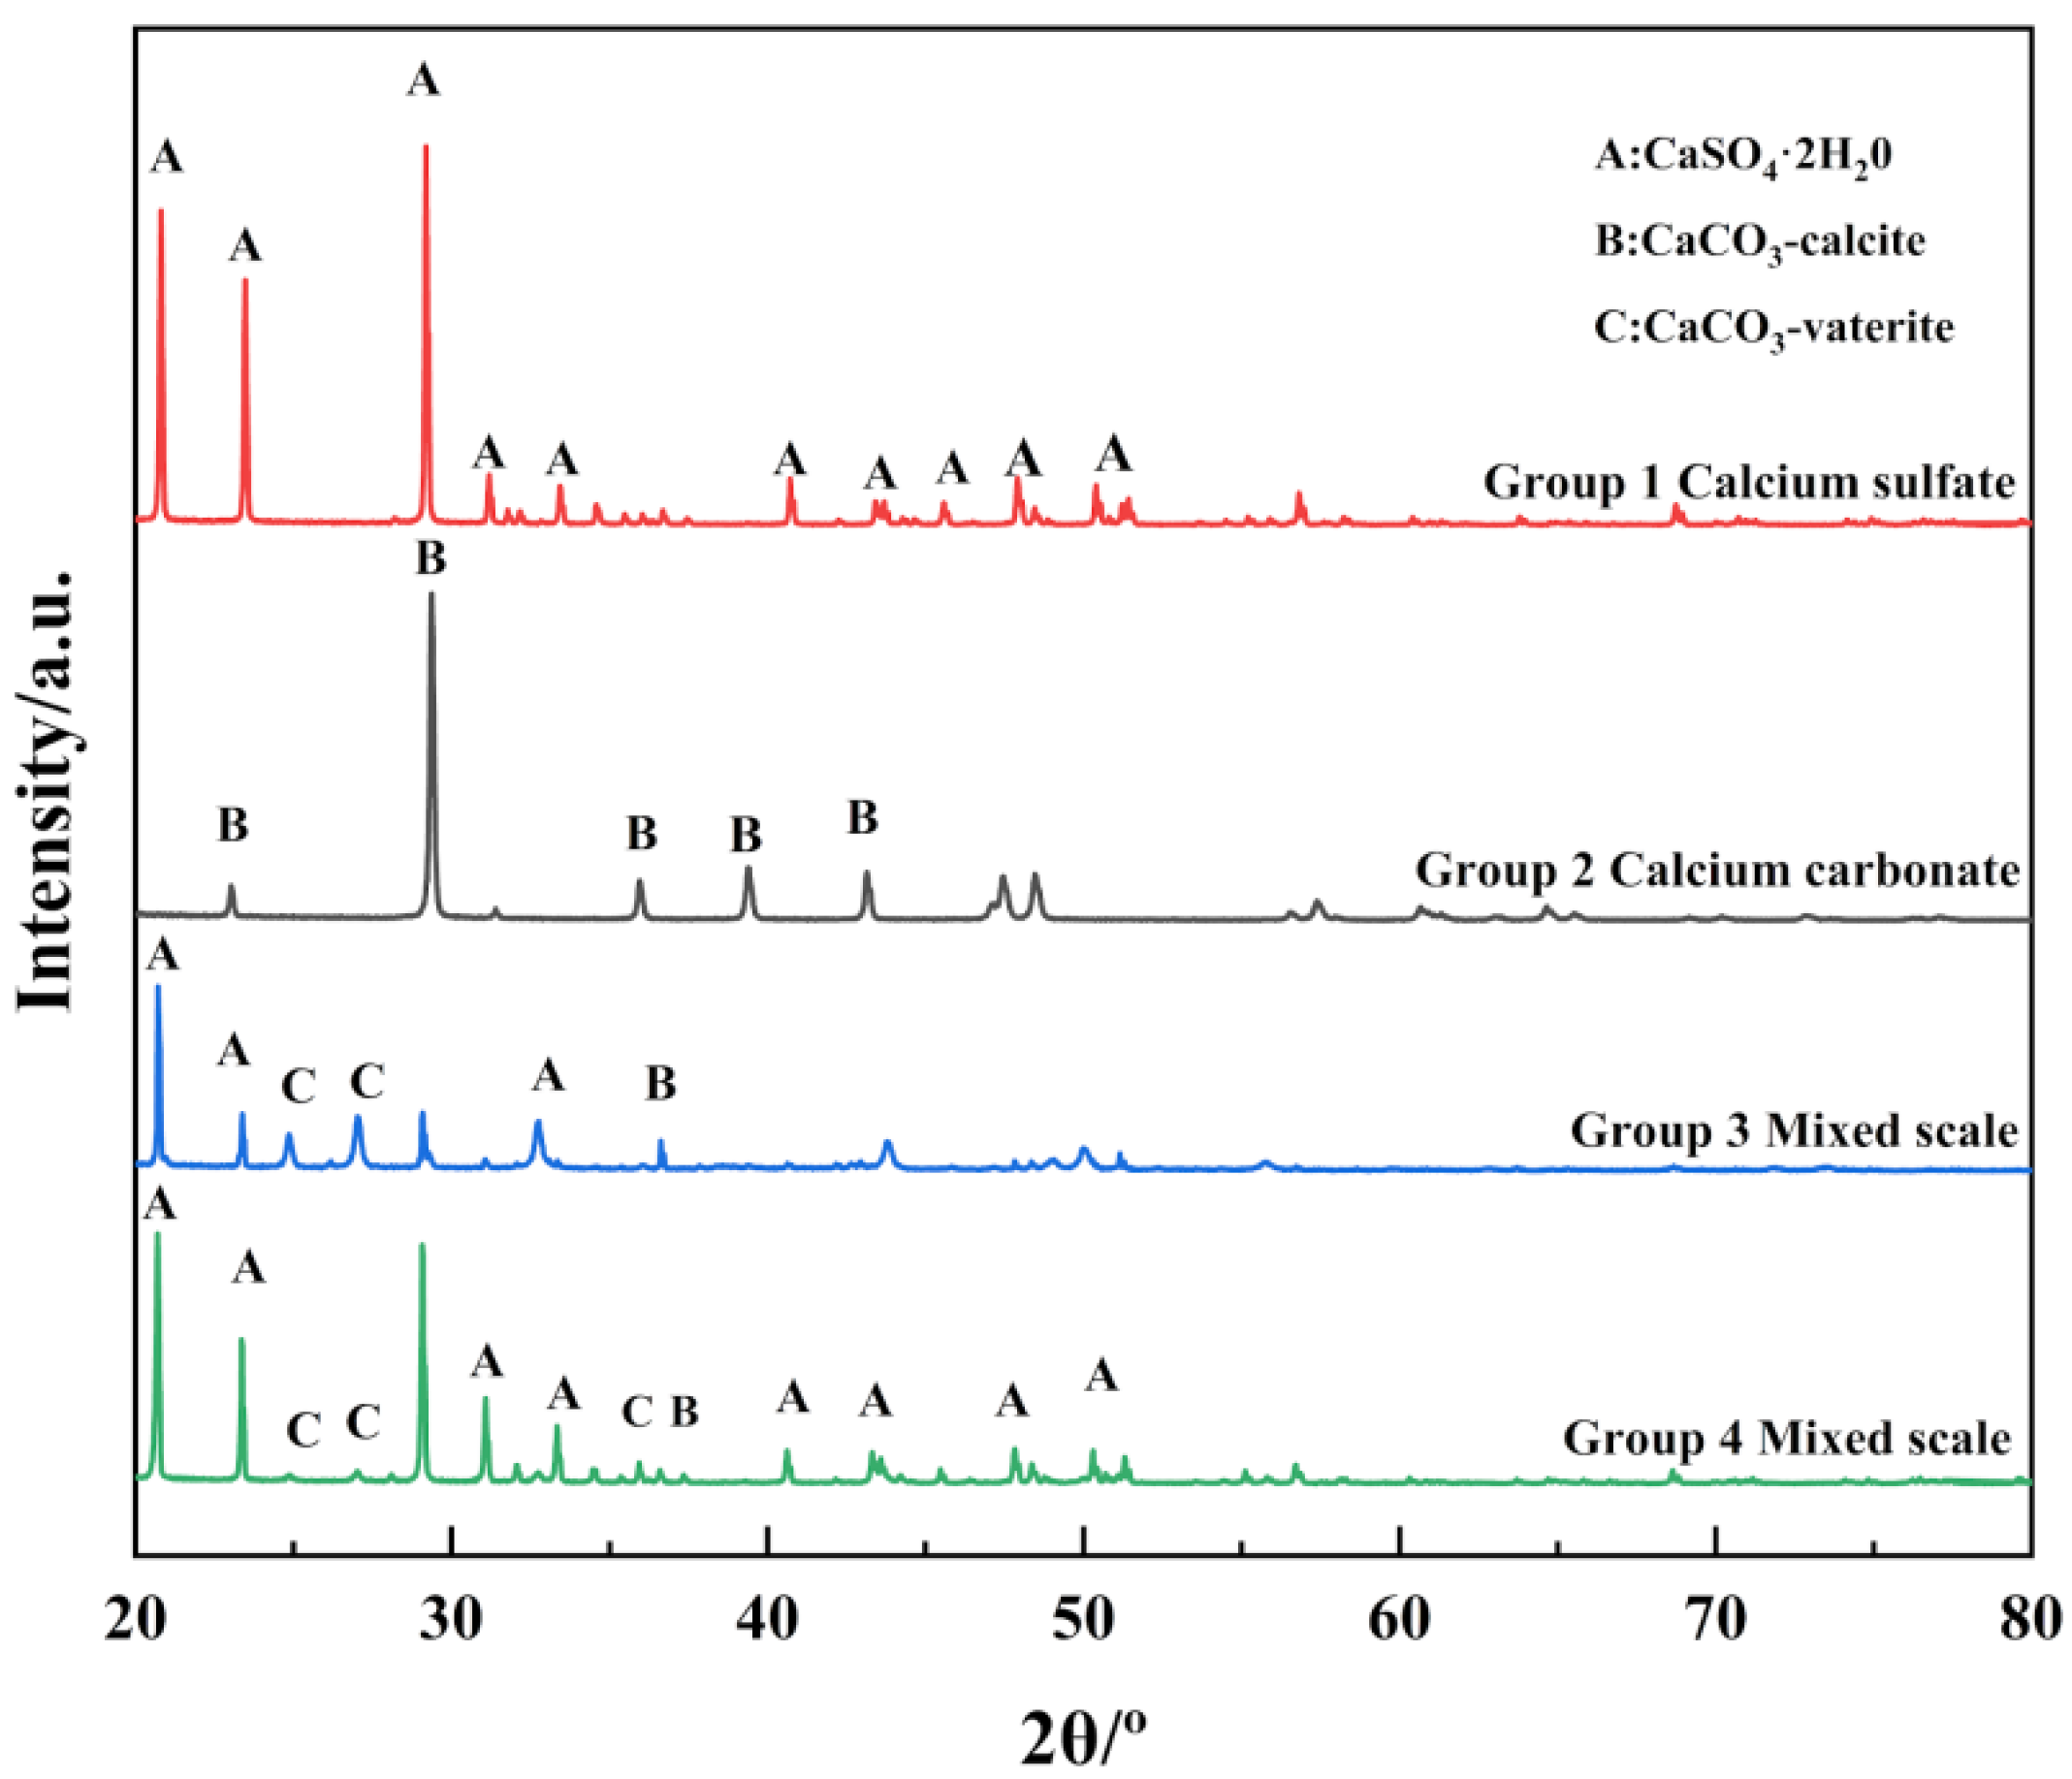
4.4. XRD Analysis of Scale Samples

As shown in Figure 7, in the pure calcium sulfate sediment of Group 1, the characteristic peak was gypsum crystals. In Group 2, which contained pure calcium carbonate sediments, the characteristic peak was formed by calcite crystals. For the mixed-scale deposition products in Groups 3 and 4, the characteristic peaks all presented the three crystal forms of gypsum, calcite, and vaterite. However, in Group 3, when the concentration ratio of SO42− to HCO3 was 1:2, the peak intensities of the characteristic peaks of calcite and vaterite were relatively high, indicating that in Group 3, the calcium carbonate scale was the dominant scale, and the calcium sulfate content was relatively small. In Group 4, when the concentration ratio of SO42− to HCO3 was 2.4:1, the characteristic peak of gypsum crystal was more obvious, and the peak intensity was higher, indicating that the calcium sulfate scale was the dominant scale in Group 4, and the content of calcium carbonate was lower.
This study shows that the crystal form of the calcium sulfate scale is a gypsum form when a pure substance is deposited and co-deposited. However, the crystal form of calcium carbonate scale in co-deposition is different from that of the pure calcium carbonate scale in the uniform calcite structure, where partly vaterite structure is shown. From the nucleation mechanism of calcium carbonate [59,60,61,62,63], it can be seen that when calcium carbonate crystals are deposited, ion clusters aggregate to form stable pre-nuclear substances (PNCs), then form amorphous structures (ACC), and then transform into metastable vaterite structures. After vaterite nucleation, the system remained supersaturated with respect to the other less soluble polymorphs [64]. The formation of calcite nuclei allowed the system to further reduce its free energy, triggering a solvent-mediated transformation process. The incorporation of sulfate stabilizes the vaterite structure and destabilizes the calcite structure. In addition, the lattice substitution of sulfate for carbonate groups can be considered the most relevant factor affecting the rate of re-crystallization [65]. In addition, the driving force for the transformation of vaterite into calcite decreases with the sulfate content in the initial solution [15,58,66], but Nebel et al. [67]. found that this process can be counteracted by accelerated ACC decomposition at high bicarbonate concentrations. Moreover, they observed that the growth rate of calcite depends on the concentration of bicarbonate rather than the concentration of carbonate. The limitation of the interaction between these two processes may require further study. In this experiment, calcium carbonate scale presents two forms of vaterite and calcite, so we mainly consider the influence of sulfate on the crystal structure of calcium carbonate.

5. CaCO3-CaSO4 Co-Deposition Model

When the concentration of Ca2+, HCO3, SO42−, and other scaling ions in the solution reaches a specific value and is greater than the concentration at the dissolution equilibrium, CaCO3-CaSO4 co-deposition occurs in the mixed solution. Based on the above experimental results, we can briefly describe the mixed scale deposition process.

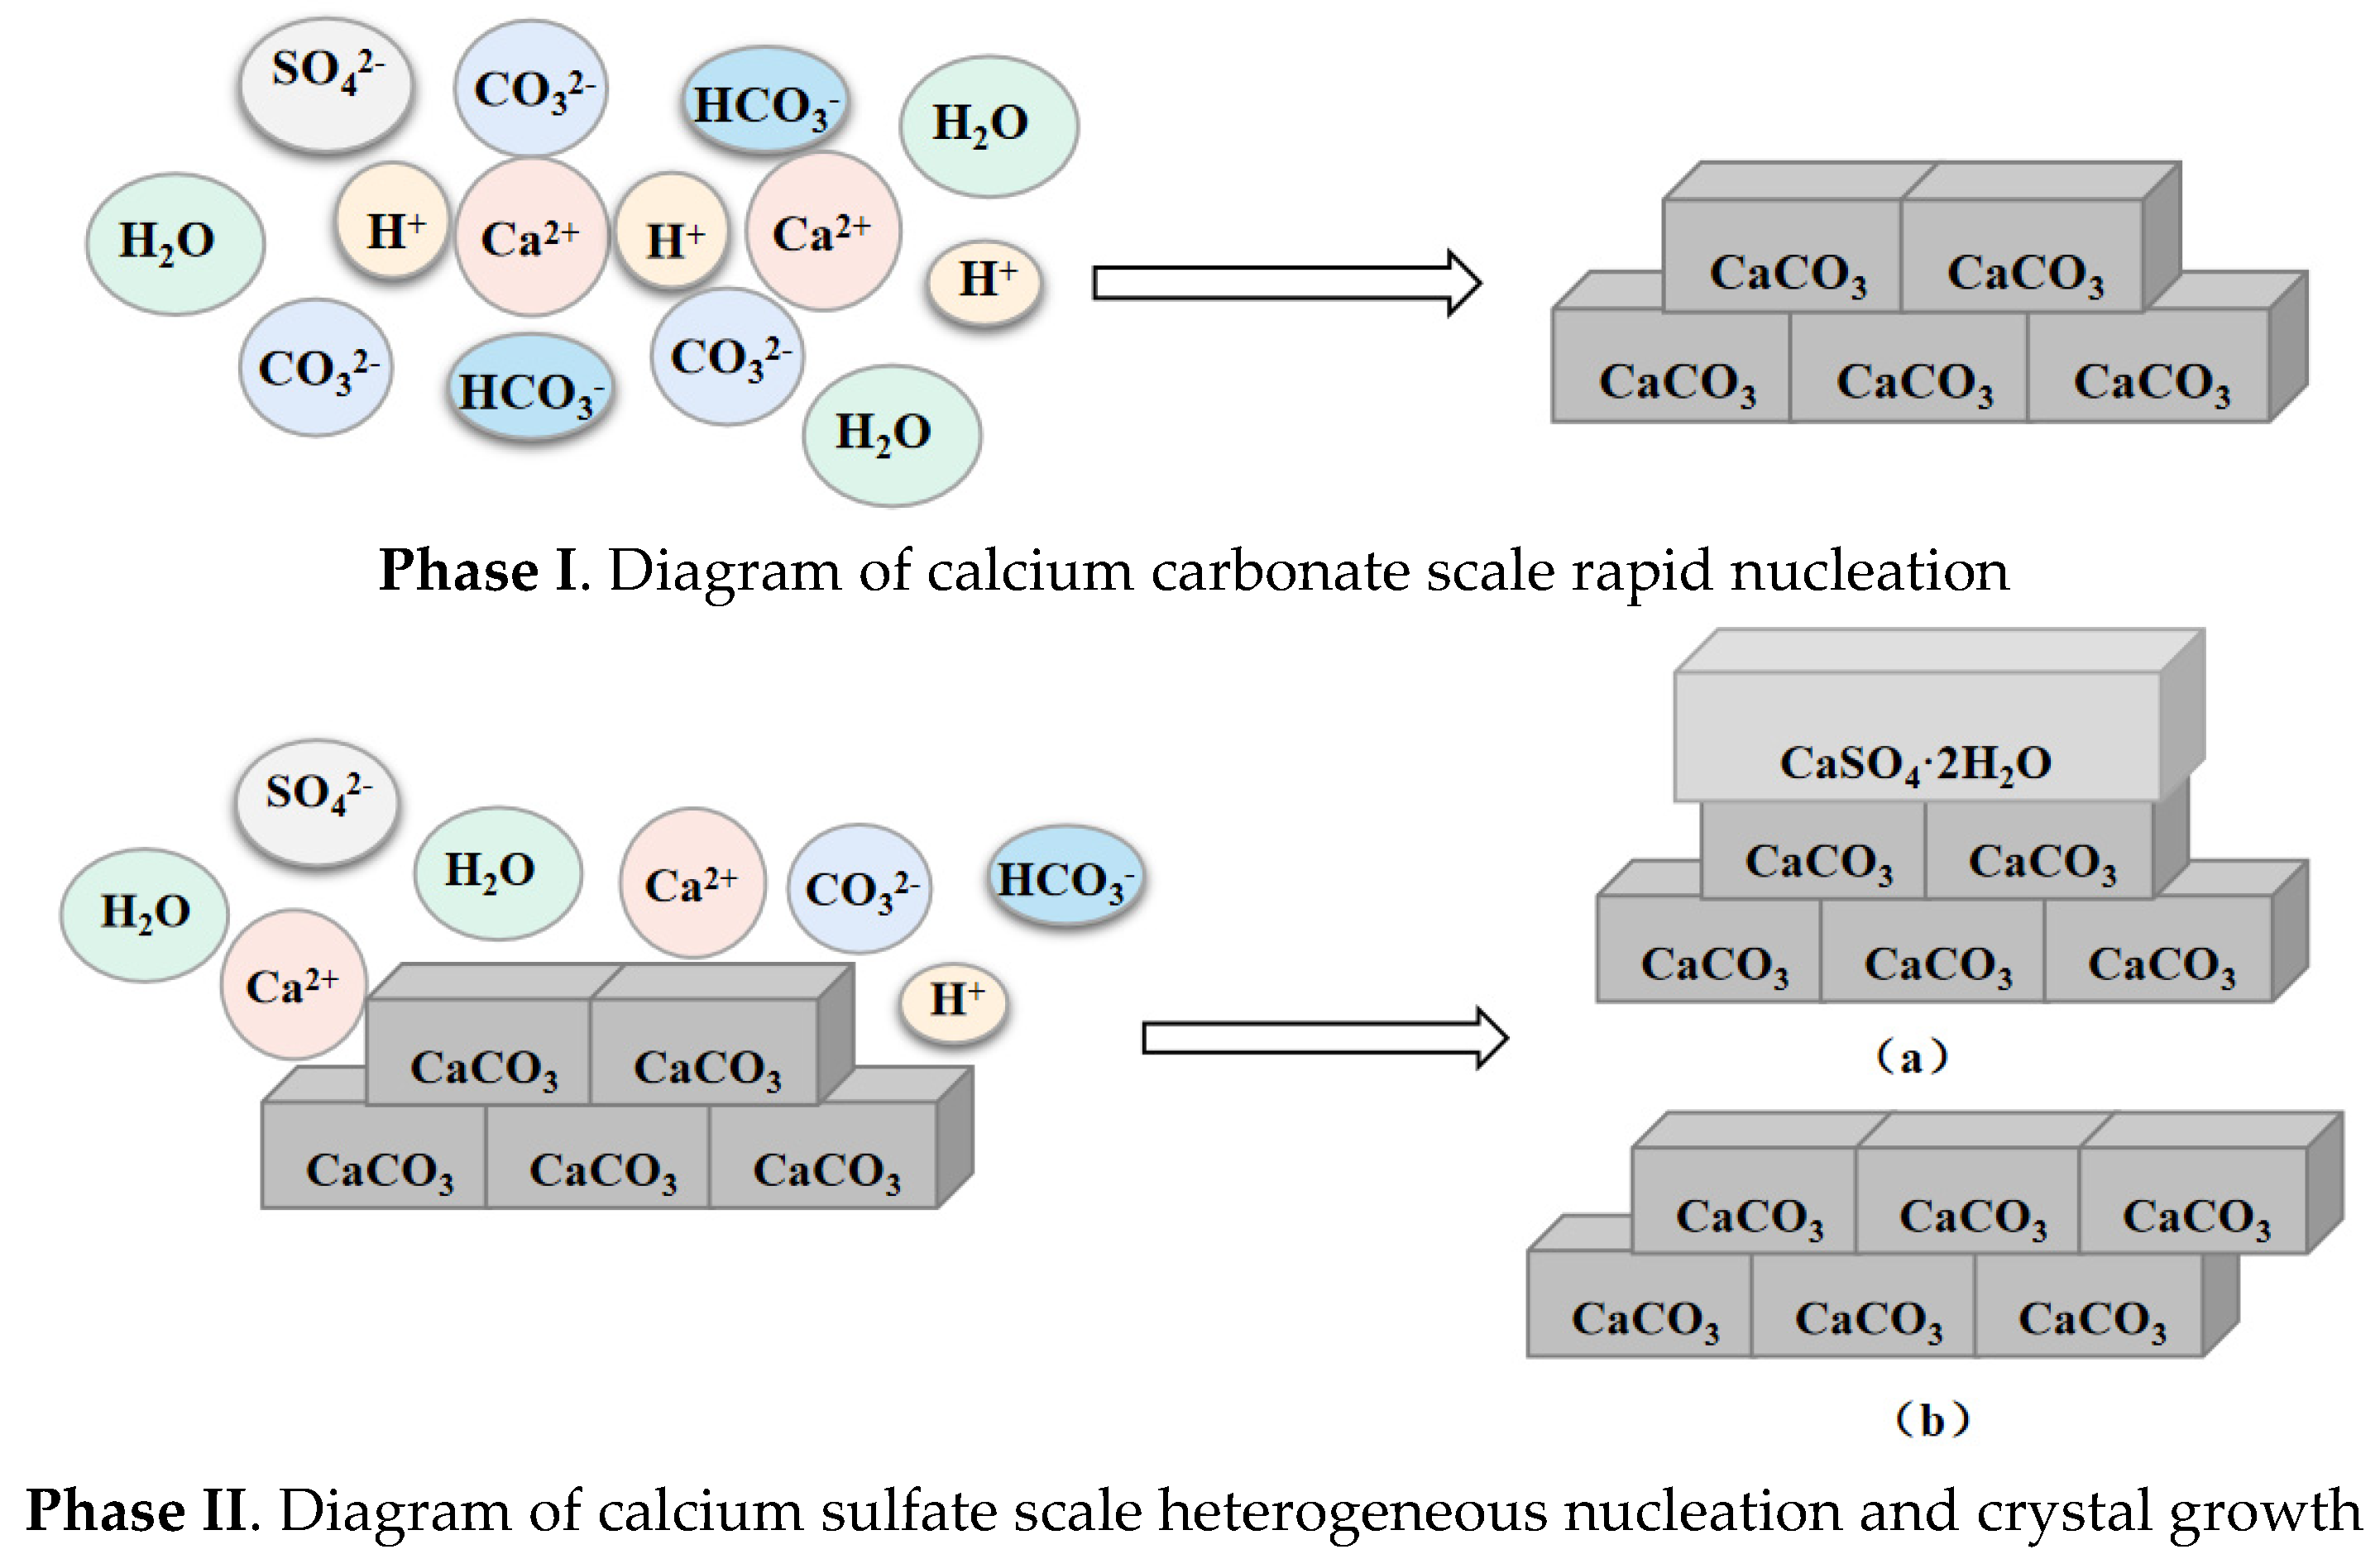
5.1. Calcium Carbonate as Dominant Scale Type during Co-Deposition

When the difference in amounts of SO42− and HCO3 in the solution is small, such as in Group 3, the calcium carbonate scale becomes the dominant scale in the mixed deposition because of the competitive advantage of CO32−. The calcium carbonate scale takes the lead in the formation and growth, while the induction period of the calcium sulfate scale is extended, and the growth is slow. Some of the initial calcium carbonate scale crystals will adsorb calcium sulfate ions as seeds and become enriched, thus inducing a heterogeneous nucleation process [56]. After nucleation, the crystals continue to grow and aggregate in the supersaturated solution. At this time, there are many calcium carbonate scales and mixed scales of calcium carbonate and calcium sulfate scale. There are two forms of calcium carbonate scale crystals: calcite and vaterite. The mixed fouling deposition process can be divided into three stages as shown in Figure 8.

5.2. Calcium Sulfate as Dominant Scale Type during Co-Deposition

However, when the SO42− content in the solution varies greatly from the HCO3 content, such as in Group 4, the calcium sulfate scale becomes the dominant scale in the mixed deposition. Initially, Ca2+ still merges with the CO32− complex to form numerous ion pairs, and rapidly generate calcium carbonate scale crystals. However, after the reaction has been occurring for some time, the HCO3 content in the solution reduces, causing less ionizable CO32− content and the rate of calcium carbonate scale crystal deposition to slow down. Large ion pairs of Ca2+ complexed with SO42− begin to nucleate to generate calcium sulfate crystals. At this time, the calcium sulfate scale has undergone a heterogeneous nucleation process caused by Ca2+ and SO42− oversaturation and the initial calcium carbonate crystals generated. After nucleation, the crystals continue to grow and accumulate in the oversaturated solution. As calcium sulfate scale crystal particle specific surface area is larger, it will adhere to smaller particles of calcium carbonate scale crystal, causing scale crystal aggregation growth. Among them, the content of the calcium carbonate scale is less, but there are still two forms of calcite and vaterite. The mixed fouling deposition process can be divided into three stages as shown in Figure 9.

6. Conclusions

(1)
In this paper, four groups of mixed solutions with equal volume, equal Ca2+ content, and anion content that can react completely with Ca2+ ions (ideal state) were studied. Obvious scaling induction, nucleation, and crystal growth periods in pure calcium sulfate scale deposition. While pure calcium carbonate scale deposition, rapid scale formation, and the scale induction period was not obvious. In the process of mixed scale co-deposition, calcium carbonate scale would take the lead in the formation, and the content of HCO3 increases, which prolonged the induction period of calcium sulfate scale, slowed the growth of calcium sulfate scale, and inhibited its growth process.
(2)
Compared with the co-deposition products containing calcium carbonate, the adhesion of pure calcium sulfate deposits was much lower. In the presence of calcium sulfate, calcium carbonate scales which were usually very adhesive and tough, lost their strength and became less adhesive. The adhesion of co-deposition products was between the calcium sulfate scale and calcium carbonate scale.
(3)
Calcium sulfate scale in the co-deposition and pure material deposition, no significant difference in the crystalline form, gypsum form. The scale of calcium carbonate in co-deposition is different from those in pure material deposition. In pure material deposition, the calcium carbonate scale deposition form was mostly stable calcite form. When co-deposition occurs, SO42 might occupy the active sites on the crystal surface, inhibit the crystal growth of the calcium carbonate scale, and make it difficult to transform from vaterite to calcite.

Author Contributions

Conceptualization, J.S.; Data curation, T.Y., J.S. and J.L.; Formal analysis, Y.Y.; Investigation, H.Z.; Methodology, H.Z. and C.Q.; Writing—original draft, Y.Y. and T.Y.; Writing—review & editing, Y.Y., T.Y., J.S., C.Q., J.L. and B.Y. All authors have read and agreed to the published version of the manuscript.

Funding

This research was funded by the external cooperation project of scientific research and technology development of CNPC safety and Environmental Protection Technology Research Institute Co., Ltd., grant number 2019D-5006-62.

Institutional Review Board Statement

Not applicable.

Informed Consent Statement

Not applicable.

Data Availability Statement

Data is contained within the article. The data presented in this study can be seen in the content above.

Acknowledgments

The work was supported by the external cooperation project of scientific research and technology development of CNPC safety and Environmental Protection Technology Research Institute Co., Ltd. (2019D-5006-62).

Conflicts of Interest

The authors declare no conflict of interest.

References

  1. Abdel-Aal, N.; Satoh, K.; Sawada, K. Study of Adhesion Mechanism of Calcareous Scaling by Using Quartz Crystal Microbalance Technique. Anal. Sci. Suppl. 2007, 17, i825–i828. [Google Scholar]
  2. Lioliou, M.G.; Paraskeva, C.A.; Koutsoukos, P.G.; Payatakes, A.C. Heterogeneous nucleation and growth of calcium carbonate on calcite and quartz. J. Colloid Interface Sci. 2007, 308, 421–428. [Google Scholar] [CrossRef] [PubMed]
  3. Wu, X.M.; Fu, W.; Bai, H.T.; Zhou, L.; Ma, Y. Study on Compatibility between Formation Water and Injection Water in Jiyuan Oilfield. Oilfield Chem. 2012. Available online: https://en.cnki.com.cn/Article_en/CJFDTotal-YJHX201201008.htm (accessed on 20 November 2021).
  4. Bukuaghangin, O.; Sanni, O.; Kapur, N.; Huggan, M.; Neville, A.; Charpentier, T. Kinetics study of barium sulphate surface scaling and inhibition with a once-through flow system. J. Pet. Sci. Eng. 2016, 147, 699–706. [Google Scholar] [CrossRef] [Green Version]
  5. Al-Amrie, O.; Peltier, S.; Pearce, A.; Abu-Dhabi, T.; Al-Yafei, A.; Morel, D.; Bourrel, M.; Bursaux, R.; Cordelier, P.; Jouenne, S.; et al. The first successful chemical EOR pilot in the UAE: One spot pilot in high temperature, high salinity carbonate reservoir. In Proceedings of the Abu Dhabi International Petroleum Exhibition and Conference, Abu Dhabi, United Arab Emirates, 15–18 November 2015. [Google Scholar]
  6. Bodin, H.; Persson, J.; Englund, J.E.; Milberg, P. Influence of residence time analyses on estimates of wetland hydraulics and pollutant removal. J. Hydrol. 2013, 501, 1–12. [Google Scholar] [CrossRef]
  7. Naseri, S.; Moghadasi, J.; Jamialahmadi, M. Effect of temperature and calcium ion concentration on permeability reduction due to composite barium and calcium sulfate precipitation in porous media. J. Nat. Gas Sci. Eng. 2015, 22, 299–312. [Google Scholar] [CrossRef]
  8. Ramstad, K.; Tydal, T.; Askvik, K.M.; Fotland, P. Predicting Carbonate Scale in Oil Producers from High-Temperature Reservoirs. SPE J. 2005, 10, 363–373. [Google Scholar] [CrossRef]
  9. Moghadasi, J.; Jamialahmadi, M.; Müller-Steinhagen, H.; Sharif, A.; Ghalambor, A.; Izadpanah, M.R.; Motaie, E. Scale formation in Iranian oil reservoir and production equipment during water injection. In Proceedings of the International Symposium on Oilfield Scale, Aberdeen, UK, 29–30 January 2003. [Google Scholar]
  10. Tung, N.P.; Phuong, N.T.P.; Long, B.Q.K.; Duy, N.H. Scale Inhibitors for Co-Deposited Calcium Sulfate and Calcium Carbonate in Squeeze Process in White Tiger Oilfield. SPE J. 2004, 87467. [Google Scholar] [CrossRef]
  11. Da, S.; Kpsor, E.; Soletti, J.I.; De, C.E. Coalescence process to treat produced water: An updated overview and environmental outlook. Environ. Sci. Pollut. Res. Int. 2019, 26, 28668–28688. [Google Scholar]
  12. Amiri, M.; Moghadasi, J.; Jamialahmadi, M.; Shahri, M.P. Prediction of the Amount of Calcium Carbonate Scale Formation in Iranian Oilfields at Different Pressures. Energy Sources 2013, 35, 1197–1209. [Google Scholar] [CrossRef]
  13. Kapolos, J.; Koutsoukos, P.G. Formation of Calcium Phosphates in Aqueous Solutions in the Presence of Carbonate Ions. Langmuir 1999, 15, 6557–6562. [Google Scholar] [CrossRef]
  14. Charles, C.; David, C.; Arne, J. Measuring residence time distributions of wood chips in a screw conveyor reactor. Fuel Process. Technol. 2018, 178, 271–282. [Google Scholar]
  15. Koutsoukos, P.G.; Kapetanaki, E. Mixed calcium carbonate and calcium sulfate scale. In Proceedings of the corrosion 2016, Vancouver, BC, Canada, 6–10 March 2016. [Google Scholar]
  16. Mitchell, R.W.; Bowyer, P.M. Water injection methods. In Proceedings of the International Petroleum Exhibition and Technical Symposium of the Society of Ptoleum Engineers, Beijing, China, 17–23 March 1982. [Google Scholar]
  17. Sudmalis, M.; Sheikholeslami, R. Coprecipitation of CaCO3 and CaSO4. Can. J. Chem. Eng. 2010, 78, 21–31. [Google Scholar] [CrossRef]
  18. Klepetsanis, P.G.; Dalas, E.; Koutsoukos, P.G. Role of Temperature in the Spontaneous Precipitation of Calcium Sulfate Dihydrate. Langmuir 1999, 15, 1534–1540. [Google Scholar] [CrossRef]
  19. Lin, P.; Huang, S. The Effect of Temperatures on Calcium Carbonate Scale Formation. Chem. Eng. Oil Gas 1999, 28, 128–129. [Google Scholar]
  20. Yu, H.; Sheikholeslami, R.; Doherty, W. Mechanisms, thermodynamics and kinetics of composite fouling of calcium oxalate and amorphous silica in sugar mill evaporators—A preliminary study. Chem. Eng. Sci. 2002, 57, 1969–1978. [Google Scholar] [CrossRef]
  21. Helal, A.A.; Soames, A.D.; Gubner, R.; Iglauer, S.; Barifcani, A. Evaluating chemical-scale-inhibitor performance in external magnetic fields using a dynamic scale loop. J. Pet. Sci. Eng. 2019, 179, 1063–1077. [Google Scholar] [CrossRef]
  22. Davis, R.V.; Carter, P.W.; Kamrath, M.A.; Johnson, D.A.; Reed, P.E. The Use of Modern Methods in the Development of Calcium Carbonate Inhibitors for Cooling Water Systems; Springer: New York, NY, USA, 1995; pp. 33–46. [Google Scholar]
  23. Oddo, J.E.; Tomson, M.B. Why Scale Forms and How to Predict It. SPE Prod. Facil. 1994, 9, 47–54. [Google Scholar] [CrossRef]
  24. Alroomi, Y.M.; Hussain, K.F. Potential kinetic model for scaling and scale inhibition mechanism. Desalination 2016, 393, 186–195. [Google Scholar] [CrossRef]
  25. Al-Hamzah, A.A.; Wallace, A.D.; East, C.P.; Doherty, W.; Smith, E.; Fellows, C.M. Inhibition by Poly (acrylic acid) and Morphological Changes in Calcium Carbonate and Calcium Carbonate/Calcium Sulfate Crystallization on Silica Fibers. Ind. Eng. Chem. Res. 2014, 53, 8793–8803. [Google Scholar] [CrossRef]
  26. Elkholy, A.E.; Heakal, E.T.; Rashad, A.M.; Zakaria, K. Monte Carlo simulation for guar and xanthan gums as green scale inhibitors. J. Pet. Sci. Eng. 2018, 166, 263–273. [Google Scholar] [CrossRef]
  27. Senthilmurugan, B.; Ghosh, B.; Sanker, S. High performance maleic acid based oil well scale inhibitors—Development and comparative evaluation. J. Ind. Eng. Chem. 2011, 17, 415–420. [Google Scholar] [CrossRef]
  28. Sheikholeslami, R. Mixed salts—Scaling limits and propensity. Desalination 2003, 154, 117–127. [Google Scholar] [CrossRef]
  29. Natsi, P.D.; Rokidi, S.; Koutsoukos, P.G. Precipitation of calcium carbonate in aqueous solutions in presence of ethylene glycol and dodecane. Agric. Food Sci. J. Ghana 2010, 17. Available online: https://meetingorganizer.copernicus.org/EGU2015/EGU2015-9631.pdf (accessed on 20 November 2021).
  30. Cosmo, R.P.; Pereira, F.; Ribeiro, D.; Barros, W.Q.; Martins, A.L. Estimating CO2 degassing effect on CaCO3 precipitation under oil well conditions. J. Pet. Sci. Eng. 2019, 181, 106207. [Google Scholar] [CrossRef]
  31. Ghasemian, J.; Riahi, S.; Ayatollahi, S.; Mokhtari, R. Effect of salinity and ion type on formation damage due to inorganic scale deposition and introducing optimum salinity. J. Pet. Sci. Eng. 2019, 177, 270–281. [Google Scholar] [CrossRef]
  32. Sangwal, K. Induction period for crystallization. In Nucleation and Crystal Growth; John Wiley & Sons, Inc.: Hoboken, NY, USA, 2018; pp. 325–359. [Google Scholar]
  33. Hnel, O.S.; Mullin, J.W. Interpretation of Crystallization Induction Peroids. J. Colloid Interface Sci. 1988, 123, 43–50. [Google Scholar]
  34. Tadier, S.; Rokidi, S.; Rey, C.; Combes, C.; Koutsoukos, P.G. Crystal growth of aragonite in the presence of phosphate. J. Cryst. Growth 2016, 458, 44–52. [Google Scholar] [CrossRef] [Green Version]
  35. Bursaux, R.; Peltier, S.; Nguyen, M.; Romero, C.; Morel, D. Single well tracer test results in a high temperature, high salinity offshore carbonate reservoir for chemical eor pilot evaluation. In Proceedings of the SPE Improved Oil Recovery Conference, Tulsa, OK, USA, 11–13 April 2016. [Google Scholar]
  36. Nancollas, H.G.; Reddy, M.M. The crystallization of calcium carbonate. II. Calcite growth mechanism. J. Colloid Interface Sci. 1971, 37, 824–830. [Google Scholar] [CrossRef]
  37. Khormali, A.; Petrakov, D.G.; Lamidi, A.L.B.; Rastegar, R. Prevention of calcium carbonate precipitation during water injection into high-pressure high-temperature wells. In Proceedings of the SPE European Formation Damage Conference and Exhibition, Budapest, Hungary, 3–5 June 2015. [Google Scholar]
  38. Sheikholeslami, R.; Ng, M. Calcium Sulfate Precipitation in the Presence of Nondominant Calcium Carbonate: Thermodynamics and Kinetics. Ind. Eng. Chem. Res. 2001, 40, 3570–3578. [Google Scholar] [CrossRef]
  39. Gopi, S.P.; Subramanian, V.; Palanisamy, K. Synergistic Effect of EDTA and HEDP on the Crystal Growth, Polymorphism, and Morphology of CaCO3. Ind. Eng. Chem. Res. 2015, 54, 3618–3625. [Google Scholar] [CrossRef]
  40. Gadri, F.A.E. Kinetics of the precipitation of calcium sulfate dihydrate in a desalination unit. Desalination 2003, 158, 9–16. [Google Scholar]
  41. Nancollas, G.H.W.W. The Kinetics and Mechanism of Formation of Calcium Sulfate Scale Minerals. Corrosion 1979, 35, 304–308. [Google Scholar] [CrossRef]
  42. Amiri, M.; Moghadasi, J.; Jamialahmadi, M. Prediction of Iron Carbonate Scale Formation in Iranian Oilfields at Different Mixing Ratio of Injection Water with Formation Water. Energy Sources 2013, 35, 1256–1265. [Google Scholar] [CrossRef]
  43. Sheikholeslami, R.; Ong, H. Kinetics and thermodynamics of calcium carbonate and calcium sulfate at salinities up to 1.5 M. Desalination 2003, 157, 217–234. [Google Scholar] [CrossRef]
  44. Melliti, E.; Touati, K.; Bruggen, B.; Elfil, H. Effect of Fe2+ ions on Gypsum Precipitation During Bulk Crystallization of Reverse Osmosis Concentrates. Chemosphere 2020, 263, 127866. [Google Scholar] [CrossRef] [PubMed]
  45. Sheikholeslami, T. Thermodynamics and kinetics for mixed calcium carbonate and calcium sulfate precipitation. Chem. Eng. Sci. 2001, 56, 5391–5400. [Google Scholar]
  46. Liu, S.T.; Nancollas, G.H. The crystallization of magnesium hydroxide. Desalination 1973, 12, 75–84. [Google Scholar]
  47. Olajire, A.A. A review of oilfield scale management technology for oil and gas production. J. Pet. Sci. Eng. 2015, 135, 723–737. [Google Scholar] [CrossRef]
  48. Shahzad, K.M.; Ibnelwaleed, H.; Mohamed, M.; Sultan, A.S.; Saad, M. Oilfield scale formation and chemical removal: A review. J. Pet. Sci. Eng. 2018, 171, 127–139. [Google Scholar]
  49. Touati, K.; Alia, E.; Zendah, H.; Elfil, H.; Hannachi, A. Sand filters scaling by calcium carbonate precipitation during groundwater reverse osmosis desalination. Desalination 2018, 430, 24–32. [Google Scholar] [CrossRef]
  50. Baumgartner, J.; Dey, A.; Bomans, P.; Coadou, C.; Fratzl, P.; Sommerdijk, N.; Faivre, D. Nucleation and growth of magnetite from solution. Nat. Mater. 2013, 12, 310–314. [Google Scholar] [CrossRef]
  51. Habraken, W.J.E.M.; Tao, J.; Brylka, L.J.; Friedrich, H.; Bertinetti, L.; Schenk, A.S.; Verch, A.; Dmitrovic, V.; Bomans, P.H.H.; Frederik, P.M.; et al. Ion-association complexes unite classical and non-classical theories for the biomimetic nucleation of calcium phosphate. Nat. Commun. 2013, 4, 1507. [Google Scholar] [CrossRef] [Green Version]
  52. Radha, A.V.; Forbes, T.Z.; Killian, C.E.; Gilbert, P.; Navrotsky, A. Crystallization energetics of amorphous calcium carbonate. Proc. Natl. Acad. Sci. USA 2010, 107, 16438–16443. [Google Scholar] [CrossRef] [PubMed] [Green Version]
  53. Nancollas, G.H.; Reddy, M.M. Crystal growth kinetics of minerals encountered in water treatment processes. In Aqueous-Environmental Chemistry of Metals; Rubin, A.J., Ed.; Ann Arbor Science Publishers, Inc.: Ann Arbor, MI, USA, 1973. [Google Scholar]
  54. Nancollas, G.H.; Reddy, M.M. The crystallization of calcium carbonate: I. Isotopic exchange and kinetics. J. Colloid Interface Sci. 1971, 37, 166–172. [Google Scholar]
  55. Chaturvedi, E.; Patidar, K.; Srungavarapu, M.; Laik, S.; Mandal, A. Thermodynamics and kinetics of methane hydrate formation and dissociation in presence of calcium carbonate. Adv. Powder Technol. 2018, 29, S0921883118300347. [Google Scholar] [CrossRef]
  56. Bramson, D.; Hasson, D.; Semiat, R. The roles of gas bubbling, wall crystallization and particulate deposition in CaSO4 scale formation. Desalination 1995, 100, 105–113. [Google Scholar] [CrossRef]
  57. Bots, P.; Benning, L.G.; Rodriguez-Blanco, J.D.; Roncal-Herrero, T.; Shaw, S. Mechanistic Insights into the Crystallization of Amorphous Calcium Carbonate (ACC). Cryst. Growth Des. 2012, 12, 3806–3814. [Google Scholar] [CrossRef]
  58. Yoreo, J.D. Crystal nucleation: More than one pathway. Nat. Mater. 2013, 12, 284–285. [Google Scholar] [CrossRef]
  59. Augustin, W.; Bohnet, M. Influence of the ratio of free hydrogen ions on crystallization fouling. Chem. Eng. Process. 1995, 34, 79–85. [Google Scholar] [CrossRef]
  60. Sun, R.; Willhammar, T.; Grape, E.S.; Strmme, M.; Cheung, O. Mesoscale Transformation of Amorphous Calcium Carbonate to Porous Vaterite Microparticles with Morphology Control. Cryst. Growth Des. 2019, 19, 5075–5087. [Google Scholar] [CrossRef]
  61. Zhang, X.; Shen, Z.; Liu, J.; Kerisit, S.N.; Bowden, M.E.; Sushko, M.L. Direction-specific interaction forces underlying zinc oxide crystal growth by oriented attachment. Nat. Commun. 2017, 8, 835. [Google Scholar] [CrossRef] [PubMed] [Green Version]
  62. Sun, W.; Saivenkataraman, J.; Chen, W.; Kristin, A.; Gerbrand, P. Nucleation of metastable aragonite CaCO3 in seawater. Proc. Nat. Acad. Sci. USA 2015, 112, 3199–3204. [Google Scholar] [CrossRef] [PubMed] [Green Version]
  63. Nebel, H.; Neumann, M.; Mayer, C.; Epple, M. On the structure of Amorphous Calcium Carbonate—A detailed study by solid-state NMR spectroscopy. Inorg. Chem. 2008, 47, 7874–7879. [Google Scholar] [CrossRef]
  64. Plummer, L.N.; Parkhurst, D.L.; Wigley, T.M.L. Critical review of the kinetics of calcite dissolution and precipitation. In Chemical Modeling in Aqueous Systems; ACS Publications: Washington, DC, USA, 1979. [Google Scholar]
  65. Rodriguez-Blanco, J.D.; Shaw, S.; Benning, L.G. The Kinetics and Mechanisms of Amorphous Calcium Carbonate (ACC) Crystallization to Calcite, Via Vaterite. Nanoscale 2010, 3, 265–271. [Google Scholar] [CrossRef]
  66. Fernández-Díaz, L.; Fernandez-Gonzalez, M.D.L.A.; Prieto, M. The role of sulfate groups in controlling CaCO3 polymorphism. Geochim. Cosmochim. Acta 2010, 74, 6064–6076. [Google Scholar] [CrossRef] [Green Version]
  67. Nikos, S.; Petros, G.K. The transformation of vaterite to calcite: Effect of the conditions of the solutions in contact with the mineral phase. J. Cryst. Growth 1998, 191, 783–790. [Google Scholar]
Figure 1. Schematic diagram of the experimental apparatus, the solution was stirred at constant temperature by a constant temperature heating magnetic stirrer at 35 °C and 250 r/min for 120 min.
Crystals 11 01494 g001
Figure 2. The variation curve of conductivity of solution with time, (a) in 120 min; (b) first 20 min.
Crystals 11 01494 g002
Figure 3. The relationship between conductivity logarithm and time in scale deposition stage. Group 1: (a) quick nucleation period, (b) slow nucleation period, (c) crystal growth period; Group 2: (a) quick nucleation period, (b) slow nucleation period, (c) crystal growth period; Group 3: (a) phase I, (b) phase Ⅱ, (c) phase Ⅲ; Group 4: (a) phase Ⅱ, (b) phase Ⅲ.
Crystals 11 01494 g003aCrystals 11 01494 g003b
Figure 4. The change curve of pH with time, the solution was stirred at constant temperature by a constant temperature heating magnetic stirrer at 35 °C and 250 r/min for 120 min.
Crystals 11 01494 g004
Figure 5. The change curve of conductivity logarithm and pH with time in Groups 3 (a) and 4 (b).
Crystals 11 01494 g005
Figure 6. The morphology of scale deposition in each group at 10 min, 40 min, 70 min and 100 min was observed at 40 times, using a constant temperature heating magnetic stirrer for constant temperature and stirring of the solution, set to 35 °C, 250 r/min.
Crystals 11 01494 g006
Figure 7. The XRD patterns of sediments, and the sediments from each group have been dried at 45 °C for 24 h before.
Crystals 11 01494 g007
Figure 8. Deposition diagram of calcium carbonate scale as the main component in co-deposition.
Crystals 11 01494 g008aCrystals 11 01494 g008b
Figure 9. Deposition diagram of calcium sulfate scale as the main component in co-deposition.
Crystals 11 01494 g009aCrystals 11 01494 g009b
Table 1. Experimental contents in the study.
GroupCaSulfateCarbonatePrecipitates
10.145 mol/L (100 mL)0.145 mol/L (100 mL)gypsum
20.145 mol/L (100 mL)0.29 mol/L (100 mL)calcite
30.145 mol/L (100 mL)0.145 mol/L (50 mL)0.29 mol/L (50 mL)mixed scale
40.145 mol/L (100 mL)0.24 mol/L (50 mL)0.1 mol/L (50 mL)mixed scale
Publisher’s Note: MDPI stays neutral with regard to jurisdictional claims in published maps and institutional affiliations.

