Article

Effects of Cr Doping and Water Content on the Crystal Structure Transitions of Ba2In2O5

1
Institute of Inorganic Chemistry, Leipzig University, Johannisallee 29, 04103 Leipzig, Germany
2
Institute of Materials Science, Technische Universität Darmstadt, Alarich-Weiss-Str. 2, 64287 Darmstadt, Germany
3
Institut Laue-Langevin, 71 Avenue des Martyrs, 38000 Grenoble, France
4
Helmholtz-Zentrum Berlin, Hahn-Meitner-Platz 1, 14109 Berlin, Germany
5
Felix Bloch Institute for Solid State Physics, Leipzig University, Linnéstraße 5, 04103 Leipzig, Germany
6
Fraunhofer Research Institution for Materials Recycling and Resource Strategies IWKS, Brentanostr. 2A, 63755 Alzenau, Germany
*
Authors to whom correspondence should be addressed.
Crystals 2021, 11(12), 1548; https://doi.org/10.3390/cryst11121548
Submission received: 16 October 2021 / Revised: 6 December 2021 / Accepted: 6 December 2021 / Published: 10 December 2021
(This article belongs to the Section Inorganic Crystalline Materials)

Abstract

:
Temperature-dependent crystal structure alterations in the brownmillerite-type material Ba2In2O5 play a fundamental role in its applications: (i) photocatalytic CO2 conversion; (ii) oxygen transport membranes; and (iii) proton conduction. This is connected to a reversible uptake of up an equimolar amount of water. In this study, in situ X-ray and neutron diffraction were combined with Raman spectroscopy and solid-state nuclear magnetic resonance experiments to unravel the effects of Cr doping and water content on the crystal structure transitions of Ba2In2O5(H2O)x over a wide temperature range (10 K ≤ T ≤ 1573 K, x < 1). A mixture of isolated and correlated protons was identified, leading to a highly dynamic situation for the protons. Hence, localisation of the protons by diffraction techniques was not possible. Cr doping led to an overall higher degree of disorder and stabilisation of the tetragonal polymorph, even at 10 K. In contrast, a further disordering at high temperatures, leading to a cubic polymorph, was found at 1123 K. Cr doping in Ba2In2O5 resulted in severe structural changes and provides a powerful way to adjust its physical properties to the respective application.

Graphical Abstract

1. Introduction

The brownmillerite-type material Ba2In2O5 has already demonstrated striking potential in various applications, ranging from the photocatalytic CO2 conversion in the presence of H2 [1,2,3] via oxygen transport membranes [4] to proton conductors [5,6,7,8,9]. The latter is related to the well-known reversible uptake of H2O by Ba2In2O5. In humid atmospheres, reversible full hydration to BaInO3H has been reported [6,10,11]. For complementary usage as oxygen transport membrane material, the dynamic absorption and desorption of H2O upon temperature change can play a crucial role in the mechanical integrity of the membrane due to large volume changes [4]. The stepwise dehydration and high-temperature phase transition from an orthorhombic brownmillerite-type via a tetragonal intermediate phase to a cubic defect-perovskite-type structure at T > 1300 K create a rich structural variety in the system Ba–In–O [10,11,12,13,14]. The partial replacement of In by Cr forming Ba2In2−xCrxOδ has shown a massive performance improvement during photocatalytic CO2 conversion and oxygen transport [2,4]. An important factor responsible for the improvement is that the brownmillerite-type structure favours the oxidation of Cr3+ to Cr6+ [15] during preparation in air, hence turning the initially anticipated isovalent doping or substitution into heterovalent doping, causing remarkable structural changes at low and intermediate temperatures [3,4]. For example, thermogravimetric analysis (TGA) and chemical analysis show the water content to increase by a factor of five [3,4]. Based on the dependence of water vapour pressure and temperature, the protons in Ba2In2O5 are arranged in different patterns. The resulting hydrogen bonding network leads to a rearrangement of the in coordination polyhedra visible by powder X-ray diffraction (PXRD) [11]. More detailed structural investigations have suggested that the protons are bound in the form of OH groups rather than as H2O molecules, as derived from the observed bonding situation of the oxygen atoms. Selected area electron diffraction on the same samples reveals an eight-times enlarged unit cell. A combination of elastic powder neutron diffraction (PND) and magic angle spinning nuclear magnetic resonance (MAS-NMR) allows establishing a structural model of the fully hydrated compounds Ba2In2O4(OH)2 and Ba2In2O4(OD)2 (=Ba2In2O5(H2O)/Ba2In2O5(D2O)), respectively, based on the averaged structure, implying that the actual structure might be lower in symmetry than P4/mbm. This permits the partial ordering of the protons on 4h sites next to the oxygen atoms in the equatorial plane of the In octahedra [16]. First principle calculations based on these results confirm the symmetry lowering and identify two energetically preferred proton configurations [17,18]. During the dehydration of Ba2In2O5(H2O), a two-stage mechanism is observed with a critical temperature of Tc ≈ 643 K for a structural change from the perovskite-type to brownmillerite-type when the hydration level drops below 50%. The combination of temperature-dependent Raman spectroscopy, TGA, and inelastic neutron scattering shows that below Tc the dehydration takes place homogenously from the lattice, whereas above Tc a desorption from the tetrahedral layers dominates. The spectroscopic results match with the two predicted low-energy states [10]. Further analysis of the hydrogen bonding network reveals for the majority of protons a similar bonding strength, while a fraction of about 10% shows remarkably enhanced bond strength due to very short O–O distances. This is preserved within a wide range of proton contents since the protons prefer to cluster to oxygen- and hydrogen-rich domains upon dehydration [7]. Similar effects have also been observed during the decomposition of iron and manganese nitrides using in situ neutron diffraction [19,20]. Recently, the influence of isovalent cationic substitution of In by Ga, Sc, and Y has been studied, revealing that the smaller cations force a high occupation of the proton site connecting alternating octahedral layers within the structure [8]. Other consequences of doping with Cr are changes in the electronic band structure, leading to the reduction of the bandgap by ca. 1 eV. Hence, providing an enhanced visible light absorption and better conversion efficiency [2]. Besides, the doping effect, the replacement of large In3+ (r(In3+, CN=6) = 0.80 Å) [21] by small Cr6+ (r(Cr6+, CN=6) = 0.44 Å) [21] causes significant structural changes with respect to the unit cell size and oxygen vacancy ordering. Both effects become dominant in high-temperature applications, such as oxygen transport membranes [4].
This study aims to understand the effect of Cr doping in Ba2In2O5 on the proton distribution and the crystal structure transitions at elevated temperatures. In this regard, a further understanding of the thermal behaviour of hydrated Ba2In2−xCrxO5, in particular at temperatures above T > 873 K, is required. Therefore, we have applied in situ powder X-ray diffraction (XRD), powder neutron diffraction (PND), MAS-NMR, and Raman spectroscopy to track the structural changes in the temperature range of 10 K to 1573 K.

2. Materials, Methods, and Equipment
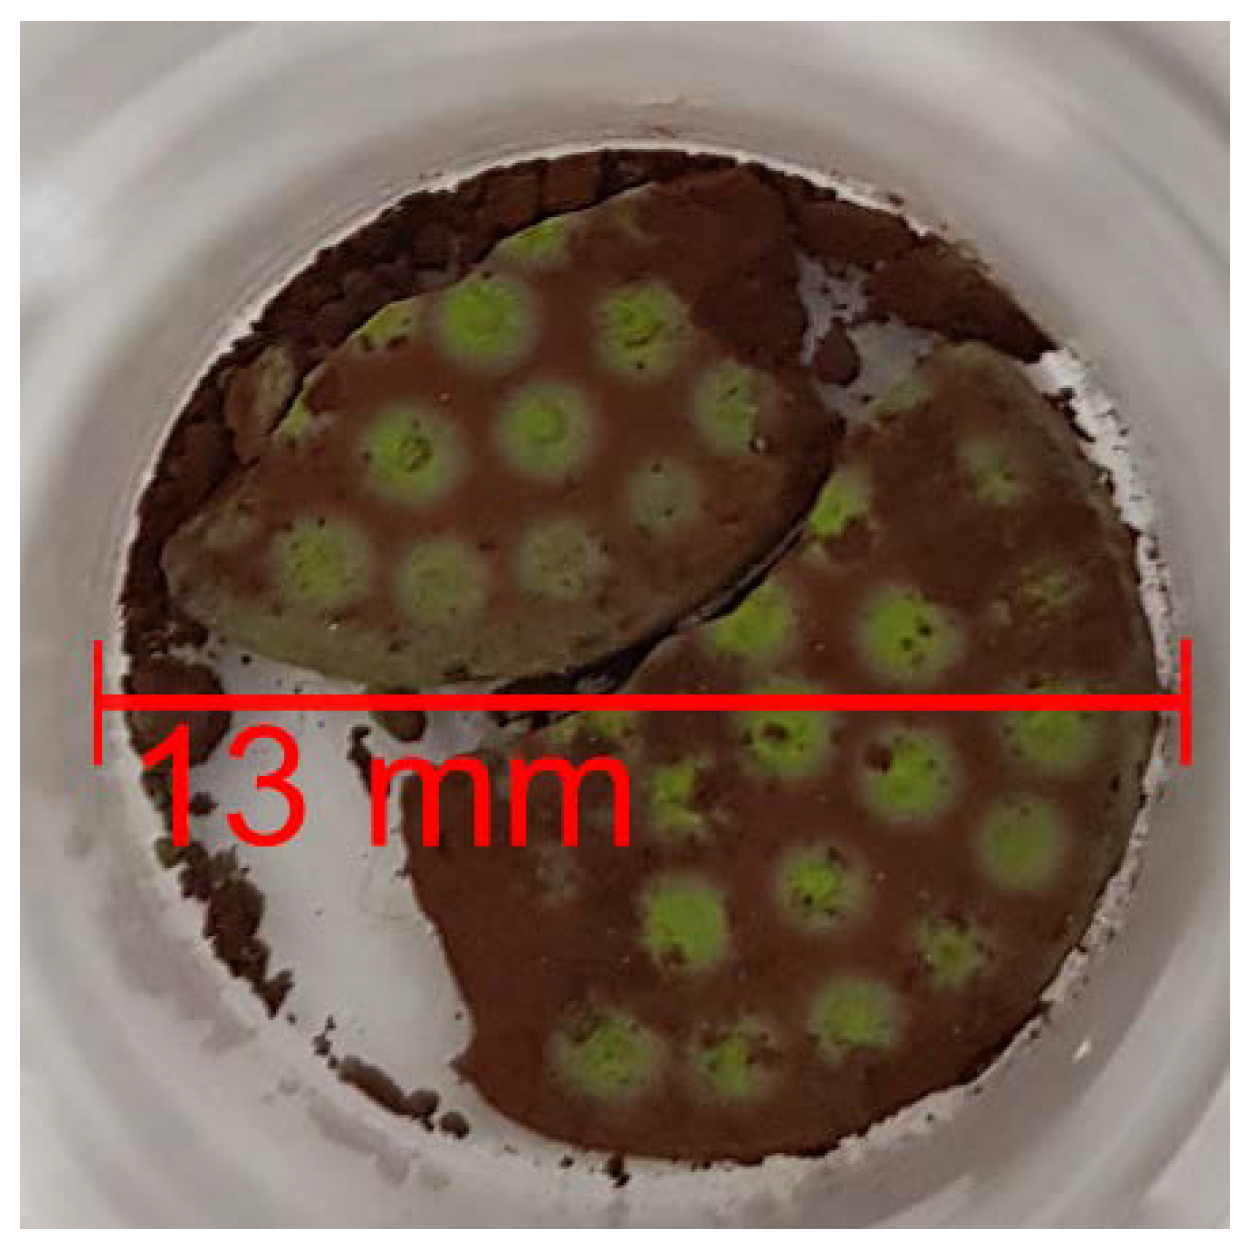
2.1. Synthesis

The materials were prepared by the solid-state reaction method described in Yoon et al. [3]. In brief, BaCO3 (Merck, EMSURE, Darmstadt, Germany), In2O3 (Alfa Aesar, Kandel, Germany, 99.9%), and Cr2O3 (n/s) were mixed together in the proper ratio and subsequently fired in ambient air in a muffle furnace (L08/14S, Nabertherm, Lilienthal, Germany) using three temperature steps (1173 K, 1373 K, and 1473 K, each for 12 h), with subsequent manual grinding using a mortar and pestle after reaching ambient temperature. The natural cooling rate in ambient air was applied. The samples were stored at 296 K at a humidity of about 37% R.H.

2.2. Thermal Analysis

Thermogravimetric analysis experiments were carried out with a ca. 100 mg sample in Al2O3 crucibles on a STA449F3 thermal analyser (Netzsch Gerätebau, Selb, Germany). Different temperature profiles and flowing gases were applied (see Table 1). The inert gases (N2 and Ar) were purified by a Gatekeeper GPUS IX purifier (Entegris, Billerica, MA, USA; p(O2) < 100 ppt, p(H2O) < 100 ppt). For compressed air a Gatekeeper GPUS WY purifier (Entegris, Billerica, MA, USA; p(H2O) < 100 ppt, p(CO2) < 100 ppt) was used. The gas flow was regulated by LOW-Δp-FLOW mass flow controllers (Bronkhorst, Ruurlo, Netherlands). Simultaneous thermal analysis experiments (TGA), differential thermal analysis (DTA), and mass spectroscopy (MS) were carried out with a ca. 180 mg sample in Al2O3 crucibles on a STA449C thermal analyser (Netzsch Gerätebau, city, Selb, Germany) coupled to a QMS Aeolos 403 C mass spectrometer (Netzsch Gerätebau, Selb, Germany) in flowing argon (>99.999%, AirLiquide, city, Düsseldorf, Germany; p(O2) < 2 ppm, p(H2O) < 2 ppm). The MS data were collected in bar graph mode covering a range of 1 ≤ m/z ≤ 50. Before starting the measurements, the setup was purged for 45 min with the respective gas. All measurements were corrected for buoyancy using a corresponding measurement with an empty crucible.

2.3. Powder X-ray Diffraction

Powder X-ray diffraction was performed on a SmartLab diffractometer (Rigaku, Tokyo, Japan), equipped with a two-dimensional high-resolution HyPix-3000 detector. Measurements at elevated temperatures under nitrogen flow (p(O2) < 5 ppm, p(H2O) < 5 ppm) were performed using nickel-filtered Cu-Kα radiation in Bragg–Brentano geometry with an XRK 900 reaction chamber (Anton Paar, Graz, Austria). For the temperature dependent XRD study, the sample was heated in 25 K steps from room temperature to 1123 K in the XRK 900 reaction chamber mounted on the SmartLab diffractometer. After every heating step plus a holding time of 30 min (which allowed the system to equilibrate), an X-ray diffraction measurement of 30 min was performed. The study was made in a nitrogen flow of 20 sccm (standard cubic centimetres per minute) at a pressure of 0.15 MPa in order to ensure that evolved water is carried away from the sample. This temperature-dependent XRD study was repeated with a sample from a different batch.

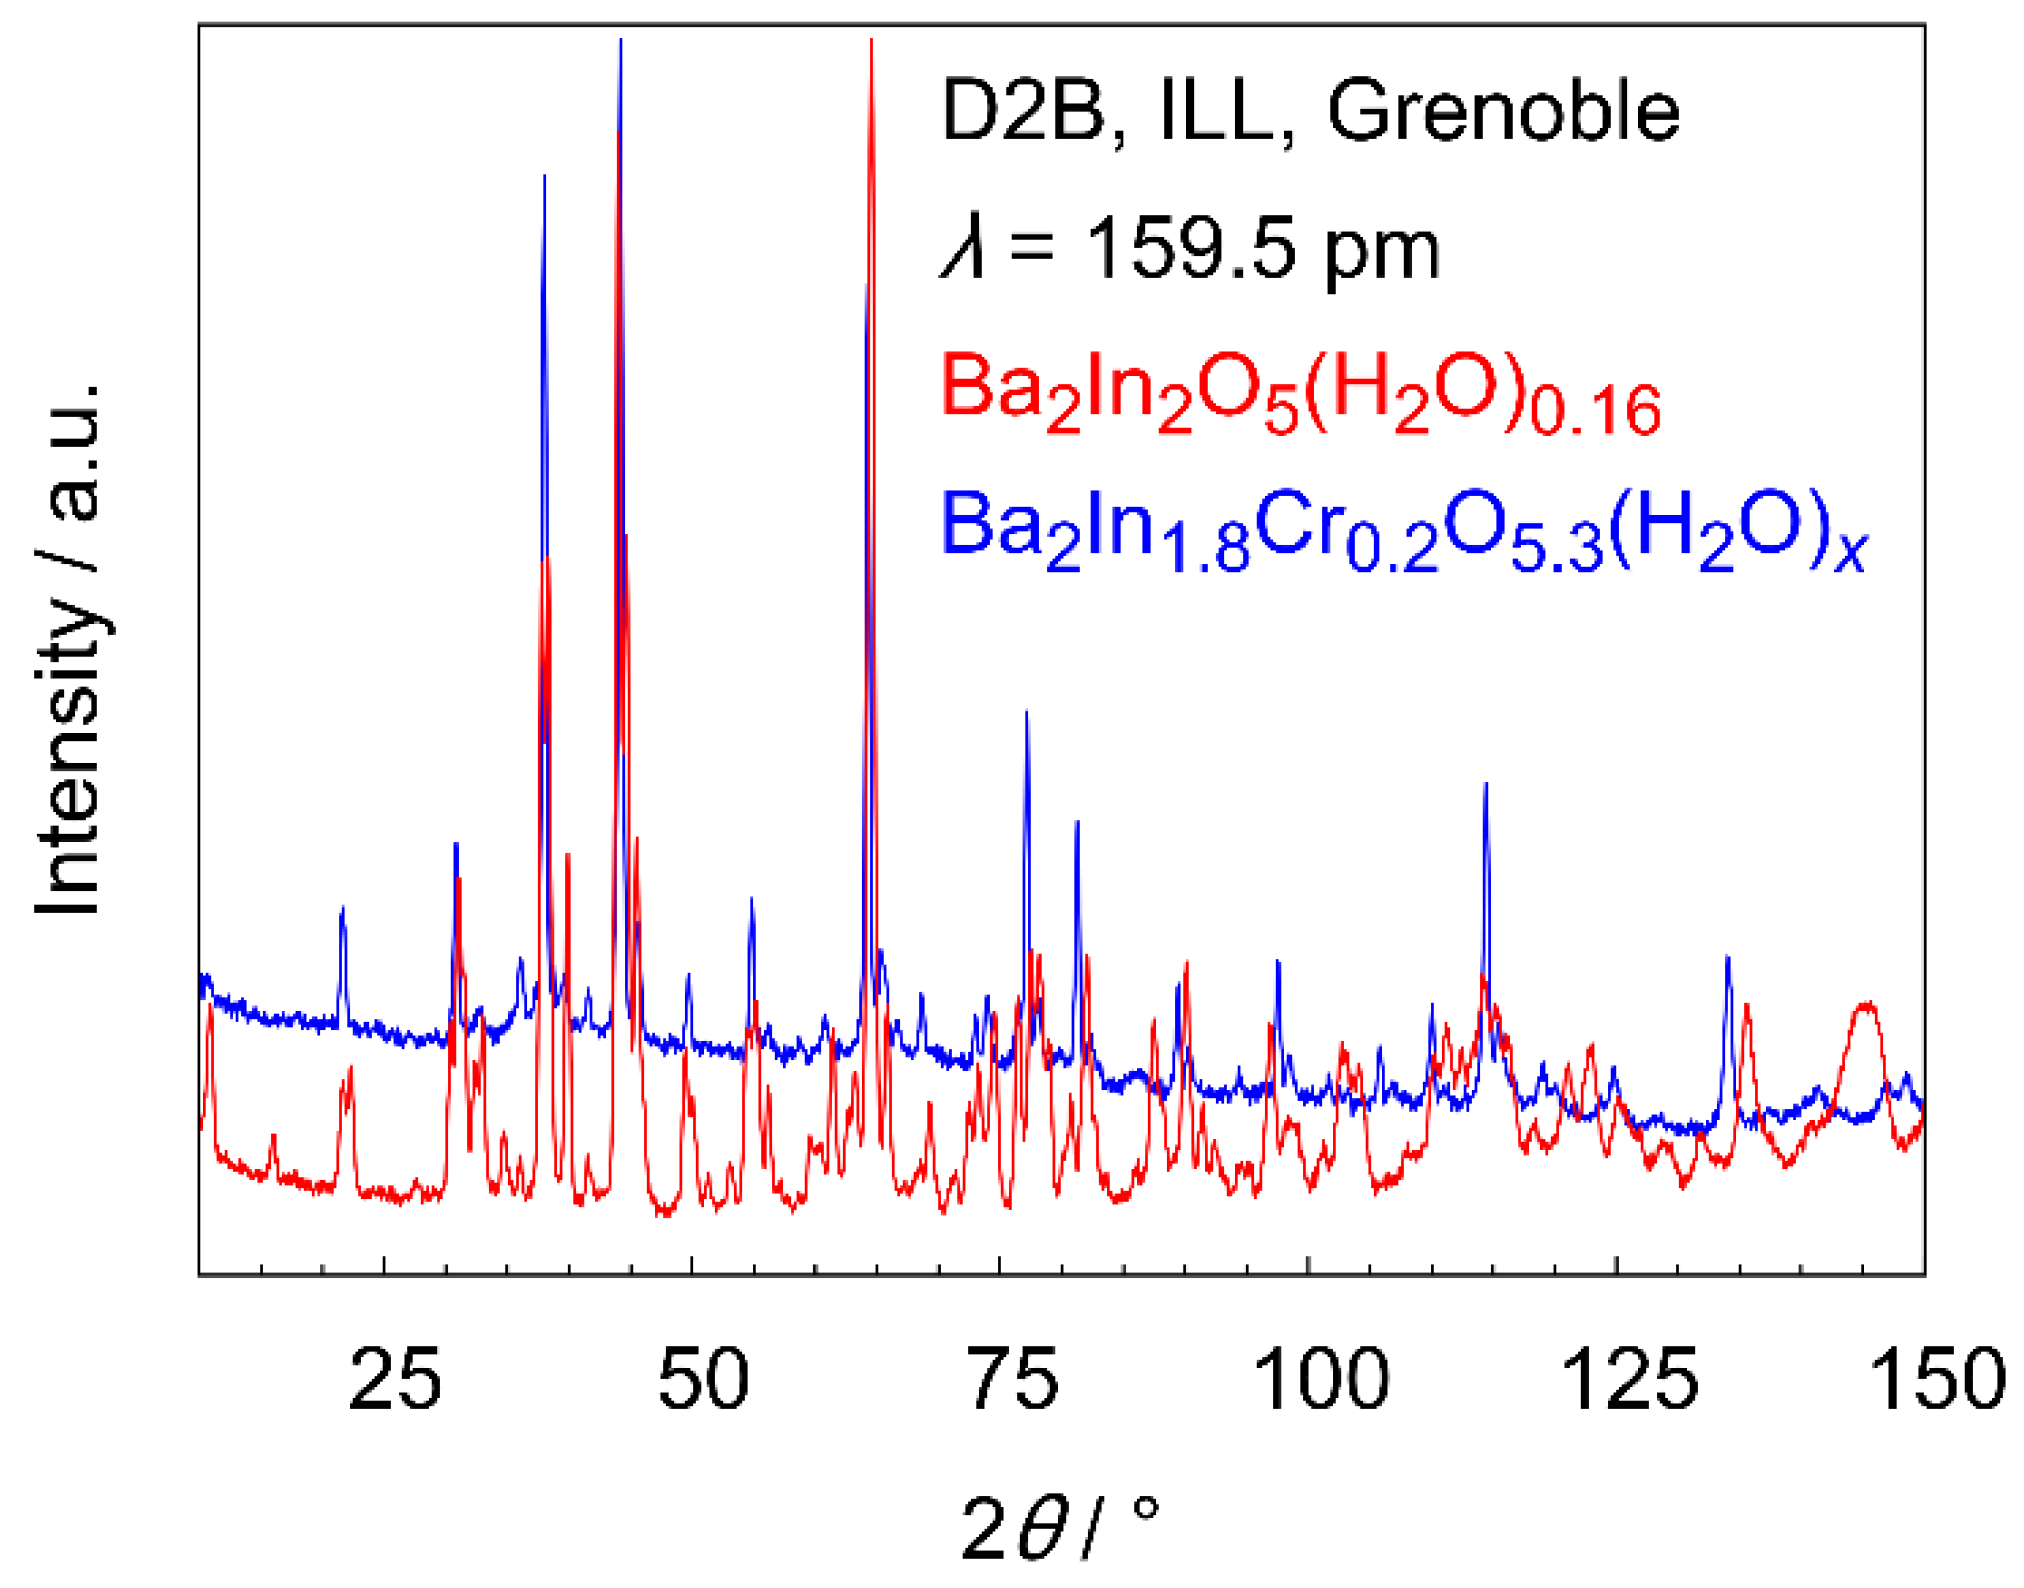
2.4. Powder Neutron Diffraction

Powder neutron diffraction experiments were performed on the focusing powder diffractometer E6 at the Helmholtz-Zentrum Berlin (HZB), Berlin, Germany (2.44 Å, pyrolytic graphite (002) monochromator [22]). During the neutron diffraction measurements, the sample was filled into a leuco-sapphire single-crystal crucible, 6 mm in diameter, 32 mm high, and 1 mm wall thickness. Measurements were carried out for 315 K ≤ T ≤ 873 K using the diffractometer equipped with a high-temperature furnace (pmin ≥ 1 × 10⁻³ mbar). The room temperature measurement was performed for 2 h. In order to follow the release of water, two successive measurements of 1 h each were made for every elevated temperature step.
The high-resolution two-axis diffractometer D2B at the Institut Laue-Langevin (ILL), Grenoble, France, (1.59 Å, take-off-angle 135°, Ge (335) monochromator) was used for the low-temperature PND studies down to 10 K. The experiments were carried out in a standard vanadium can using the ILL cryofurnace.
For the high-temperature neutron powder diffraction measurements, the D20 diffractometer at the ILL (1.88 Å, take-off angle 120°, Ge (115) monochromator [23]) was used. The data were collected by using the leuco-sapphire single-crystal crucible described above attached via a niobium can to the sample stick of an ILL high-temperature furnace (Tmax = 1873 K). The furnace was operated in a dynamic vacuum (pmin ≥ 1.2 × 10⁻⁵ mbar).

2.5. Optical Spectroscopy

Raman spectra were recorded using a QEPRO spectrometer, Ocean Optics, Stuttgart, Germany, with a Hamatsu CCD array detector. Excitation was realised with a CW diode laser, Innovative Photonics Solutions, Plainsboro, NJ, USA, with 100 mW, a wavelength of 532 nm, and a beam diameter of 105 μm with a divergence of 15°. Scattered light was collected and transmitted via a 200 μm glass fibre optics.
For the implementation into PND measurements, the following approach was used. The sample was heated with a hot air blower, type Electron ST, Leister, Switzerland, while being installed on the E6 neutron diffractometer. The sample was filled in a leuco-sapphire single-crystal crucible, as described above, and mounted on an aluminium stage coated with neutron-absorbing varnish, as described in [24]. The temperature at the sample surface was measured with a pyrometer [25]. To ensure a light-tight enclosure for Raman spectroscopic measurements, the apparatus was placed in an aluminium can with a detachable lid. The Raman probe was fixed in the middle of the lid with a polymeric O-Ring and an ISO metric 6 mm Swagelok screw connection. Starting at room temperature, measurements up to 673 K in steps of 100 K were performed. Further, after each heating step, a Raman spectrum was collected for 90 s after cooling the sample (every time naturally) down to 330(5) K in ambient air.
A Varian 670 Fourier-transform infrared (FTIR) spectrometer with attenuated total reflectance (ATR) unit was used to collect spectra of Ba2In2O5(H2O)0.16 and Ba2In1.8Cr0.2O5.3(H2O)x (Figure S1).

2.6. Solid-State Nuclear Resonance Spectroscopy

Solid-state NMR measurements were conducted on a Bruker Avance spectrometer (Billerica, MA, USA) at a magnetic field of 17.6 T and a frequency of 748.51 MHz for 1H. The MAS frequency was 10 kHz. Standard spectra were recorded with the DEPTH-sequence [26] to remove the probe background signal. The 90° pulse length was 1.5 μs and the recycle delay 8 s. For the double-quantum excitation, the back-to-back sequence (BABA) [27] was used with one rotor period for excitation and reconversion.

2.7. Software

Rietveld refinements were performed using Fullprof.2k [28] with a Pseudo Voigt or Pearson VII (high T XRD) profile function. NMR spectra were recorded with TopSpin 2.0 software (Billerica, MA, USA), analysed and plotted with dmfit [29].

3. Results

3.1. Thermal Analysis

Measurement program 1 (Table 1) resembles the conditions used for Figure 3 of reference [3] to allow a determination of the water content and a comparison to previous samples. The general progression of the TGA curves of Ba2In2O5(H2O)0.16 and Ba2In1.8Cr0.2O5.3(H2O)x, respectively, matched well with the already published results [3]. A clear two step weight loss was observed. For Ba2In1.8Cr0.2O5.3(H2O)x, the first step occurred in the temperature range 350 K ≤ T ≤ 800 K, and based on the previously published TGA-MS data [3] was caused by a water release from the sample. The second step can be found in the temperature range 800 K ≤ T ≤ 950 K. Hence, this second weight loss seemingly correlated to the observed change in the unit cell parameters (Section 4.1, Figures S2 and S3) in this temperature range during the PXRD experiments. However, an exact determination of the temperature ranges was not possible since the individual thermal processes overlapped each other. Hence, we focussed for all measurements on the evaluation of two defined temperatures, namely, 800 K and 1473 K. Table 2 summarises the observed weight losses after the first and second step in the respective TGA curves. The measurement results at these temperatures matched each other within the maximum deviation of 5%. Hence, a very similar oxygen and hydrogen content among the samples investigated so far can be assumed. The measurement resulted in a dark-green coloured sample. The smaller weight loss of Ba2In2O5 when heated from 800 K to 1473 K potentially points to a lower content of carbonate impurity for the sample analysed within this study compared to the previous one. After the measurement, a yellow sample was obtained (Figure S4).
As TGA is not capable of chemical speciation of the evolved molecules, measurement program 2 (Table 1) aims for the TGA-MS measurement of Ba2In1.8Cr0.2O5.3(H2O)x (Figure S5) in order to confirm the two-step release of H2O (m/z = 18). Additionally, a potential release of CO2 (m/z = 44) and O (m/z = 16) or O2 (m/z = 32), respectively, at the highest temperatures was investigated. As can be seen from Table 2, the weight changes at 800 K and 1473 K still matched within the 5% interval with respect to the other TGA measurements even though the instrument and the initial sample mass changed. In full agreement with the former TGA-MS experiment [3], a two-step release of H2O (m/z = 18) was obtained. The first increase of the m/z = 18 curve started at about 350 K and lasted up to about 700 K. Afterwards the signal faded out and returned back to the baseline level before the water release at 850 K. Above 873 K, the signal intensity started to increase again, indicating the beginning of the second step, which lasted up to about 1030 K. Afterwards, no H2O was detected, pointing to a complete dehydration of the sample. Slightly overlapping with the second H2O release from the sample, a release in CO2 (m/z = 44) was observed at 973 K, which lasted in three major steps up to 1473 K. The MS signal of O (m/z = 16) exactly followed the MS signals of H2O and CO2, thus not providing an additional indication of an oxygen release above the detection limit from the sample as also the MS signal of O2 (m/z = 32) remained at its background level. The four observed endothermal DTA peaks matched well with the thermal behaviour seen in TGA and MS. The first two endothermal peaks were located at T = 380 K and T = 520 K, parallel to the first release of H2O. The emergence of two energetic signals might be caused by the rather large sample requiring a higher temperature to remove the water from the bottom part of the sample. The third endothermal peak was found at T = 938 K, correlating with the second H2O release. This was followed by the last endothermal peak at T = 1096 K, matching with the major step of CO2 release as observed by MS. At about T = 1150 K, the DTA curve showed an endothermal progression overlaid by a very small DTA peak at T = 1250 K, the latter being in correlation with the second release of CO2 as obtained in the MS curve of CO2.
Measurement program 3 (Table 1) is designed to simulate the combined PND and Raman spectroscopic measurement using ambient air. Up to 800 K, the TGA curve (Figure S5) agreed properly with that observed from the measurement in argon atmosphere, pointing to the fact that changes in the gas atmosphere play only a minor role as long as dry gases are used. The two-step progression of the TGA curve was maintained, but the weight loss was about 0.05% less (Δm = −2.42% (air) vs. Δm = −2.47% (argon)). In contrast, at higher temperatures (above 1100 K), a steeper slope for the measurement in air was observed. Most probably this was caused by kinetical effects, such as a 5% less sample mass, differing particle sizes within the sample, or potential inhomogeneities with respect to carbonate. During cooling (10 K·min−1) to T = 1073 K, a slow but continuous weight gain of 0.11% was detected followed by a rather fast weight gain (step in TG curve) of 0.07% during further cooling to 873 K. The recognised weight gains potentially point to a partial reoxidation of Ba2In1.8Cr0.2O5.3–y during cooling after the removal of (most) of the hydroxyl groups, water molecules, and CO2. After the measurement, a dark red sample was obtained (Figure S5), agreeing later on with the presented Raman spectroscopic results (Section 3.3.5).
Measurement program 4 (Table 1) aims on a slower cooling in air in order to force a more complete reoxidation. As seen from Figure S5 and Table 2, basically the same progression of the TGA curve during heating within the already observed 5% deviation interval was obtained. During cooling (1 K·min−1) the basic progression was maintained; however, the ratio between the (reoxidation) processes was altered. Upon slow cooling to T = 1073 K, a weight gain of 0.05% was measured, while the sharp weight gain increased to 0.11% during cooling to T = 873 K. Additionally, the inflection point of the step in the TG curve shifted by ca. 40 K towards a higher temperature compared to the measurement with 10 K·min–1 as expected by the lower cooling rate.
Measurement program 5 (Table 1) uses a slower heating rate of 2 K·min−1 with flowing nitrogen gas coming closer to the conditions used for the PXRD studies (Section 3.2). The fundamental progression of the TGA curve, including the two-step behaviour, was conserved while lowering the heating rate. The respective weight changes still matched within the observed 5% range. The onset temperatures shifted towards lower temperatures by about 10 K and 50 K, respectively, for the two steps. This can be easily understood by the lowered heating rate, bringing the system closer to equilibrium conditions. After the measurement, a dark-green sample (Figure S5) was obtained, which is in agreement with the PXRD results presented later on (Section 3.2).
In the investigated system, a translation of the observed mass changes to the respective sum formula is not trivial. In previous studies of the Ba–In–O system, especially when hydrated, an inconsistent way of expressing the sum formula has been used, including a description via crystal water Ba2In2O5(H2O) [7,10,11] and hydroxyl groups Ba2In2O4(OH)2 [16,17,18]. In the present research work, a combination of TGA, MAS-NMR (Section 3.3.2 and Section 4.4), and PND (Section 3.3.1, Section 3.3.4 and Section 4.3) was used in order to try to resolve this. Rietveld refinements of high-temperature PND data (Section 3.3.4) yielded a sum formula of Ba2In1.8Cr0.2O5.32(4), which does not account for the two different kinds of protons (Section 3.3.2 and Section 4.4). With no clear indication for their distribution and ratio, a potential sum formula, respecting the mentioned issues, would be Ba2In1.8Cr0.2O5.32(4)−y(OH)y(H2O)x near room temperature.
Our current study has proven that in [3], an oversimplified model to calculate the water content of the Cr-containing sample has been used by extracting the water content from the weight losses during the TGA measurement. The old model was based on the assumption of an isovalent substitution of In3+ by Cr3+, leading to a base sum formula of Ba2In1.8Cr0.2O5(H2O)x [3]. Using the same model to our new data given in Table 2 would confirm a water content of x = 0.74. However, this neglects the higher oxygen content of 5.32(4) determined by PND (Section 3.3.4) being in accordance with the charge neutrality regarding the stated heterovalent substitution of In3+ by Cr6+ [15]. Taking into account the higher oxygen content of the chromium substituted sample, a water content of x ≈ 0.5 (Ba2In1.8Cr0.2O5.32(4)(H2O)0.5) would be in agreement with the present TGA and the previous chemical analysis [3] results. For simplicity and to enable an easy comparison to previous studies (e.g., [3]), we decided to express the sum formula herein as follows, Ba2In1.8Cr0.2O5.3(H2O)x„even that hydroxyl groups and/or crystal water might appear in the sample.

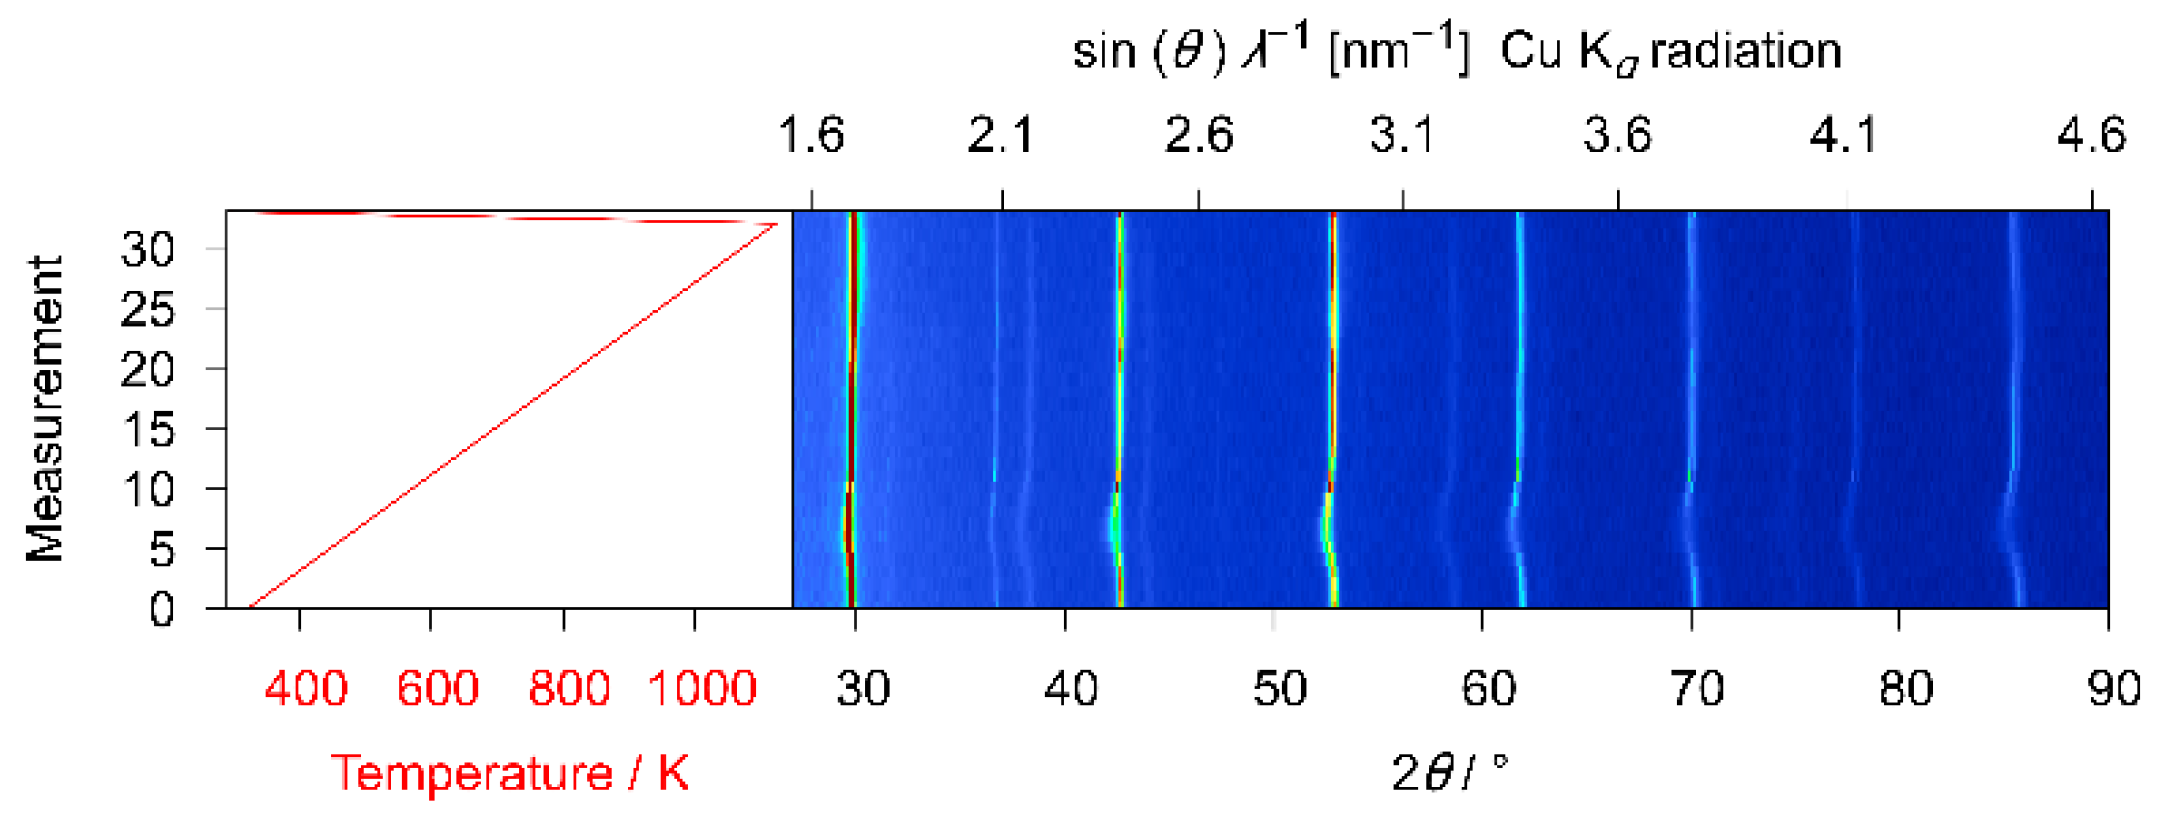
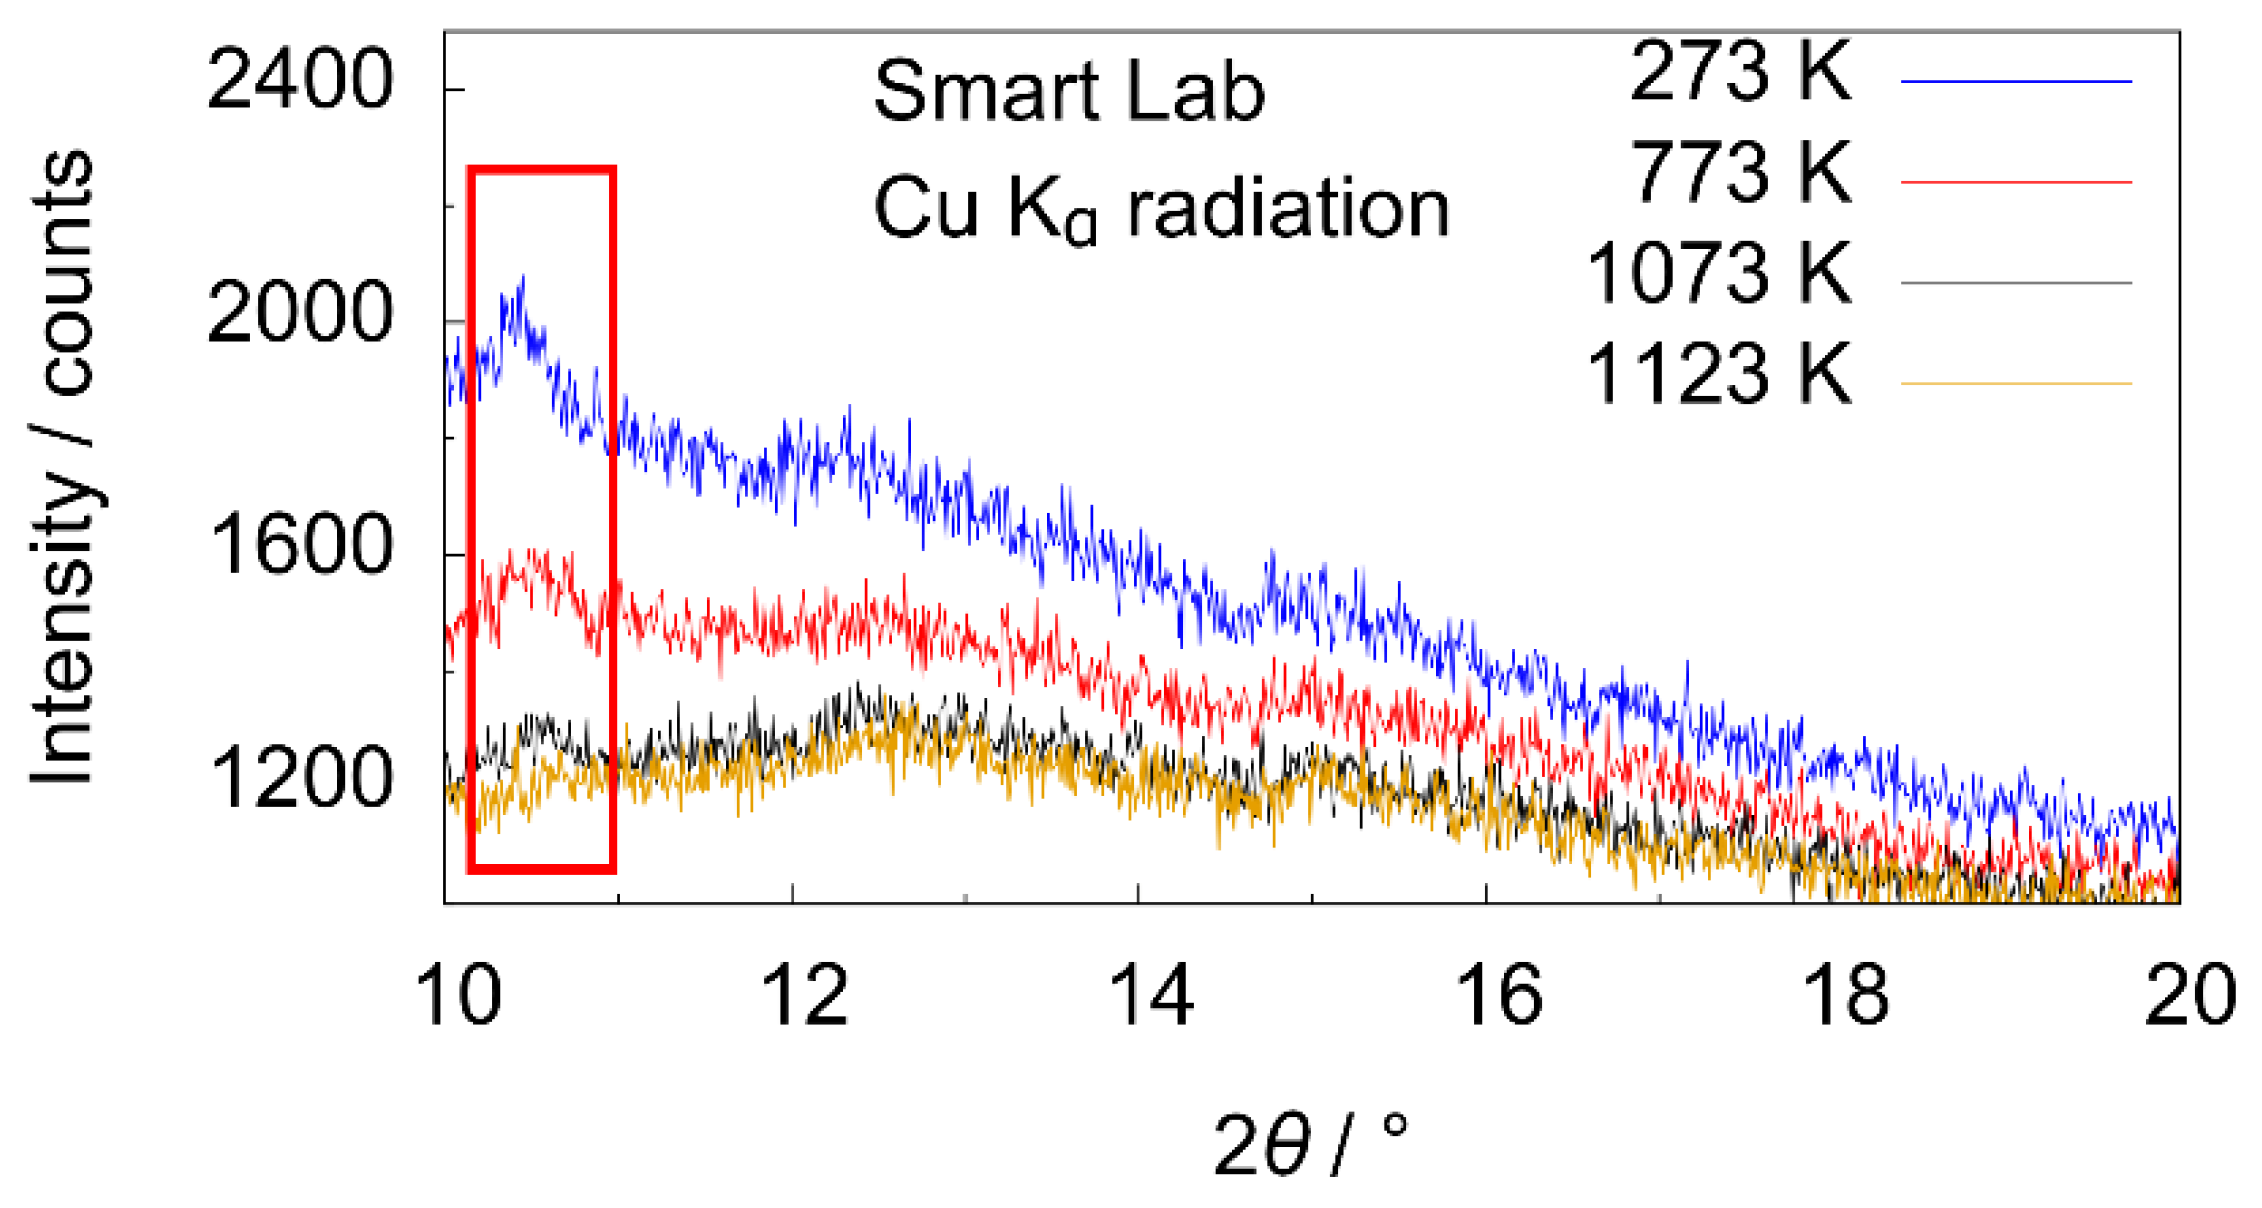
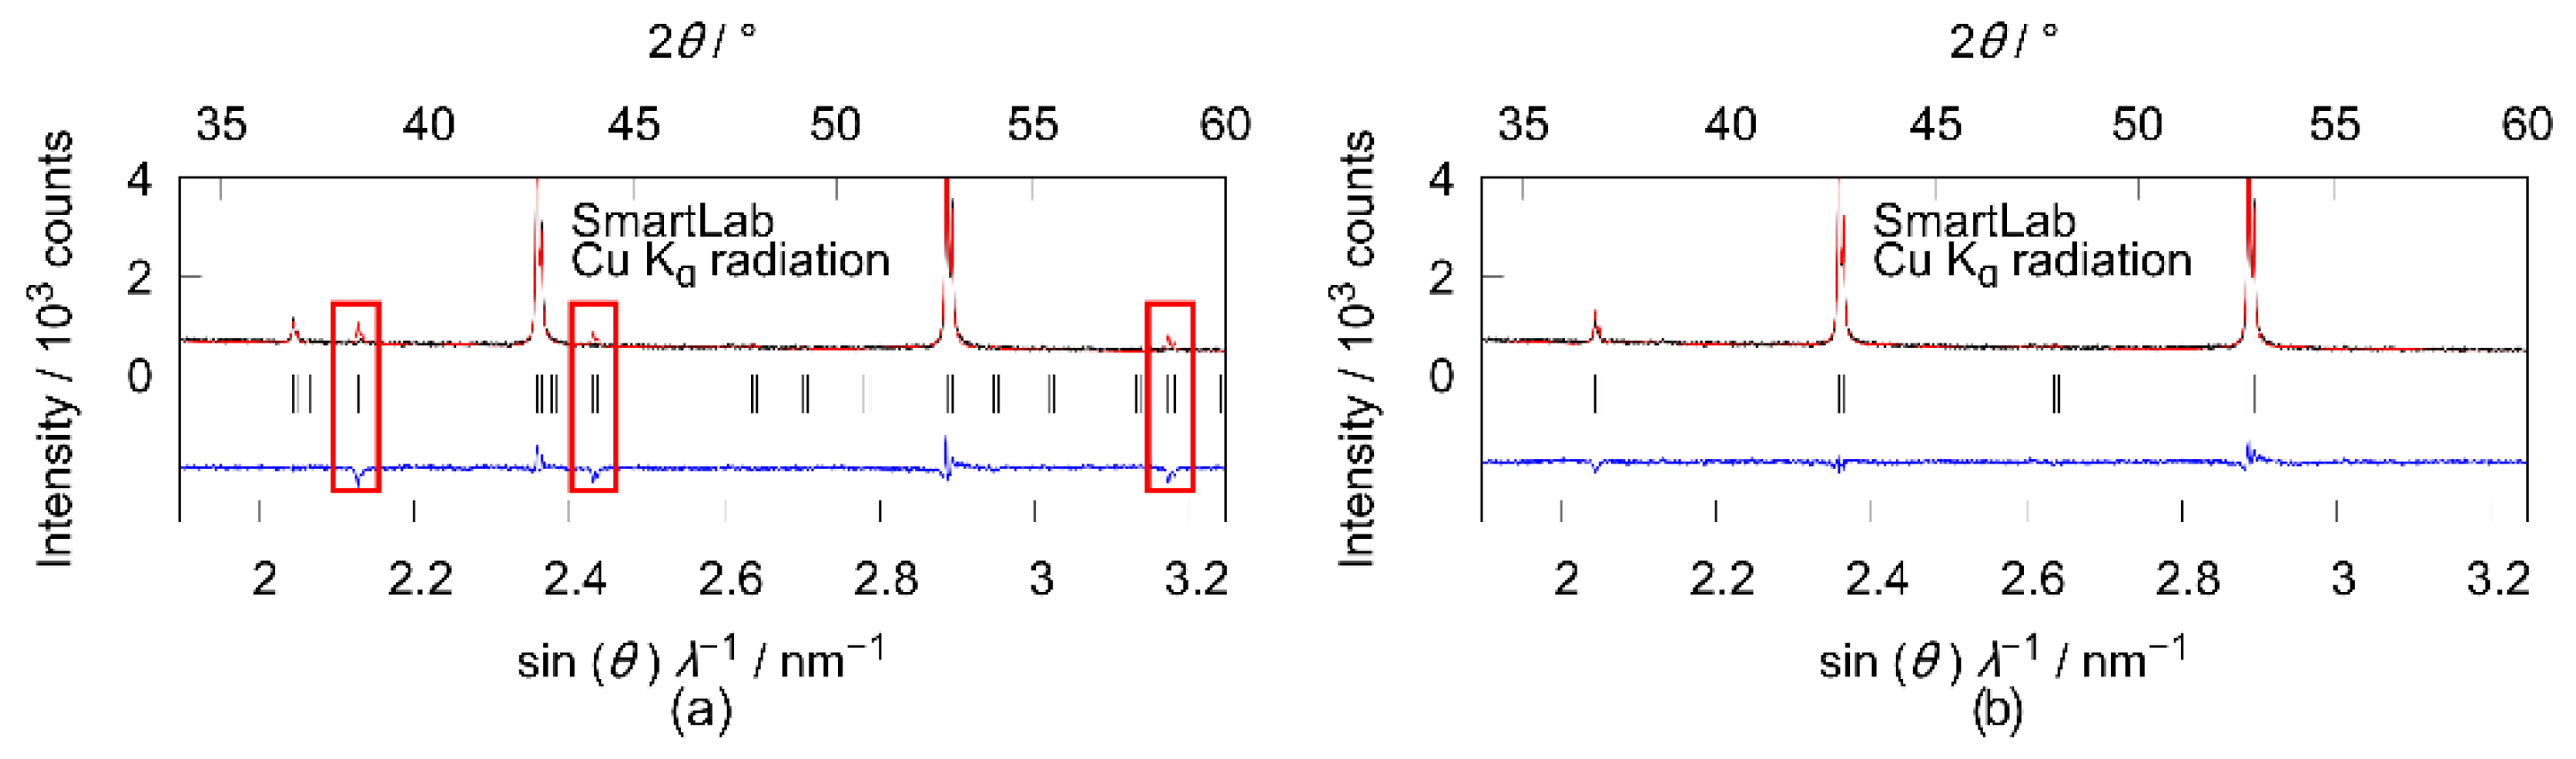
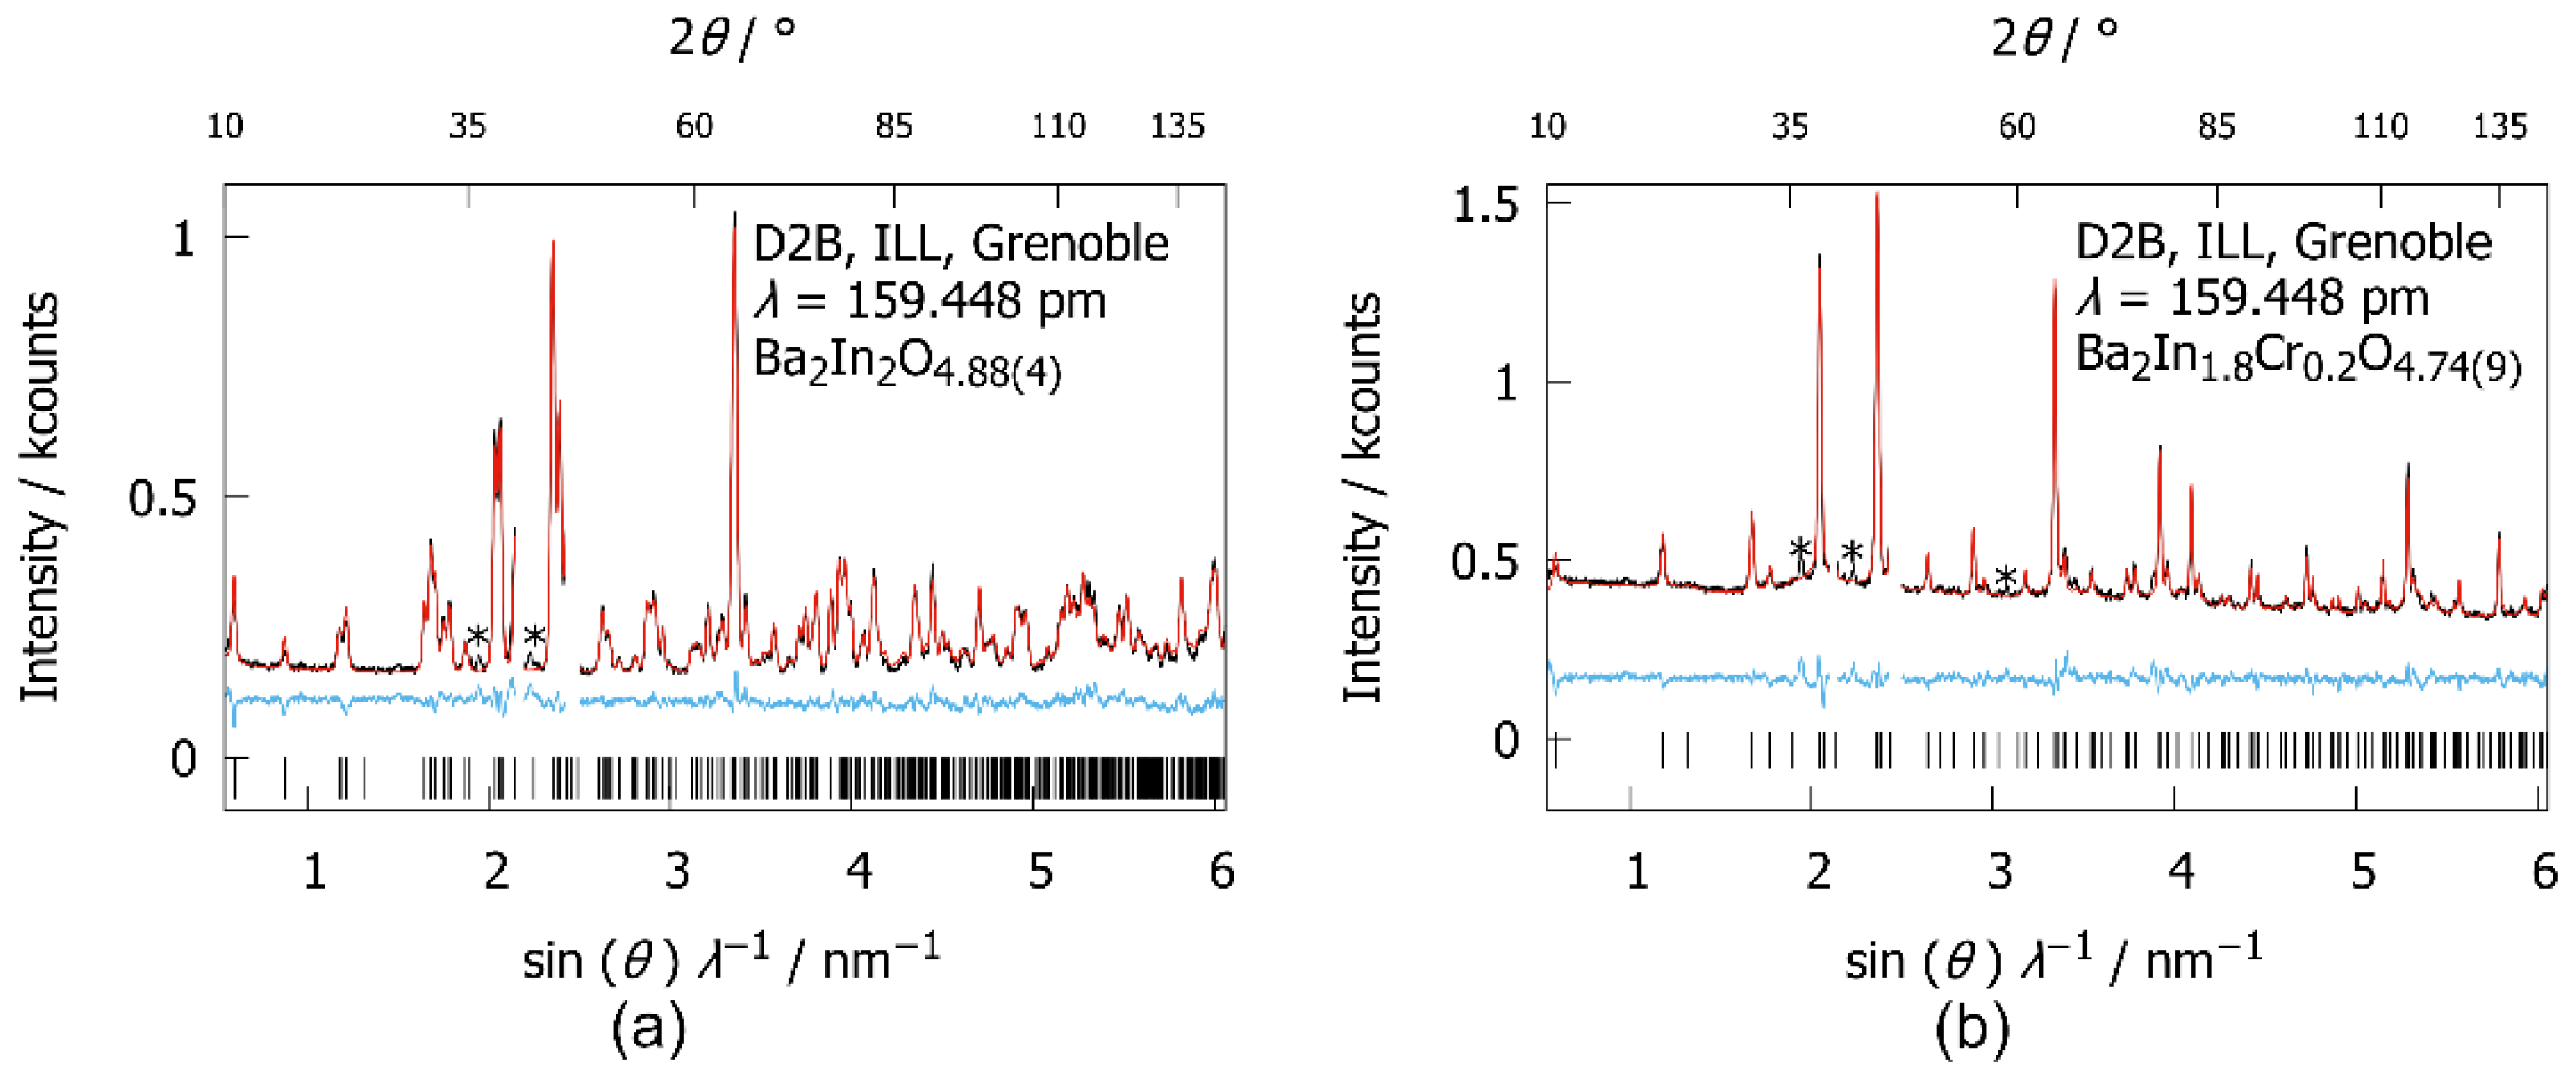
3.2. X-ray Diffraction

Ba2In1.8Cr0.2O5.3(H2O)x samples from different batches were studied by in situ powder X-ray diffraction. Since hydrogen typically cannot be localised in the crystal structure using X-rays, the main focus of this study was on the change in the lattice parameters during the release of water as an indirect marker. The in situ plot (Figure 1) shows significant reflection shifts between 450 K and 600 K, as well as between 750 K and 900 K. For a more detailed view, the development of lattice parameters, as extracted by Rietveld refinements, and the cell volume during the reaction are plotted in Figure S2. The refined parameters are summarised in Table S1. The decrease in lattice parameters between 450 K and 600 K can be assigned to the release of water, in agreement with former studies by mass spectrometry and thermal analysis [3].
The second decrease in the lattice parameters, taking place from 750 K to 900 K, can be assigned to the release of water, too. The amount of released water in the second step is probably smaller than in the first step, as its impact on the lattice parameters is smaller compared to the first step [3].
Yoon et al. [3] showed a release of carbon dioxide, starting at about 1150 K. However, the constant increase in cell volume beginning at 900 K in the presented measurement disagrees with the release of carbon dioxide coming from the Ba2In1.8Cr0.2O5.3(H2O)x. Most probably, an impurity phase remaining from the synthesis, likely BaCO3, not seen by XRD, starts to release carbon dioxide in this temperature range. Boyd et al. [30] showed that the pyrolysis of BaCO3 begins at 973 K and is 97% completed at 1273 K under vacuum, which is in accordance with the determined temperature range.
A phase transition into a defect perovskite-type structure, as known for Ba2In2O5, was observed at 1123 K. The c/a ratio of the sample increases significantly at the last heating step, being close to the value of 2 2 .
After the experiment the sample had shrunk and showed a colour change (Figure 2). The interior of the sample was green as well as several spots on the bottom side, where nitrogen was flowing through the sample. However, after grinding, the powder was homogenously light green, while the sample had a red to brown colour before the experiment.

3.3. Neutron Diffraction Experiments and Nuclear Magnetic Resonance Spectroscopy

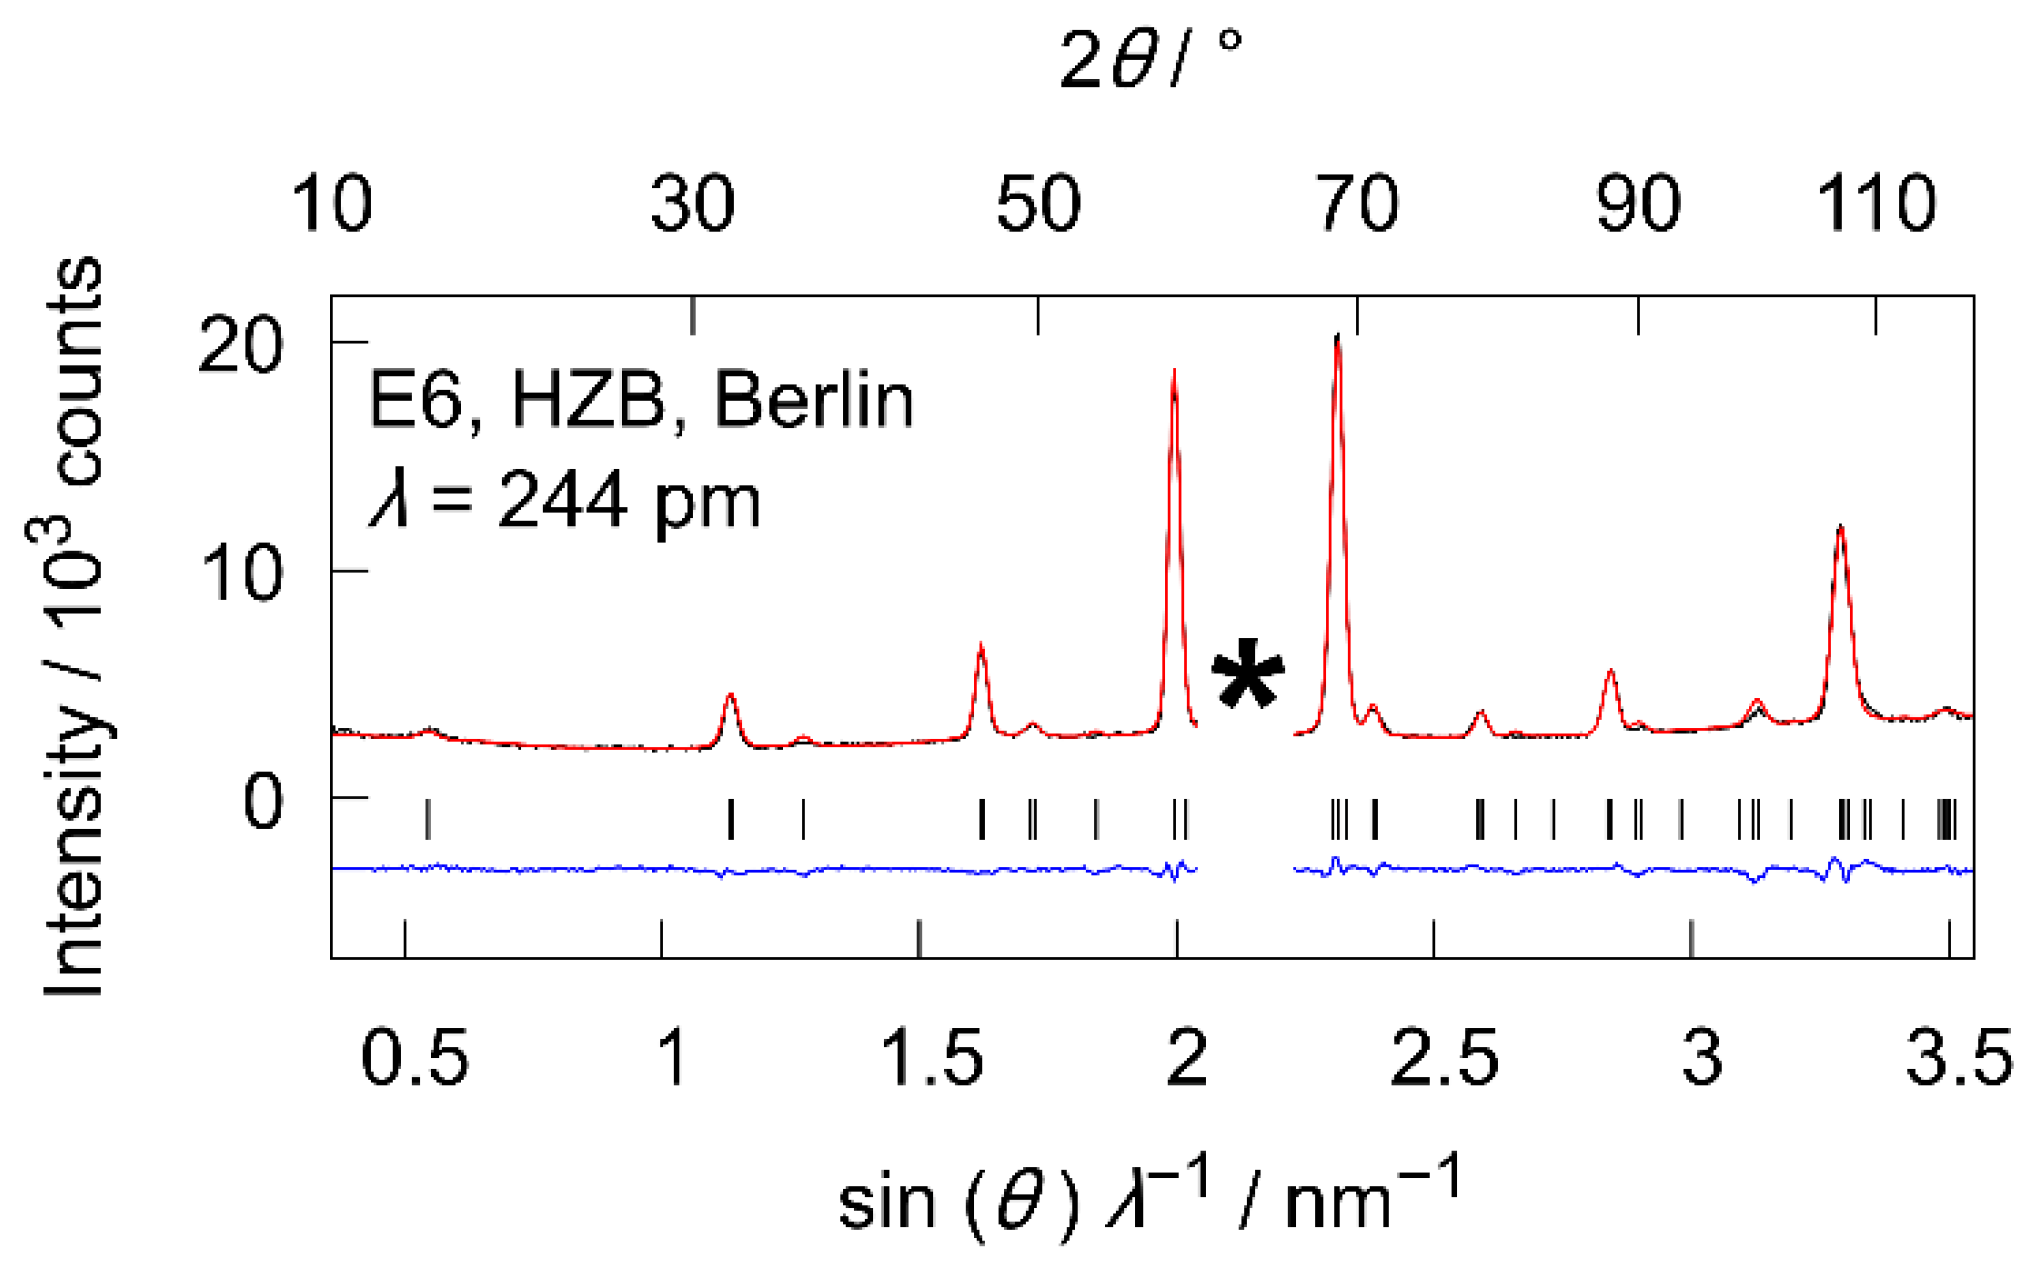
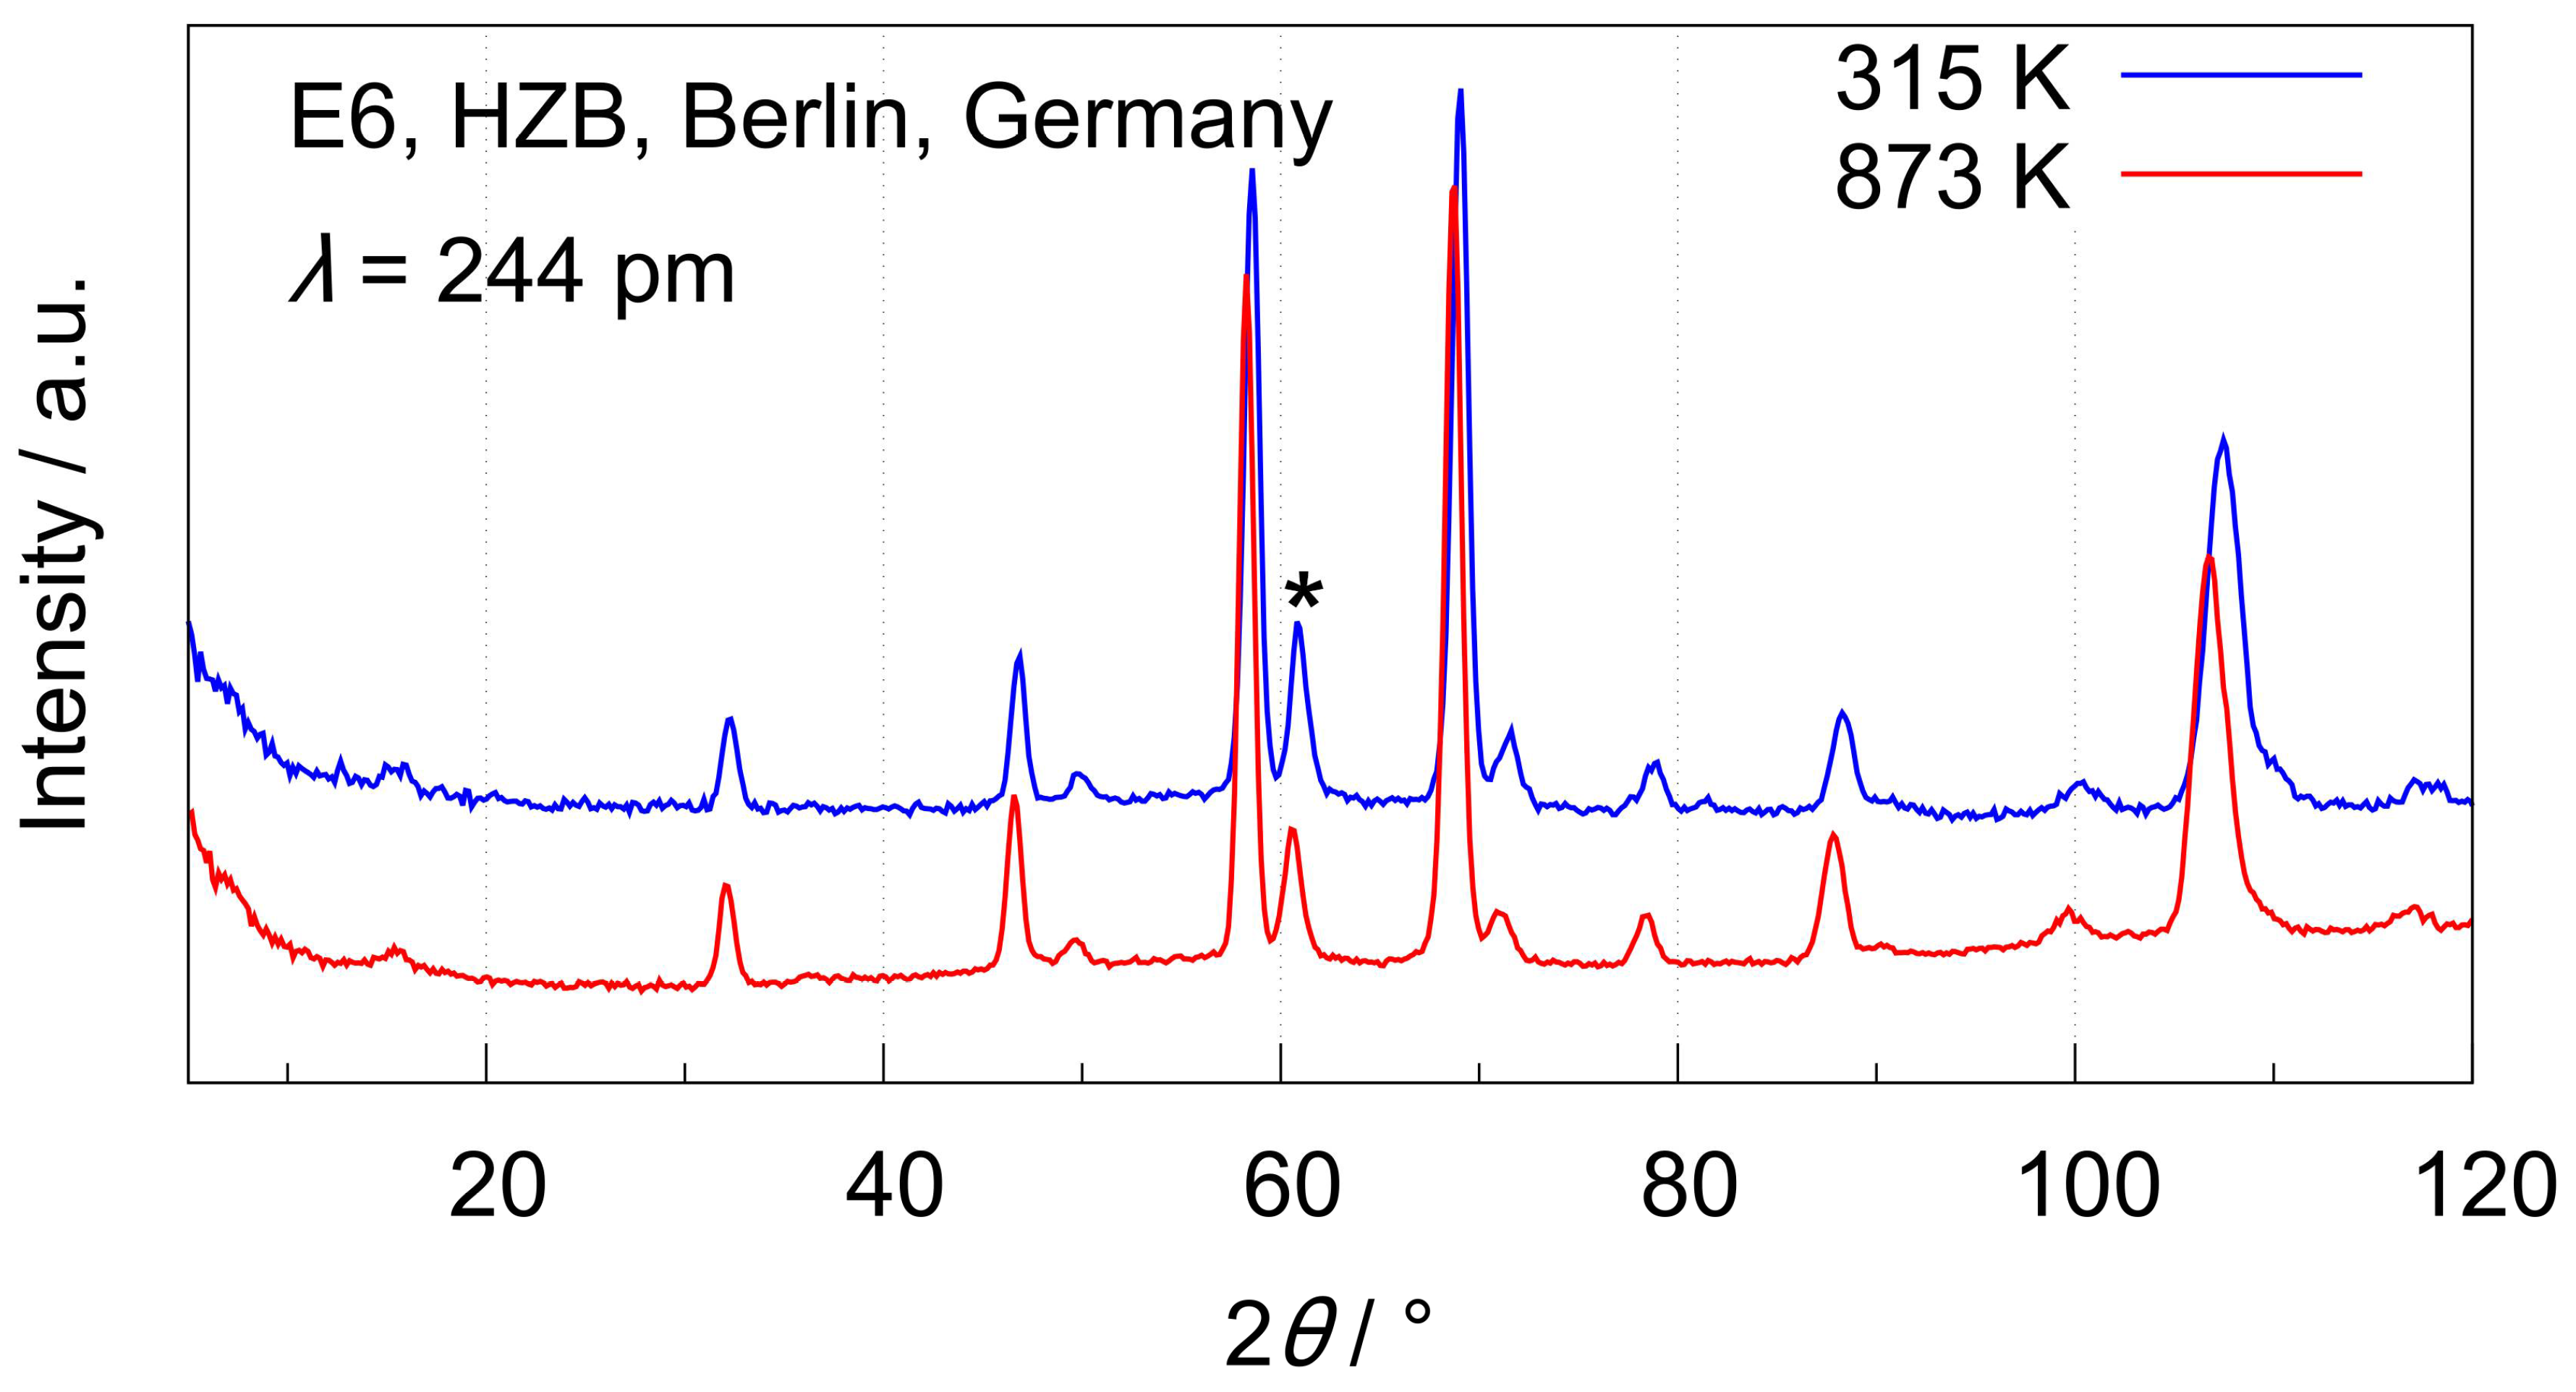
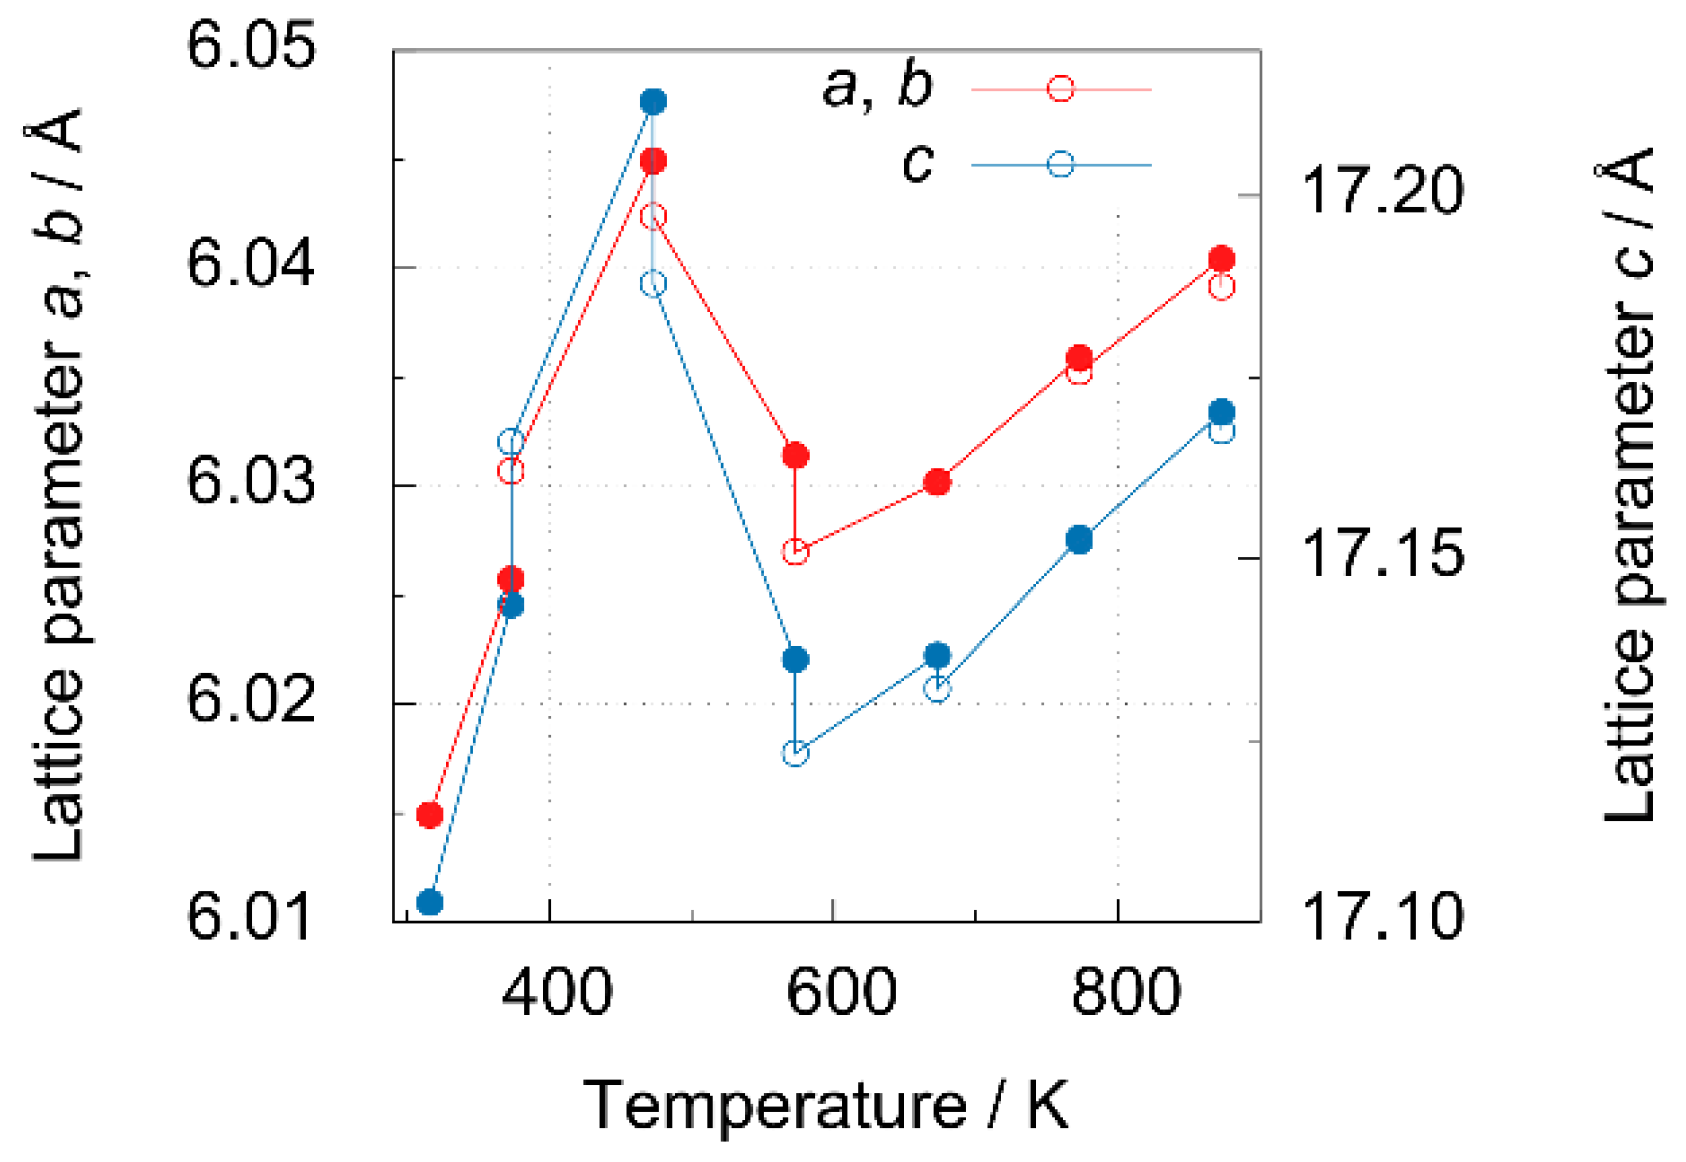
3.3.1. High-Temperature Neutron Diffraction Experiments at E6

Because of the weak X-ray scattering contribution of H and O in comparison to Ba, In, and Cr, a powder neutron diffraction experiment at the E6 diffractometer of HZB Berlin was conducted at 315 K and 873 K to extract further information on the water and oxygen content as well as potentially localising the protons. Using thermogravimetric analysis in argon, the net composition of Ba2In1.8Cr0.2O5.3(H2O)x was found (Figure S5, Table 2). The comparison of neutron diffraction measurements at 315 K and 873 K, both having the same measurement time, shows a significant difference concerning their background and the refined lattice parameters of Ba2In1.8Cr0.2O5.3(H2O)x (Figure 3 and Table S2). Hydrogen causes considerable incoherent scattering of thermal neutrons and thus the drop in background intensity is due to water release.
In a second set of experiments, powder neutron diffraction data were taken at seven temperatures at 315 K ≤ T ≤ 873 K. Lattice parameters, extracted by Rietveld refinements, (Figure 4) show the same trends as for the X-ray diffraction experiment. During the first heating step, the lattice parameter increases significantly during the second measurement compared to the first one. Possible reasons are discussed in Section 4.3.
The release of water by the sample should result in oxygen vacancies in the structure. The X-ray data (discussed above) did not give evidence of oxygen vacancies at a temperature of 873 K. In case of neutron radiation, with oxygen as the best coherent scattering contributor, an oxygen content of 5.26(7) was found at 873 K, which is slightly higher than the expected value of 5 for the brownmillerite-type structure. However, considering the doping by Cr6+, an enlarged oxygen content of 5.3 is plausible for ensuring charge neutrality. In the temperature range of T ≤ 873 K, neither in the collected PXRD (Figure 1, Figure S2) nor PND (Figure 5) experiments, indications for the formation of oxygen vacancies could be observed. Attempts to localise hydrogen atoms in difference Fourier maps of the E6 PND data were unsuccessful.

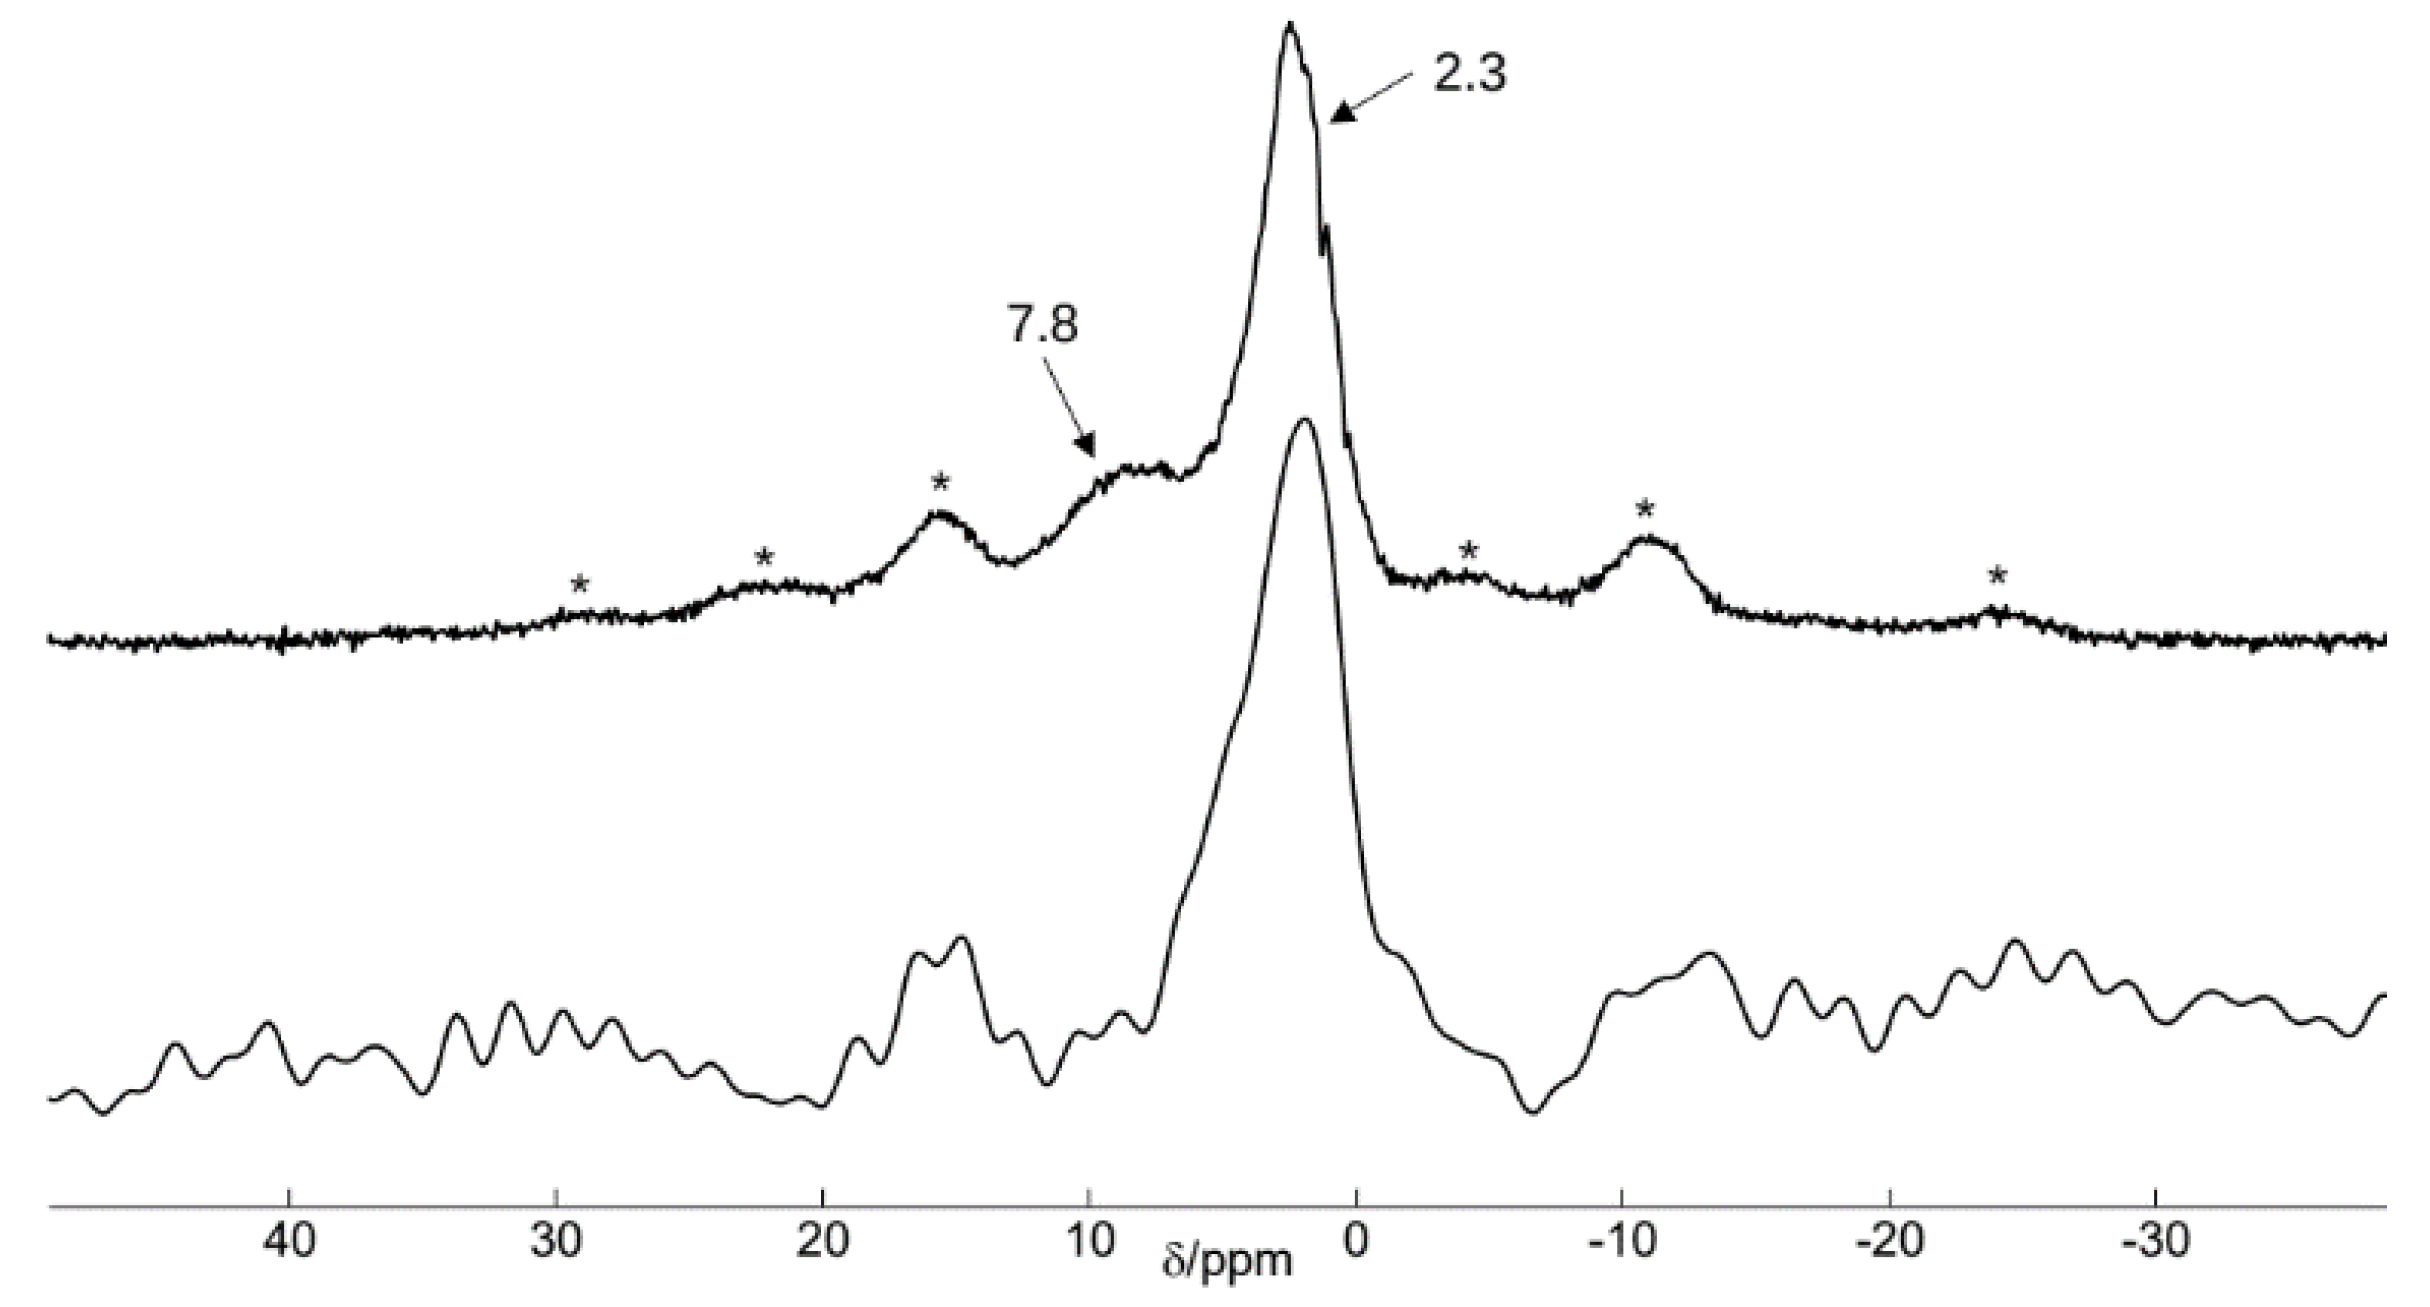
3.3.2. Nuclear Magnetic Resonance Spectroscopy

Based on the limitations seen so far by the diffraction techniques to distinguish between potential -OH groups and crystal water, solid-state NMR was performed (Figure 6). The recorded spectrum (Figure 6, top) shows two signals at 2.3 ppm and 7.8 ppm. The signals have almost equal intensity taking into account spinning sidebands and signal width. For further investigation, a double-quantum excitation experiment using the BABA sequence [25] was conducted. Based on this, only the signal at about 2.3 ppm remains, thus indicating a direct proton–proton interaction. As the signal at 7.8 ppm vanished completely, it indicates the absence of close proton–proton distances. These protons might be regarded as isolated (Figure 6, bottom).

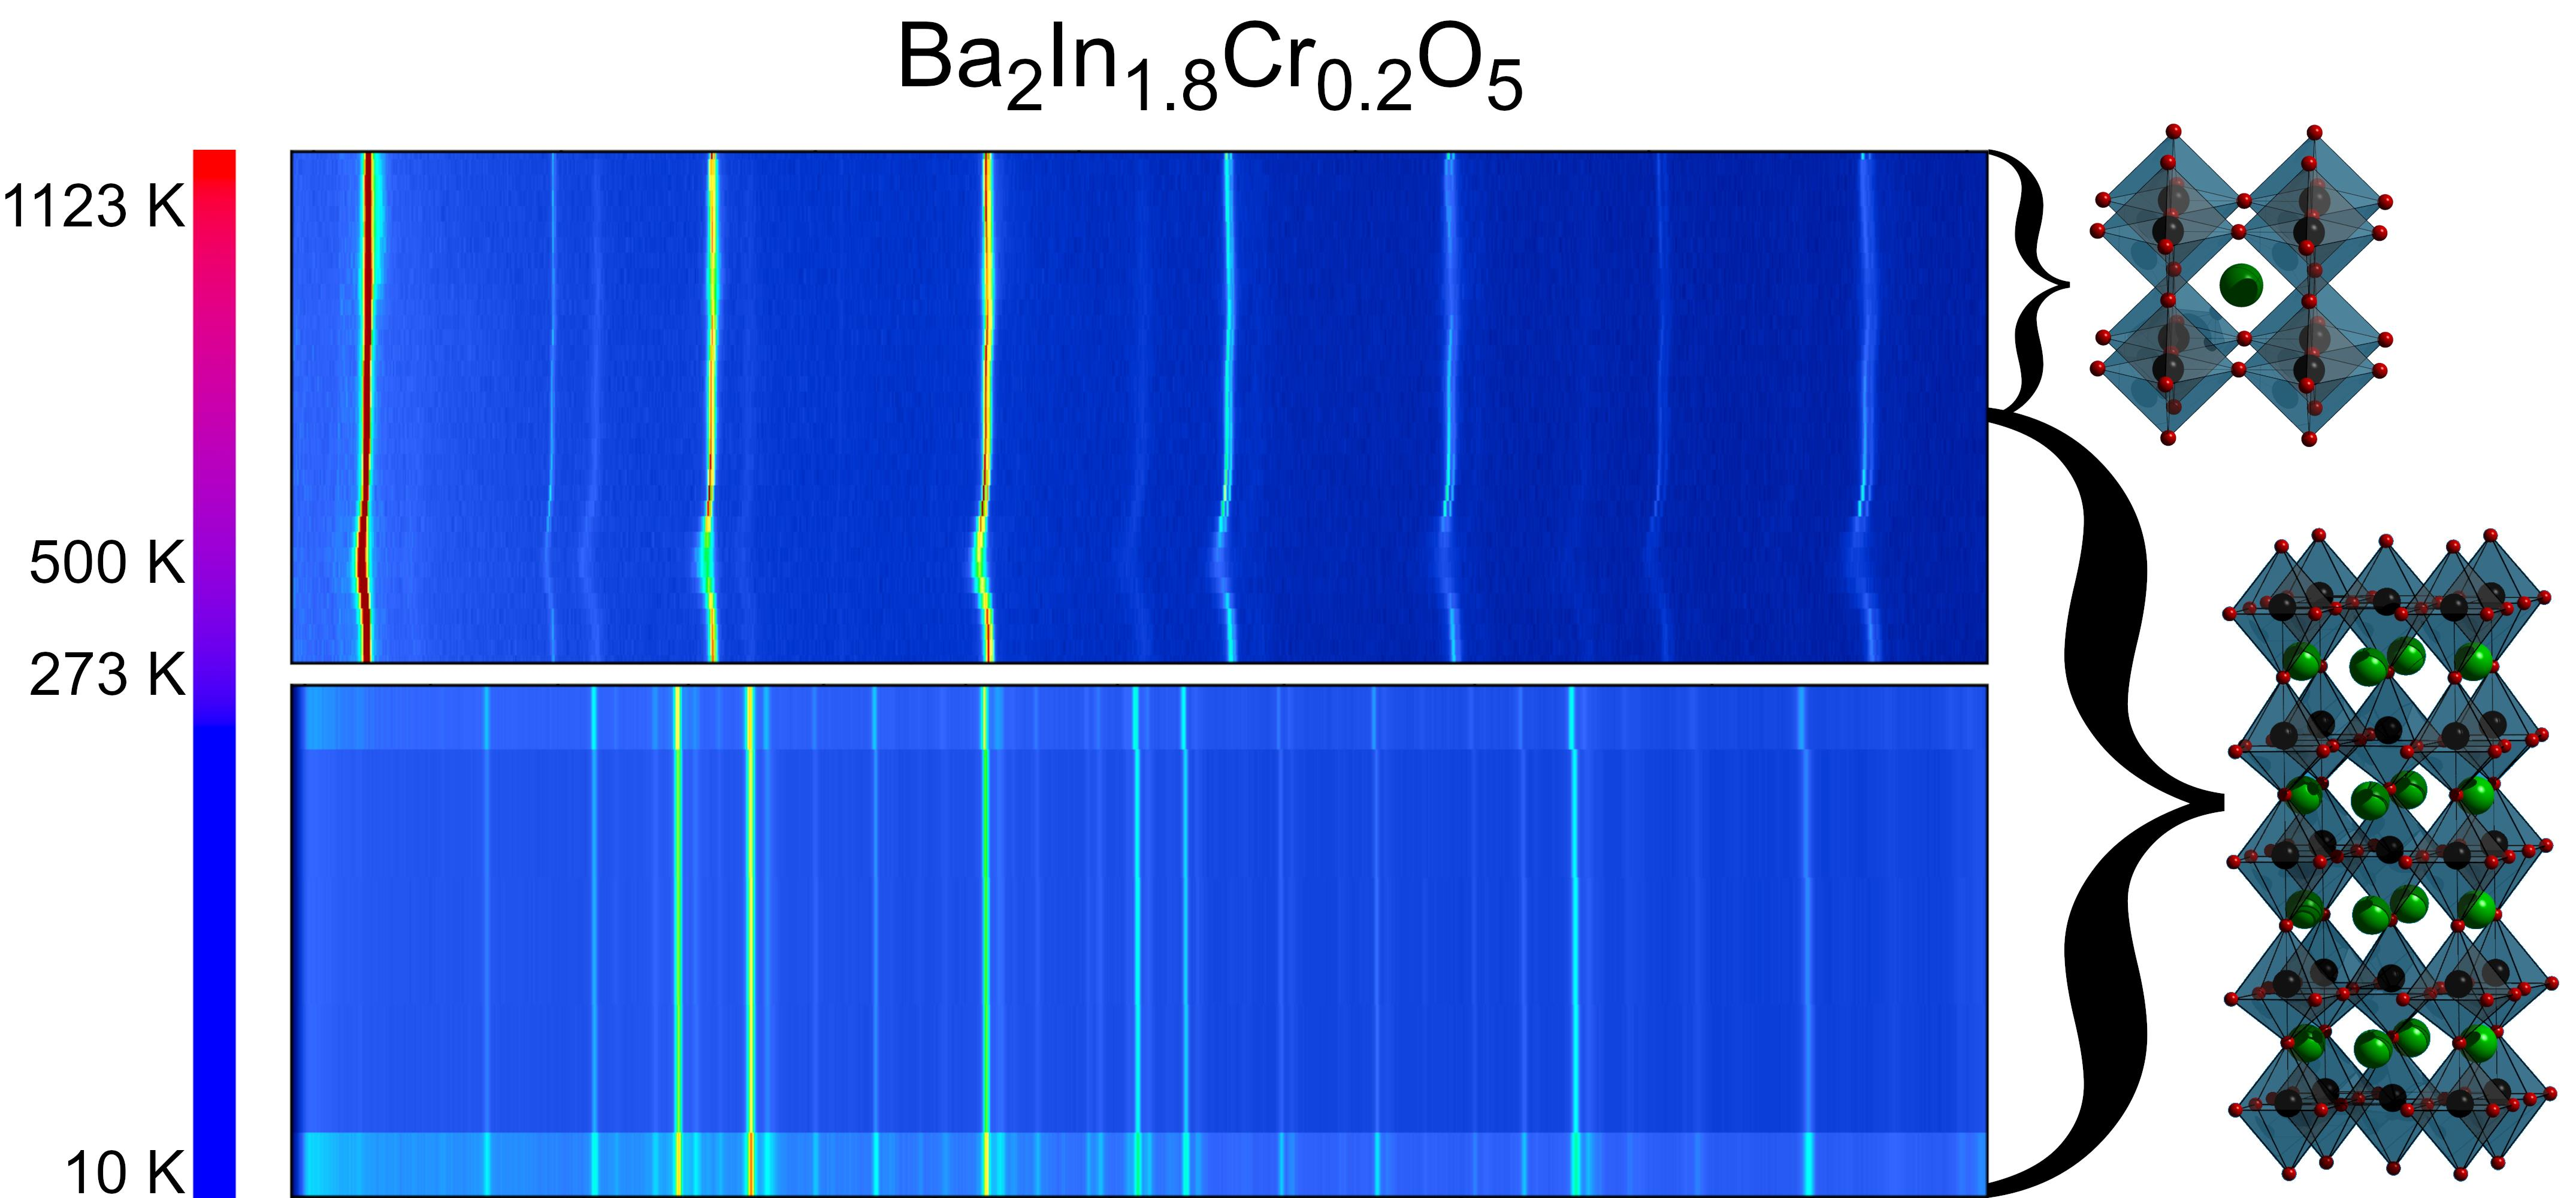
3.3.3. Low Temperature Powder Neutron Diffraction

The MAS-NMR experiments confirmed the presence of shorter and longer proton-proton distances in Ba2In1.8Cr0.2O5.3(H2O)x and indicated a rapid exchange of protons between the different chemical environments giving further explanation why the localisation of protons failed in the data analysis of the neutron diffraction data above room temperature using the E6 diffractometer (Δd/d ≈ 1 × 10⁻², 2.44 Å). Powder neutron diffraction data were also collected on the D2B diffractometer at ILL, providing a shorter wavelength (1.59 Å) and much higher resolution (Δd/d ≈ 5 × 10⁻⁴). However, hydrogen atoms still could not be located in the structure at room temperature by difference Fourier maps. Low-temperature neutron diffraction experiments down to 10 K were performed at the D2B, ILL, using a Ba2In2O5(H2O)0.16 and a Ba2In1.8Cr0.2O5.3(H2O)x sample in order to reduce the mobility of the protons and enhance the chances for localisation. No significant changes in the crystal structure were seen between 10 K and 300 K (Figures S6 and S7, Figure 7, and Tables S3 and S4). All effects can be described by the thermal expansion and after heating back to room temperature the collected powder diffraction patterns matched with that of the untreated samples. As before, the localisation of the protons was not possible by the applied diffraction techniques, even at 10 K.

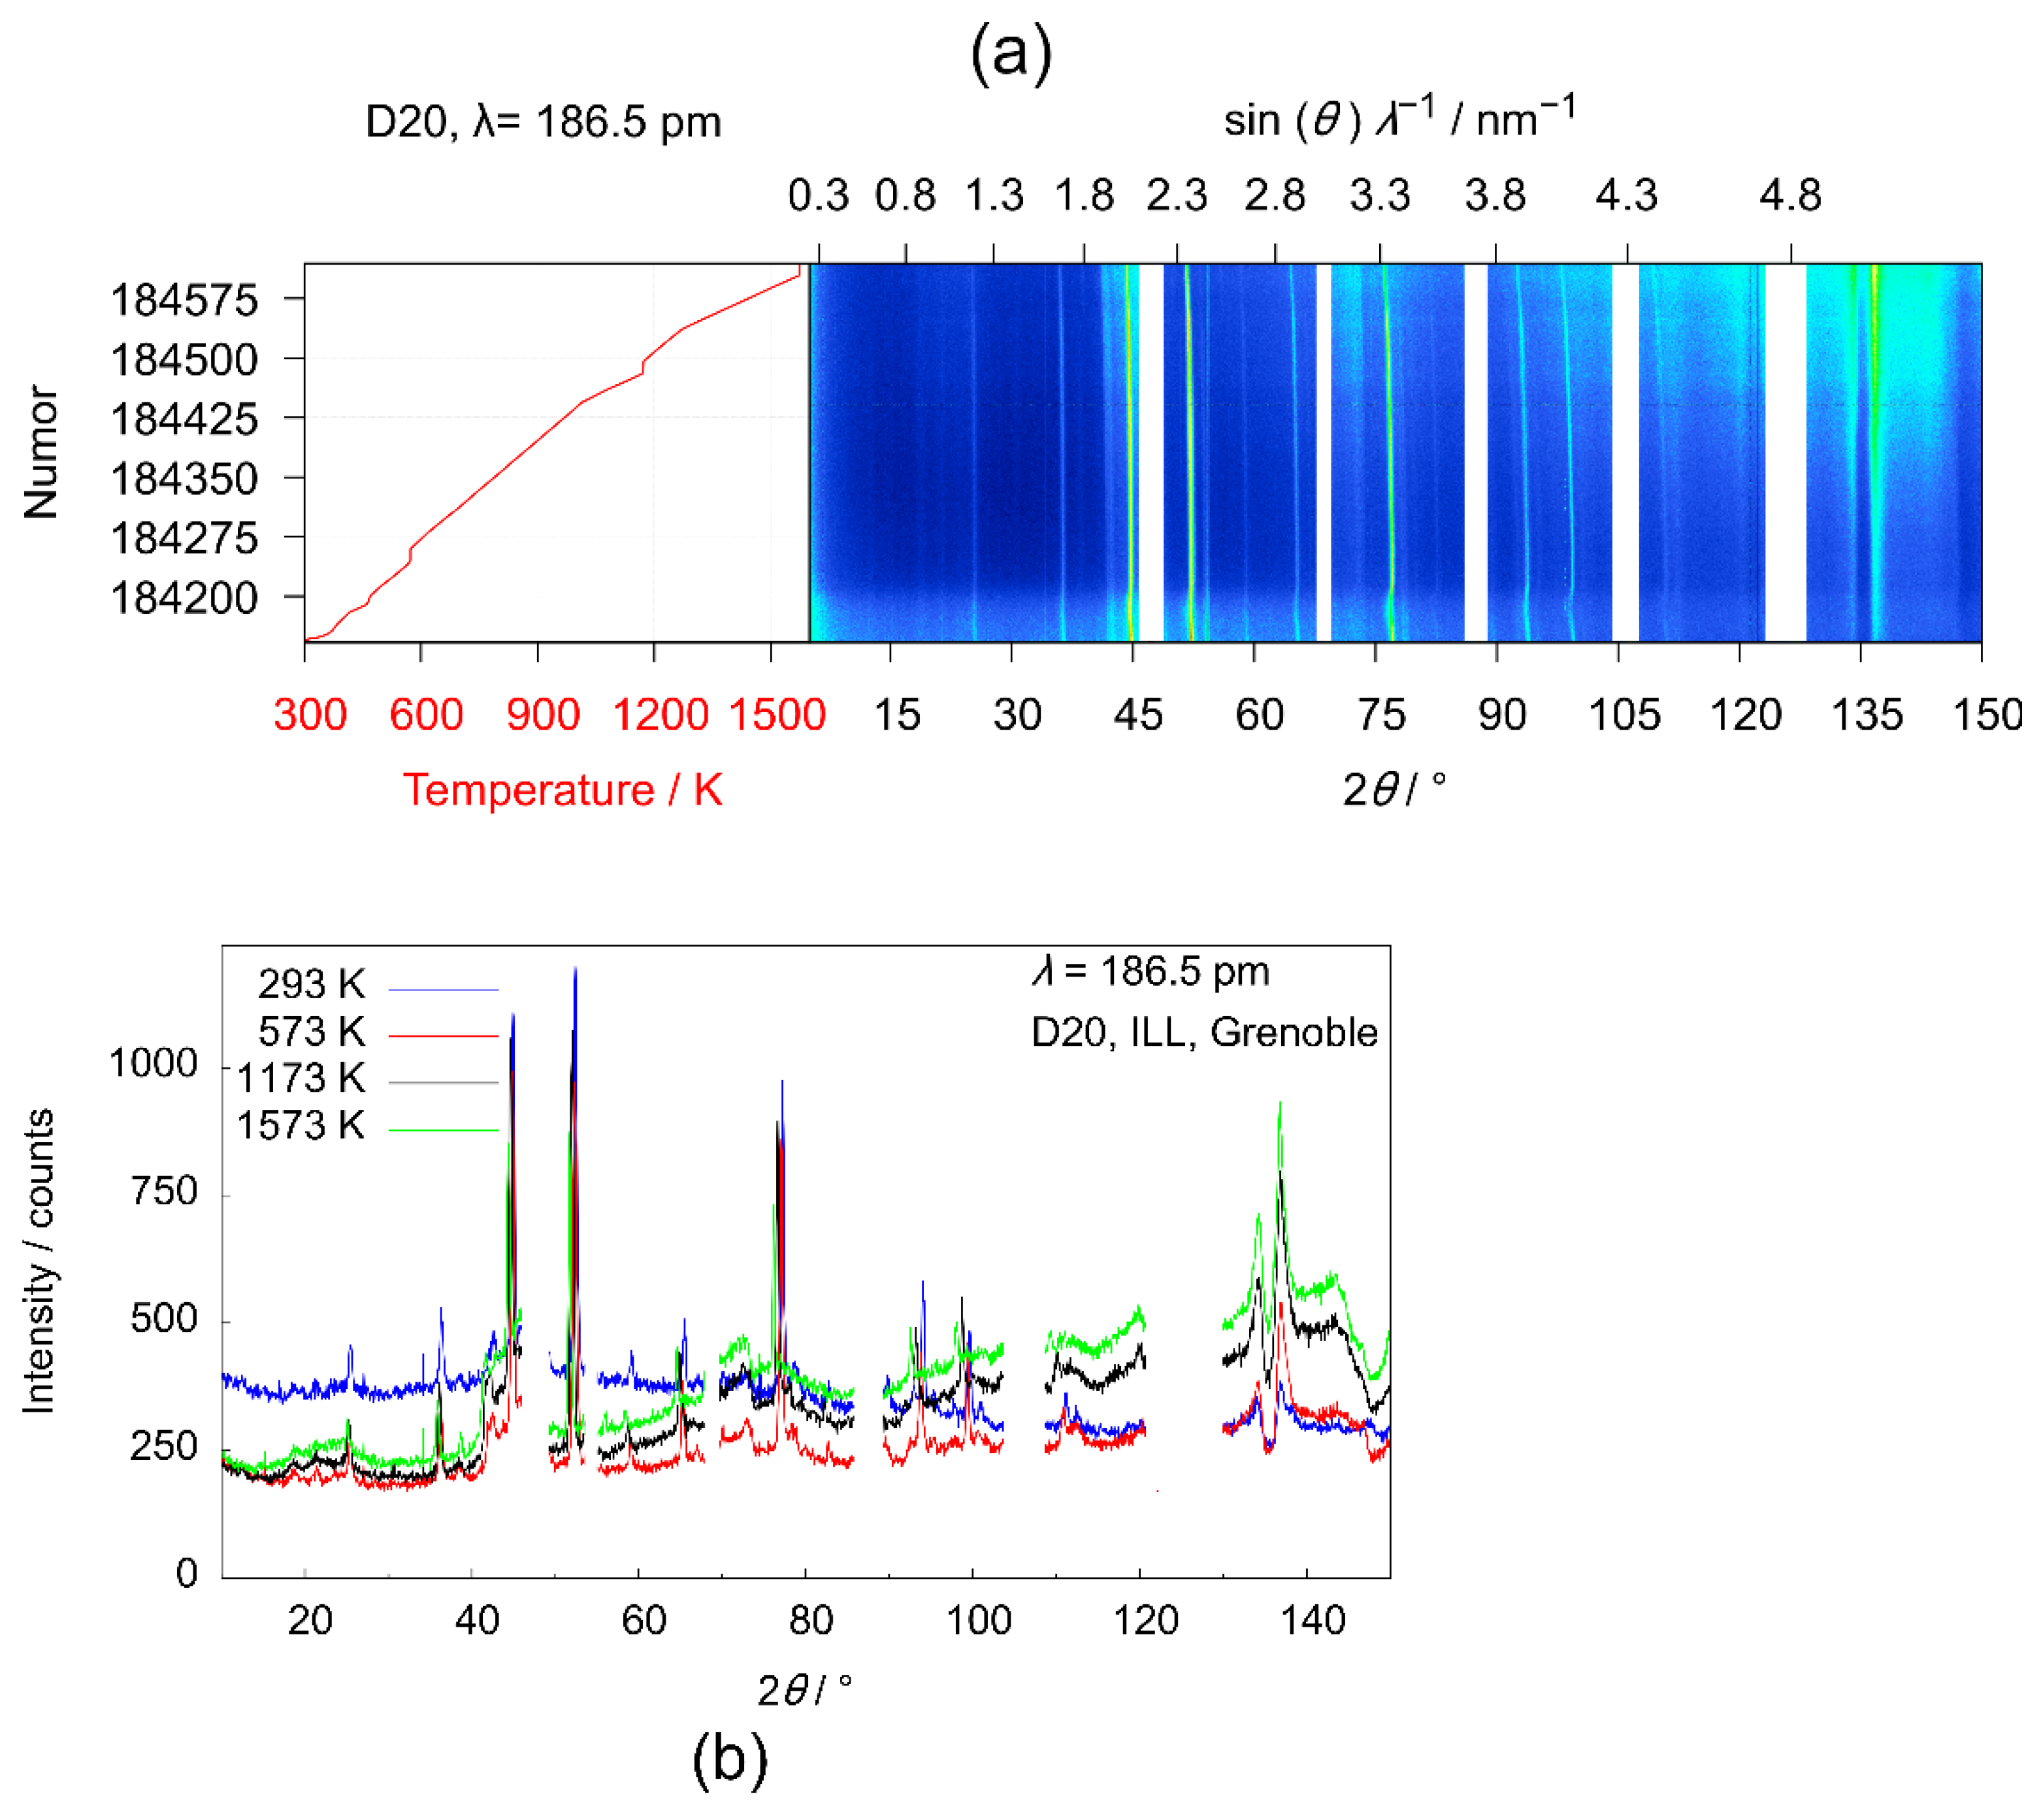
3.3.4. High-Temperature Powder Neutron Diffraction Experiments on D20

For Ba2In2O5, a phase transition to the cubic defect-perovskite-type structure could be observed [10,11,12,13,14]. Still, such a phase transition is not yet known for chromium-substituted samples. Therefore, a Ba2In1.8Cr0.2O5.3(H2O)x sample was heated in a dynamic vacuum (pmin ≥ 1.2 × 10⁻⁵ mbar) to 1573 K on the D20 diffractometer, using a high-temperature furnace to search for a potential phase transition.
As indium is a moderate neutron absorber [31], we focused on analysing the summarised measurements at room temperature, 573 K, 1173 K, and 1573 K. A phase transition could not be observed. The refined oxygen contents are presented in Table 3. Further, strong contributions of the used sapphire single-crystal crucible, for example, at about 2θ = 45°, hamper the refinements. The two reflections at about 2θ = 135° have been excluded from the data analysis, as they do not shift with temperature and no sample reflection is expected in that region (Figure 8). Therefore, it is most probably a contribution from the sample environment. The refined lattice parameters are summarised in Table S5.

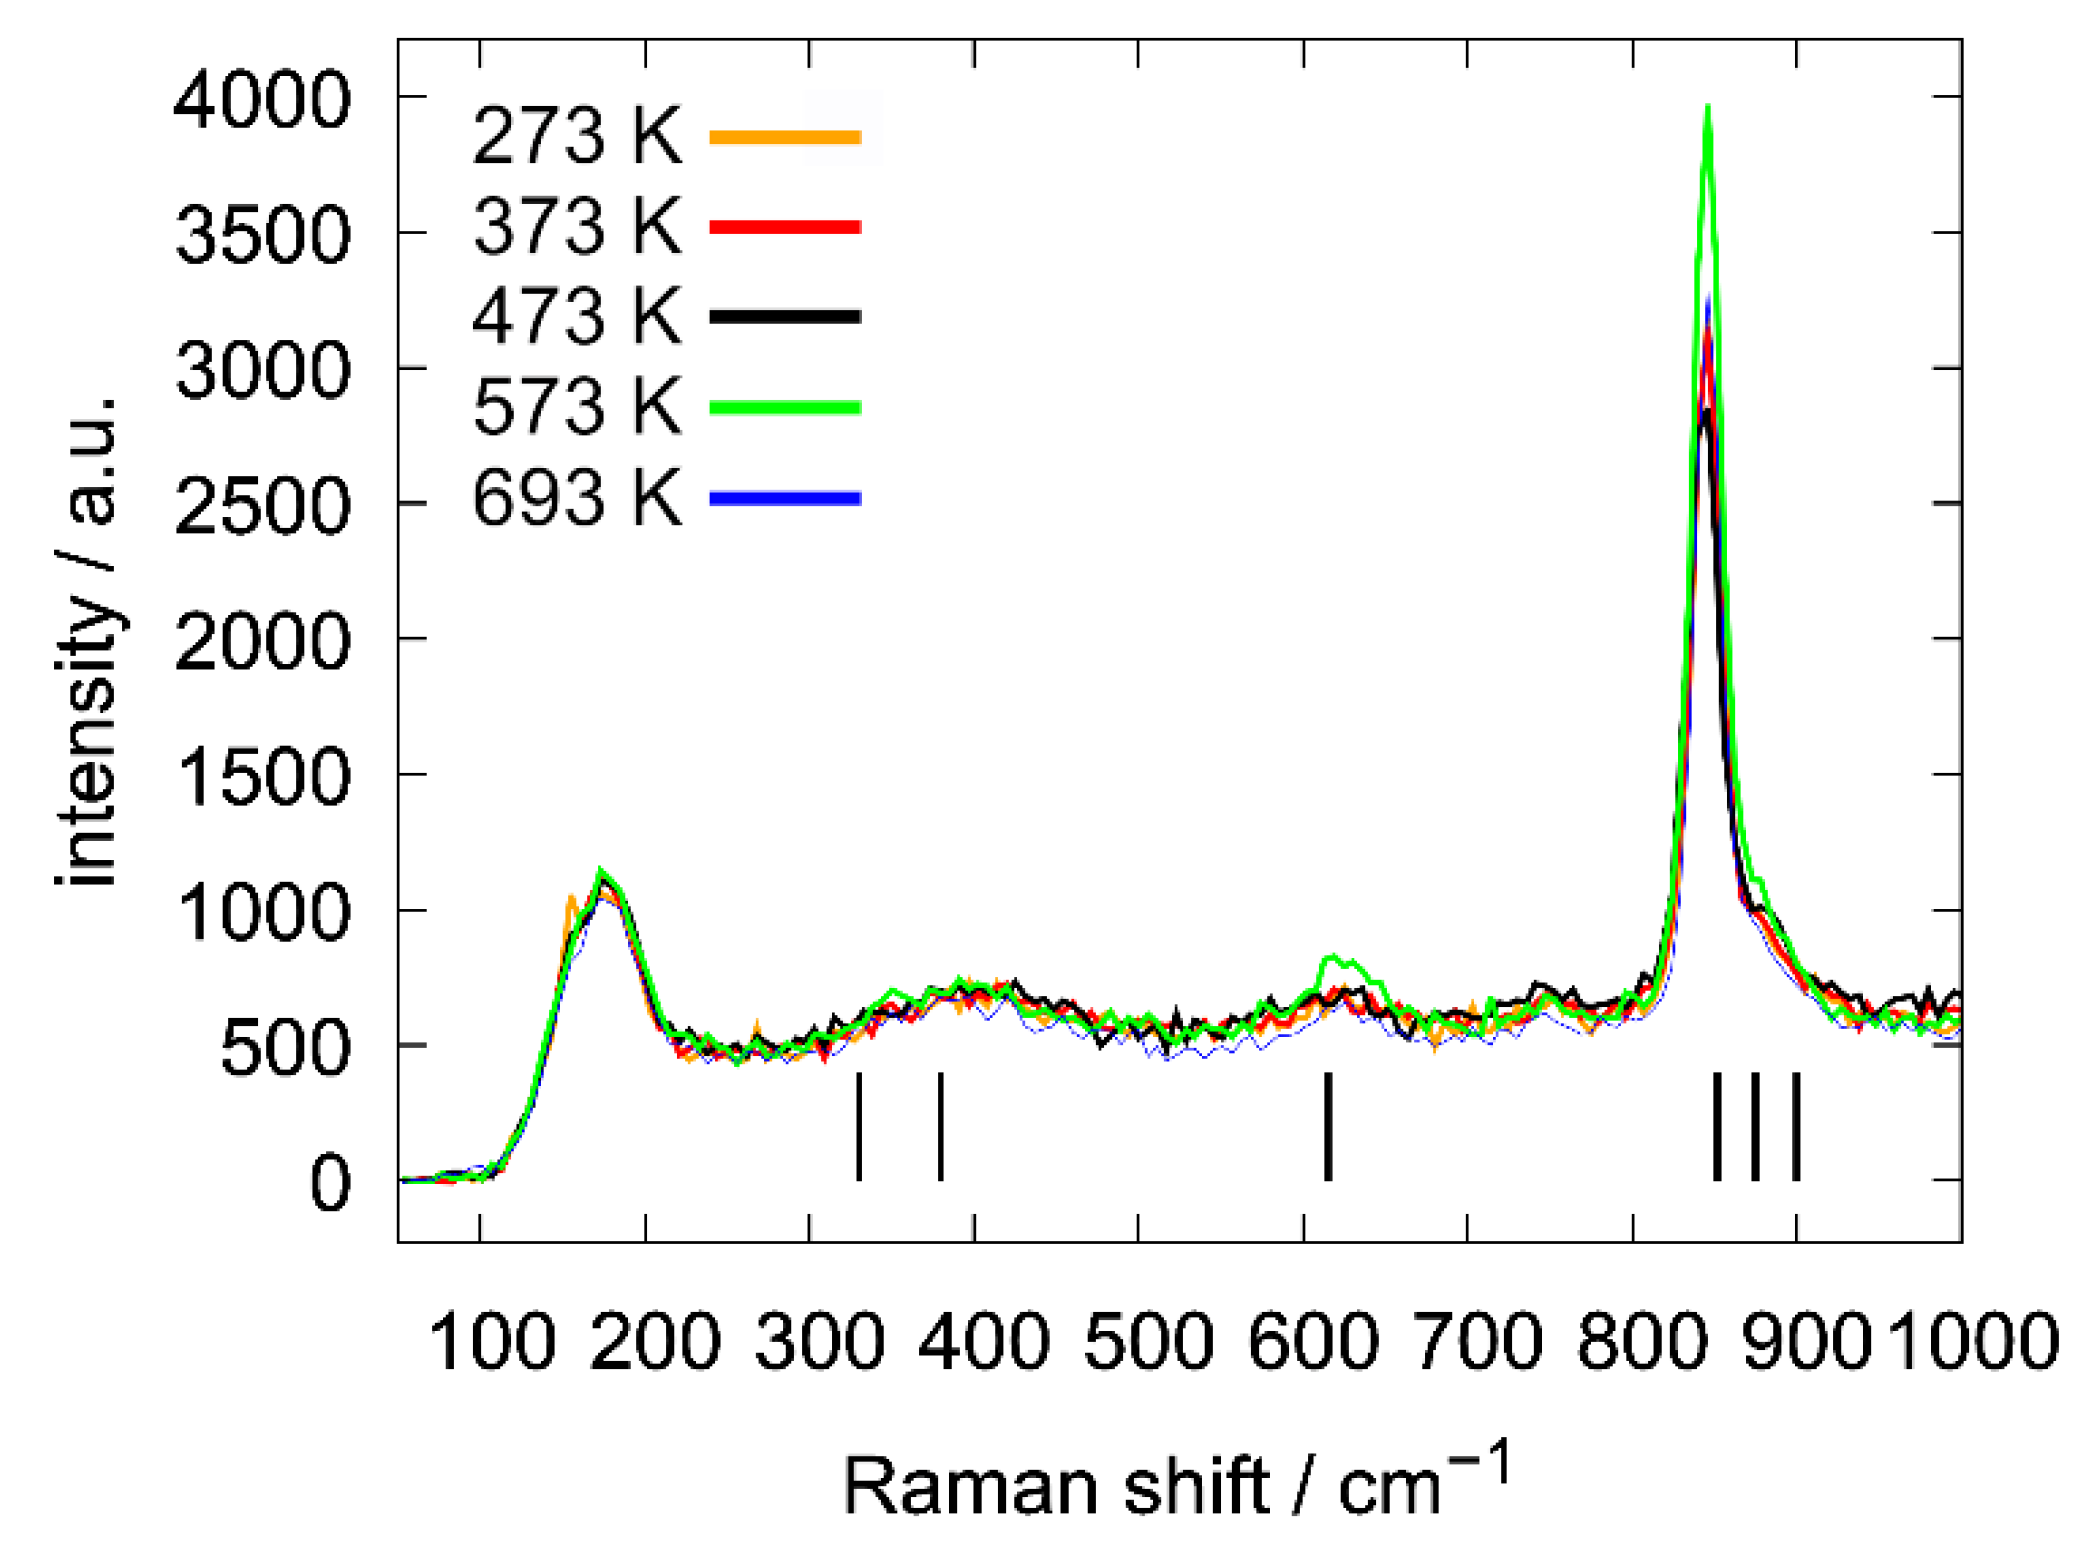
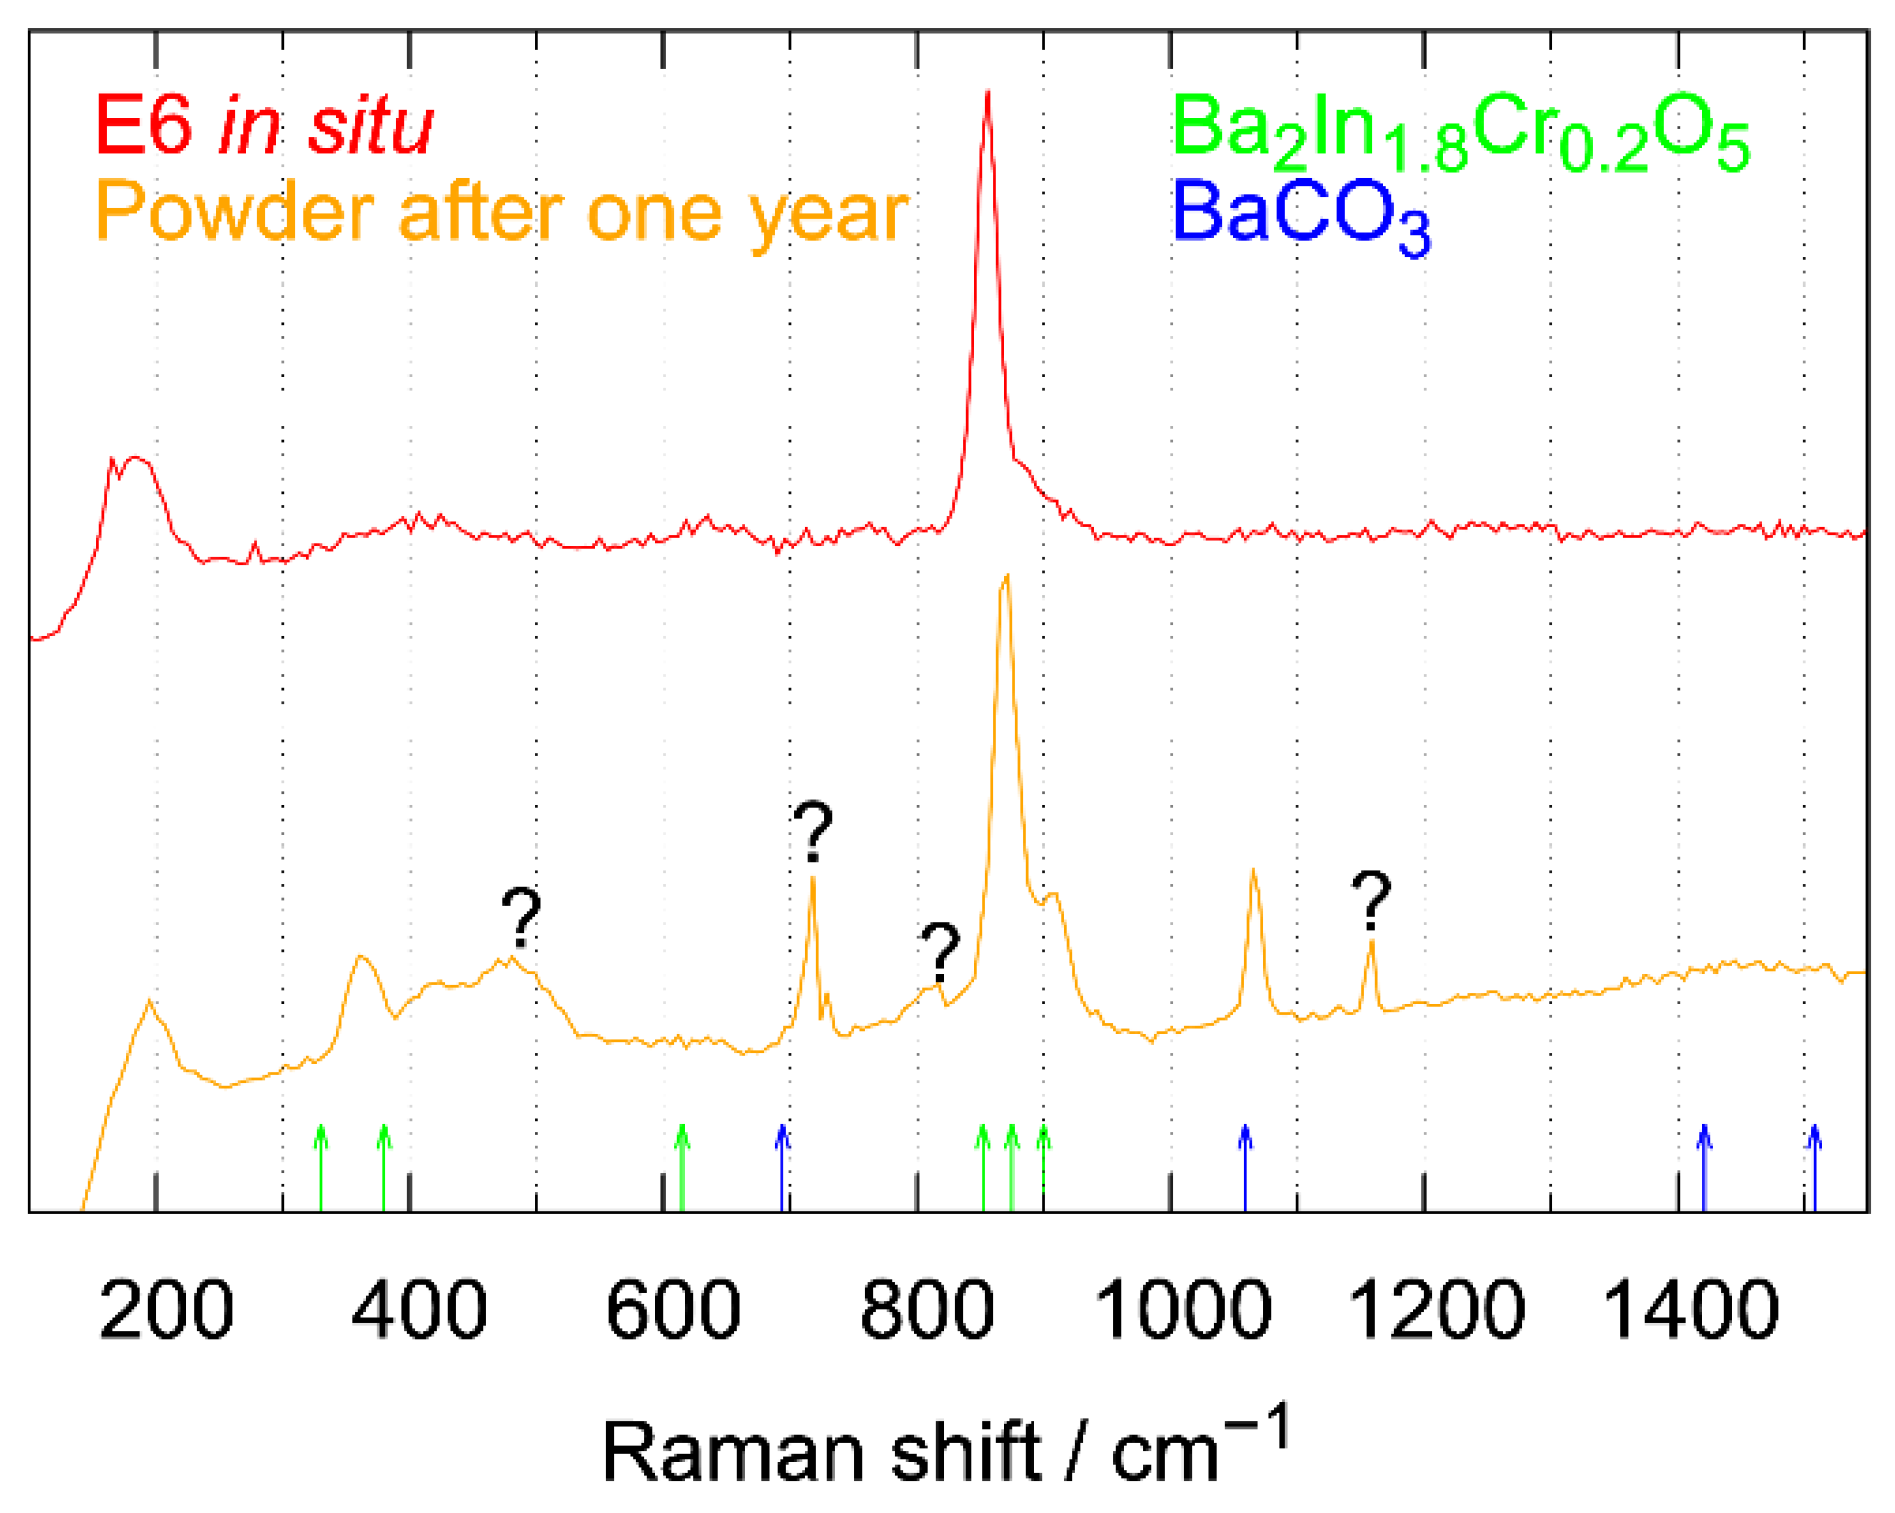
3.3.5. Powder Neutron Diffraction and Raman Spectroscopic Measurements

The Raman spectra of Ba2In1.8Cr0.2O5.3(H2O)x (Figure 9) agree with the literature [3]. Further, only the measurement after the sample was heated up to 573 K showed a significant difference from the other measurements. As no trend concerning the intensities could be observed, the effect is most likely based on the changes on the surface by the sample releasing water. As a consequence, the amount of sample being illuminated by the excitation laser may differ. During the whole experiment, the powder kept its red colour. A colour change to green, occurring during the X-ray measurements (Figure 2), was not observed. Colour changes were only observed when performing the heating experiments under vacuum or with an inert gas such as nitrogen or argon. If a colour change is thus an indicator for a potential reduction in Cr6+ to Cr3+, it is understandable that the Raman spectroscopy reveals the same signals since the experiment was carried out in air. As the dehydration reaction is likely reversible in ambient air under the chosen conditions, an identical Raman signal at room temperature is to be expected.

4. Discussion

4.1. X-ray Diffraction

For the initial Rietveld refinements of the X-ray data, a model with the molecular formula of Ba2In1.8Cr0.2O5, according to the brownmillerite structure, was used [14]. The chromium was distributed statistically on both indium sites, as an ordering of the chromium atoms was not found in the tetragonal phase (Tables S6–S8). The refined temperature-dependent unit cell parameters are visualised in Figure 10. Figure 11 shows the diffraction data at low angles. The superstructure reflection, being clearly visible at room temperature, becomes broader with increased temperature and seems to disappear at 1123 K. Further Rietveld refinements show a phase transition to a cubic defect-perovskite-type structure, as the misfits caused by the tetragonal model are well-explained with a phase transition (see Figure 12). Additionally, the Rwp and Rp values decrease significantly. Combined with the better fit for the cubic phase, shown in Figure 12, a phase transition seems probable. Moreover, the chromium content in the cubic phase could be refined, leading to a formula of BaIn0.92(2)Cr0.08(2)O2.5, being in full accordance to the expected BaIn0.9Cr0.1O2.5, respecting standard deviations. Additionally, the c/a ratio of the last measurement using the tetragonal structure model gets significantly closer to the value of 2√2, making a structure change more probable (Table S1). The refinement results of the crystal structures of Ba2In1.8Cr0.2O5 (I4cm) at room temperature and BaIn0.9Cr0.1O2.5 (Pm 3 ¯ m) at 1123 K are plotted in Figure 13. The refined structural data of BaIn0.9Cr0.1O2.5 are summarised in Table S9.
The PXRD measurement after one year showed that for the decomposition of the sample heated in flowing N2 (p = 0.15 MPa, p(O2) < 5 ppm, p(H2O) < 5 ppm) into BaCO3, only about a 6% phase fraction was assigned to Ba2In1.8Cr0.2O5. An indium- or chromium-containing phase could not be found using X-ray diffraction. Raman spectroscopic measurements show at least the existence of another decomposition product (see Figure 14).

4.2. Low-Temperature Neutron Diffraction

Rietveld refinements of the crystal structure of Ba2In2O5(H2O)0.16 confirmed the brownmillerite structure type in orthorhombic space group Icmm at 10 K [14]. A decreased symmetry towards space group Ibm2 showed no better results concerning Rwp, RBragg or the difference plot. The system shows no structural change from 10 K to 300 K except for thermal effects (see Figure S6). Neutron diffraction measurements show unidentified weak reflections, identical in both samples (Figure 15).
Ba2In1.8Cr0.2O5.3(H2O)x showed no structural change in the temperature range from 10 K to 300 K either (see Figure S7). The structure was refined in space group I4cm, in accordance to Yoon et al. [3]. In both systems, Rietveld refinements were made without hydrogen atoms in the structure model, as no 1H could be found in difference Fourier maps, even at 10 K.
Comparing the normalised data from both systems (Figure 7), the chromium-containing sample shows a higher background, being a clear hint for a higher water content causing more incoherent scattering. The relatively low oxygen content during the low-temperature measurements compared to other data are a concern, which is discussed in the Supplementary Materials.

4.3. High-Temperature Neutron Diffraction

The significantly decreased background, as displayed in Figure 3, clearly hints at water release due to reduced incoherent neutron scattering by 1H, being in accordance with all other studies (e.g., TGA-MS in Figure S5). Hydrogen atoms could not be located. The refined oxygen content of 5.26(7) at 873 K (E6) and 5.36(4) at 573 K (D20) is unusual for a brownmillerite-type structure. As indium, oxidation state +3, is substituted by chromium, oxidation state +6 [15], the expected oxygen content needs to be higher (5.3) assuming a charge neutral compound. This is in good agreement with the determined oxygen contents. However, at higher temperatures, 1123 K and above, the oxygen content seems to drop closer to 5. Most probably, the observed H2O release at high temperature in the TGA-MS measurement (Figure S5) resulted from a condensation reaction of the neighbouring hydroxy groups; while, simultaneously, the chemical potential gradient at high temperatures between the sample and the surrounding gas atmosphere drives oxygen to leave the crystal lattice. This needs to be balanced for charge neutrality, making a Cr reduction to +3 plausible. The green colour of all the heat-treated powders under inert conditions (nitrogen, argon, or vacuum) is a clear hint towards a chromium +3 species. However, the TGA measurements in inert gas and air (Section 3.1) revealed a smaller mass change difference, as expected for a complete reduction of Cr6+ to Cr3+, indicating that already a release of about 0.05 O per formula unit could be sufficient to induce the colour change from red to green. The thermal reduction of Cr(VI) species at a temperatures above 673 K is well-known from thermal analysis [33,34] and X-ray photoelectron spectroscopic investigations [35,36] of the Phillips catalysts CrOx (x ≤ 3) supported on SiO2, respectively. Upon the thermal reduction of Cr(VI) oxo species, plentiful intermediate phases, such as Cr3O8, Cr2O5, Cr2O74−, Cr5O12, CrO2, or Cr(CrO4)3, have been observed [34,36,37,38]. The occurrence of similar species, hence, is plausible for the high temperature exposure of Ba2In1.8Cr0.2O5.3 under low oxygen partial pressure conditions. This could give a possible explanation why a colour change was already obtained by a small change in the oxygen content. Alternatively, the exposure time at a high temperature and low oxygen partial pressure during the TGA experiments might not be sufficient to complete the reduction from Cr6+ to Cr3+ compared to the PXRD and PND experiments. During heating in air, as done while pairing neutron diffraction and Raman spectroscopic measurements, no colour change was observed. This could be understood by the higher oxygen partial pressure suppressing the reduction of chromium.
During the measurements at E6, the lattice parameters during both measurements at the same temperature setpoint differ heavily below 600 K. Most probably, this is an effect of the high temperature furnace, which does not offer a precise temperature regulation at these lower temperatures. Further, the ‘cold’ sample, being inserted at room temperature, needs a bit of time till the target temperature is reached accurately. Further, comparing the collected E6 PND data to the TGA and PXRD measurements, a shift in the onset temperature by about 100 K towards higher temperatures was observed at the beginning of the decrease of the unit cell parameters. This can be understood by the fact of altered sample geometry between the PXRD and PND experiment. In the conducted E6 measurements, the crucible had to be filled 30 mm high with only a diameter of 4 mm. This, of course, hampers the gas exchange with the atmosphere, resulting in higher onset temperatures for the second water release. This effect might be even more drastic for the PND experiments on D20 as the additional niobium container further limits the gas exchange. This might be an explanation why only at the highest temperature of 1573 K indications for a release of oxygen were observed.
The phase transition observed with X-ray data cannot be addressed using the high-temperature PND data collected at D20. The reflections used for crystal structure discrimination, as shown in Figure 11 and Figure 12, cannot be observed during these measurements at any temperature.

4.4. Nuclear Magnetic Resonance Spectroscopy

The recorded NMR spectrum of Ba2In1.8Cr0.2O5.3(H2O)x shows two signals, which is in accordance to the study of Jayaraman et al. [16] and Dervisoglu et al. [18] on Ba2In2O5(H2O). Therein, three signals are found but this would match our spectrum assuming an overlap of signals in our case as the shape of the signal at 2.3 ppm is asymmetric. The intensities differ, which can be understood by the lower water content in the herein-presented chromium-substituted sample. As we expect a highly dynamic system, it is plausible to have several signals close to each other, representing locally differing structures and causing the asymmetric profile of the signal at 2.3 ppm. NMR is sensitive to local structural changes or more precise changes in the chemical environment, while the used diffraction techniques represent a bulk technique, explaining why the hydrogen could not be localised there. The double quantum filtered experiment vanishes the signal at 7.8 ppm, indicating no direct proton–proton interaction, and thus isolated protons. This signal may be assigned to OH groups rather than H2O.
The remaining signal at 2.3 ppm on the other hand indicated a close contact of protons, which is more difficult to explain. Two OH groups closer to each other causing the interaction may be plausible. However, we assume it is more likely that the signal was due to H2O. Our TGA-MS experiment shows, at least at the first step of dehydration, a loss of water, being in accordance with [3]. At first glance the water release contradicts the diffraction measurements, as the oxygen content of the sample seems to be stable at about 5.3 for conditions of T < 1000 K. However, combining the stable oxygen content with the results of the NMR measurements, the presence of water inside the sample remains plausible. If a condensation reaction between two OH groups would form water that leaves the sample, a decreasing oxygen content should be found, hence requiring additional oxygen atoms, present in a highly disordered state and hardly detectable by PXRD or PND, to match the initial composition at room temperature.
Thus, we assume H2O molecules to be present in a disordered state because of the high dynamism of the system. Still, the presence of H2O molecules in the sample gives a plausible explanation to the herein-presented results and the much higher hydrogen content of all chromium-substituted samples (see [2]). However, it has to be pointed out that the so-far performed measurements do not allow to unambiguously distinguish between OH groups and H2O in Ba2In1.8Cr0.2O5.3(H2O)x.

5. Conclusion

During this work, the water release from Ba2In1.8Cr0.2O5.3(H2O)x was investigated using X-ray and neutron diffraction between 10 K and 1573 K. The hydrogen atoms in the structure could not be localised using diffraction of X-ray and neutron radiation. In addition, for the chromium-substituted sample, no indications for chromium ordering were found either. Solid-state NMR analysis shows the co-existence of protons being isolated as well as a direct proton–proton interaction. However, the clear difference in the water (hydrogen) content between Ba2In2O5(H2O)0.16 and Ba2In1.8Cr0.2O5.3(H2O)x could be easily tracked by the variation in the incoherent scattering contribution in the powder neutron diffraction experiments, coinciding with observations previously reported based on TGA and chemical analysis. Raman spectroscopic measurements paired with neutron diffraction in air show no significant signal change after neutron measurements at elevated temperatures up to 693 K. This is in accordance with a rapid uptake of large quantities of H2O from the surrounding atmosphere if Ba2In1.8Cr0.2O5.3 is cooled in ambient air. For Ba2In1.8Cr0.2O5.3(H2O)x, even at 10 K, already the tetragonal modification was found. In contrast, for Ba2In2O5 the orthorhombic polymorph is stable up to 1183 K. For the Ba-In-O brownmillerite system, a phase transition towards a cubic defect-perovskite-type phase is well-known. For the Cr-doped counterpart, this study revealed clear indications by in situ PXRD that a similar crystal structure change happened at 1123 K. Based on the observed colour change and the refined oxygen contents from PND, it seems possible that the tetragonal to cubic structure transition of Ba2In1.8Cr0.2O5.3(H2O)x is related to a reduction of Cr6+ into Cr3+. In accordance, a strong dependence of the transition on oxygen partial pressure and the exchange rate of the gas atmosphere was noticed during the different in situ experiments.

Supplementary Materials

The following are available online at https://www.mdpi.com/article/10.3390/cryst11121548/s1, Figure S1: ATR-FTIR spectra of Ba2In2O5(H2O)0.16 and Ba2In1.8Cr0.2O5.3(H2O)x, Figure S2: In situ powder X-ray diffraction data of Ba2In1.8Cr0.2O5.3(H2O)x (second Batch), and lattice parameters a, b and c and comparison of the unit cell volume of both powder batches, Figure S3: Top side of the Ba2In1.8Cr0.2O5.3(H2O)x sample after being heated in nitrogen flow at 1123 K, Figure S4: Thermal Analysis of Ba2In2O5(H2O)0.16 in argon, Figure S5: Thermal analysis of Ba2In1.8Cr0.2O5.3(H2O)x: TGA measurements in different atmospheres and TGA-DTA-MS measurement, Figure S6: Powder neutron diffraction data of Ba2In2O5(H2O)0.16 measured between 273 K and 10 K at D2B, Figure S7: Powder neutron diffraction data of Ba2In1.8Cr0.2O5.3(H2O)x measured between 273 K and 10 K at D2B, Table S1: Lattice parameters, cell volume, and c/a ratio comparison of Ba2In1.8Cr0.2O5 (I4cm) (first batch, XRD), Table S2: Lattice parameters, cell volume, and c/a ratio comparison of Ba2In1.8Cr0.2O5.26(7) (I4cm, PND E6), Table S3: Lattice parameters, cell volume, and c/a ratio comparison of Ba2In1.8Cr0.2O5 (I4cm, PND, D2B) between 10 K and 273 K, Table S4: Lattice parameters, cell volume, and c/a ratio comparison of Ba2In2O5 (Icmm, PND, D2B) between 10 K and 273 K, Table S5: Lattice parameters, cell volume, and c/a ratio comparison of Ba2In1.8Cr0.2O5.3 (I4cm, PND, D20) between 273 K and 1573 K, Table S6: Structural data of Ba2In1.8Cr0.2O5.26(7) (I4cm, PND, E6) at 873 K, Table S7: Structural data of Ba2In1.8Cr0.2O4.90(7) (I4cm, PND, D2B) at 293 K, Table S8: Structural data of Ba2In1.8Cr0.2O4.74(8) (I4cm, PND, D2B) at 10 K, Table S9: Structural data of BaIn0.92(2)Cr0.08(2)O2.5 (first batch, PXRD) at 1123 K.

Author Contributions

Conceptualization, R.F., M.W. and H.K.; methodology, R.F., M.W. and H.K; validation, R.F., M.W., M.B. and H.K.; formal analysis, R.F. and M.B.; investigation, R.F., S.S., T.C.H., D.W., M.B.; resources, A.W., H.K.; data curation, R.F. and M.B.; writing—original draft preparation, R.F.; writing—review and editing, R.F., M.W, H.K. and M.B.; visualization, R.F., M.B.; supervision, H.K. and M.W.; project administration, H.K. and A.W. funding acquisition, H.K. and A.W. All authors have read and agreed to the published version of the manuscript.

Funding

The German Federal Ministry of Education and Research is acknowledged for funding the NexPlas project (project number: 03SF0618B). This work was funded by the Deutsche Forschungsgemeinschaft (Grant INST 268/379/1 FUGG). We acknowledge the support by the Deutsche Forschungsgemeinschaft (DFG—German research foundation) and the Open Access Publication Fund of the Technical University of Darmstadt covering the APC.

Data Availability Statement

The DOI to the diffraction data and experiments are given in the caption of the corresponding figure. All data can be received from the corresponding authors.

Acknowledgments

We acknowledge the ILL for the provision of beam-time at the D2B and D20 diffractometers and the assistance by Jan Bernauer, Aasir Rashid, and Dipl.-Ing. Claudia Fasel (TU Darmstadt) during the collection of the FTIR spectra and thermogravimetric measurements.

Conflicts of Interest

The authors declare no conflict of interest.

References

  1. Yoon, S.; Nikoee, S.; Ranjbar, M.; Ziegenbalg, D.; Widenmeyer, M.; Weidenkaff, A. Strongly affected photocatalytic CO2 reduction by CO2 adsorbed to the surface of Ba2(In1.8Cr0.2)O5·(H2O)δ powders. Solid State Sci. 2020, 105, 106212. [Google Scholar] [CrossRef]
  2. Yoon, S.; Gaul, M.; Sharma, S.; Son, K.; Hagemann, H.; Ziegenbalg, D.; Schwingenschlogl, U.; Widenmeyer, M.; Weidenkaff, A. Photocatalytic CO2 reduction by Cr-substituted Ba2(In2-xCrx)O5·(H2O)δ(0.04 ≤ x ≤ 0.60). Solid State Sci. 2018, 78, 22–29. [Google Scholar] [CrossRef] [Green Version]
  3. Yoon, S.; Son, K.; Hagemann, H.; Widenmeyer, M.; Weidenkaff, A. Cr-substitution in Ba2In2O5·(H2O)x (x = 0.16, 0.74). Solid State Sci. 2017, 73, 1–6. [Google Scholar] [CrossRef]
  4. Widenmeyer, M.; Wiegers, K.-S.; Chen, G.; Yoon, S.; Feldhoff, A.; Weidenkaff, A. Engineering of oxygen pathways for better oxygen permeability in Cr-substituted Ba2In2O5 membranes. J. Membr. Sci. 2020, 595, 117558. [Google Scholar] [CrossRef]
  5. Zhang, G. Protonic conduction in Ba2In2O5. Solid State Ion. 1995, 82, 153–160. [Google Scholar] [CrossRef]
  6. Bielecki, J.; Parker, S.F.; Ekanayake, D.; Rahman, S.M.H.; Börjesson, L.; Karlsson, M. Short-range structure of the brownmillerite-type oxide Ba2In2O5 and its hydrated proton-conducting form BaInO3H. J. Mater. Chem. A 2014, 2, 16915–16924. [Google Scholar] [CrossRef]
  7. Perrichon, A.; Jiménez-Ruiz, M.; Mazzei, L.; Rahman, S.M.H.; Karlsson, M. Local structure and vibrational dynamics of proton conducting Ba2In2O5(H2O)x. J. Mater. Chem. A 2019, 7, 17626–17636. [Google Scholar] [CrossRef] [Green Version]
  8. Mazzei, L.; Piccinelli, F.; Bettinelli, M.; Parker, S.F.; Karlsson, M. The effect of cation substitution on the local coordination of protons in Ba2In1.85M0.15O6H2 (M = In, Ga, Sc and Y). Solid State Ion. 2021, 365, 115624. [Google Scholar] [CrossRef]
  9. Tyagi, D.; Shirsat, A.N.; Saha, B.; Varma, S. Phase stabilisation, chemical behaviour and protonic conductivity of vanadium doped Barium Indate for ITSOFC application. J. Alloys Compd. 2021, 877, 160298. [Google Scholar] [CrossRef]
  10. Bielecki, J.; Parker, S.F.; Mazzei, L.; Börjesson, L.; Karlsson, M. Structure and dehydration mechanism of the proton conducting oxide Ba2In2O5(H2O)x. J. Mater. Chem. A 2016, 4, 1224–1232. [Google Scholar] [CrossRef] [Green Version]
  11. Schober, T.; Friedrich, J.; Krug, F. Phase transition in the oxygen and proton conductor Ba2In2O5 in humid atmospheres below 300 °C. Solid State Ion. 1997, 99, 9–13. [Google Scholar] [CrossRef]
  12. Goodenough, J.; Manthiram, A.; Paranthaman, P.; Zhen, Y. Fast oxide-ion conduction in intergrowth structures. Solid State Ion. 1992, 52, 105–109. [Google Scholar] [CrossRef]
  13. Hashimoto, T.; Ueda, Y.; Yoshinaga, M.; Komazaki, K.; Asaoka, K.; Wang, S. Observation of Two Kinds of Structural Phase Transitions in the Ba2In2O5 System. J. Electrochem. Soc. 2002, 149, A1381. [Google Scholar] [CrossRef]
  14. Speakman, S. In-situ diffraction study of Ba2In2O5. Solid State Ion. 2002, 149, 247–259. [Google Scholar] [CrossRef]
  15. Lei, H.; Zhou, Y.; Jiang, P.; Wang, W.; Cao, W.; Xue, Y. Synthesis and optical properties of Cr-doped Ba2In2O5 orange-brown oxides. Ceram. Int. 2018, 44, 19751–19755. [Google Scholar] [CrossRef]
  16. Jayaraman, V.; Magrez, A.; Caldes, M.; Joubert, O.; Taulelle, F.; Rodriguez-Carvajal, J.; Piffard, Y.; Brohan, L. Characterization of perovskite systems derived from Ba2In2O5 Part II: The proton compounds Ba2In2(1−x)Ti2xO4+2x(OH)y [0 ≤ x ≤ 1; y ≤ 2(1 − x)]. Solid State Ion. 2004, 170, 25–32. [Google Scholar] [CrossRef]
  17. Martinez, J.-R.; Mohn, C.E.; Stølen, S.; Allan, N.L. Ba2In2O4(OH)2: Proton sites, disorder and vibrational properties. J. Solid State Chem. 2007, 180, 3388–3392. [Google Scholar] [CrossRef]
  18. Dervişoğlu, R.; Middlemiss, D.S.; Blanc, F.; Lee, Y.-L.; Morgan, D.; Grey, C.P. Joint Experimental and Computational 17O and 1H Solid State NMR Study of Ba2In2O4(OH)2 Structure and Dynamics. Chem. Mater. 2015, 27, 3861–3873. [Google Scholar] [CrossRef] [PubMed] [Green Version]
  19. Widenmeyer, M.; Hansen, T.C.; Meissner, E.; Niewa, R. Formation and Decomposition of Iron Nitrides Observed by in situ Powder Neutron Diffraction and Thermal Analysis. Z. Anorg. Allg. Chem. 2014, 640, 1265–1274. [Google Scholar] [CrossRef]
  20. Widenmeyer, M.; Hansen, T.C.; Leineweber, A.; Weidenkaff, A.; Niewa, R. Nitrogen Transfer between Solid Phases in the System Mn-N Detected via in situ Neutron Diffraction. Z. Anorg. Allg. Chem. 2017, 643, 1929–1938. [Google Scholar] [CrossRef] [Green Version]
  21. Shannon, R.D. Revised effective ionic radii and systematic studies of interatomic distances in halides and chalcogenides. Acta Cryst. A 1976, 32, 751–767. [Google Scholar] [CrossRef]
  22. Buchsteiner, A.; Stüßer, N. Optimizations in angular dispersive neutron powder diffraction using divergent beam geometries. Nucl. Instrum. Methods Phys. Res. Sect. A 2009, 598, 534–541. [Google Scholar] [CrossRef]
  23. Hansen, T.C.; Henry, P.F.; Fischer, H.E.; Torregrossa, J.; Convert, P. The D20 instrument at the ILL: A versatile high-intensity two-axis neutron diffractometer. Meas. Sci. Technol. 2008, 19, 34001. [Google Scholar] [CrossRef]
  24. Finger, R.; Hansen, T.C.; Kohlmann, H. Validation of a Sapphire Gas-Pressure Cell for Real-Time In Situ Neutron Diffraction Studies of Hydrogenation Reactions. Quantum Beam Sci. 2021, 5, 22. [Google Scholar] [CrossRef]
  25. Widenmeyer, M.; Niewa, R.; Hansen, T.C.; Kohlmann, H. In situ Neutron Diffraction as a Probe on Formation and Decomposition of Nitrides and Hydrides: A Case Study. Z. Anorg. Allg. Chem. 2013, 639, 285–295. [Google Scholar] [CrossRef]
  26. Robin Bendall, M.; Gordon, R.E. Depth and refocusing pulses designed for multipulse NMR with surface coils. J. Magn. Reson. (1969) 1983, 53, 365–385. [Google Scholar] [CrossRef]
  27. Feike, M.; Demco, D.E.; Graf, R.; Gottwald, J.; Hafner, S.; Spiess, H.W. Broadband Multiple-Quantum NMR Spectroscopy. J. Magn. Reson. Ser. A 1996, 122, 214–221. [Google Scholar] [CrossRef]
  28. Rodríguez-Carvajal, J. Recent advances in magnetic structure determination by neutron powder diffraction. Phys. B Condens. Matter 1993, 192, 55–69. [Google Scholar] [CrossRef]
  29. Massiot, D.; Fayon, F.; Capron, M.; King, I.; Le Calvé, S.; Alonso, B.; Durand, J.-O.; Bujoli, B.; Gan, Z.; Hoatson, G. Modelling one- and two-dimensional solid-state NMR spectra. Magn. Reson. Chem. 2002, 40, 70–76. [Google Scholar] [CrossRef]
  30. Boyd, S.; Wright, I.P.; Pillinger, C.T. Stepped-heating of carbonates and carbon-bearing quartz grains. Chem. Geol. 1997, 134, 303–310. [Google Scholar] [CrossRef]
  31. Sears, V.F. Neutron scattering lengths and cross sections. Neutron News 1992, 3, 26–37. [Google Scholar] [CrossRef]
  32. Pasierb, P.; Komornicki, S.; Rokita, M.; Rekas, M. Structural properties of Li2CO3–BaCO3 system derived from IR and Raman spectroscopy. J. Mol. Struct. 2001, 596, 151–156. [Google Scholar] [CrossRef]
  33. Zaki, M.I.; Fahim, R.B. Thermal decomposition and creation of reactive solid surfaces. J. Therm. Anal. Calorim. 1986, 31, 825–834. [Google Scholar] [CrossRef]
  34. Jóźwiak, W.K.; Ignaczak, W.; Dominiak, D.; Maniecki, T.P. Thermal stability of bulk and silica supported chromium trioxide. Appl. Catal. A Gen. 2004, 258, 33–45. [Google Scholar] [CrossRef]
  35. Liu, B.; Fang, Y.; Terano, M. High resolution X-ray photoelectron spectroscopic analysis of transformation of surface chromium species on Phillips CrOx/SiO2 catalysts isothermally calcined at various temperatures. J. Mol. Catal. A Chem. 2004, 219, 165–173. [Google Scholar] [CrossRef]
  36. Holleman, A.F.; Wiberg, E. Lehrbuch der Anorganischen Chemie, 101st ed.; Walter de Gruyter: Berlin, Germany, 1995. [Google Scholar]
  37. Hewston, T.A.; Chamberland, B.L. Magnetic and structural studies of Cr2O5 and Cr3O8. J. Magn. Magn. Mater. 1984, 43, 89–95. [Google Scholar] [CrossRef]
  38. Chamberland, B.L. The chemical and physical properties of CrO2 and tetravalent chromium oxide derivatives. Crit. Rev. Solid State Mater. Sci. 1977, 7, 1–31. [Google Scholar] [CrossRef]
Figure 1. In situ X-ray diffraction patterns of Ba2In1.8Cr0.2O5.3(H2O)x (first batch) while heating under nitrogen flow of 20 sccm (p = 0.15 MPa, p(O2) < 5 ppm, p(H2O) < 5 ppm) in an XRK reaction chamber; for clarity reasons only 27° ≤ 2θ ≤ 90° is shown.
Crystals 11 01548 g001
Figure 2. Bottom side of the Ba2In1.8Cr0.2O5.3(H2O)x sample after being heated in nitrogen flow (p = 0.15 MPa, p(O2) < 5 ppm, p(H2O) < 5 ppm) at 1123 K.
Crystals 11 01548 g002
Figure 3. Powder neutron diffraction data of Ba2In1.8Cr0.2O5.3(H2O)x at 315(1) K and 873(2) K with 2 h data collection time each and without offset, contribution of the Nb-heating element of the furnace marked with *, E692925 and E692936–E692937. The furnace was operated in dynamic vacuum (pmin ≥ 1 × 10⁻³ mbar).
Crystals 11 01548 g003
Figure 4. Lattice parameters a, b, and c of Ba2In1.8Cr0.2O5.3(H2O)x determined by Rietveld refinements based on neutron diffraction data; filled points represent the first measurement, and open points the second measurement at the target temperature, ±σ within dot size. The measurements were taken in dynamic vacuum (pmin ≥ 1 × 10⁻³ mbar).
Crystals 11 01548 g004
Figure 5. Rietveld refinements of the crystal structure of Ba2In1.8Cr0.2O5.26(7) at 873(2) K; the excluded region due to contribution of the Nb-heating element of the furnace, is marked with *, Rp = 2.56%; Rwp = 3.43%; E692936–E692937. The furnace was operated in dynamic vacuum (pmin ≥ 1 × 10⁻³ mbar).
Crystals 11 01548 g005
Figure 6. 1H MAS NMR spectrum of Ba2In1.8Cr0.2O5.3(H2O)x at a spinning frequency of 10 kHz (top). The bottom spectrum is the result of the double-quantum filter. Spinning sidebands are marked by an asterisk in the top spectrum.
Crystals 11 01548 g006
Figure 7. Comparison of the collected normalised high-resolution neutron diffraction data of Ba2In2O5(H2O)0.16 and Ba2In1.8Cr0.2O5.3(H2O)x at room temperature, Numor 556649–556658 and 556720–556729, DOI: doi.org/10.5291/ILL-DATA.5-24-640.
Crystals 11 01548 g007
Figure 8. In situ powder neutron diffraction of Ba2In1.8Cr0.2O5.3(H2O)x in a dynamic vacuum (pmin ≥ 1.2 × 10⁻⁵ mbar). (a) temperature profile and diffraction data as a false colour plot; (b) comparison of the collected neutron diffraction data, number of run (Numor) 184142, 184244–184259, 184481–184496, 184604–184619, DOI: doi.org/10.5291/ILL-DATA.5-24-640.
Crystals 11 01548 g008
Figure 9. Raman spectra in between neutron measurements after cooling from the mentioned temperatures to room temperature at E6; the black marker show the peak positions of Ba2In1.8Cr0.2O5.3(H2O)x according to Yoon et al. [3]. The heating and cooling were carried out in ambient air.
Crystals 11 01548 g009
Figure 10. (a) Lattice parameters a, b, and c of Ba2In1.8Cr0.2O5.3(H2O)x (batch 1) while heating under nitrogen flow of 20 sccm (p = 0.15 MPa, p(O2) < 5 ppm, p(H2O) < 5 ppm) in an XRK reaction chamber mounted on a SmartLab X-ray diffractometer; (b) cell volume and lattice parameter c (batch 1) while heating under nitrogen flow of 20 sccm (p = 0.15 MPa, p(O2) < 5 ppm, p(H2O) < 5 ppm) in an XRK reaction chamber mounted on a SmartLab X-ray diffractometer; the lattice parameters and cell volume determined by Rietveld refinements, ±σ within dot size.
Crystals 11 01548 g010
Figure 11. Comparison of the X-ray diffraction data of the first batch of Ba2In1.8Cr0.2O5.3(H2O)x at low angles. Superstructure reflection at about 2θ = 10.5°. The measurement was carried out in a flow of 20 sccm N2 (p = 0.15 MPa, p(O2) < 5 ppm, p(H2O) < 5 ppm).
Crystals 11 01548 g011
Figure 12. Comparison of the Rietveld refinements of the crystal structure of (a) Ba2In1.8Cr0.2O5 (I4cm) and (b) BaIn0.9Cr0.1O2.5 (Pm 3 ¯ m) at 1123 K while heating under nitrogen flow of 20 sccm (p = 0.15 MPa, p(O2) < 5 ppm, p(H2O) < 5 ppm) in an XRK reaction chamber at 30° ≤ 2θ ≤ 60°.
Crystals 11 01548 g012
Figure 13. Refinements of the crystal structure of Ba2In1.8Cr0.2O5 under 0.15 MPa nitrogen pressure (first batch) with a flow rate of 20 sccm (p = 0.15 MPa, p(O2) < 5 ppm, p(H2O) < 5 ppm): (a) at 293 K, I4cm, a = 5.9949(2) Å, c = 16.946(1) Å, Rp = 4.18%, Rwp = 5.18%; (b) at 1123 K, Pm 3 ¯ m, a = 4.25874(4) Å, Rp = 4.15%, Rwp = 5.28%; excluded region due to Cu-Kβ contribution is marked with *.
Crystals 11 01548 g013
Figure 14. Raman spectra of Ba2In1.8Cr0.2O5.3(H2O)x: Sample mounted at E6, HZB, Berlin (top); sample investigated in Figure 10 one year after heat treatment in flowing N2 (p = 0.15 MPa, p(O2) < 5 ppm, p(H2O) < 5 ppm, bottom). Ba2In1.8Cr0.2O5.3(H2O)x reference data from [3], BaCO3 reference data from [32], and unassigned peaks marked with “?”.
Crystals 11 01548 g014
Figure 15. (a) Rietveld refinements of the crystal structure of Ba2In2O4.88(4) (Icmm, a = 6.0781(3) Å, b = 16.7335(8) Å, c = 5.9493(3) Å) at 10 K, Rp = 3.31%, Rwp = 4.30%; summarised data of Numor 556399–556708. (b) Rietveld refinements of the crystal structure of Ba2In1.8Cr0.2O4.74(9) I4cm, a = 5.9823(2) Å, c = 16.946(1) Å, Rp = 2.18%, Rwp = 2.95%) at 10 K; excluded regions due to cryofurnace contribution, unassigned reflections are marked with *. Summarised data of Numor 556770–556779, DOI: doi.org/10.5291/ILL-DATA.5-24-640.
Crystals 11 01548 g015
Table 1. Measurement parameters used for thermal analysis.
Measurement ProgramHeating Rate (K·min−1)Tmax (K)Cooling Rate (K·min−1)Gas Type and Flow Rate
11014731060 sccm Ar
210147360 sccm Ar
31014731060 sccm Air
4101473160 sccm Air
521473260 sccm N2
Table 2. Summary of the obtained weight changes during TGA measurements with different conditions.
T(K)Measurement ProgramΔm(Ba2In2O5(H2O)0.16)Δm(Ba2In1.8Cr0.2O5.3(H2O)x)
8001; Ar, 10 K·min−1−0.60% *−0.61% [3]−2.18% *−2.19% [3]
14731; Ar, 10 K·min−1−0.82% *−1.02% [3]−2.82% *−2.81% [3]
8002; Ar, 10 K·min−1N/AN/A−2.28% *−2.19% [3]
14732; Ar, 10 K·min−1N/AN/A−2.95% *−2.81% [3]
8003; Air, 10 K·min−1N/AN/A−2.23% *N/A
14733; Air, 10 K·min−1N/AN/A−2.94% *N/A
800 #3; Air, 10 K·min−1N/AN/A+0.18% *N/A
8004; Air, 10 K·min−1N/AN/A−2.20% *N/A
14734; Air, 10 K·min−1N/AN/A−2.90% *N/A
800 #4; Air, 1 K·min−1N/AN/A+0.16% *N/A
8005; N2, 2 K·min−1N/AN/A−2.24% *N/A
14735; N2, 2 K·min−1N/AN/A−2.90% *N/A
* This work; # during cooling from 1473 K.
Table 3. Refined oxygen contents during the heating of Ba2In1.8Cr0.2O5.3(H2O)x in a dynamic vacuum (pmin ≥ 1.2×10⁻⁵ mbar) from room temperature to 1573 K at D20, ILL, Grenoble.
Temperature/KOxygen Content
2935.32(4)
5735.36(4)
11735.26(4)
15735.08(6)
Publisher’s Note: MDPI stays neutral with regard to jurisdictional claims in published maps and institutional affiliations.

