Article

Picomolar-Level Melamine Detection via ATP Regulated CeO2 Nanorods Tunable Peroxidase-Like Nanozyme-Activity-Based Colorimetric Sensor: Logic Gate Implementation and Real Sample Analysis

1
Centre for Interdisciplinary Research in Basic Sciences, Jamia Millia Islamia, New Delhi P.O. Box 110025, India
2
Department of Applied Medical Science, Community College, King Saud University, Riyadh 11437, Saudi Arabia
3
Biomedical Engineering Department, Faculty of Engineering, Helwan University, Helwan P.O. Box 11792, Egypt
4
Chemical Engineering Department, College of Engineering, King Saud University, Riyadh 11437, Saudi Arabia
5
Dental Health Department, College of Applied Medical Sciences, King Saud University, P.O. Box 10219, Riyadh 11433, Saudi Arabia
*
Authors to whom correspondence should be addressed.
Crystals 2021, 11(2), 178; https://doi.org/10.3390/cryst11020178
Submission received: 4 January 2021 / Revised: 28 January 2021 / Accepted: 8 February 2021 / Published: 11 February 2021
(This article belongs to the Special Issue Functional Nanomaterials for Advanced Applications)

Abstract

:
The capability of functional logic operations is highly intriguing, but far from being realized owing to limited recognition element (RE) and complex readout signals, which limit their applications. In this contribution, for a visual colorimetric sensor for melamine (MEL) we described the construction of two- and three-input AND logic gate by exploiting the intrinsic peroxidase (POD)-like activity of CeO2 nanorods (NRs) (~23.04% Ce3+ fraction and aspect ratio (RTEM) of 3.85 ± 0.18) as RE at acidic pH (4.5). Further ATP piloted catalytic tuning of POD-like activity in CeO2 NRs employed for a functional logic gate-controlled MEL sensing at neutral pH (7.4). AND logic circuit operated MEL sensing record colorimetric response time of 15 min to produce blue color proportionate to MEL concentration. The fabricated nanozyme (CeO2)-based logic gate sensor probe for MEL at pH 4.5 showed a linear response from 0.004 nM to 1.56 nM with a limit of detection (LOD) of 4 pM; while translation from acidic to neutral pH (at 7.4) sensor exhibited linear response ranging from 0.2 nM to 3.12 nM with a LOD value of 17 pM. Through CeO2 POD-like nanozyme behavior under acidic and neutral pH, the fabricated logic gate sensor showed high affinity for MEL, generating prominent visual output with picomolar sensitivity, good reproducibility, and stability with relative standard deviation (RSD) <1% and 2%, respectively. A feasibility study in real samples (raw milk and milk powder) showed good recoveries with negligible matrix effect, an anti-interference experiment revealed sensor selectivity, highlighting robust sensor practical utility. With the merits of high sensitivity, specificity, low cost, and simplified sample processing, the developed logic-controlled colorimetric MEL sensing platform with appropriate modifications can be recognized as a potent methodology for on-site analysis of various food adulterants and related applications.

Graphical Abstract

1. Introduction

The synergy within the mounting field of nanotechnology and material science is revealing innovative feats toward the design and fabrication of nanomaterials exhibiting enzyme-like activity (known as nanozymes) [1]. The accidental discovery of magnetic Fe3O4 nanoparticles (NPs) possessing peroxidase (POD)-like activity reported by Gao et al. [2], thereafter opened doors for a variety of nanomaterials, including noble metals [3], metal oxides [2,4] and carbon-based nanomaterials [5], which have been found mimicking natural horseradish peroxidase (HRP) enzyme for catalysis. By proficiently imitating the catalytic sites of natural enzymes or harboring multi-valent elements for catalytic reactions nanozymes have effectively served as “direct surrogates of traditional enzymes,” offering the unflinching biocatalytic potential for imaging, sensing, and theranostics applications [1].
In the recent literature enzymatic reactions have been widely explored in the food sector and play an indispensable role to combat the increasing food safety issues [6]. Nevertheless, enzymes demonstrate high substrate specificity and catalytic activity but present certain drawbacks, such as low operation stability, vulnerability under harsh environmental conditions, complicated recovery and recycling procedures, high cost of synthesis and purification, which greatly curtail their practical applications [7]. As a result of such obstacles causing the ineffectiveness of practical application, “nanozymes” have emerged as a promising candidate for artificial enzymes, owing to small size, high surface-to-volume ratio, increased reactivity, enhanced stabilities, and tunable catalytic activities that have garnered ever-growing research attention. Among a large community of artificial nanozymes, nanostructured CeO2 offers a potential foundation for practical implementation in the agri-food industry, predominantly as an optical sensor for antioxidants [8], mycotoxins [9], organophosphate pesticides [10], and food adulterants [11,12]. To date, there have been very limited reviews that have discussed nanozymes’ primarily POD-like activity-based catalytic potential concentrating on food safety and quality parameters [13,14].
Food “safety and quality” monitoring is of major public health importance because the growing incidences of food poisoning pose a cumulative threat worldwide, such as the outbreaks of melamine (MEL) contamination of milk and dairy products in China (2008) [15]. MEL a triazine heterocyclic organic compound, is being utilized in the manufacture of fertilizer, flame retardant paint, plywood, plastics, adhesives, and cement [16]. With high nitrogen content (66% by mass) MEL has been illegally added to infant formula, human and animal foods to elevate the apparent protein content, which directly or indirectly affects the food quality consumed worldwide. This fraudulent practice of MEL adulteration of different milk products attracted the attention of many organizations and researchers globally. Incidents of illness and the death of hundreds of pets were reported due to MEL-contaminated pet food [17]. The high concentration of MEL in Chinese infant formula causes the illness of >51,900 infants and young children, who were hospitalized due to urinary problems, resulting in six deaths [18]. Although MEL is a low-toxicity material, co-exposure of MEL with cyanuric acid forms an insoluble MEL–cyanurate complex, resulting in kidney stones that may cause renal failure, bladder carcinoma, and even death [19]. This calls for an innovative, cost-effective, and reformative analytical methodology able to deliver real-time measurement of crude foodstuffs at the source with high sensitivity, specificity, and reproducible output.
Prevailing conventional methods, including gas chromatography/mass spectrometry (GC/MS) [18], liquid chromatography−mass spectrometry (LC-MS) [20], enzyme-linked immunosorbent assay (ELISA) [21], and surface-enhanced Raman scattering (SERS) [22], are sensitive and selective but make use of cumbersome laboratory equipment with a high operating cost and need skilled operators and time-consuming pre-concentration procedures, reflecting their inaptness, thus creating a developmental bottleneck toward on-site applicability. Alternatively, colorimetric sensing offers low cost, easy fabrication, portability, and concentration-dependent real-time naked eye recognition, which makes it attractive for on-site analysis, Table S1.
Advancing nanostructured-based sensing has routed interest toward real-time point-of-care (POC) sensing devices, while efforts in emulating the Boolean functions on the molecular scale [23], which are capable of performing logic gate operations to produce an output signal in the form of optical, electrical responses, have opened the possibility of design and realization of “stimuli-responsive nanoscale sensing devices” [24]. A variety of metal, metal oxide NPs, and metal ions [12,25,26,27] have already been reported as colorimetric sensors for MEL. Though some hold high accuracy and sensitivity, it is vital to develop a simplified operational and highly sensitive platform to meet the established safety limits [28,29]. To address the limitation or challenges (Table S1), our method needs no complicated operations or probe modification, making it a simple, feasible visual-based detection for MEL,. Herein we report on the realization of a two- and three-input AND logic gate colorimetric sensor for MEL based on the catalytic tunability offered by CeO2 nanorods (NRs), which remarkably executed POD-like nanozyme activity at pH 4.5 when used as a recognition element (RE). Further, we take advantage of ATP as a catalytic modulator of CeO2 NRs to regulate the POD-like colorimetric reaction at pH 7.4, as detailed in our previous publication [30], which was employed in the fabrication of catalytic logic gate-based colorimetric sensing of MEL at pH 7.4. The successful application of the developed sensor for detection of MEL in real samples (such as raw milk and infant formula) evidences a meaningful achievement, paving the way for innovation in a nanozyme-based logic-gated sensing platform for improving food quality and safety assessment.

2. Materials and Methods

2.1. Chemicals and Reagents

Cerous chloride heptahydrate (CeCl3·7H2O, purity 98.5%) and hydrogen peroxide (H2O2, purity 99%), MEL (2,4,6-triamino-1,3,5-triazine, C3H6N6), Trichloroacetic acid (CCl3·COOH, purity 99%), L-Histidine (C6H9N3O2, purity 99%), L-Ascorbic Acid (C6H8O6, purity 99.5%), Dextrose monohydrate (C6H12O6·H2O), Sucrose (C12H22O11), and adenosine analogs (ATP-Adenosine 5′-triphosphate disodium salt; ADP-Adenosine 5′-diphosphate disodium salt; AMP-Adenosine 5′-monophosphate disodium salt) were purchased from Loba chemicals (India, www.lobachemie.com (accessed on 4 January 2021)). 3,3′,5,5′-Tetramethylbenzidine (TMB) (C16H20N2) was purchased from Hi-Media Laboratories (India, http://www.himedialabs.com (accessed on 4 January 2021)). D-(+)-Glucose (C6H12O6) was procured from Sigma Aldrich (India, https://www.sigmaaldrich.com (accessed on 4 January 2021)). n-Butanol (CH3(CH2)3OH, purity 99%) was obtained from Qualikems Fine Chem Pvt. Ltd (India, https://qualikems.com (accessed on 4 January 2021)). Citrate buffer (0.1 M, pH 4.5) and 1× phosphate buffer saline (PBS) (pH 7.4) were prepared in the lab. Chemical reagents were of analytical grade and used without further purification. Glassware was washed with chromic acid prior to use. Ultrapure Milli Q water (resistivity: 18 MΩ cm−1) was used throughout the experiment. Cow milk and infant formula were obtained from the local supermarket.

2.2. Preparation of CeO2 Nanozyme

Following the protocol reported earlier [30], in a bottom-up approach CeO2 NRs were prepared by ammonia-induced co-precipitation method. Having demonstrated previously the POD-like nanozyme activity of CeO2 NRs under acidic and neutral pH [30], they were used in the present study as a RE in the fabrication of a logic gate-based colorimetric sensor for MEL at pH 4.5 and 7.4.

2.3. Instrumentation and Characterization

A high-resolution transmission electron microscopy (TEM) image of the synthesized CeO2 nanozyme was obtained using Thermo Scientific high-resolution Cryo-TEM (Talos). The captured TEM image was analyzed using ImageJ for morphological details [31]. Rietveld refinement study of X-ray diffraction for CeO2 nanozyme was performed using Material Analysis Using Diffraction (MAUD) software (version 2.94) and crystallographic structure is drawn via Visualization for Electronic and Structural Analysis (VESTA) software [32,33]. UV-Visible absorption spectra of CeO2 NRs POD-like activity were viewed and colorimetric detection (at pH 4.5 and 7.4) of MEL was performed in a quartz cuvette (1 cm path length) using a U3900 spectrophotometer (Hitachi). Colorimetric detection of MEL was visually captured from a 12-megapixel camera.

2.4. Preparation of Buffer

As a prerequisite for reliable determination, unless otherwise specified, all the experiments in acidic conditions (pH 4.5) were conducted in 0.1 M citrate buffer and 1X PBS at physiological conditions (pH 7.4).

2.5. POD-like Activity and Kinetic Measurement of CeO2 NRs

Following our previous work demonstrating CeO2 NRs having low Ce3+ concentration (~23.04%) and possessing POD-like activity at pH 4.5 and 7.4 [30], we examined the effect of MEL on the kinetics of CeO2 nanozyme catalyzed H2O2-mediated TMB oxidation reactions. Subsequently, kinetic parameters were calculated at a fixed concentration of TMB (0.3 mM) with varying concentrations of H2O2 (1, 1.5, 2, 2.5, 3, 3.5, 4 and 5 mM) for CeO2 NRs + MEL and CeO2 NRs + ATP + MEL at pH 4.5 and 7.4, respectively.

2.6. Construction of CeO2 NRs POD-like Nanozyme-Based Logic Operation

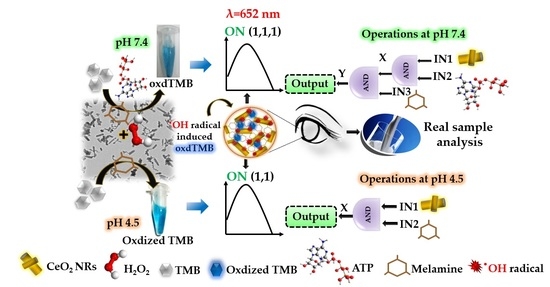
We attempted to construct an AND logic gate-configured cascade reaction with two and three input elements under acidic and neutral pH, respectively, thus realizing colorimetric detection of MEL. The absorption intensity of oxidized TMB was monitored at 652 nm and was defined as the output signal with a distinct color change and plotted against the input combinations. The output signal to logic value ‘1’ was optimized experimentally to give an output signal greater than the threshold value. The inclusion conditions for input/output signals are defined in the electronic supplementary sheet (ESS) 1.1.
AND logic operation for sensing MEL at pH 4.5 with two inputs including CeO2 NRs (IN1) and MEL (IN2) was applied to the gate machinery in four possible arrangements (0,0; 0,1; 1,0; 1,1). Citrate buffer was initially added to four vials, then a combination of inputs was executed: (a) with only TMB + H2O2 in the absence of both the inputs (0,0); (b) addition of IN2 to form (0,1) state; (c) input of IN1 forms (1,0) and (d) input state (1,1) in the presence of both IN1 and IN2.
For sensing MEL at pH 7.4, by analogy we expanded this scheme into a three-input concatenated AND logic operation. To perform the logic function, in eight vials containing PBS we added the three inputs: CeO2 NRs (IN1), ATP (IN2) and MEL (IN3), respectively, in eight possible combinations, such as (a) absence of any input (0,0,0) (with only TMB + H2O2); (b) IN3 (0,0,1); (c) IN1 (1,0,0); (d) IN1 + IN3 (1,0,1); (e) IN1 + IN2 (1,1,0); (f) IN2 + IN3 (0,1,1); (g); IN2 (0,1,0) and (h) IN1 + IN2 + IN3 (1,1,1). Both the logic gates operated at optimum experimental conditions (0.3 mM TMB; 3.5 mM H2O2; 0.2 mM CeO2 NRs; 1.5 mM ATP and 100 nM MEL) at 37 °C for 15 min.
To further distinguish the false-positive signals described in ESS 1.3 with the stimulus of different inputs (interfering species), we tested the specificity and selectivity for MEL by the fabricated CeO2 POD-like nanozyme-based two and three AND input logic gate colorimetric sensors, at acidic and neutral pH, respectively.

2.7. Experimental Procedure for Visual Colorimetric Detection of MEL

Based on the observed robust POD-like nanozyme activity of CeO2 NRs at room temperature [30], we implemented the AND logic gate operations for the visual colorimetric detection of MEL in acidic (pH 4.5) and neutral (pH 7.4) conditions.
Typically, a stock solution of MEL (2 µM) in DI water is used to prepare different concentrations of MEL (0, 0.004 nM, 0.2 nM, 0.4 nM, 0.8 nM, 1.56 nM, 3.12 nM, 6.25 nM, 12.5 nM, 25 nM, 50 nM, 100 nM and 200 nM). In a total reaction volume of 1 mL the optimal experimental conditions were: 20 µL of different concentrations of MEL, 180 µL of 0.2 mM CeO2 NRs, 400 µL of 100 mM citrate buffer (pH 4.5), 200 µL of 0.3 mM TMB. Immediately after this, 200 µL of 3.5 mM of H2O2 was added. Finally, the mixed solution was incubated for 15 min at room temperature; then observed for the color change and spectral measurement was recorded in a quartz cuvette. Absorbance at 652 nm was used for quantitative analysis. Reaction conditions for MEL detection at pH 7.4 involved 20 µL of different concentrations of MEL (0, 0.2 nM, 0.4 nM, 0.8 nM, 1.56 nM, 3.12 nM, 6.25 nM, 12.5 nM, 25 nM, 50 nM, 100 nM and 200 nM), CeO2 NRs (180 µL, 0.2 mM) + ATP (200 µL; 1.5 mM) + TMB (200 µL, 0.3 mM) + citrate buffer replaced with PBS (200 µL of 1X; pH 7.4) and H2O2 (200 µL, 3.5 mM).

2.8. Feasibility Study in Real Samples

To validate the reliability of the present method, real sample analysis was inspected in MEL-challenged raw milk and infant milk powder samples, the detailed protocol is given in the supplementary section (ESS 1.4).

3. Results and Discussion

3.1. Characterization of CeO2 Nanozyme

We utilized cerium chloride as precursor salt by employing the precipitant into precursor salt (PIS) approach to the CeO2 nanozyme prepared at high pH ~10.5 (general procedure schematically illustrated in Figure 1a). As can be seen in Figure 1b the highlighted section of the high-resolution TEM image shows the appearance of spherical particles along the length of the rod, indicating that the growth of CeO2 nanorods possibly happened during the Ostwald ripening process by consuming small spherical particles as “building blocks” [34]. Captured TEM image analyzed for ~50 NRs using ImageJ revealed an aspect ratio (R = length to diameter ratio) of 3.85 ± 0.18, as shown in Figure 1b as inset. Rietveld refined structural fit using MAUD software is shown in Figure 1c, affirming the fluorite cubic structure of CeO2 of space group Fm3m. Table S2 presents the structural refinement results. We achieved a good agreement between the experimental and calculated patterns, indicated by the red and black lines in Figure 1c, respectively. Reliability parameters (χ2 and Rwp%) given in Table S2 show low values, indicating good quality of structural refinement, and agree with Lutterotti criteria [32]. The electronic structural analysis program VESTA was used for the crystal structure representation of CeO2 in Figure 1c as inset. The prepared CeO2 nanorods possessed both the POD-like nanozyme activity reported earlier at acidic and neutral pH [30] and nanoscale properties employed as the RE in the AND logic gate colorimetric sensing of MEL at pH 4.5 and 7.4.

3.2. AND Logic Operation for MEL Sensing

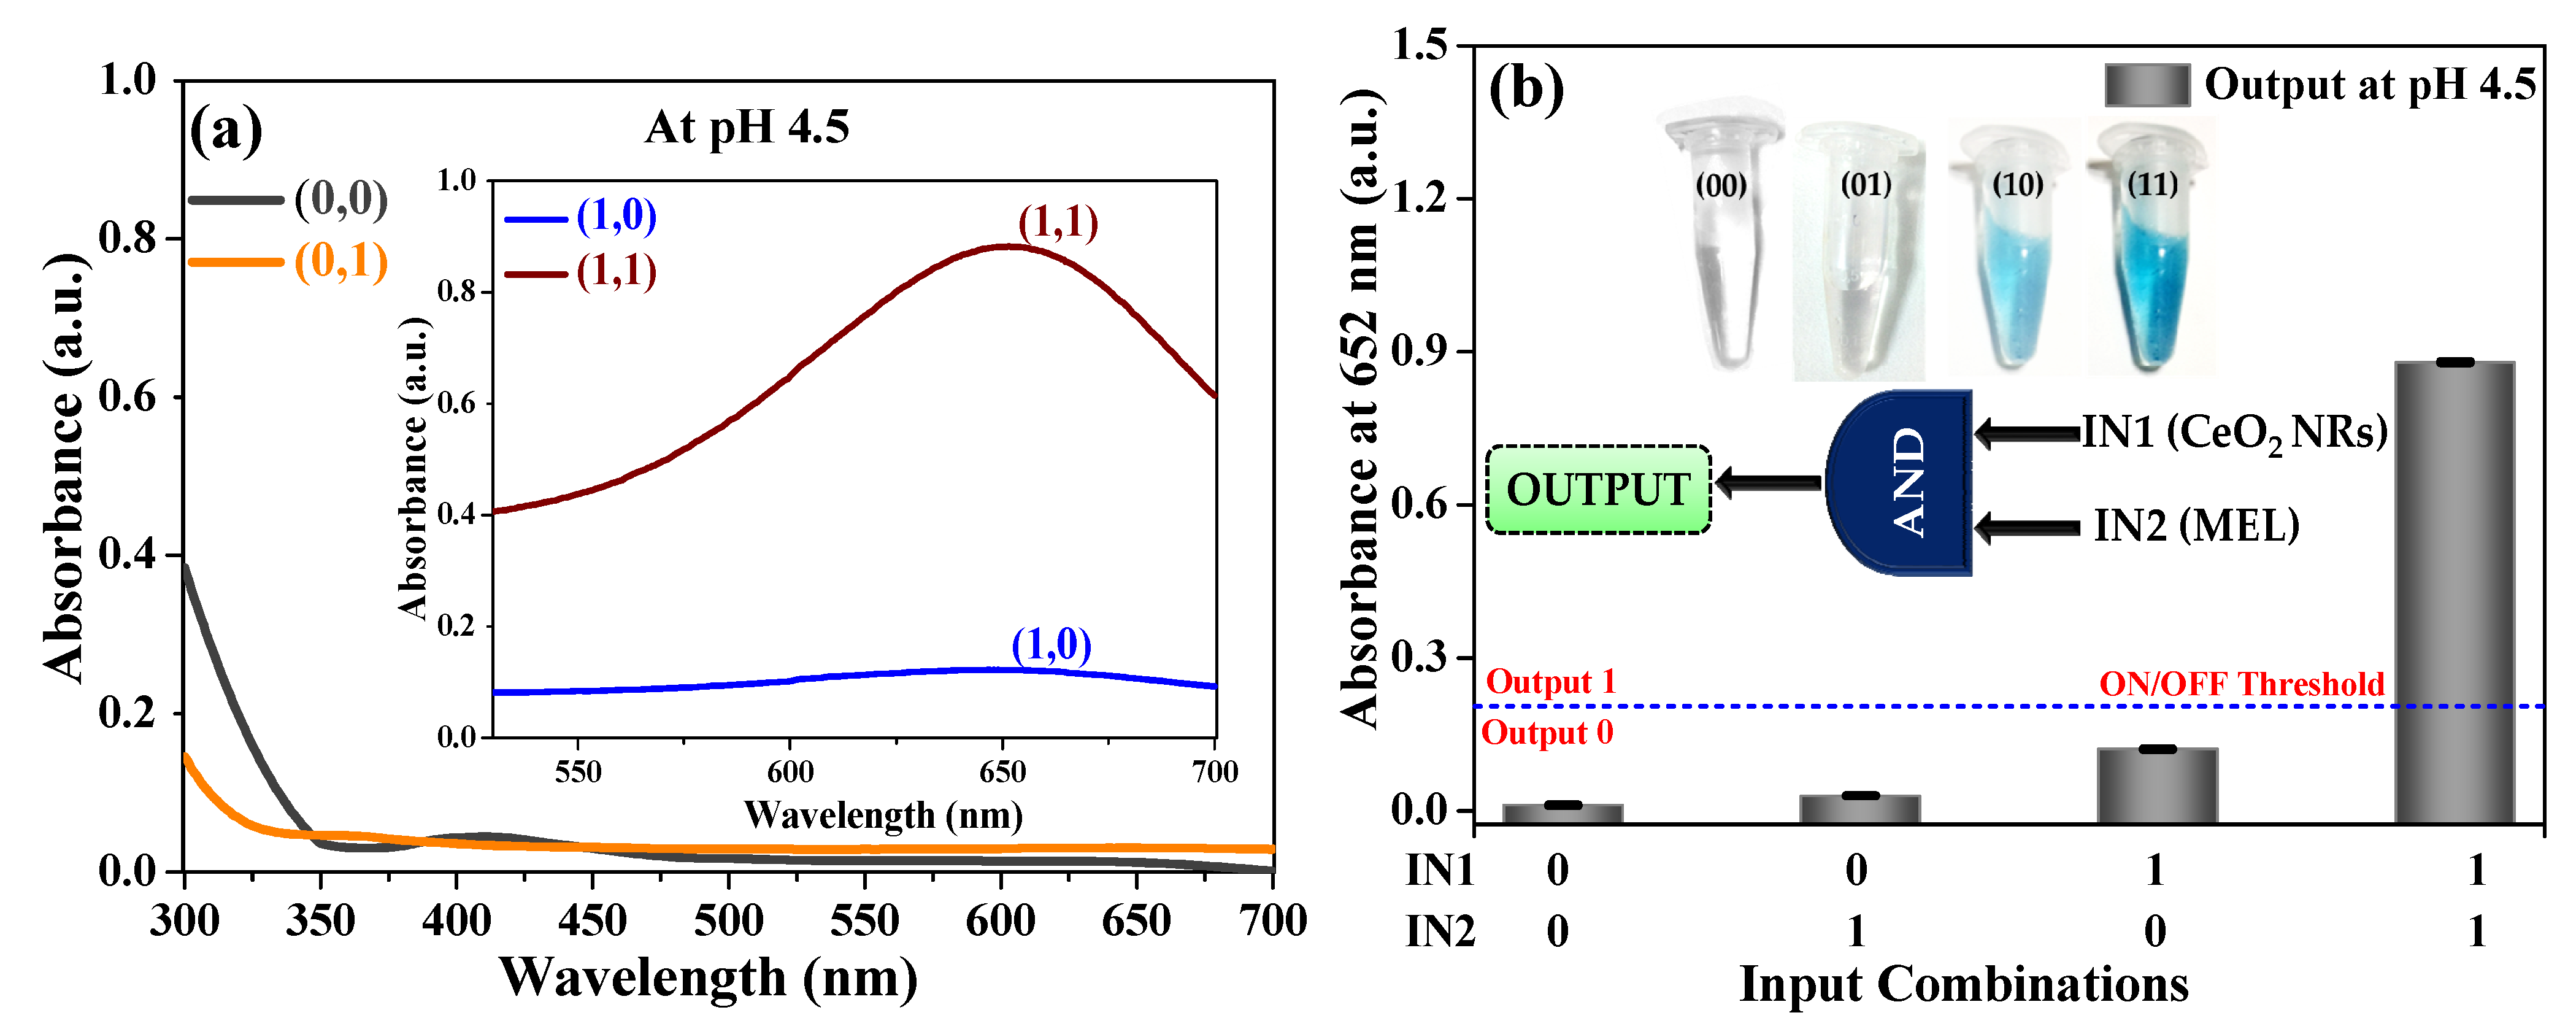
Here, the AND logic design exploited CeO2 NRs for its POD mimic activity as the RE on a logic platform of TMB/H2O2 that switched to ON/OFF state upon application of different logic combinations. Figure S1a,b explains the logic operation principle applied for sensing MEL at two different pH (4.5 and 7.4). Reaction cascade operating at pH 4.5 involved the processing of two input signals (IN1:CeO2 NRs; IN2: MEL) to produce a color change from colorless to blue as an output signal. As expected, the UV/visible absorption spectrum in Figure 2a shows the absence of both or either of the inputs (0,0; 0,1; 1,0), reporting no or low absorption response with no significant color, defining an OFF state (output “0”). In the presence of both the input (1,1) results in a high absorption at 652 nm and the reaction solution turning blue, the logic gate switched the output to ON state. Correspondingly, the absorbance intensity (at 652 nm) as output signal plotted against input combinations represented as column bars with logic circuit, given as the inset of Figure 2b. Figure S2a shows the truth table and its corresponding color reactions at pH 4.5.
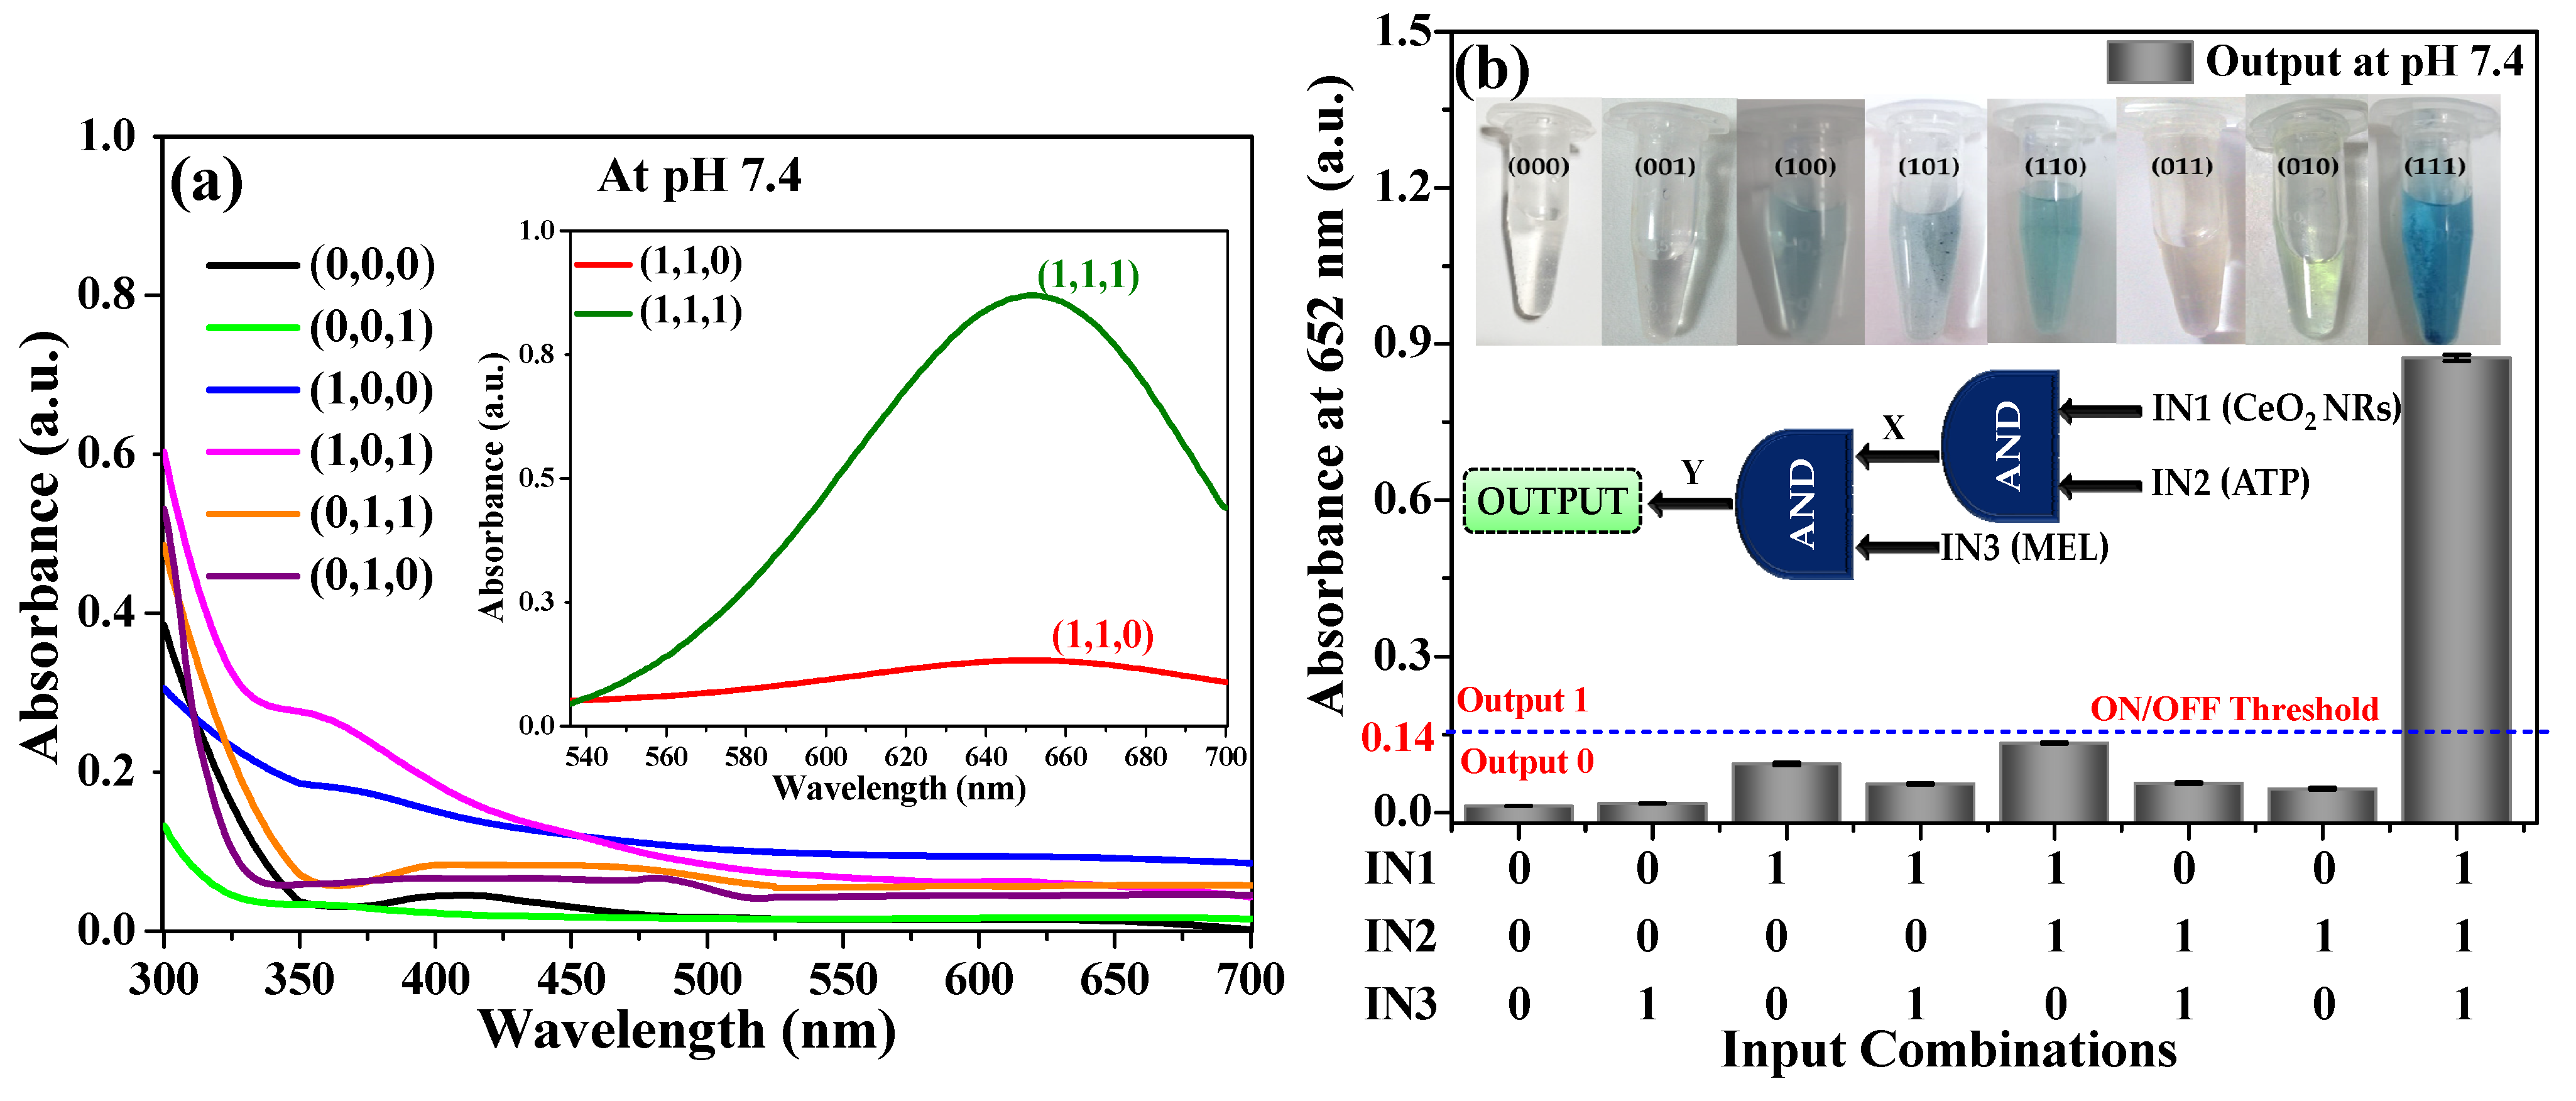
We further validated the three inputs (IN1: CeO2 NRs; IN2: ATP; IN3: MEL) and controlled the AND logic gate for sensing MEL at pH 7.4. We saw that only in the presence of all the three inputs (1,1,1) this logic showed high absorbance and switched to the ON state, Figure 3a. Figure 3b depicts the column bars for absorbance (at 652 nm) plotted against the eight-input combinations and second level logic circuit given in the inset. The truth table (Figure S2b) depicts the characteristic of the concatenated gates system with its respective color reactions at pH 7.4. Thus, we demonstrated proper execution of the fabricated AND logic gate operations at both pH levels.

3.3. Analytical Performance of AND Logic Gate-Based Colorimetric Detection of MEL

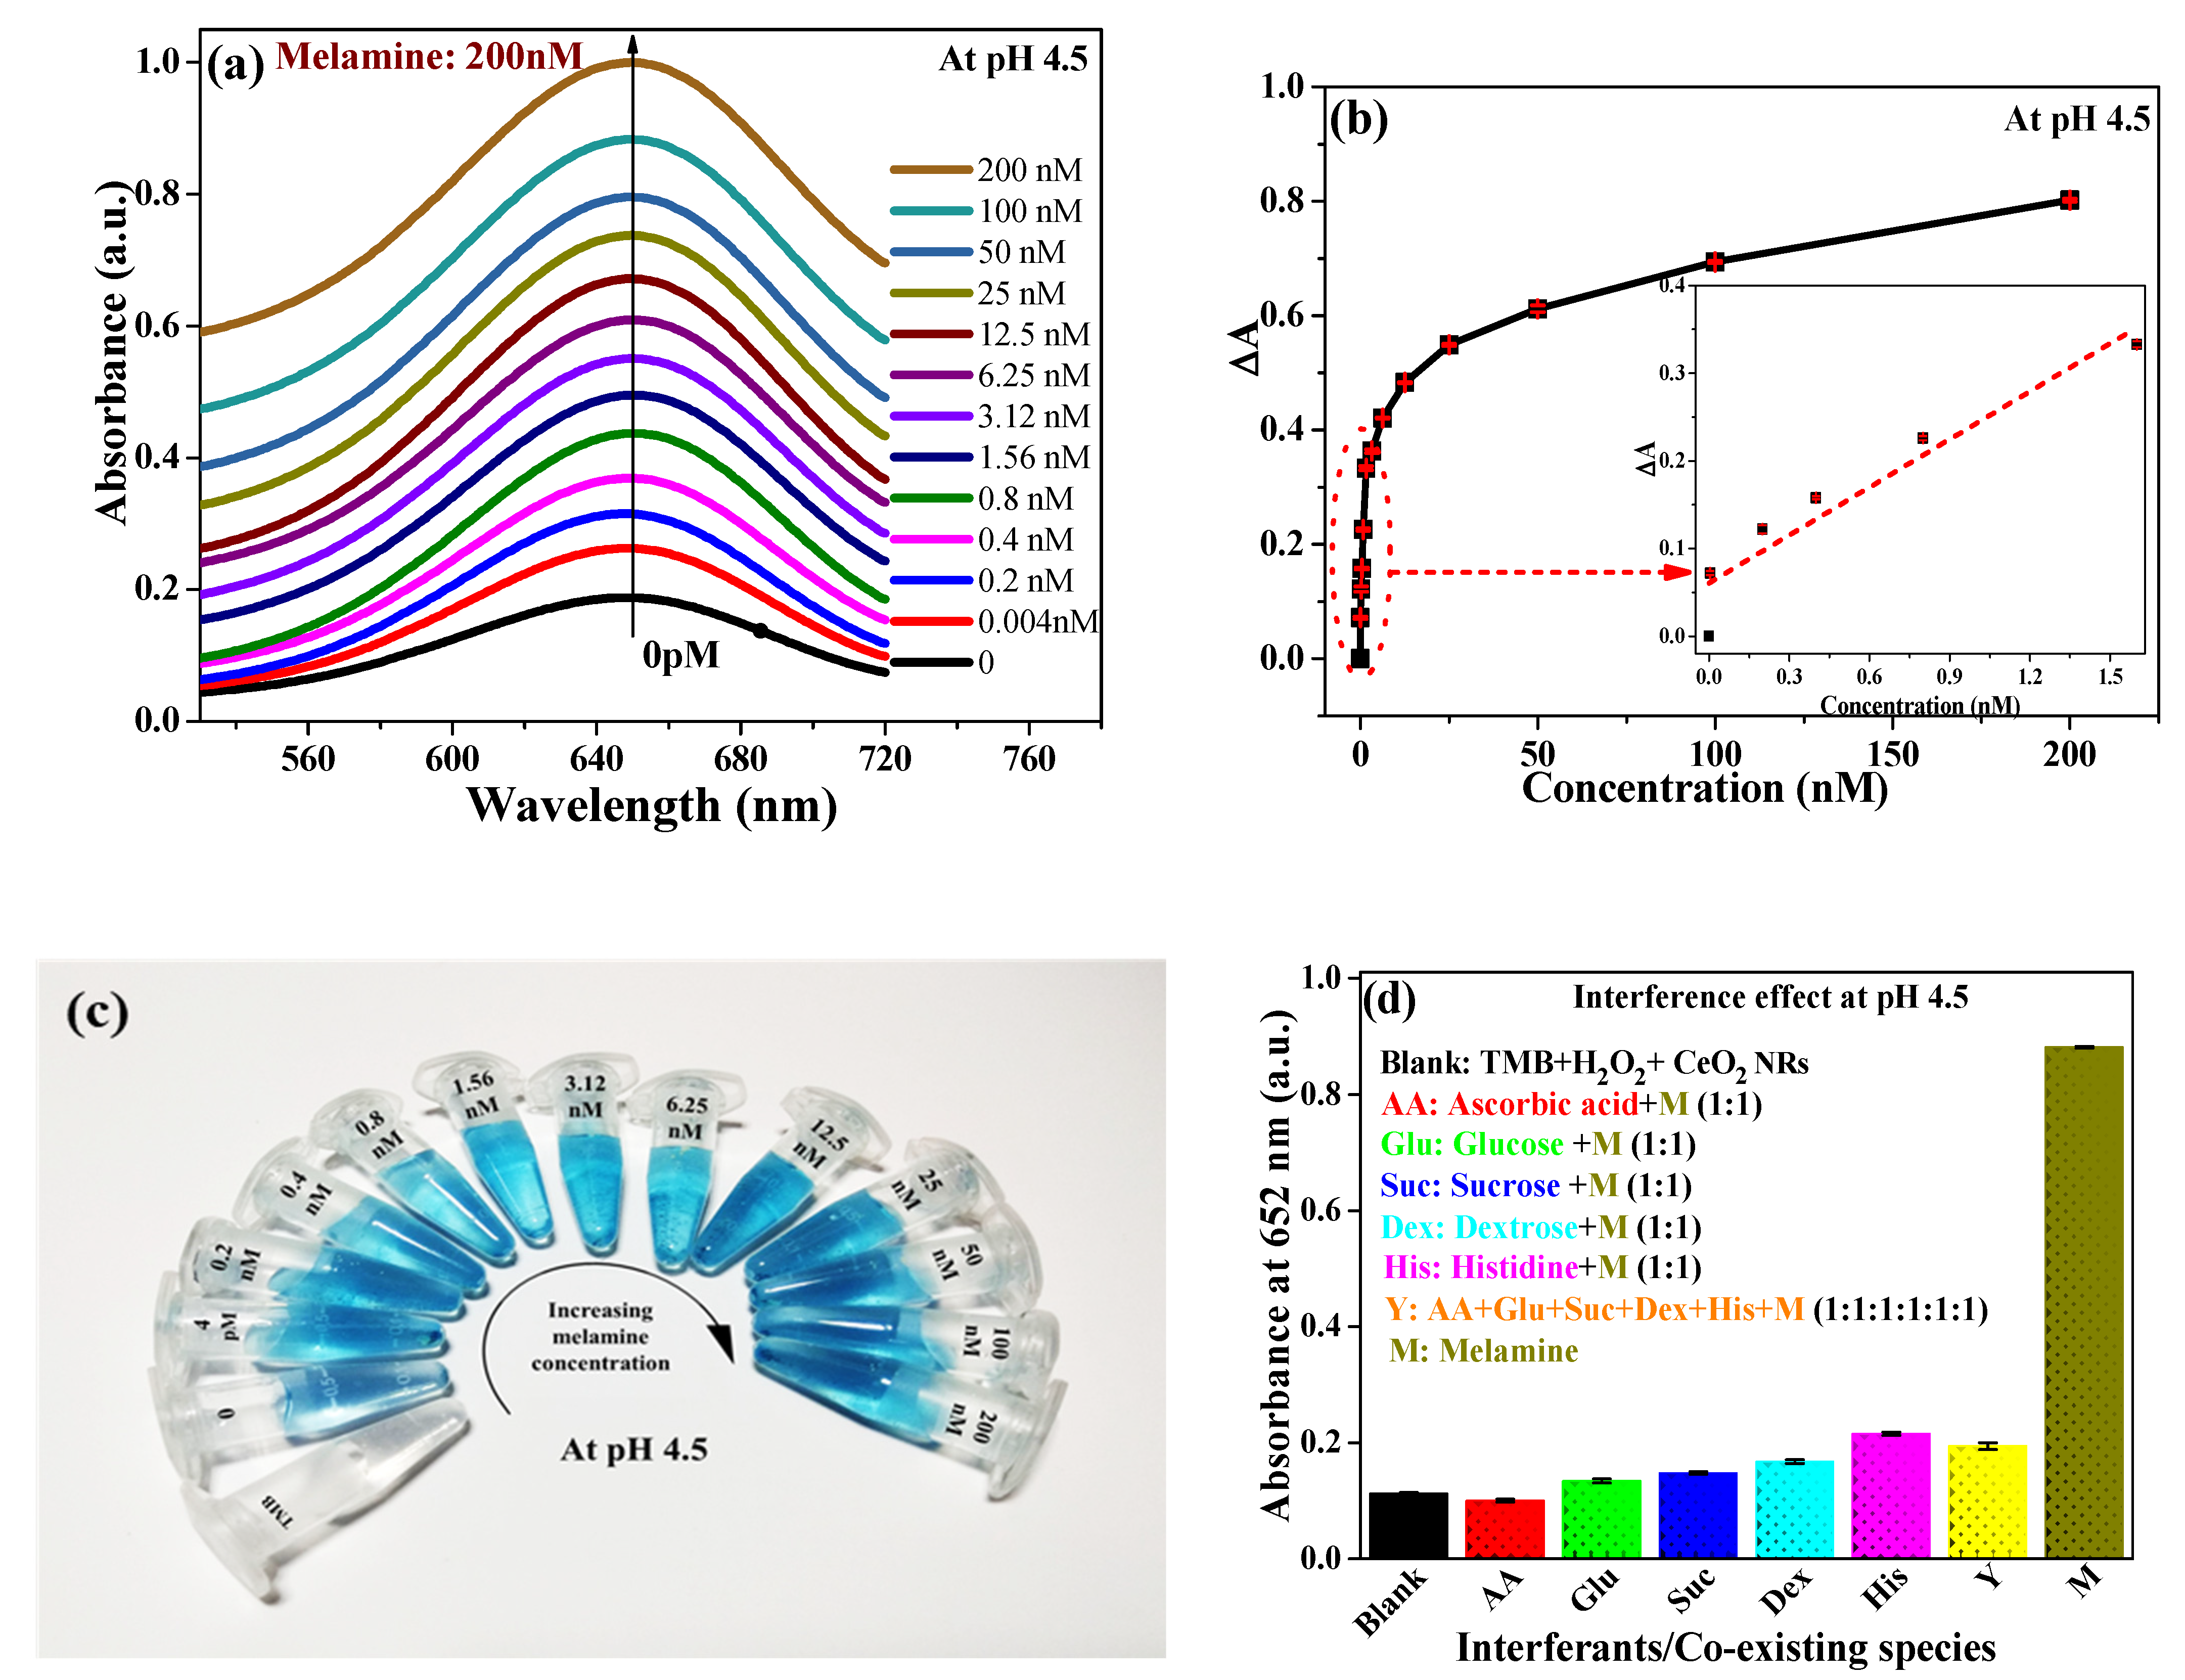
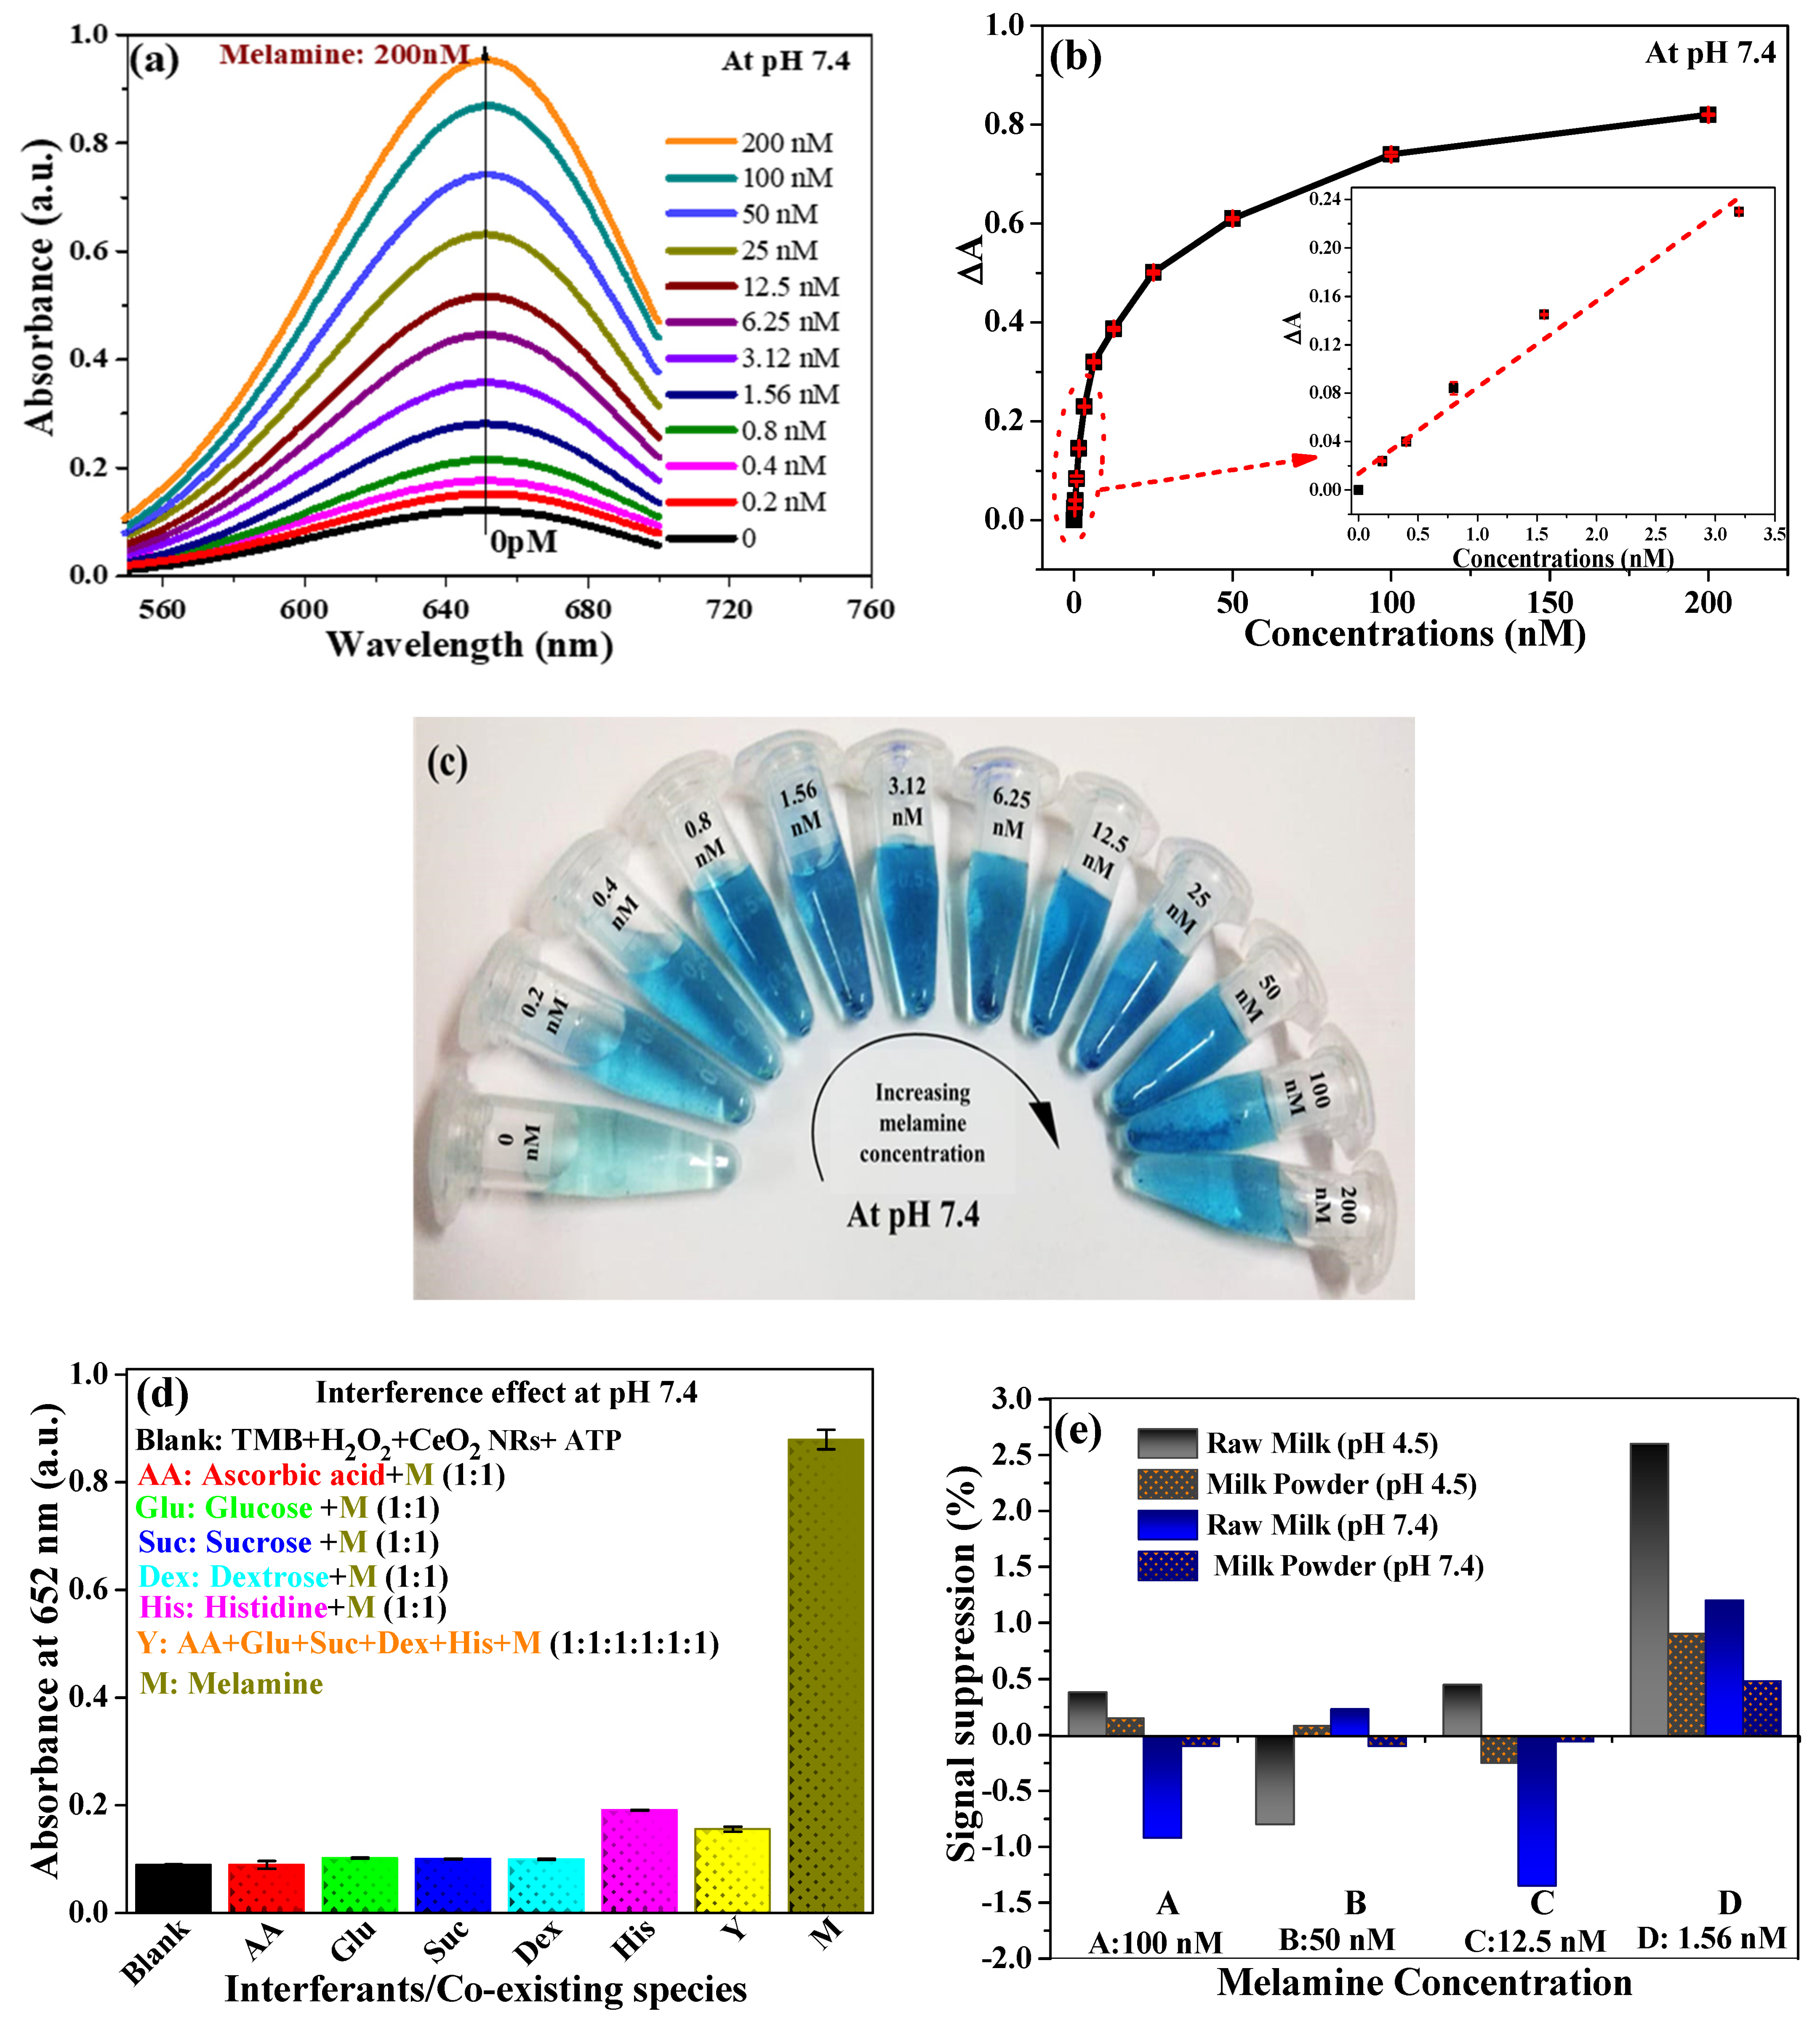
The AND logic system was implemented in a functional visual colorimetric sensor for MEL. Under optimal conditions, AND logic functions were applied to investigate the colorimetric sensing against successive concentrations of MEL (0, 0.004 nM, 0.2 nM, 0.4 nM, 0.8 nM, 1.56 nM, 3.12 nM, 6.25 nM, 12.5 nM, 25 nM, 50 nM, 100 nM and 200 nM ) at pH 4.5 (Figure 4a) and at pH 7.4; the sensing of MEL was performed in the concentration range of (0, 0.2 nM, 0.4 nM, 0.8 nM, 1.56 nM, 3.12 nM, 6.25 nM, 12.5 nM, 25 nM, 50 nM, 100 nM and 200 nM), Figure 5a. As displayed in Figure 4a and Figure 5a, the intensities of the UV-Vis absorption peaks (at 652 nm) increased progressively with the increasing concentration of MEL. Simultaneously, the corresponding photographs of the reaction solutions in the absence and presence of MEL in different amounts are presented in Figure 4c and Figure 5c; they clearly show the color transition from light blue, which gradually deepens with the increase in MEL concentration and specifies an evident visual differentiation, and the system with CeO2 NRs + TMB + H2O2 + MEL (at pH 4.5) exhibited the deepest blue color, compared to those carried out at pH 7.4.
As depicted in the inset of Figure 4b, at pH 4.5 within an incubation time of 15 min the analytical calibration plot shows a linear response (R2 = 0.95713) ranging from 0.004 nm to 1.56 nM (approximately 0.0005–0.19 µg per liter), with the regression equation ΔA652 = 0.06063 + 0.18216. While in transition from acidic to neutral pH, the MEL response curve (ΔA652 verses MEL concentration) shown in Figure 5b displays a linear response (R2 = 0.98901) in the range of 0.2 nM to 3.12 nM (approximately 0.025–0.39 µg per liter), shown as the inset in Figure 5b, with the regression equation: ΔA652 = 0.0135 + 0.0712. We investigated the limit of detection (LOD) and limit of quantification (LOQ) values on 20 blank samples at pH 4.5 and 7.4, using the equations LOD = 3 × SD/S and LOQ = 10 × SD/S (where SD: standard deviation of the blank solution, and S: the slope of the calibration plot), detection limit at pH 4.5 and 7.4, estimated to be 4 pM and 17 pM, correspondingly, while LOQ was 12 pM and 51 pM, respectively. The sensitivity of the colorimetric method was far below the prescribed safety limits [25]
Analytical performance at both pH 4.5 and 7.4 was comparable and even better than that acquired with a different colorimetric probe, Table S3. Furthermore, the relative standard deviation (RSD) representing precision (for n = 3; where n = number of samples at each concentration) at pH 4.5 and 7.4 in the ΔA652 values at all the concentrations was found to be less than 1% and 0.2%, respectively, implies method reproducibility.
Following the logic functions (explained in ESS 1.3) to assess the selectivity of the method and rule out false-positive signals, control experiments were performed in an equimolar ratio of MEL to interfering species, including ascorbic acid (AA), glucose, sucrose, dextrose, and histidine. Results of the selectivity experiment carried out at pH 4.5 and 7.4 indicated that only MEL leads to color reaction (colorless to blue) with a significant increase in the absorbance, Figure 4d and Figure 5d, respectively. Among the various interfering species, it is worth noting that histidine contributed to a very low signal, the presence of AA did not interfere owing to its antioxidant property; thus, this implies an acceptable selectivity and sensitivity for MEL in both acidic and neutral conditions.

3.4. Implication of CeO2 NRs POD-Like Activity in MEL Sensing

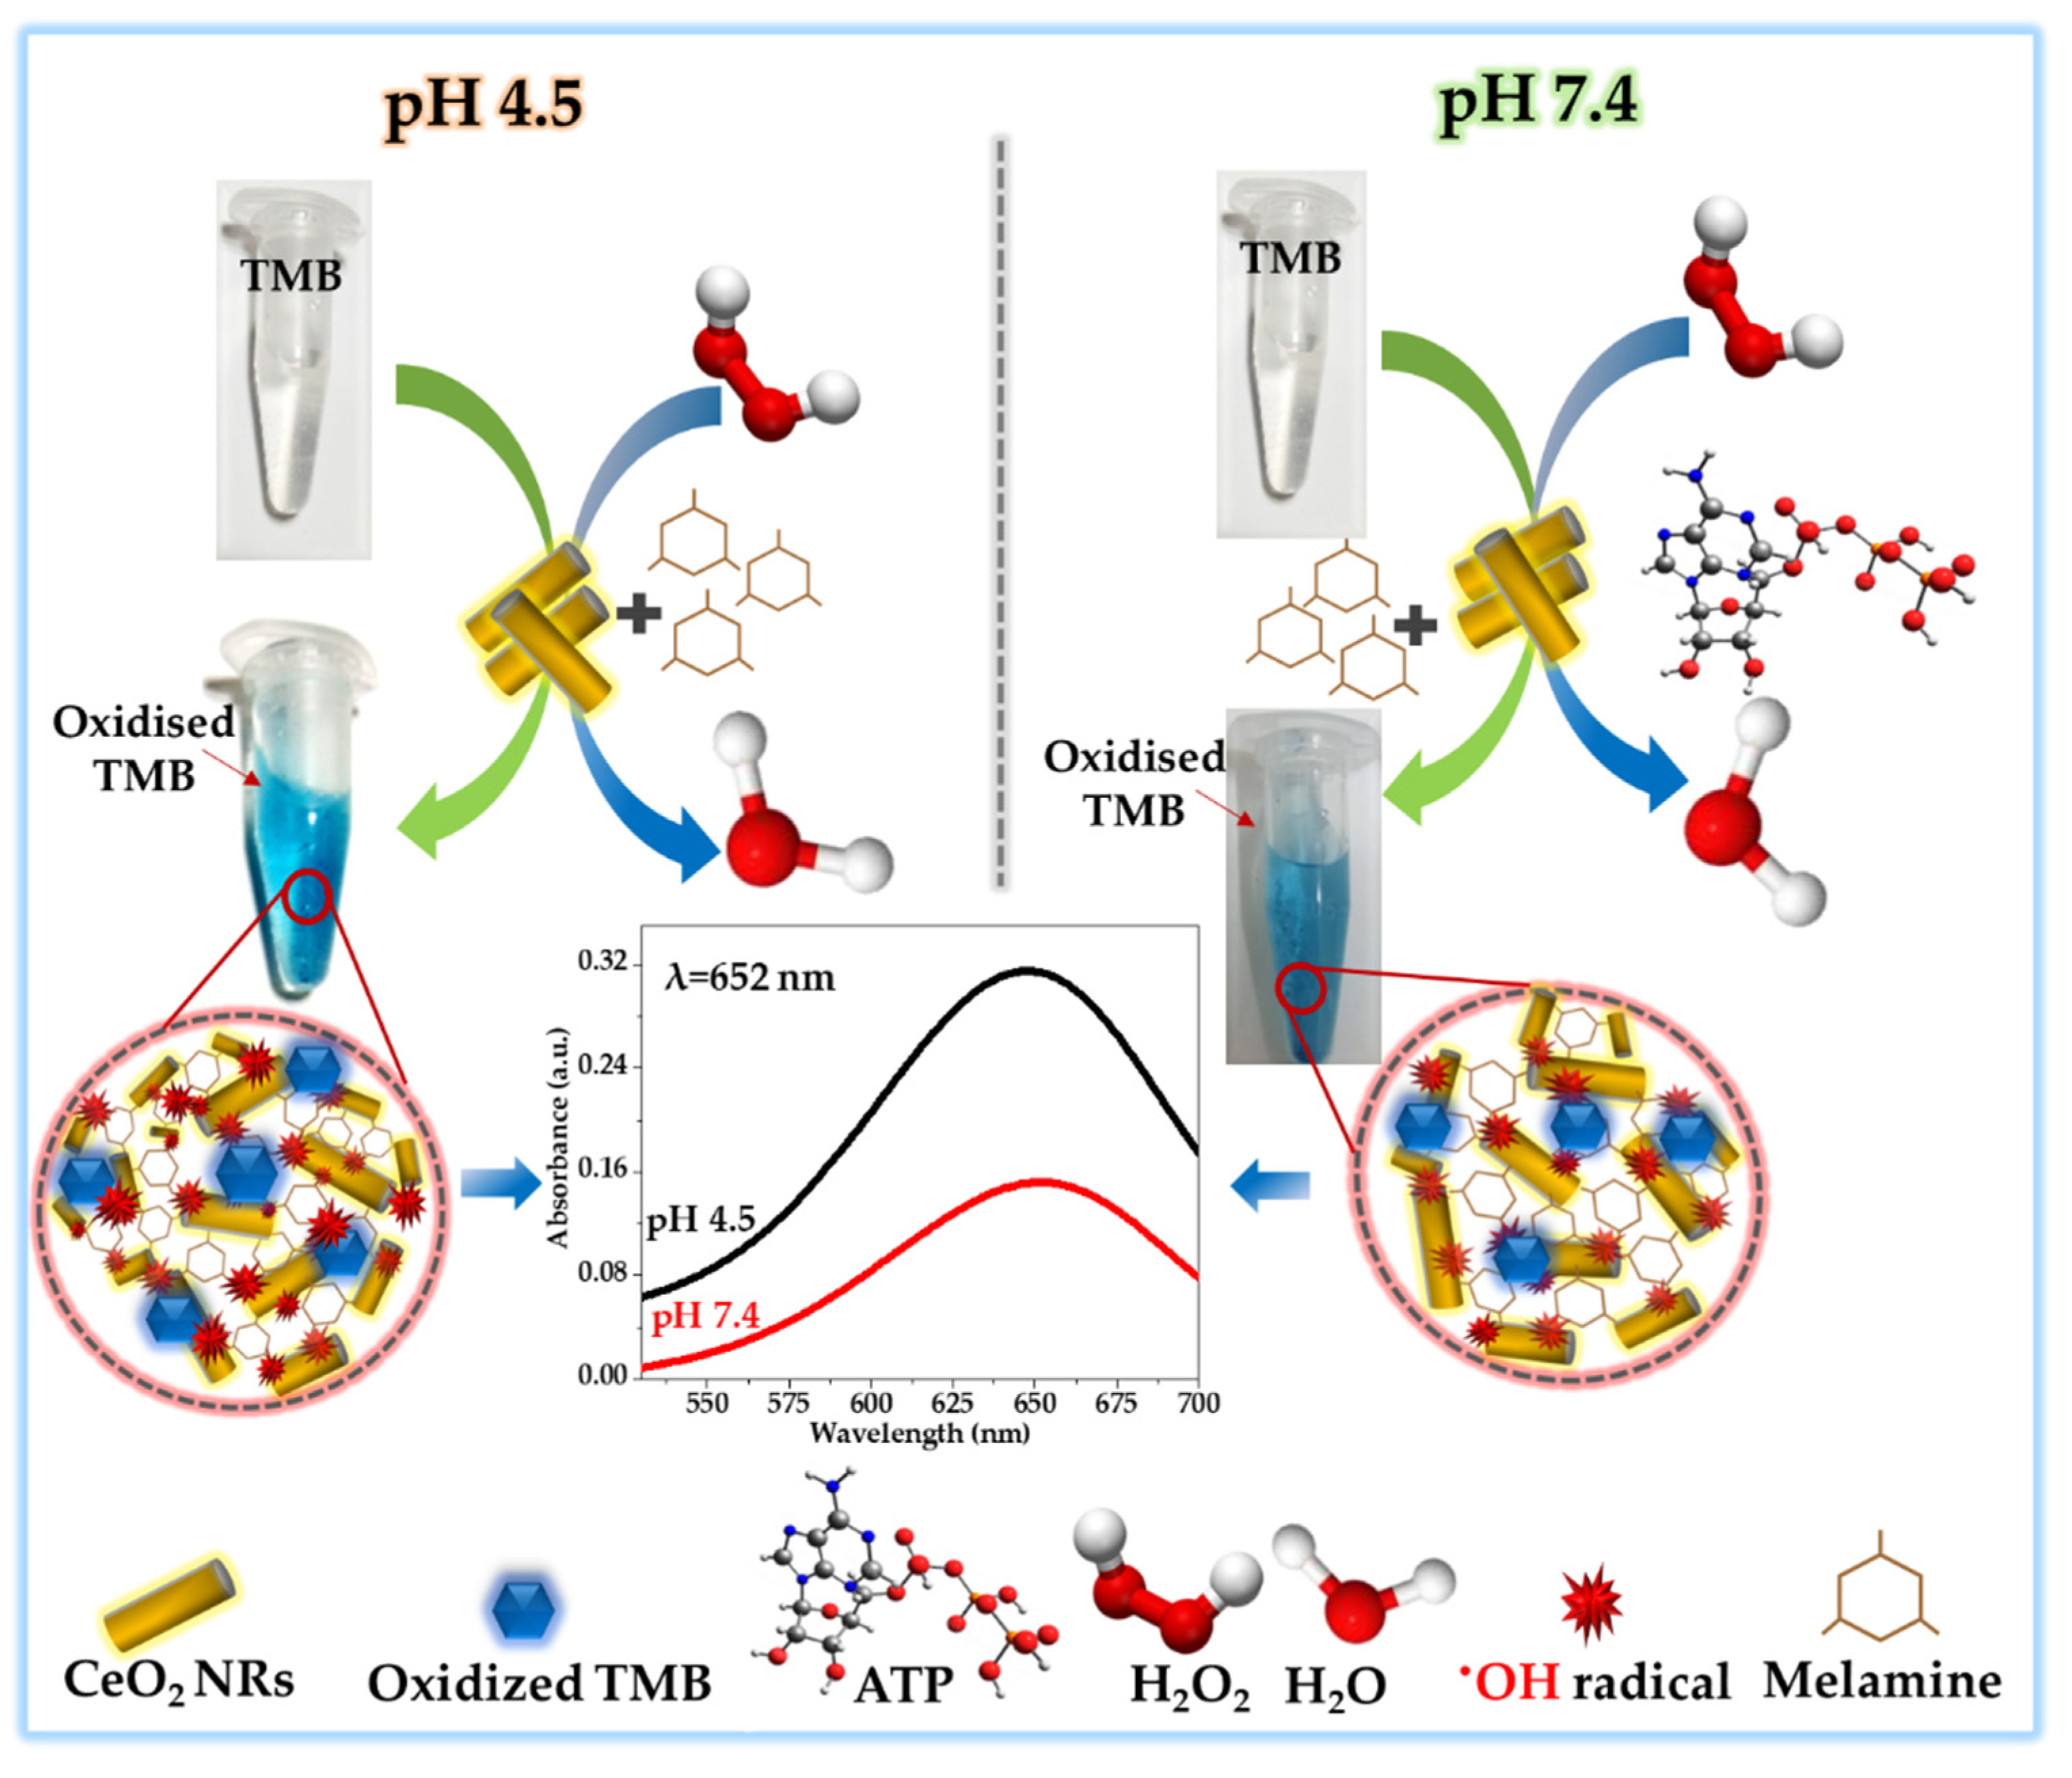
In the absence (pH 4.5) and presence of ATP (pH 7.4), the reaction of H2O2 and TMB using CeO2 NRs as RE was used to develop a colorimetric detection of MEL (Figure 4 and Figure 5). Reminiscent of what was earlier reported by Jin et al. [12], the addition of MEL probably lowered the colloidal stability and its crosslinking ability resulted in the aggregation of CeO2 NRs, which may initiate decomposition of H2O2-triggered oxidative species generation. ROS trapping experiment (Figure S3a(v)) reveals the density of •OH species sources TMB oxidation as a function of MEL concentration, as evident from the observable color change, which is also evident in the image shown in Figure 4c. Figure 6 (left) represents the reaction mechanism for the colorimetric sensing of MEL at pH 4.5. In line with the quantification of MEL at pH 4.5, single-step colorimetric detection of MEL at pH 7.4 was attributed to ATP-induced augmented affinity of H2O2 toward CeO2 NRs, Figure S3b. Figure 6 (right) shows the schematic illustration of MEL-induced aggregation of CeO2 NRs and the responsive generation of •OH radical at neutral pH. In addition, Figure S3a,b supports the fact that MEL-induced aggregation of CeO2 NRs was responsible for •OH radical directed oxidation of TMB, thus showing an augmented POD-like activity while the concentration of oxidative species varied at both pH levels. Kinetic observations at both pH levels in the presence of MEL revealed a decline in the Michaelis–Menten constant (Km value) for H2O2, suggesting that the high affinity of CeO2 NRs for H2O2 well corroborates the proposed mechanism (Figure S4a,b; Table S4).

3.5. Real Sample Analysis and Validation of the Method

Briefly, the feasibility study for the use of the logic-operated colorimetric sensor in the quantitative analysis of MEL was carried out on real samples at pH 4.5 and 7.4. Different concentrations of MEL (1.5 nM, 12.5 nM, 50 nM, and 100 nM) were spiked into raw milk and milk powder. The results summarized in Table 1 show the recoveries for MEL in raw milk ranging from 90% to 105%, and 97% to 103% in milk powder at pH 4.5; while those obtained at pH 7.4 were 97% to 103% in raw milk and 100% to 101% in milk powder, reflecting the reliability of the method.
Furthermore, to reveal the influence of the matrix, we compared the signal recorded in the buffer solution and real samples (raw milk and milk powder) at pH 4.5 and 7.4 for the same concentrations of MEL used in recovery studies. As depicted in Figure 5e the percentage of signal suppressed as a function of MEL concentration suggested excellent sensitivity with no harsh matrix influence; the sensor responded to –1.35% to 2.6% signal change, which is within normal sensor-to-sensor variation. However, at both pH level the slight signal gain observed in raw milk was within the error limit of what was seen in the buffer (citrate buffer and PBS) when challenged at 1.5 nM of MEL, Figure S5.

4. Conclusions

In an attempt to address increasing food safety and quality issues, we proposed an economic visually aided reproducible detection scheme for sensing MEL Overpowering the pH constraint of CeO2 NRs POD-like nanozyme activity as a model reaction, we successfully integrated two and a three-input regulated AND logic circuit for MEL recognition under acidic (4.5) and neutral (7.4) pH, respectively. The sensor was highly specific and outputted by a readable color change generated through the oxidation of TMB in proportion to MEL concentration. The fabricated sensor showed picomolar LOD values, significant recoveries in real samples with negligible matrix effect, and anti-interference studies depicted high selectivity and sensitivity for MEL at both pH levels, outlining the potential practical utility of this robust sensing platform. Outcomes of this study are expected not only to broaden the scope of nanozyme tunable catalysis and Boolean logic operations for sensing analytes relevant to food safety but also to provide a wealth of opportunities for fabricating intelligent biomedical diagnostics deliverable to meet the ASSURED criteria set by the World Health Organization (WHO) [35]. We hope our findings may push forward the mining of novel “next-generation artificial enzymes-based logic gates” in the maturation of practically oriented analytical methods.

Supplementary Materials

The following are available online at https://www.mdpi.com/2073-4352/11/2/178/s1, Figure S1 Principle of CeO2 NRs intrinsic peroxidase (POD)-like activity-based AND logic gate sensing platform for MEL, operations at (a) pH 4.5 and (b) pH 7.4 using two and three input elements, respectively, Figure S2 Truth table of the AND logic gate at (a) pH 4.5 and (b) pH 7.4 for MEL sensing, Figure S3 UV-visible absorption spectra in the absence and presence of MEL at (a) pH 4.5 and (b) pH 7.4 for validating MEL-induced aggregation of CeO2 NRs, Figure S4 Steady-state kinetic assay of CeO2 NRs in the presence of MEL at a fixed concentration of TMB (0.3 mM) and varying concentrations of H2O2 (1–5 mM). Double-reciprocal plots of the activity of CeO2 NRs for H2O2 given as inset at (a) pH 4.5 and (b) pH 7.4, Figure S5 Change in absorbance signal challenged from the buffer (citrate and PBS) to raw milk and milk powder, when spiked with different concentrations (1.56, 12.5, 50 and 100 nM) of MEL at pH 4.5 and 7.4, Table S1 POD-like Nanozyme activity for MEL Sensing: limitations or challenges and present attainments, Table S2 Reitveld refined structural parameters for CeO2 nanozyme, Table S3 Analytical performance comparison table between the present and previous reports for MEL sensing, Table S4 Kinetic parameters comparison of CeO2 NRs and horseradish peroxidase (HRP) toward H2O2.

Author Contributions

B.C. designed and performed the experiments, calculations and drafted the manuscript. B.C., O.Y.A. and Z.A.A. analyzed the data. H.F. and M.H. helped in analysis, paper drafting, and reviewed the paper. S.G.A. supervised the work. All authors have read and agreed to the published version of the manuscript.

Funding

The authors would like to extend their sincere appreciation to the Deanship of Scientific Research at King Saud University for funding this research group (No. RGP-1435-052) and acknowledge ICMR, New Delhi, India, for the research fellowship (SRF Grant in aid No. 45/97/2018-NAN-BMS).

Institutional Review Board Statement

Not applicable.

Informed Consent Statement

Not applicable.

Data Availability Statement

The data supporting the findings of the study are accessible from the corresponding author upon reasonable request.

Acknowledgments

The authors would like to express thanks for the measurement support from Central Instrumentation Facility, DST-PURSE program, Jamia Millia Islamia, New Delhi, India. The authors would like to extend their sincere appreciation to the Deanship of Scientific Research at King Saud University for funding this research group (No. RGP-1435-052).

Conflicts of Interest

The authors declare no conflict of interest.

References

  1. Singh, S. Nanomaterials Exhibiting Enzyme-Like Properties (Nanozymes): Current Advances and Future Perspectives. Front. Chem. 2019, 7, 46. [Google Scholar] [CrossRef]
  2. Gao, L.; Zhuang, J.; Nie, L.; Zhang, J.; Zhang, Y.; Gu, N.; Wang, T.; Feng, J.; Yang, D.; Perrett, S.; et al. Intrinsic peroxidase-like activity of ferromagnetic nanoparticles. Nat. Nanotechnol. 2007, 2, 577–583. [Google Scholar] [CrossRef] [PubMed]
  3. Li, Y.-Z.; Li, T.-T.; Chen, W.; Song, Y.-Y. Co4N Nanowires: Noble-Metal-Free Peroxidase Mimetic with Excellent Salt- and Temperature-Resistant Abilities. ACS Appl. Mater. Interfaces 2017, 9, 29881–29888. [Google Scholar] [CrossRef] [PubMed]
  4. Chen, W.; Chen, J.; Feng, Y.-B.; Hong, L.; Chen, Q.-Y.; Wu, L.; Lin, X.; Xia, X.-H. Peroxidase-like activity of water-soluble cupric oxide nanoparticles and its analytical application for detection of hydrogen peroxide and glucose. Analyst 2012, 137, 1706–1712. [Google Scholar] [CrossRef]
  5. Lin, L.; Song, X.; Chen, Y.; Rong, M.; Zhao, T.; Wang, Y.; Jiang, Y.; Chen, X. Intrinsic peroxidase-like catalytic activity of nitrogen-doped graphene quantum dots and their application in the colorimetric detection of H2O2 and glucose. Anal. Chim. Acta 2015, 869, 89–95. [Google Scholar] [CrossRef]
  6. Huang, L.; Sun, D.-W.; Pu, H.; Wei, Q. Development of Nanozymes for Food Quality and Safety Detection: Principles and Recent Applications. Compr. Rev. Food Sci. Food Saf. 2019, 18, 1496–1513. [Google Scholar] [CrossRef] [Green Version]
  7. Lin, Y.; Ren, J.; Qu, X. Catalytically Active Nanomaterials: A Promising Candidate for Artificial Enzymes. Acc. Chem. Res. 2014, 47, 1097–1105. [Google Scholar] [CrossRef] [PubMed]
  8. Sharpe, E.; Frasco, T.; Andreescu, D.; Andreescu, S. Portable ceria nanoparticle-based assay for rapid detection of food antioxidants (NanoCerac). Analyst 2012, 138, 249–262. [Google Scholar] [CrossRef] [Green Version]
  9. Bülbül, G.; Hayat, A.; Andreescu, S. ssDNA-Functionalized Nanoceria: A Redox-Active Aptaswitch for Biomolecular Recognition. Adv. Healthc. Mater. 2016, 5, 822–828. [Google Scholar] [CrossRef]
  10. Zhang, S.-X.; Xue, S.-F.; Deng, J.; Zhang, M.; Shi, G.; Zhou, T. Polyacrylic acid-coated cerium oxide nanoparticles: An oxidase mimic applied for colorimetric assay to organophosphorus pesticides. Biosens. Bioelectron. 2016, 85, 457–463. [Google Scholar] [CrossRef]
  11. Hayat, A.; Andreescu, D.; Bülbül, G.; Andreescu, S. Redox reactivity of cerium oxide nanoparticles against dopamine. J. Colloid Interface Sci. 2014, 418, 240–245. [Google Scholar] [CrossRef] [PubMed]
  12. Jin, X.; Yin, W.; Ni, G.; Peng, J. Hydrogen-bonding-induced colorimetric detection of melamine based on the peroxidase activity of gelatin-coated cerium oxide nanospheres. Anal. Methods 2018, 10, 841–847. [Google Scholar] [CrossRef]
  13. Mustafa, F.; Andreescu, S. Nanotechnology-based approaches for food sensing and packaging applications. RSC Adv. 2020, 10, 19309–19336. [Google Scholar] [CrossRef]
  14. Wang, W.; Gunasekaran, S. Nanozymes-based biosensors for food quality and safety. TrAC Trends Anal. Chem. 2020, 126, 115841. [Google Scholar] [CrossRef]
  15. Xin, H.; Stone, R. TAINTED MILK SCANDAL: Chinese Probe Unmasks High-Tech Adulteration With Melamine. Science 2008, 322, 1310–1311. [Google Scholar] [CrossRef] [PubMed]
  16. Cao, Q.; Zhao, H.; He, Y.; Li, X.; Zeng, L.; Ding, N.; Wang, J.; Yang, J.; Wang, G. Hydrogen-bonding-induced colorimetric detection of melamine by nonaggregation-based Au-NPs as a probe. Biosens. Bioelectron. 2010, 25, 2680–2685. [Google Scholar] [CrossRef]
  17. Brown, C.A.; Jeong, K.-S.; Poppenga, R.H.; Puschner, B.; Miller, D.M.; Ellis, A.E.; Kang, K.-I.; Sum, S.; Cistola, A.M.; Brown, S.A. Outbreaks of Renal Failure Associated with Melamine and Cyanuric Acid in Dogs and Cats in 2004 and 2007. J. Veter. Diagn. Investig. 2007, 19, 525–531. [Google Scholar] [CrossRef] [Green Version]
  18. Xu, X.-M.; Ren, Y.-P.; Zhu, Y.; Cai, Z.-X.; Han, J.-L.; Huang, B.-F.; Zhu, Y. Direct determination of melamine in dairy products by gas chromatography/mass spectrometry with coupled column separation. Anal. Chim. Acta 2009, 650, 39–43. [Google Scholar] [CrossRef]
  19. Hau, A.K.-C.; Kwan, T.H.; Li, P.K.-T. Melamine Toxicity and the Kidney. J. Am. Soc. Nephrol. 2009, 20, 245–250. [Google Scholar] [CrossRef] [PubMed] [Green Version]
  20. Goscinny, S.; Hanot, V.; Halbardier, J.-F.; Michelet, J.-Y.; Van Loco, J. Rapid analysis of melamine residue in milk, milk products, bakery goods and flour by ultra-performance liquid chromatography/tandem mass spectrometry: From food crisis to accreditation. Food Control. 2011, 22, 226–230. [Google Scholar] [CrossRef]
  21. Lei, H.; Shen, Y.; Song, L.; Yang, J.; Chevallier, O.P.; Haughey, S.A.; Wang, H.; Sun, Y.; Elliott, C.T. Hapten synthesis and antibody production for the development of a melamine immunoassay. Anal. Chim. Acta 2010, 665, 84–90. [Google Scholar] [CrossRef]
  22. Zhao, N.; Li, H.; Tian, C.; Xie, Y.; Feng, Z.; Wang, Z.; Yan, X.; Wang, W.; Yu, H. Bioscaffold arrays decorated with Ag nanoparticles as a SERS substrate for direct detection of melamine in infant formula. RSC Adv. 2019, 9, 21771–21776. [Google Scholar] [CrossRef] [Green Version]
  23. Nicoli, F.; Paltrinieri, E.; Bakić, M.T.; Baroncini, M.; Silvi, S.; Credi, A. Binary logic operations with artificial molecular machines. Coord. Chem. Rev. 2021, 428, 213589. [Google Scholar] [CrossRef]
  24. Zhang, L.; Yuan, Y.; Wen, X.; Li, Y.; Cao, C.; Xiong, Q. A coordination and ligand replacement based three-input colorimetric logic gate sensing platform for melamine, mercury ions, and cysteine. RSC Adv. 2015, 5, 59106–59113. [Google Scholar] [CrossRef] [Green Version]
  25. Rajput, J.K. Bio-polyphenols promoted green synthesis of silver nanoparticles for facile and ultra-sensitive colorimetric detection of melamine in milk. Biosens. Bioelectron. 2018, 120, 153–159. [Google Scholar] [CrossRef]
  26. Chen, X.-Y.; Ha, W.; Shi, Y.-P. Sensitive colorimetric detection of melamine in processed raw milk using asymmetrically PEGylated gold nanoparticles. Talanta 2019, 194, 475–484. [Google Scholar] [CrossRef]
  27. Han, X.; Qin, Z.; Zhao, M.; Song, J.; Qu, F.; Qu, F.; Kong, R.-M. Convenient and sensitive colorimetric detection of melamine in dairy products based on Cu(ii)-H2O2-3,3′,5,5′-tetramethylbenzidine system. RSC Adv. 2018, 8, 34877–34882. [Google Scholar] [CrossRef] [Green Version]
  28. Skinner, C.G.; Thomas, J.D.; Osterloh, J.D. Melamine Toxicity. J. Med. Toxicol. 2010, 6, 50–55. [Google Scholar] [CrossRef]
  29. Dorne, J.L.; Doerge, D.R.; Vandenbroeck, M.; Fink-Gremmels, J.; Mennes, W.; Knutsen, H.K.; Vernazza, F.; Castle, L.; Edler, L.; Benford, D. Recent advances in the risk assessment of melamine and cyanuric acid in animal feed. Toxicol. Appl. Pharmacol. 2013, 270, 218–229. [Google Scholar] [CrossRef]
  30. Chishti, B.; Fouad, H.; Seo, H.K.; Alothman, O.Y.; Ansari, Z.A.; Ansari, S.A. ATP fosters the tuning of nanostructured CeO2 peroxidase-like activity for promising antibacterial performance. New J. Chem. 2020, 44, 11291–11303. [Google Scholar] [CrossRef]
  31. Schneider, C.A.; Rasband, W.S.; Eliceiri, K.W. NIH Image to ImageJ: 25 years of image analysis. Nat. Methods 2012, 9, 671–675. [Google Scholar] [CrossRef] [PubMed]
  32. Lutterotti, L.; Scardi, P.; Maistrelli, P. LSI- a computer program for simultaneous refinement of material structure and microstructure. J. Appl. Crystallogr. 1992, 25, 459–462. [Google Scholar] [CrossRef]
  33. Momma, K.; Izumi, F. VESTA 3for three-dimensional visualization of crystal, volumetric and morphology data. J. Appl. Crystallogr. 2011, 44, 1272–1276. [Google Scholar] [CrossRef]
  34. Zhou, X.-D.; Huebner, W.; Anderson, H.U. Processing of Nanometer-Scale CeO2 Particles. Chem. Mater. 2003, 15, 378–382. [Google Scholar] [CrossRef]
  35. Kosack, C.S.; Page, A.-L.; Klatser, P.R. A guide to aid the selection of diagnostic tests. Bull. World Health Organ. 2017, 95, 639–645. [Google Scholar] [CrossRef] [PubMed]
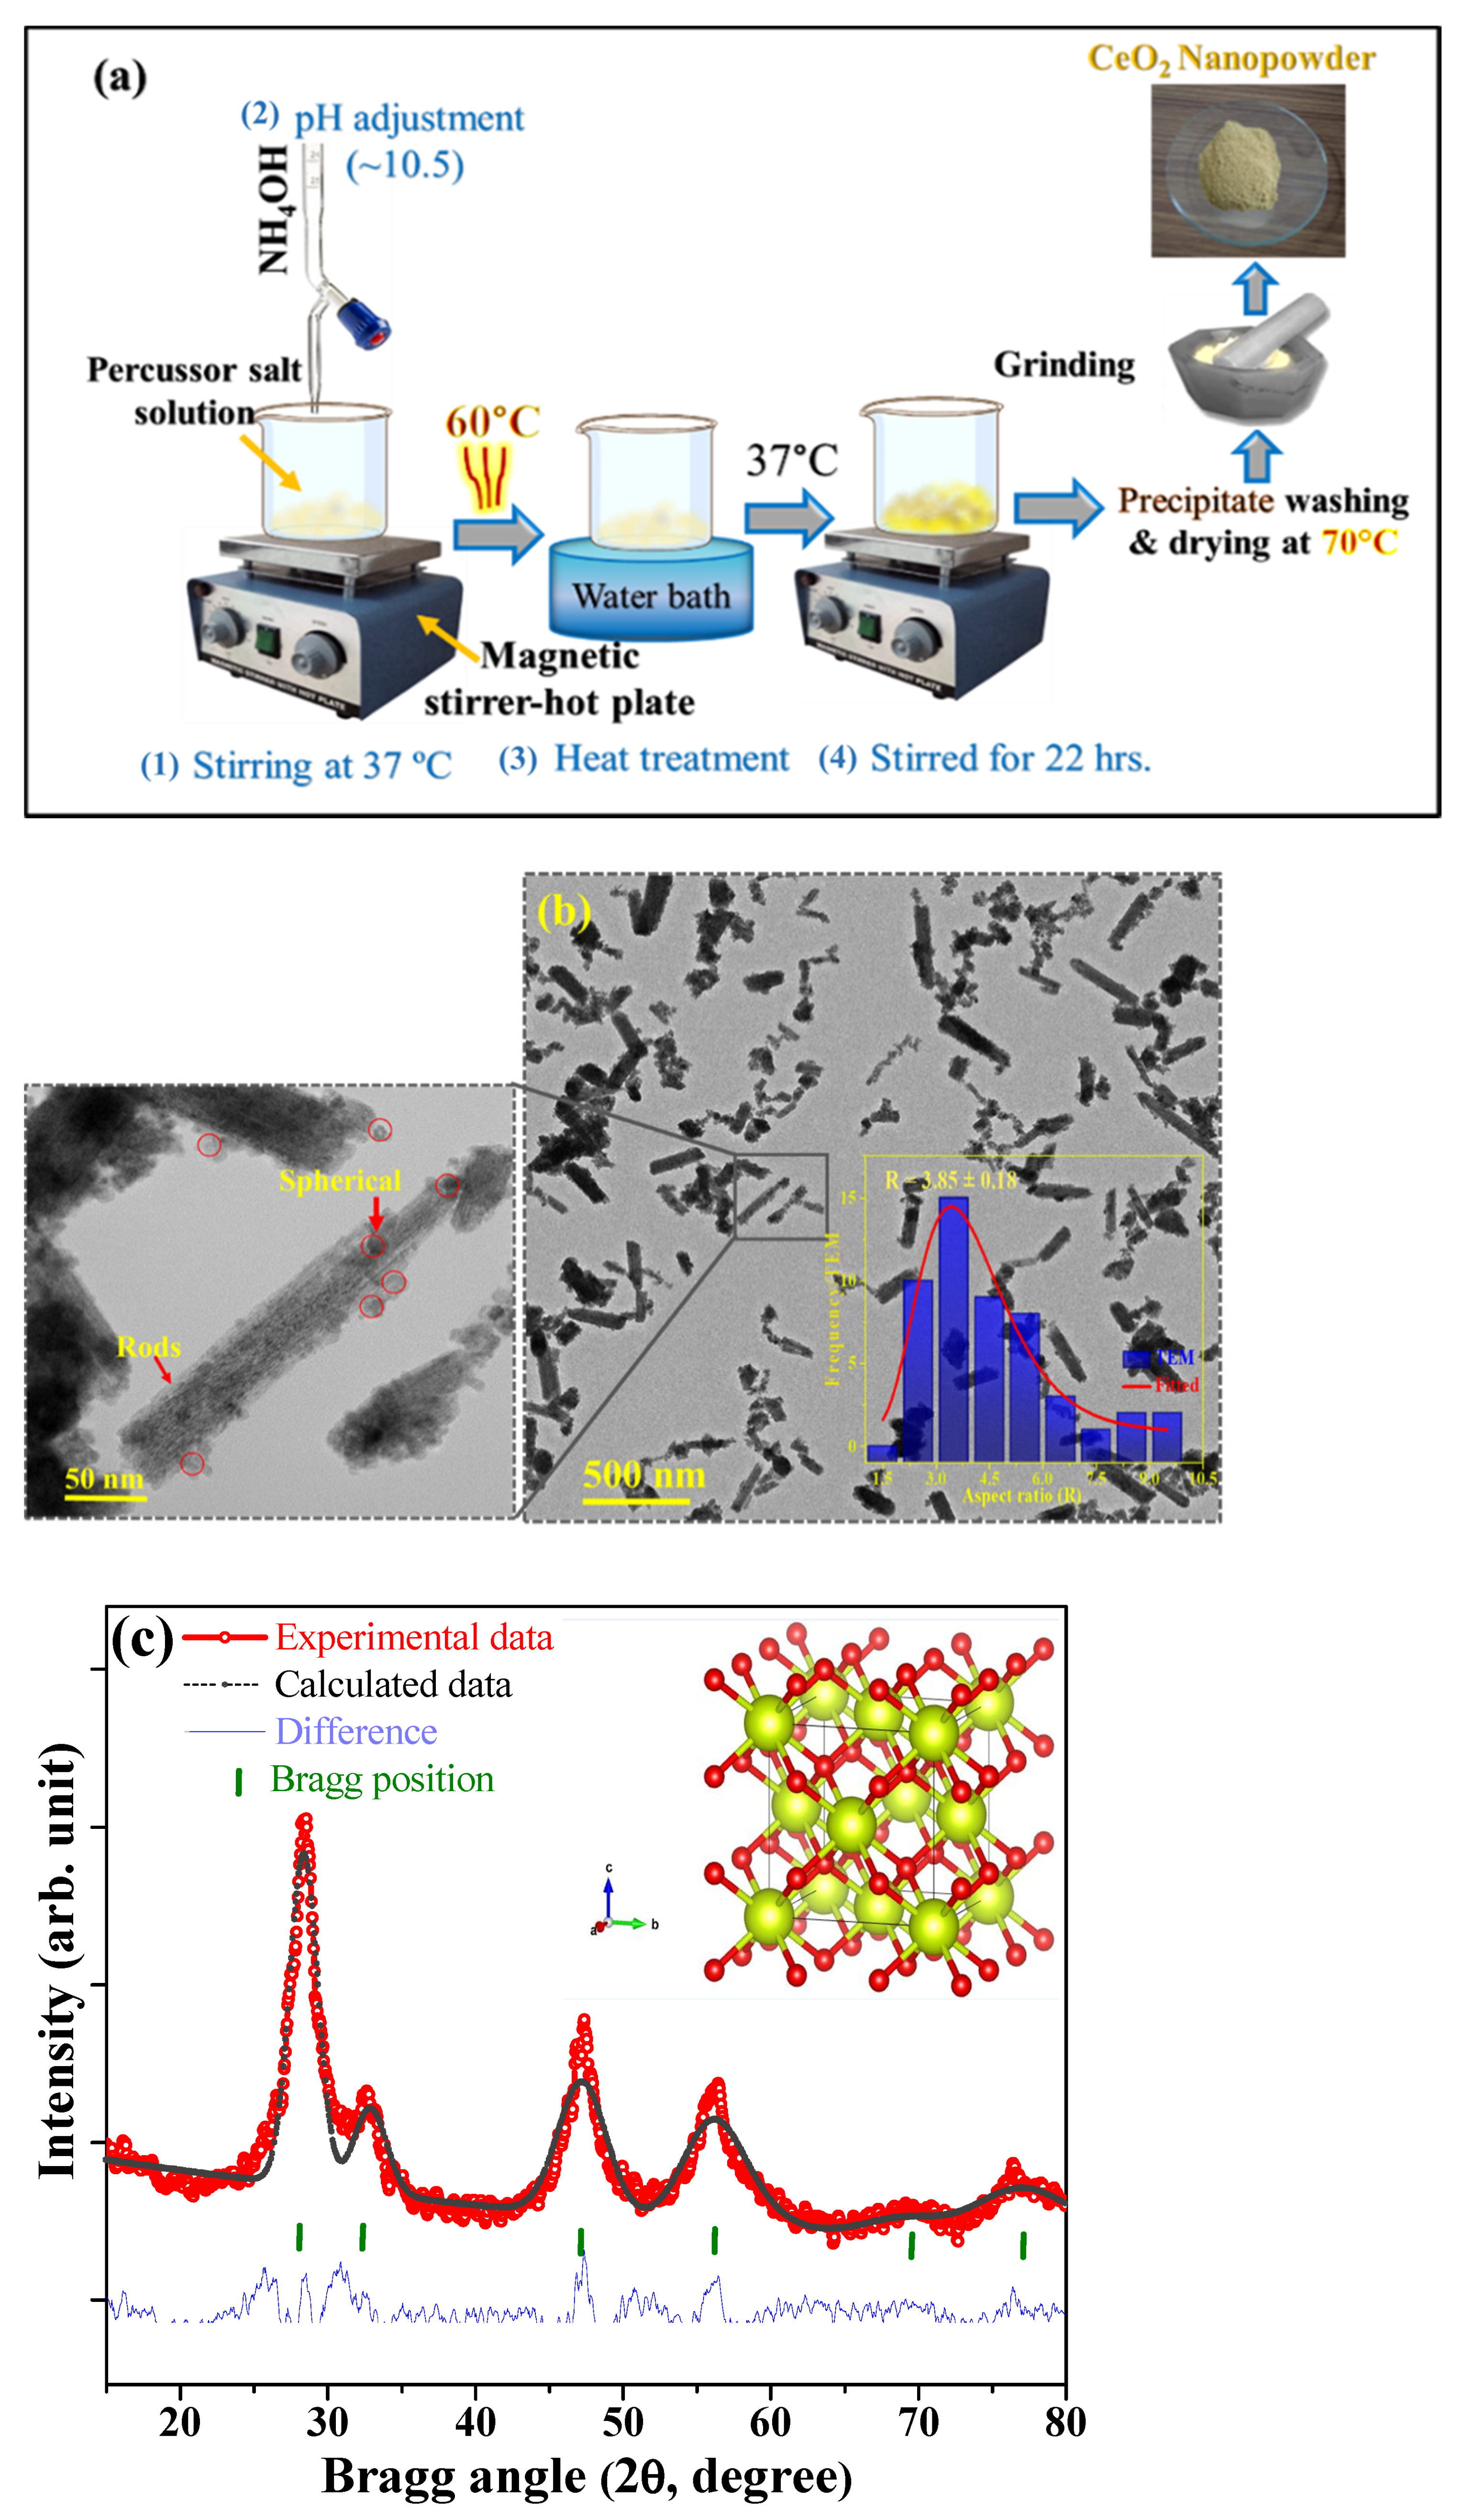
Figure 1. (a) Schematic diagram of CeO2 nanozyme preparation; (b) High-resolution TEM image of CeO2 nanozyme, the highlighted section shows rod-like morphology and inset shows the aspect ratio (R) of CeO2 nanorods (NRs) with log-normal fitting (red solid line); (c) Rietveld refinement of X-ray diffraction for CeO2 nanozyme with crystallographic structure as inset, where oxygen positions marked in red and cerium cation sites are shown in yellow.
Crystals 11 00178 g001
Figure 2. CeO2 nanozyme-based two-input AND logic gate for MEL sensing at pH 4.5. (a) UV-visible absorbance spectra; (b) Bar graph with inset shows the color reactions for different input combinations and the schematics for a two-input AND logic gate.
Crystals 11 00178 g002
Figure 3. CeO2 nanozyme-based three-input AND logic gate for MEL sensing at pH 7.4. (a) UV-visible absorbance spectra; (b) Bar graph with inset shows the color reactions for different input combinations and the schematics for three-input AND logic gate.
Crystals 11 00178 g003
Figure 4. AND logic CeO2-based colorimetric sensor for MEL (at pH 4.5), (a) UV-visible absorption of TMB + CeO2 NRs + H2O2 in the presence of different concentrations of MEL (0–200 nM); (b) Relationship between ΔA652 versus MEL concentrations (inset exhibits linear calibration plot of MEL); (c) Color reactions corresponding to MEL concentrations; (d) Selectivity study: comparative response in the presence of other co-existing species. Error bar indicates standard deviations of three independent experiments.
Crystals 11 00178 g004
Figure 5. AND logic CeO2-based colorimetric sensor for MEL (at pH 7.4). (a) UV-visible absorption of TMB + ATP + CeO2 NRs + H2O2 in the presence of different concentrations of MEL (0–200 nM); (b) Relationship between ΔA652 versus MEL concentrations (inset exhibits linear calibration plot of MEL); (c) Color reactions corresponding to MEL concentrations; (d) Selectivity study: Comparative response in the presence of other co-existing species; (e) Effect of the matrix (from the buffer to raw milk and milk powder): Signal suppression (%) versus MEL concentration. Error bar indicates standard deviations of three independent experiments.
Crystals 11 00178 g005
Figure 6. Illustration of the mechanism of POD-like CeO2 nanozyme activity-based logic operation for MEL detection at pH 4.5 (left) and 7.4 (right), respectively.
Crystals 11 00178 g006
Table 1. Real sample analysis.
MatrixConcentrations of Melamine (nM)Recovery b (%)
Original AmountConcentration SpikedAmount Found a
At pH 4.5Raw Milk01.561.4 ± 0.2490
012.512.76 ± 0.24102
05050.12 ± 0.87100
0100105.67 ± 2.68105
Milk Powder01.561.51 ± 0.4197
012.512.92 ± 0.41103
05050.05 ± 0.47100
0100103.43 ± 3.51103
At pH 7.4Raw Milk01.561.61 ± 0.14103
012.512.15 ± 0.1497
05050.29 ± 2.21101
010099.63 ± 0.1497
Milk Powder01.561.58 ± 0.12101
012.512.48 ± 0.12100
05050.13 ± 0.21101
0100100.1 ± 0.12100
a Average of three measurements ± standard deviation. b Concentration of melamine measured/Concentration spiked.
Publisher’s Note: MDPI stays neutral with regard to jurisdictional claims in published maps and institutional affiliations.