
Luminescence Intensity Ratio Thermometry with Er3+: Performance Overview


Abstract
:1. Introduction
2. Methods
2.1. Luminescence Intensity Ratio Method
2.2. Judd–Ofelt Theory and Its Relevance for Luminescence Thermometry
3. Results and Discussion
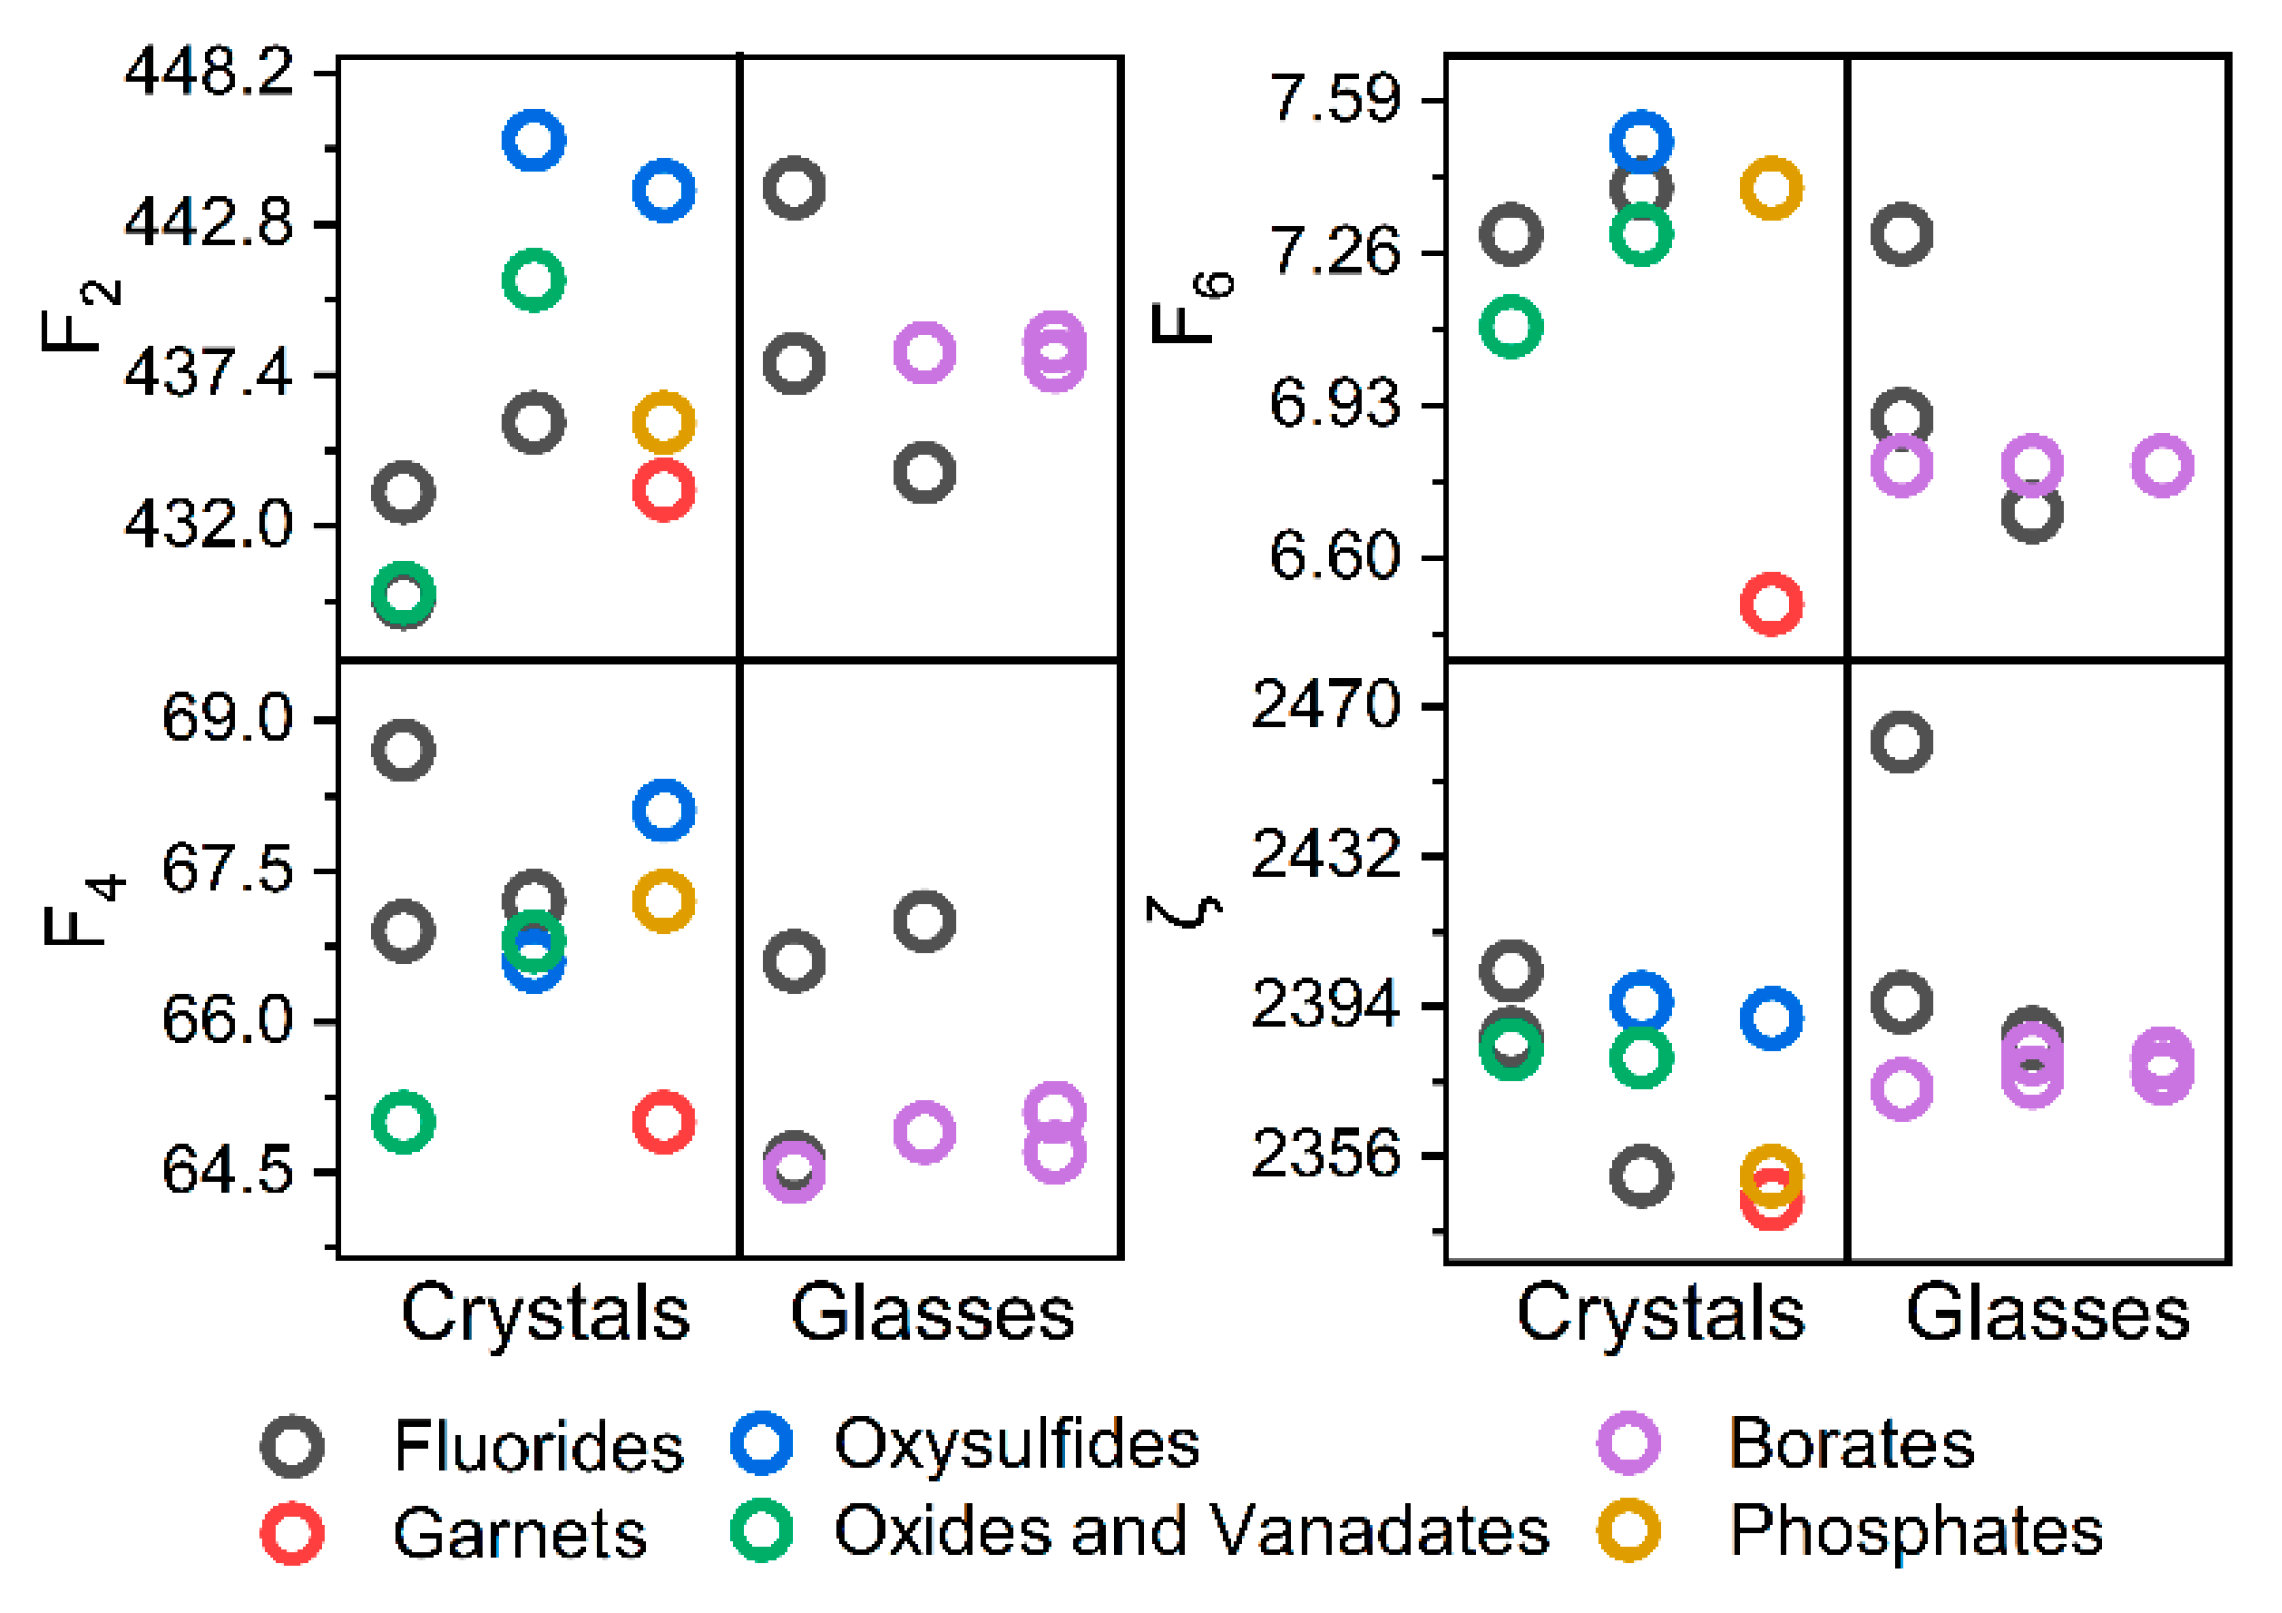
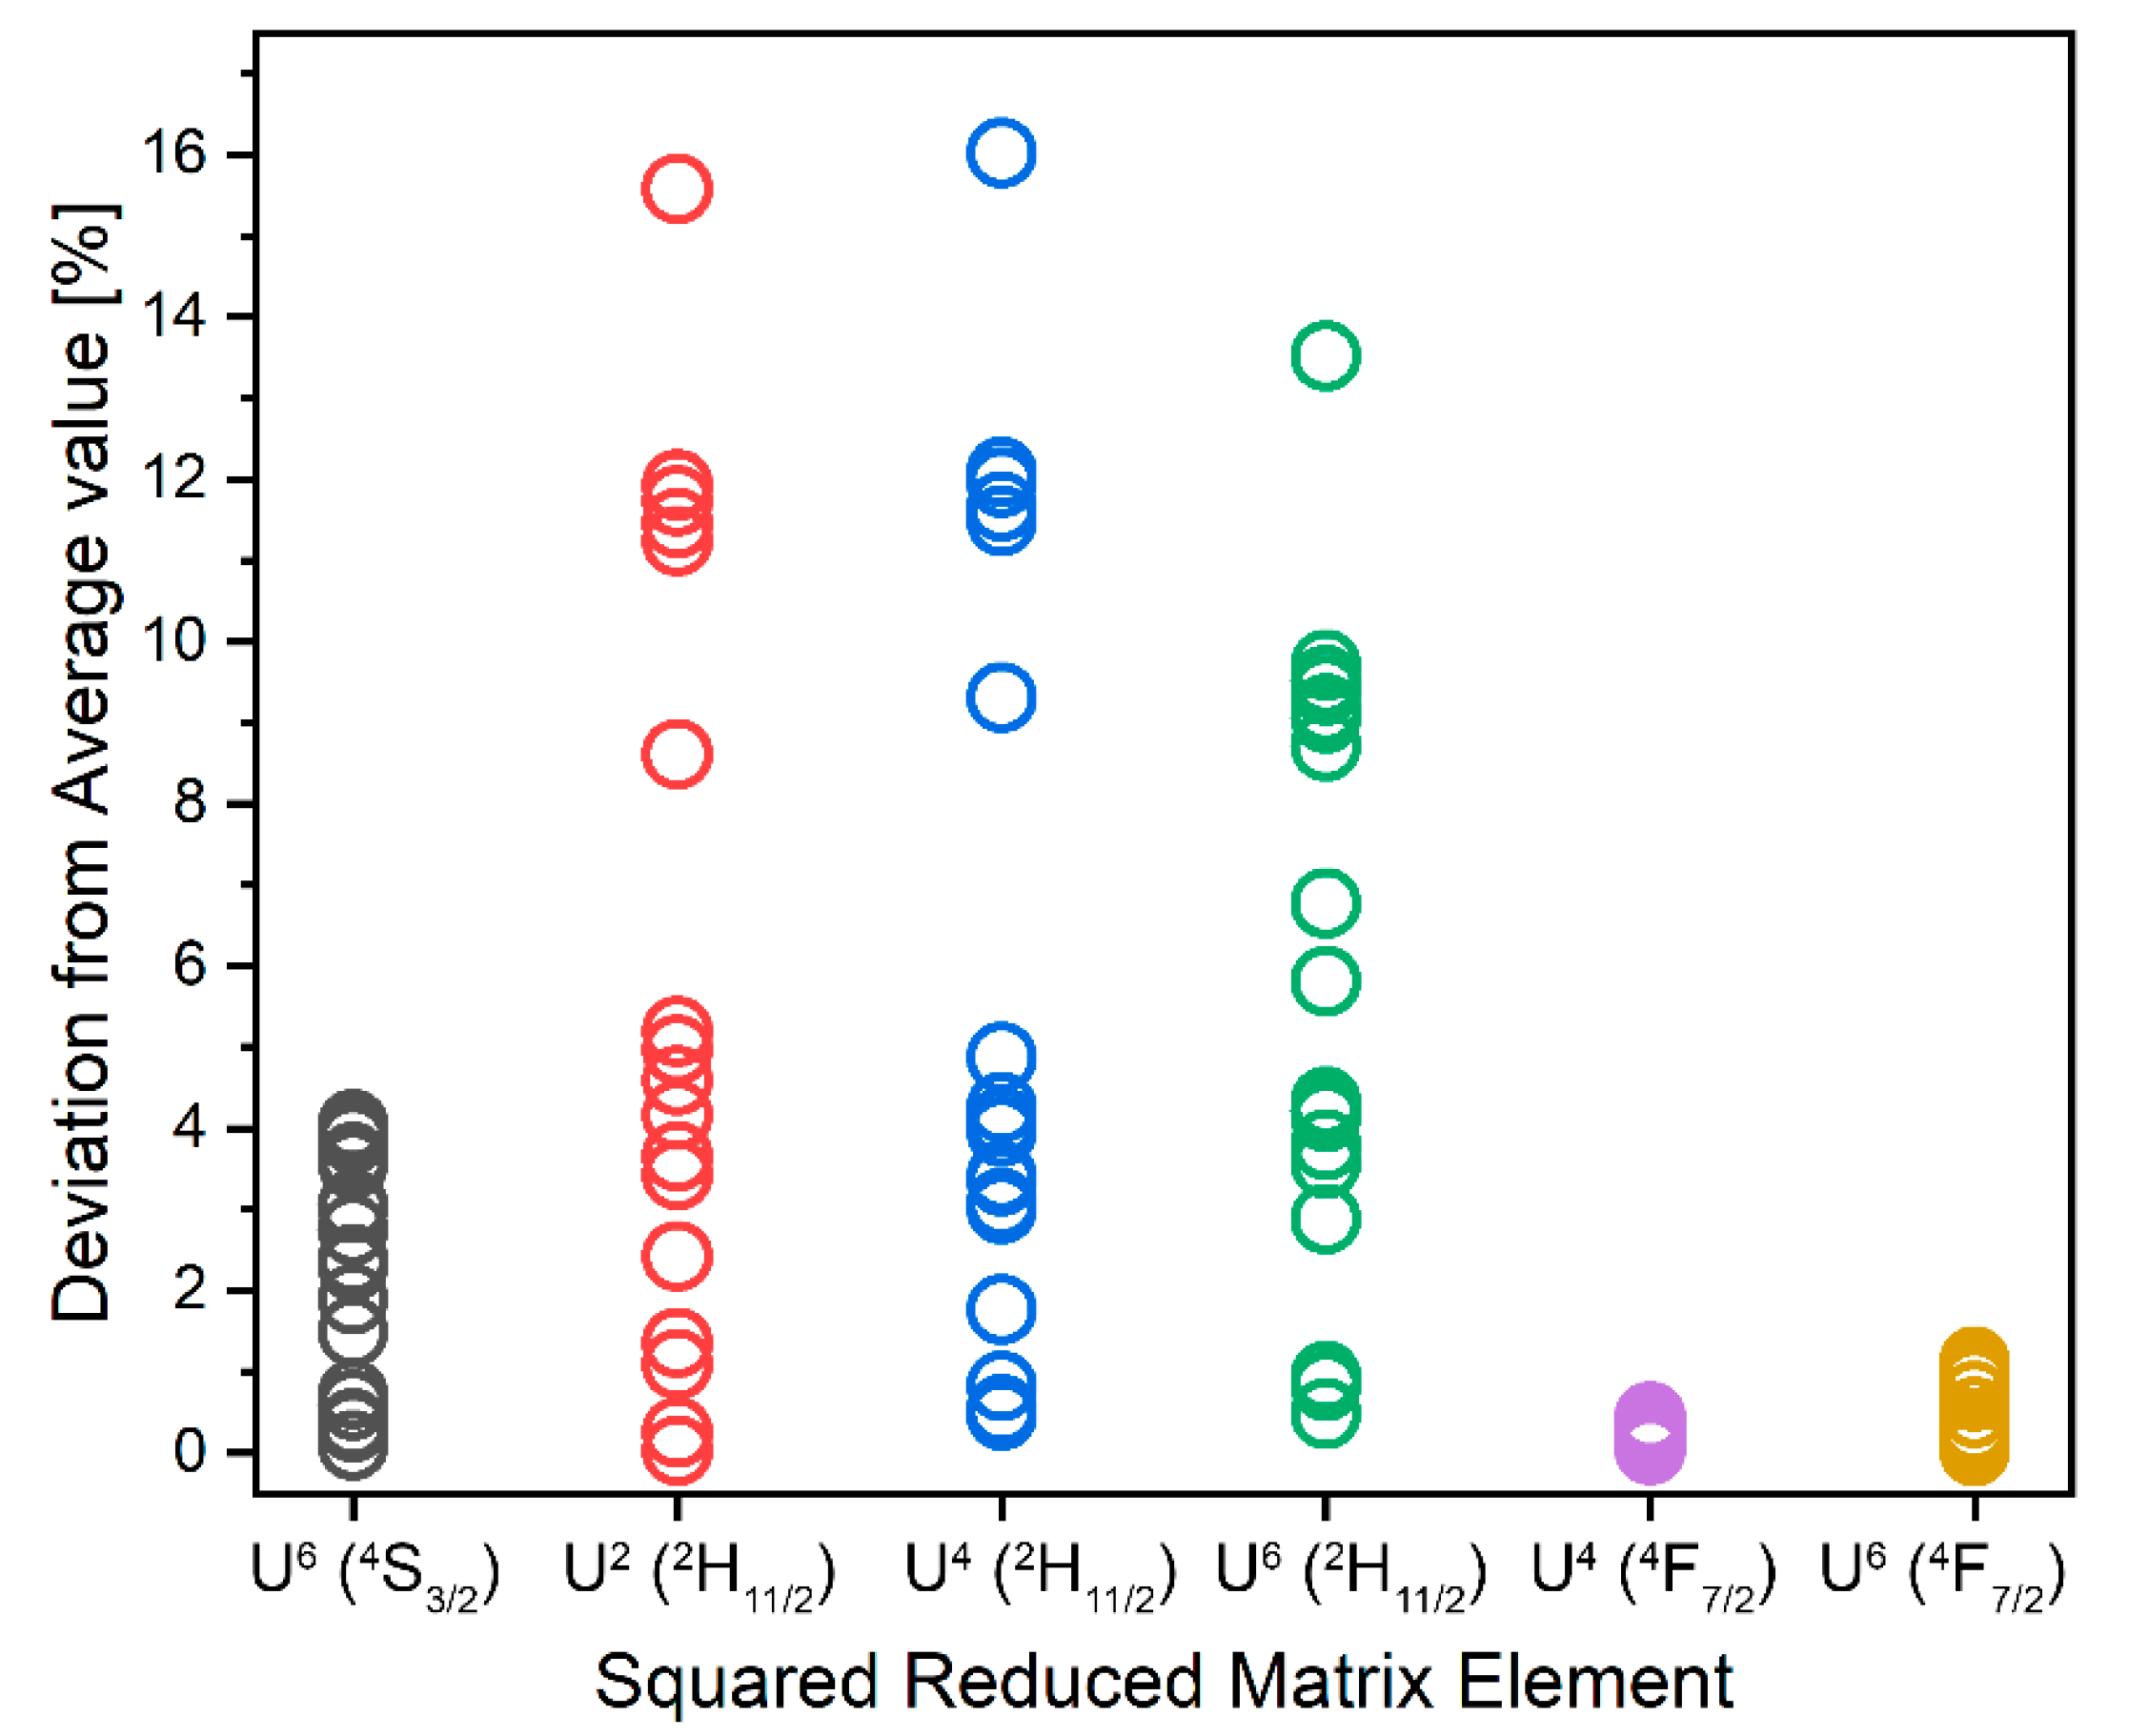
3.1. Calculations of Er3+ Radiative Properties in Different Hosts
3.2. Calculations of LIR Parameters
4. Conclusions
Author Contributions
Funding
Institutional Review Board Statement
Informed Consent Statement
Data Availability Statement
Conflicts of Interest
References
- Childs, P.R.N.; Greenwood, J.R.; Long, C.A. Review of temperature measurement. Rev. Sci. Instrum. 2000, 71, 2959–2978. [Google Scholar] [CrossRef] [Green Version]
- Gschwend, P.M.; Starsich, F.H.L.; Keitel, R.C.; Pratsinis, S.E. Nd3+-Doped BiVO4 luminescent nanothermometers of high sensitivity. Chem. Commun. 2019, 55, 7147–7150. [Google Scholar] [CrossRef] [PubMed] [Green Version]
- Wang, X.; Wolfbeis, O.S.; Meier, R.J. Luminescent probes and sensors for temperature. Chem. Soc. Rev. 2013, 42, 7834. [Google Scholar] [CrossRef] [PubMed]
- Dramićanin, M.D. Sensing temperature via downshifting emissions of lanthanide-doped metal oxides and salts. A review. Methods Appl. Fluoresc. 2016, 4, 42001. [Google Scholar] [CrossRef] [Green Version]
- Dramićanin, M.D. Luminescence Thermometry, Methods, Materials and Applications; Woodhead Publishing: Sawston, UK, 2018; ISBN 9780081020296. [Google Scholar]
- Ćirić, A.; Zeković, I.; Medić, M.; Antić, Ž.; Dramićanin, M.D. Judd-Ofelt modelling of the dual-excited single band ratiometric luminescence thermometry. J. Lumin. 2020, 225. [Google Scholar] [CrossRef]
- Dramićanin, M.D. Trends in luminescence thermometry. J. Appl. Phys. 2020, 128, 40902. [Google Scholar] [CrossRef]
- Ćirić, A.; Stojadinović, S.; Dramićanin, M.D. An extension of the Judd-Ofelt theory to the field of lanthanide thermometry. J. Lumin. 2019, 216. [Google Scholar] [CrossRef]
- Wade, S.A.; Collins, S.F.; Baxter, G.W. Fluorescence intensity ratio technique for optical fiber point temperature sensing. J. Appl. Phys. 2003, 94, 4743. [Google Scholar] [CrossRef]
- Ćirić, A.; Stojadinović, S.; Dramićanin, M.D. Custom-built thermometry apparatus and luminescence intensity ratio thermometry of ZrO2:Eu3+ and Nb2O5:Eu3+. Meas. Sci. Technol. 2019, 30, 45001. [Google Scholar] [CrossRef]
- Geitenbeek, R.G.; De Wijn, H.W.; Meijerink, A. Non-Boltzmann Luminescence in NaYF4:Eu3+: Implications for Luminescence Thermometry. Phys. Rev. Appl. 2018, 10, 1. [Google Scholar] [CrossRef] [Green Version]
- Suta, M.; Antić, Ž.; Ðorđević, V.; Kuzman, S.; Dramićanin, M.D.; Meijerink, A. Making Nd3+ a Sensitive Luminescent Thermometer for Physiological Temperatures—An Account of Pitfalls in Boltzmann Thermometry Making Nd3+ a Sensitive Luminescent Thermometer for Physiological Temperatures—An Account of Pitfalls in Boltzmann Thermomet. Nanomaterials 2020, 10, 543. [Google Scholar] [CrossRef] [PubMed] [Green Version]
- Smentek, L. Judd-Ofelt Theory—The Golden (and the Only One) Theoretical Tool of f-Electron Spectroscopy. Comput. Methods Lanthan. Actin. Chem. 2015, 241–268. [Google Scholar] [CrossRef]
- Judd, B.R. Optical Absorption Intensities of Rare-Earth Ions. Phys. Rev. 1962, 127, 750–761. [Google Scholar] [CrossRef]
- Ofelt, G.S. Intensities of Crystal Spectra of Rare-Earth Ions. J. Chem. Phys. 1962, 37, 511–520. [Google Scholar] [CrossRef]
- Görller-Walrand, C.; Binnemans, K. Chapter 167 Spectral intensities of f-f transitions; Elsevier: Amsterdam, The Netherlands, 1998; Volume 25, pp. 101–264. [Google Scholar]
- Hehlen, M.P.; Brik, M.G.; Krämer, K.W. 50th anniversary of the Judd–Ofelt theory: An experimentalist’s view of the formalism and its application. J. Lumin. 2013, 136, 221–239. [Google Scholar] [CrossRef]
- Walsh, B.M. Judd-Ofelt theory: Principles and practices brian m. walsh. Int. Sch. At. Mol. Spectrosc. 2006, 403–433. [Google Scholar] [CrossRef]
- Reisfeld, R. Optical Properties of Lanthanides in Condensed Phase, Theory and Applications. AIMS Mater. Sci. 2015, 2, 37–60. [Google Scholar] [CrossRef]
- Hamm, P.; Helbing, J.; Liu, G.; Jacquier, B.; Thermo, S.; Swart, H.C.; Terblans, J.J.; Ntwaeaborwa, O.M.; Kroon, R.E.; Coetsee, E.; et al. Spectroscopic Properties of Rare Earths in Optical Materials; Springer Series in Materials Science; Hull, R., Parisi, J., Osgood, R.M., Warlimont, H., Liu, G., Jacquier, B., Eds.; Springer: Berlin/Heidelberg, Germany, 2005; Volume 83, ISBN 3-540-23886-7. [Google Scholar]
- Edelstein, N.M. Electronic Structure of f-Block Compounds. In Organometallics of the f-Elements; Springer Netherlands: Dordrecht, The Netherlands, 1979; pp. 37–79. [Google Scholar]
- Carnall, W.T.; Crosswhite, H.; Crosswhite, H.M. Energy Level Structure and Transition Probabilities in the Spectra of the Trivalent Lanthanides in LaF3; Argonne: Lemont, IL, USA, 1978.
- Weber, M.J.; Varitimos, T.E.; Matsinger, B.H. Optical intensities of rare-earth ions in yttrium orthoaluminate. Phys. Rev. B 1973, 8, 47–53. [Google Scholar] [CrossRef]
- Tanner, P.A. Some misconceptions concerning the electronic spectra of tri-positive europium and cerium. Chem. Soc. Rev. 2013, 42, 5090. [Google Scholar] [CrossRef] [PubMed]
- Binnemans, K. Interpretation of europium(III) spectra. Coord. Chem. Rev. 2015, 295, 1–45. [Google Scholar] [CrossRef] [Green Version]
- Ćirić, A.; Stojadinović, S.; Brik, M.G.; Dramićanin, M.D. Judd-Ofelt parametrization from emission spectra: The case study of the Eu3+ 5D1 emitting level. Chem. Phys. 2020, 528. [Google Scholar] [CrossRef]
- Ćirić, A.; Stojadinović, S.; Sekulić, M.; Dramićanin, M.D. JOES: An application software for Judd-Ofelt analysis from Eu3+ emission spectra. J. Lumin. 2019, 205, 351–356. [Google Scholar] [CrossRef]
- Ćirić, A.; Stojadinović, S.; Dramićanin, M.D. Temperature and concentration dependent Judd-Ofelt analysis of Y2O3:Eu3+ and YVO4:Eu3+. Phys. B Condens. Matter 2020, 579. [Google Scholar] [CrossRef]
- Preda, E.; Stef, M.; Buse, G.; Pruna, A.; Nicoara, I. Concentration dependence of the Judd–Ofelt parameters of Er3+ ions in CaF2 crystals. Phys. Scr. 2009, 79, 035304. [Google Scholar] [CrossRef]
- Carlos, L.D.; De Mello Donegá, C.; Albuquerque, R.Q.; Alves, S.; Menezes, J.F.S.; Malta, O.L. Highly luminescent europium(III) complexes with naphtoiltrifluoroacetone and dimethyl sulphoxide. Mol. Phys. 2003, 101, 1037–1045. [Google Scholar] [CrossRef]
- dos Santos, B.F.; dos Santos Rezende, M.V.; Montes, P.J.R.; Araujo, R.M.; dos Santos, M.A.C.; Valerio, M.E.G. Spectroscopy study of SrAl2O4:Eu3+. J. Lumin. 2012, 132, 1015–1020. [Google Scholar] [CrossRef]
- Suta, M.; Meijerink, A. A Theoretical Framework for Ratiometric Single Ion Luminescent Thermometers—Thermodynamic and Kinetic Guidelines for Optimized Performance. Adv. Theory Simul. 2020, 3, 2000176. [Google Scholar] [CrossRef]
- Villanueva-Delgado, P.; Biner, D.; Krämer, K.W. Judd–Ofelt analysis of β-NaGdF4:Yb3+,Tm3+ and β-NaGdF4:Er3+ single crystals. J. Lumin. 2017, 189, 84–90. [Google Scholar] [CrossRef]
- Krupke, W.F.; Gruber, J.B. Energy Levels of Er3+ in LaF3 and Coherent Emission at 1.61 μm. J. Chem. Phys. 1964, 41, 1225–1232. [Google Scholar] [CrossRef]
- Weber, M.J. Probabilities for Radiative and Nonradiative Decay of Er3+ in LaF3. Phys. Rev. 1967, 157, 262–272. [Google Scholar] [CrossRef]
- Sardar, D.K.; Bradley, W.M.; Perez, J.J.; Gruber, J.B.; Zandi, B.; Hutchinson, J.A.; Trussell, C.W.; Kokta, M.R. Judd–Ofelt analysis of the Er3+ (4f11) absorption intensities in Er3+ −doped garnets. J. Appl. Phys. 2003, 93, 2602–2607. [Google Scholar] [CrossRef]
- Buddhudu, S.; Bryant, F. Optical transitions of Er3+:La2O2S and Er3+:Y2O2S. J. Less Common Met. 1989, 147, 213–225. [Google Scholar] [CrossRef]
- Morrison, C.A.; Leavitt, R.P. Chapter 46 Spectroscopic properties of triply ionized. In Handbook on the Physics and Chemistry of Rare Earths; Elsevier: Amsterdam, The Netherlands, 1982; Volume 5, pp. 461–692. [Google Scholar]
- Moustafa, S.Y.; Sahar, M.R.; Ghoshal, S.K. Spectroscopic attributes of Er3+ ions in antimony phosphate glass incorporated with Ag nanoparticles: Judd-Ofelt analysis. J. Alloys Compd. 2017, 712, 781–794. [Google Scholar] [CrossRef]
- Kaminskii, A.A.; Mironov, V.S.; Kornienko, A.; Bagaev, S.N.; Boulon, G.; Brenier, A.; Di Bartolo, B. New laser properties and spectroscopy of orthorhombic crystals YAlO3:Er3+. Intensity luminescence characteristics, stimulated emission, and full set of squared reduced-matrix elements |⧼α[SL]J| |U(t)||α′[S′ L′]J′⧽|2 for Er3+ Ions. Phys. Status Solidi 1995, 151, 231–255. [Google Scholar] [CrossRef]
- Chen, C.Y.; Sibley, W.A.; Yeh, D.C.; Hunt, C.A. The optical properties of Er3+ and Tm3+ in KCaF3 crystal. J. Lumin. 1989, 43, 185–194. [Google Scholar] [CrossRef]
- Weber, M.J. Radiative and Multiphonon Relaxation of Rare-Earth Ions in Y2O3. Phys. Rev. 1968, 171, 283–291. [Google Scholar] [CrossRef]
- Kisliuk, P.; Krupke, W.F.; Gruber, J.B. Spectrum of Er3+ in Single Crystals of Y2O3. J. Chem. Phys. 1964, 40, 3606–3610. [Google Scholar] [CrossRef]
- Capobianco, J.A.; Kabro, P.; Ermeneux, F.S.; Moncorgé, R.; Bettinelli, M.; Cavalli, E. Optical spectroscopy, fluorescence dynamics and crystal-field analysis of Er3+ in YVO4. Chem. Phys. 1997, 214, 329–340. [Google Scholar] [CrossRef]
- Reisfeld, R.; Katz, G.; Spector, N.; Jørgensen, C.K.; Jacoboni, C.; De Pape, R. Optical transition probabilities of Er3+ in fluoride glasses. J. Solid State Chem. 1982, 41, 253–261. [Google Scholar] [CrossRef]
- Souriau, J.C.; Borel, C.; Wyon, C.; Li, C.; Moncorgé, R. Spectroscopic properties and fluorescence dynamics of Er3+ and Yb3+ in CaYAlO4. J. Lumin. 1994, 59, 349–359. [Google Scholar] [CrossRef]
- Jamalaiah, B.C.; Suhasini, T.; Rama Moorthy, L.; Janardhan Reddy, K.; Kim, I.-G.; Yoo, D.-S.; Jang, K. Visible and near infrared luminescence properties of Er3+-doped LBTAF glasses for optical amplifiers. Opt. Mater. 2012, 34, 861–867. [Google Scholar] [CrossRef]
- Renuka Devi, A.; Jayasankar, C.K. Optical properties of Er3+ ions in lithium borate glasses and comparative energy level analyses of Er3+ ions in various glasses. J. Non. Cryst. Solids 1996, 197, 111–128. [Google Scholar] [CrossRef]
- Merino, R.I.; Orera, V.M.; Cases, R.; Chamarro, M.A. Spectroscopic characterization of Er3+ in stabilized zirconia single crystals. J. Phys. Condens. Matter 1991, 3, 8491–8502. [Google Scholar] [CrossRef]
- Amin, J.; Dussardier, B.; Schweizer, T.; Hempstead, M. Spectroscopic analysis of Er3+ transitions in lithium niobate. J. Lumin. 1996, 69, 17–26. [Google Scholar] [CrossRef]
- Nachimuthu, P.; Jagannathan, R. Judd-Ofelt Parameters, Hypersensitivity, and Emission Characteristics of Ln3+ (Nd3+, Ho3+, and Er3+) Ions Doped in PbO-PbF2 Glasses. J. Am. Ceram. Soc. 2004, 82, 387–392. [Google Scholar] [CrossRef]
- Shinn, M.D.; Sibley, W.A.; Drexhage, M.G.; Brown, R.N. Optical transitions of Er3+ ions in fluorozirconate glass. Phys. Rev. B 1983, 27, 6635–6648. [Google Scholar] [CrossRef]
- Swapna, K.; Mahamuda, S.; Venkateswarlu, M.; Srinivasa Rao, A.; Jayasimhadri, M.; Shakya, S.; Prakash, G.V. Visible, Up-conversion and NIR (~1.5μm) luminescence studies of Er3+ doped Zinc Alumino Bismuth Borate glasses. J. Lumin. 2015, 163, 55–63. [Google Scholar] [CrossRef]
- Moorthy, L.R.; Jayasimhadri, M.; Saleem, S.A.; Murthy, D.V.R. Optical properties of Er3+-doped alkali fluorophosphate glasses. J. Non. Cryst. Solids 2007, 353, 1392–1396. [Google Scholar] [CrossRef]
- Sardar, D.K.; Gruber, J.B.; Zandi, B.; Hutchinson, J.A.; Trussell, C.W. Judd–Ofelt analysis of the Er3+(4f11) absorption intensities in phosphate glass: Er3+, Yb3+. J. Appl. Phys. 2003, 93, 2041–2046. [Google Scholar] [CrossRef]
- Lalla, E.A.; Konstantinidis, M.; De Souza, I.; Daly, M.G.; Martín, I.R.; Lavín, V.; Rodríguez-Mendoza, U.R. Judd-Ofelt parameters of RE3+-doped fluorotellurite glass (RE3+ = Pr3+, Nd3+, Sm3+, Tb3+, Dy3+, Ho3+, Er3+, and Tm3+). J. Alloys Compd. 2020, 845, 156028. [Google Scholar] [CrossRef]
- Piao, R.; Wang, Y.; Zhang, Z.; Zhang, C.; Yang, X.; Zhang, D. Optical and Judd-Ofelt spectroscopic study of Er3+-doped strontium gadolinium gallium garnet single-crystal. J. Am. Ceram. Soc. 2018, jace.16114. [Google Scholar] [CrossRef]
- Che, Y.; Zheng, F.; Dou, C.; Yin, Y.; Wang, Z.; Zhong, D.; Sun, S.; Teng, B. A promising laser crystal Er3+:YPO4 with intense multi-wavelength emission characteristics. J. Alloys Compd. 2020, 157854. [Google Scholar] [CrossRef]
- Huy, B.T.; Sengthong, B.; Van Do, P.; Chung, J.W.; Ajith Kumar, G.; Quang, V.X.; Dao, V.-D.; Lee, Y.-I. A bright yellow light from a Yb3+,Er3+ -co-doped Y2SiO5 upconversion luminescence material. RSC Adv. 2016, 6, 92454–92462. [Google Scholar] [CrossRef]
- Pan, Y.; Gong, X.H.; Chen, Y.J.; Lin, Y.F.; Huang, J.H.; Luo, Z.D.; Huang, Y.D. Polarized spectroscopic properties of Er3+:BaGd2(MoO4)4 crystal. Opt. Mater. 2012, 34, 1143–1147. [Google Scholar] [CrossRef]
- Lu, X.; You, Z.; Li, J.; Zhu, Z.; Jia, G.; Wu, B.; Tu, C. The optical properties of Er3+ doped NaY(MoO4)2 crystal for laser applications around 1.5 μm. J. Alloys Compd. 2006, 426, 352–356. [Google Scholar] [CrossRef]
- Lu, H.; Gao, Y.; Hao, H.; Shi, G.; Li, D.; Song, Y.; Wang, Y.; Zhang, X. Judd-Ofelt analysis and temperature dependent upconversion luminescence of Er3+/Yb3+ codoped Gd2(MoO4)3 phosphor. J. Lumin. 2017, 186, 34–39. [Google Scholar] [CrossRef]
- Huang, X.; Wang, G. Growth and optical characteristics of Er3+:LiLa(MoO4)2 crystal. J. Alloys Compd. 2009, 475, 693–697. [Google Scholar] [CrossRef]
- Huang, X.Y.; Lin, Z.B.; Zhang, L.Z.; Wang, G.F. Spectroscopic characteristics of Er3+/Yb3+:LiLa(WO4)2 crystal. Mater. Res. Innov. 2008, 12, 94–97. [Google Scholar] [CrossRef]
- Kuleshov, N.V.; Lagatsky, A.A.; Podlipensky, A.V.; Mikhailov, V.P.; Kornienko, A.A.; Dunina, E.B.; Hartung, S.; Huber, G. Fluorescence dynamics, excited-state absorption, and stimulated emission of Er3+ in KY(WO4)2. J. Opt. Soc. Am. B 1998, 15, 1205. [Google Scholar] [CrossRef]
- Carnall, W.T.; Fields, P.R.; Rajnak, K. Electronic Energy Levels in the Trivalent Lanthanide Aquo Ions. I. Pr3+, Nd3+, Pm3+, Sm3+, Dy3+, Ho3+, Er3+, and Tm3+. J. Chem. Phys. 1968, 49, 4424–4442. [Google Scholar] [CrossRef]
- Amotchkina, T.; Trubetskov, M.; Hahner, D.; Pervak, V. Characterization of e-beam evaporated Ge, YbF3, ZnS, and LaF3 thin films for laser-oriented coatings. Appl. Opt. 2020, 59, A40. [Google Scholar] [CrossRef]
- Sell, J.A.; Fong, F.K. Oscillator strength determination in LaCl3:Pr3+ by photon upconversion. J. Chem. Phys. 1975, 62, 4161–4164. [Google Scholar] [CrossRef]
- Imanaga, S.; Yokono, S.; Hoshina, T. Cooperative absorption in Eu2O2S. J. Lumin. 1978, 16, 77–87. [Google Scholar] [CrossRef]
- Nigara, Y. Measurement of the Optical Constants of Yttrium Oxide. Jpn. J. Appl. Phys. 1968, 7, 404–408. [Google Scholar] [CrossRef]
- Shi, H.-S.; Zhang, G.; Shen, H.-Y. Measurement of principal refractive indices and the thermal refractive index coefficients of yttrium vanadate. J. Synth. Cryst. 2001, 30, 85–88. [Google Scholar]
- Pirzio, F.; Cafiso, S.D.D.D.; Kemnitzer, M.; Guandalini, A.; Kienle, F.; Veronesi, S.; Tonelli, M.; Aus der Au, J.; Agnesi, A. Sub-50-fs widely tunable Yb:CaYAlO4 laser pumped by 400-mW single-mode fiber-coupled laser diode. Opt. Express 2015, 23, 9790. [Google Scholar] [CrossRef]
- Wood, D.L.; Nassau, K. Refractive index of cubic zirconia stabilized with yttria. Appl. Opt. 1982, 21, 2978. [Google Scholar] [CrossRef] [PubMed]
- Zelmon, D.E.; Small, D.L.; Jundt, D. Infrared corrected Sellmeier coefficients for congruently grown lithium niobate and 5 mol% magnesium oxide –doped lithium niobate. J. Opt. Soc. Am. B 1997, 14, 3319. [Google Scholar] [CrossRef]
- Jayasimhadri, M.; Moorthy, L.R.; Saleem, S.A.; Ravikumar, R.V.S.S.N. Spectroscopic characteristics of Sm3+-doped alkali fluorophosphate glasses. Spectrochim. Acta Part A Mol. Biomol. Spectrosc. 2006, 64, 939–944. [Google Scholar] [CrossRef]
- Dorenbos, P.; Marsman, M.; Van Eijk, C.W.E.; Korzhik, M.V.; Mlnkov, B.I. Scintillation properties of Y2SiO5:Pr crystals 1. Radiat. Eff. Defects Solids 1995, 135, 325–328. [Google Scholar] [CrossRef]
- Jaque, D.; Findensein, J.; Montoya, E.; Capmany, J.; Kaminskii, A.A.; Eichler, H.J.; Solé, J.G. Spectroscopic and laser gain properties of the Nd3+:β′-Gd2(MoO4) 3 non-linear crystal. J. Phys. Condens. Matter 2000, 12, 9699–9714. [Google Scholar] [CrossRef]
- Huang, X.; Fang, Q.; Yu, Q.; Lü, X.; Zhang, L.; Lin, Z.; Wang, G. Thermal and polarized spectroscopic characteristics of Nd3+:LiLa(WO4)2 crystal. J. Alloys Compd. 2009, 468, 321–326. [Google Scholar] [CrossRef]
- Romanyuk, Y.E.; Borca, C.N.; Pollnau, M.; Rivier, S.; Petrov, V.; Griebner, U. Yb-doped KY(WO4)2 planar waveguide laser. Opt. Lett. 2006, 31, 53–55. [Google Scholar] [CrossRef] [PubMed] [Green Version]


| No. | Host | Abbreviation | Name | Er3+ Concentration | Form | Ref. |
|---|---|---|---|---|---|---|
| 1 * | β-NaGdF4 | Sodium Gadolinium Fluoride | 1% | C | [33] | |
| 2 | LaF3 | Lanthanum fluoride | 0.05% | C | [34,35] | |
| 3 | Y3Al5O12 | YAG | Yttrium Aluminium Garnet | 1.2 at% | C | [36] |
| 4 | LaCl3 | Lanthanum Chloride | 1% | C | [17] | |
| 5 | La2O2S | Lanthanum oxysulfide | 1 mol% | C | [37,38] | |
| 6 | Y2O2S | Yttrium oxysulfide | 1 mol% | C | [37,38] | |
| 7 | Sb2O3-35P2O5-5MgO-AgCl | SPMEA | Antimony Phosphate | 0.17 at% | G | [39] |
| 8 | YAlO3 | Yttrium Orthoaluminate | 1.5 at% | C | [40] | |
| 9 | KCaF3 | Kalium Calcium Fluoride | 1.62 at% | C | [41] | |
| 10 | Y2O3 | Yttrium oxide | 1% | C | [42,43] | |
| 11 | YVO4 | Yttrium Vanadate | 2.5% | C | [44] | |
| 12 | PbF2-GaF3-(Zn,Mn)F2 | PbZnGaLaF | Lead-Based fluoride | 0.6% | G | [45] |
| 13 * | CaYAlO4 | CYAO | Yttrium Calcium Aluminate | 0.5 at% | C | [46] |
| 14 | Gd3Ga5O12 | GGG | Gadolinium Gallium Garnet | 1.2 at% | C | [36] |
| 15 | Y3Sc2Ga3O12 | YSGG | Yttrium Scandium Gallium Garnet | 1.2 at% | C | [36] |
| 16 | PbO∙H3BO3∙TiO2∙AlF3 | LBTAF | Lead Borate Titanate Aluminium Fluoride | 4.8 at% | G | [47] |
| 17 | Li2CO3∙H3BO3 | LiBO | Lithium Borate | 1 mol% | G | [48] |
| 18 | Li2CO3∙H3BO3∙MgCO3 | MgLiBO | Magnesium Lithium Borate | 1 mol% | G | [48] |
| 19 | Li2CO3∙H3BO3∙MgCO3 | CaLiBO | Calcium Lithium Borate | 1 mol% | G | [48] |
| 20 | Li2CO3∙H3BO3∙SrCO3 | SrLiBO | Strontium Lithium Borate | 1 mol% | G | [48] |
| 21 | Li2CO3∙H3BO3∙BaCO3 | BaLiBO | Barium Lithium Borate | 1 mol% | G | [48] |
| 22 | ZrO2∙YO1.5 | YSZ | Yttria stabilized Zirconia | 0.7 at% | C | [49] |
| 23 | LiNbO3 | Lithium Niobate | 1.5 × 1019 cm−3 | C | [50] | |
| 24 | PbO-PbF2 | Oxyfluoride | 1.35 wt% | G | [51] | |
| 25 | ZrF4∙BaF2∙LaF3∙AlF3 | ZBLA | Fluorozirconate | 0.5% | G | [52] |
| 26 | ZnO∙Al2O3∙Bi2O3∙B2O3 | ZnAlBiB | Zinc Alumino Bismuth Borate | 0.5 mol% | G | [53] |
| 27 | NaPO3∙TeO2∙AlF3∙LiF | LiTFP | Lithium Fluorophosphate | 0.12 at% | G | [54] |
| 28 | NaPO3∙TeO2∙AlF3∙NaF | NaTFP | Sodium Fluorophosphate | 0.12 at% | G | [54] |
| 29 | NaPO3∙TeO2∙AlF3∙KF | KTFP | Kalium Fluorophosphate | 0.12 at% | G | [54] |
| 30 | Kigre patented | Phosphate | 1.51 wt% | G | [55] | |
| 31 | TeO2∙PbF2∙AlF3 | Fluoro-tellurite | 0.625 at% | G | [56] | |
| 32 | SrGdGa3O7 | Strontium Gadolinium Gallium Garnet | 4.2 × 1021 cm−3 | C | [57] | |
| 33 | YPO4 | Yttrium Phosphate | 0.6 at% | C | [58] | |
| 34 | Y2SiO5 | YSO | Yttrium Orthosilicate | 2 mol%b | C | [59] |
| 35 | BaGd2(MoO4)4 | BGM | Barium Gadolinium Molybdate | 1.4 at% | C | [60] |
| 36 | NaY(MoO4)2 | NYM | Sodium Yttrium Molybdate | 1.25 at% | C | [61] |
| 37 | Gd2(MoO4)3 | Gadolinium Molybdate | 1% | C | [62] | |
| 38 | LiLa(MoO4)2 | Lithium Lanthanum Molybdate | 0.55 at% | C | [63] | |
| 39 * | LiLa(WO4)2 | Lithium Lanthanum Tungstanate | 0.65% | C | [64] | |
| 40 | KY(WO4)2 | Kalium Yttrium Tungstanate | 0.5% | C | [65] |
| No. | Host | Energy [cm−1] | Slater Integrals and s–o [cm−1] | JO Parameters × 1020 [cm2] | |||||||
|---|---|---|---|---|---|---|---|---|---|---|---|
| 4S3/2 | 2H11/2 | 4F7/2 | F2 | F-4 | F6 | ζ | Ω2 | Ω4 | Ω6 | ||
| 1 | β–NaGdF4 | 18459 | 19186 | 20483 | 429.4 | 68.7 | 7.1 | 2403 | 4.97 | 1.16 | 2.03 |
| 2 | LaF3 | 18353 | 19118 | 20412 | 435.7 | 67.2 | 7.4 | 2351 | 3.9 | 1.0 | 2.3 |
| 3 | YAG | 18166 | 18967 | 20344 | 433.2 | 65.0 | 6.5 | 2345 | 0.74 | 0.92 | 0.70 |
| 4 | LaCl3 | 18383 | 19068 | 20414 | 433.2 | 66.9 | 7.3 | 2386 | 5.45 | 2.08 | 0.69 |
| 5 | La2O2S | 18236 | 18930 | 20320 | 445.8 | 66.6 | 7.5 | 2395 | 4.32 | 2.32 | 1.17 |
| 6 | Y2O2S | 18236 | 18930 | 20320 | 444.0 | 68.1 | 7.4 | 2391 | 2.71 | 2.10 | 1.85 |
| 7 d | SPMEA | 18182 | 19175 | 20576 | NA | NA | NA | NA | 7.89 | 3.27 | 1.07 |
| 8 | YAlO3 | 18350 | 19150 | 20300 | NA | NA | NA | NA | 0.95 | 0.58 | 0.55 |
| 9 d | KCaF3 | 18450 | 19305 | 20576 | NA | NA | NA | NA | 0.74 | 0.87 | 0.57 |
| 10 b | Y2O3 | 18071 | 18931 | 20266 | 429.6 | 65.0 | 7.1 | 2383 | 4.59 | 1.21 | 0.48 |
| 11 b | YVO4 | 18209 | 19059 | 20371 | 440.8 | 66.8 | 7.3 | 2381 | 13.45 | 2.23 | 1.67 |
| 12 | PbZnGaLaF | 18552 | 19193 | 20618 | 444.0 | 64.6 | 6.9 | 2395 | 1.54 | 1.13 | 1.19 |
| 13 | CYAO | 18298 | 19040 | 20454 | NA | NA | NA | NA | 3.78 | 2.52 | 1.91 |
| 14 c | GGG | 18450 | 19168 | 20387 | NA | NA | NA | NA | 0.70 | 0.37 | 0.86 |
| 15 c | YSGG | 18433 | 19127 | 20345 | NA | NA | NA | NA | 0.92 | 0.48 | 0.87 |
| 16 a | LBTAF | 18382 | 19194 | 20450 | 433.9 | 67.0 | 6.7 | 2386 | 5.89 | 1.10 | 1.47 |
| 17 a | LiBO | 18413 | 19205 | 20488 | 437.8 | 65.1 | 6.8 | 2377 | 3.24 | 0.92 | 0.82 |
| 18 a | MgLiBO | 18389 | 19168 | 20462 | 437.8 | 64.5 | 6.8 | 2373 | 1.33 | 0.39 | 0.62 |
| 19 a | CaLiBO | 18413 | 19205 | 20488 | 438.2 | 64.9 | 6.8 | 2376 | 3.68 | 0.76 | 1.52 |
| 20 a | SrLiBO | 18413 | 19205 | 20488 | 438.6 | 64.7 | 6.8 | 2381 | 2.53 | 0.39 | 1.10 |
| 21 a | BaLiBO | 18403 | 19205 | 20488 | 438.2 | 64.9 | 6.8 | 2382 | 1.80 | 0.28 | 0.90 |
| 22 c | YSZ | 18416 | 19342 | 20534 | NA | NA | NA | NA | 1.50 | 0.50 | 0.22 |
| 23 c | LiNbO3 | 18248 | 19047 | 20492 | NA | NA | NA | NA | 7.29 | 2.24 | 1.27 |
| 24 a | PbO-PbF2 | 18501 | 19297 | 20601 | 437.8 | 66.6 | 7.3 | 2461 | 3.22 | 1.34 | 0.61 |
| 25 | ZBLA | 18450 | 19193 | 20534 | NA | NA | NA | NA | 2.54 | 1.39 | 0.97 |
| 26 c | ZnAlBiB | 18484 | 19193 | 20491 | NA | NA | NA | NA | 2.10 | 1.53 | 1.43 |
| 27 | LiTFP | 18344 | 19189 | 20486 | NA | NA | NA | NA | 4.70 | 1.21 | 1.30 |
| 28 | NaTFP | 18377 | 19226 | 20486 | NA | NA | NA | NA | 5.92 | 1.07 | 1.44 |
| 29 | KTFP | 18377 | 19226 | 20486 | NA | NA | NA | NA | 5.09 | 0.69 | 1.45 |
| 30 | Kigre patented | 18350 | 19150 | 20300 | NA | NA | NA | NA | 6.28 | 1.03 | 1.39 |
| 31 c | TeO2∙PbF2∙AlF3 | 18332 | 18957 | 20434 | NA | NA | NA | NA | 5.52 | 2.07 | 1.00 |
| 32 | SrGdGa3O7 | 18135 | 19131 | 20411 | NA | NA | NA | NA | 2.46 | 1.24 | 0.51 |
| 33 | YPO4 | 18348 | 19083 | 20449 | 435.7 | 67.2 | 7.4 | 2351 | 3.02 | 3.07 | 2.58 |
| 34 e | YSO | 18348 | 19083 | 20449 | NA | NA | NA | NA | 1.29 | 0.29 | 2.78 |
| 35 c | BGM | 18348 | 19083 | 20408 | NA | NA | NA | NA | 12.33 | 1.96 | 0.96 |
| 36 c | NYM | 18148 | 19157 | 20449 | NA | NA | NA | NA | 13.34 | 1.69 | 2.29 |
| 37 | Gd2(MoO4)3 | 18348 | 19157 | 20449 | NA | NA | NA | NA | 11.74 | 8.16 | 3.98 |
| 38 | LiLa(MoO4)2 | 18348 | 19157 | 20449 | NA | NA | NA | NA | 8.07 | 1.06 | 0.83 |
| 39 | LiLa(WO4)2 | 18348 | 19047 | 20345 | NA | NA | NA | NA | 9.03 | 2.02 | 0.59 |
| 40 | KY(WO4)2 | 18420 | 19190 | 20450 | NA | NA | NA | NA | 7.08 | 2.30 | 1.01 |
| No. | Initial Level | Squared RME | n | χED (Emission) | Ref. for n | D [esu2 cm2] × 1040 | ||
|---|---|---|---|---|---|---|---|---|
| U2 | U4 | U6 | ||||||
| 1 b | 4S3/2 | 0 | 0 | 0.2216 | 1.499 | 3.00 | [33] | 10.38 |
| 2H11/2 | 0.7247 | 0.4159 | 0.0925 | 1.499 | 3.00 | 98.55 | ||
| 4F7/2 | 0 | 0.1461 | 0.6298 | 1.499 | 3.00 | 33.40 | ||
| 2 | 4S3/2 | 0 | 0 | 0.2275 | 1.516 | 3.11 | [67] | 12.07 |
| 2H11/2 | 0.7141 | 0.4112 | 0.0867 | 1.518 | 3.12 | 78.33 | ||
| 4F7/2 | 0 | 0.1473 | 0.6285 | 1.522 | 3.15 | 36.75 | ||
| 3 | 4S3/2 | 0 | 0 | 0.2134 | 1.836 | 5.88 | [36] | 3.45 |
| 2H11/2 | 0.5816 | 0.3350 | 0.0756 | 1.838 | 5.91 | 18.26 | ||
| 4F7/2 | 0 | 0.1465 | 0.6192 | 1.842 | 5.95 | 13.11 | ||
| 4 b | 4S3/2 | 0 | 0 | 0.2226 | 1.7 | 4.52 | [68] | 3.54 |
| 2H11/2 | 0.7205 | 0.4152 | 0.0911 | 1.7 | 4.52 | 111.96 | ||
| 4F7/2 | 0 | 0.1467 | 0.6274 | 1.7 | 4.52 | 17.03 | ||
| 5 b | 4S3/2 | 0 | 0 | 0.2240 | 2.2 | 11.44 | [69] | 6.05 |
| 2H11/2 | 0.6872 | 0.3971 | 0.0849 | 2.2 | 11.44 | 92.03 | ||
| 4F7/2 | 0 | 0.1474 | 0.6247 | 2.2 | 11.44 | 24.75 | ||
| 6 b | 4S3/2 | 0 | 0 | 0.2257 | 2.2 | 11.44 | [69] | 9.63 |
| 2H11/2 | 0.6891 | 0.3968 | 0.0841 | 2.2 | 11.44 | 65.89 | ||
| 4F7/2 | 0 | 0.1472 | 0.6272 | 2.2 | 11.44 | 33.90 | ||
| 7 c | 4S3/2 | 0 | 0 | 0.2211 | 2.35 | 14.70 | [39] | 5.64 |
| 2H11/2 | 0.7125 | 0.4123 | 0.0925 | 2.35 | 14.70 | 161.57 | ||
| 4F7/2 | 0 | 0.1468 | 0.6266 | 2.35 | 14.70 | 26.55 | ||
| 8 a | 4S3/2 | 0 | 0 | 0.2211 | 1.946 | 7.24 | [40,41] | 2.81 |
| 2H11/2 | 0.7125 | 0.4123 | 0.0925 | 1.948 | 7.27 | 22.30 | ||
| 4F7/2 | 0 | 0.1468 | 0.6266 | 1.953 | 7.34 | 9.91 | ||
| 9 | 4S3/2 | 0 | 0 | 0.2285 | 1.402 | 2.45 | [35] | 3.00 |
| 2H11/2 | 0.7056 | 0.4109 | 0.0870 | 1.404 | 2.46 | 21.44 | ||
| 4F7/2 | 0 | 0.1467 | 0.6273 | 1.406 | 2.47 | 11.19 | ||
| 10 | 4S3/2 | 0 | 0 | 0.2171 | 1.938 | 7.13 | [70] | 2.40 |
| 2H11/2 | 0.6964 | 0.4022 | 0.0912 | 1.942 | 7.19 | 85.98 | ||
| 4F7/2 | 0 | 0.1464 | 0.6238 | 1.948 | 7.27 | 10.99 | ||
| 11 | 4S3/2 | 0 | 0 | 0.2231 | 2.017 | 8.25 | [71] | 8.59 |
| 2H11/2 | 0.6796 | 0.3919 | 0.0843 | 2.023 | 8.34 | 234.27 | ||
| 4F7/2 | 0 | 0.1471 | 0.6253 | 2.036 | 8.54 | 31.66 | ||
| 12 b | 4S3/2 | 0 | 0 | 0.2182 | 1.611 | 3.78 | [45] | 5.99 |
| 2H11/2 | 0.6547 | 0.3795 | 0.0838 | 1.611 | 3.78 | 35.45 | ||
| 4F7/2 | 0 | 0.1471 | 0.6200 | 1.611 | 3.78 | 20.85 | ||
| 13 bd | 4S3/2 | 0 | 0 | 0.2285 | 1.85 | 6.04 | [72] | 10.07 |
| 2H11/2 | 0.7056 | 0.4109 | 0.0870 | 1.85 | 6.04 | 89.25 | ||
| 4F7/2 | 0 | 0.1467 | 0.6273 | 1.85 | 6.04 | 36.17 | ||
| 14 ac | 4S3/2 | 0 | 0 | 0.2211 | 1.987 | 7.81 | [36] | 4.39 |
| 2H11/2 | 0.7125 | 0.4123 | 0.0925 | 1.982 | 7.74 | 16.86 | ||
| 4F7/2 | 0 | 0.1468 | 0.6266 | 1.998 | 7.97 | 13.68 | ||
| 15 ac | 4S3/2 | 0 | 0 | 0.2211 | 1.944 | 7.21 | [36] | 4.44 |
| 2H11/2 | 0.7125 | 0.4123 | 0.0925 | 1.948 | 7.27 | 21.54 | ||
| 4F7/2 | 0 | 0.1468 | 0.6266 | 1.954 | 7.35 | 14.20 | ||
| 16 b | 4S3/2 | 0 | 0 | 0.2157 | 1.564 | 3.44 | [47] | 7.31 |
| 2H11/2 | 0.6296 | 0.3618 | 0.0815 | 1.564 | 3.44 | 97.49 | ||
| 4F7/2 | 0 | 0.1463 | 0.6235 | 1.564 | 3.44 | 24.86 | ||
| 17 b | 4S3/2 | 0 | 0 | 0.2145 | 1.478 | 2.88 | [48] | 4.06 |
| 2H11/2 | 0.6115 | 0.3531 | 0.0795 | 1.478 | 2.88 | 54.70 | ||
| 4F7/2 | 0 | 0.1466 | 0.6196 | 1.478 | 2.88 | 14.83 | ||
| 18 b | 4S3/2 | 0 | 0 | 0.2138 | 1.476 | 2.86 | [48] | 3.06 |
| 2H11/2 | 0.6068 | 0.3507 | 0.0792 | 1.476 | 2.86 | 22.91 | ||
| 4F7/2 | 0 | 0.1467 | 0.6185 | 1.476 | 2.86 | 10.17 | ||
| 19 b | 4S3/2 | 0 | 0 | 0.2143 | 1.480 | 2.89 | [48] | 7.51 |
| 2H11/2 | 0.6081 | 0.3512 | 0.0791 | 1.480 | 2.89 | 60.55 | ||
| 4F7/2 | 0 | 0.1467 | 0.6191 | 1.480 | 2.89 | 24.28 | ||
| 20 b | 4S3/2 | 0 | 0 | 0.2135 | 1.479 | 2.88 | [48] | 5.42 |
| 2H11/2 | 0.6067 | 0.3507 | 0.0794 | 1.479 | 2.88 | 40.58 | ||
| 4F7/2 | 0 | 0.1466 | 0.6184 | 1.479 | 2.88 | 17.01 | ||
| 21 b | 4S3/2 | 0 | 0 | 0.2137 | 1.481 | 2.89 | [48] | 4.44 |
| 2H11/2 | 0.6100 | 0.3524 | 0.0798 | 1.481 | 2.89 | 29.26 | ||
| 4F7/2 | 0 | 0.1466 | 0.6190 | 1.481 | 2.89 | 13.80 | ||
| 22 c | 4S3/2 | 0 | 0 | 0.2211 | 2.167 | 10.80 | [73] | 1.12 |
| 2H11/2 | 0.7125 | 0.4123 | 0.0925 | 2.172 | 10.89 | 29.88 | ||
| 4F7/2 | 0 | 0.1468 | 0.6266 | 2.180 | 11.04 | 4.87 | ||
| 23 c | 4S3/2 | 0 | 0 | 0.2211 | 2.316 | 13.95 | [74] | 6.48 |
| 2H11/2 | 0.7125 | 0.4123 | 0.0925 | 2.331 | 14.31 | 143.84 | ||
| 4F7/2 | 0 | 0.1468 | 0.6266 | 2.349 | 14.75 | 25.94 | ||
| 24 b | 4S3/2 | 0 | 0 | 0.2156 | 1.779 | 5.27 | [51] | 3.03 |
| 2H11/2 | 0.7176 | 0.4147 | 0.0959 | 1.779 | 5.27 | 67.47 | ||
| 4F7/2 | 0 | 0.1461 | 0.6243 | 1.779 | 5.27 | 13.30 | ||
| 25 d | 4S3/2 | 0 | 0 | 0.2285 | 1.518 | 3.12 | [52] | 5.11 |
| 2H11/2 | 0.7056 | 0.4109 | 0.0870 | 1.519 | 3.13 | 56.47 | ||
| 4F7/2 | 0 | 0.1467 | 0.6273 | 1.520 | 3.14 | 18.74 | ||
| 26 b | 4S3/2 | 0 | 0 | 0.2211 | 1.819 | 5.70 | [53] | 7.29 |
| 2H11/2 | 0.7125 | 0.4123 | 0.0925 | 1.819 | 5.70 | 52.12 | ||
| 4F7/2 | 0 | 0.1468 | 0.6266 | 1.819 | 5.70 | 25.85 | ||
| 27 bd | 4S3/2 | 0 | 0 | 0.2285 | 1.584 | 3.58 | [75] | 6.85 |
| 2H11/2 | 0.7056 | 0.4109 | 0.0870 | 1.584 | 3.58 | 90.58 | ||
| 4F7/2 | 0 | 0.1467 | 0.6273 | 1.584 | 3.58 | 22.91 | ||
| 28 bd | 4S3/2 | 0 | 0 | 0.2285 | 1.587 | 3.60 | [75] | 7.59 |
| 2H11/2 | 0.7056 | 0.4109 | 0.0870 | 1.587 | 3.60 | 109.39 | ||
| 4F7/2 | 0 | 0.1467 | 0.6273 | 1.587 | 3.60 | 24.46 | ||
| 29 bd | 4S3/2 | 0 | 0 | 0.2285 | 1.588 | 3.61 | [75] | 7.64 |
| 2H11/2 | 0.7056 | 0.4109 | 0.0870 | 1.588 | 3.61 | 92.30 | ||
| 4F7/2 | 0 | 0.1467 | 0.6273 | 1.588 | 3.61 | 23.32 | ||
| 30 a | 4S3/2 | 0 | 0 | 0.2211 | 1.581 | 3.56 | [55] | 7.09 |
| 2H11/2 | 0.7125 | 0.4125 | 0.0925 | 1.587 | 3.60 | 115.99 | ||
| 4F7/2 | 0 | 0.1469 | 0.6266 | 1.599 | 3.69 | 23.58 | ||
| 31 bc | 4S3/2 | 0 | 0 | 0.2211 | 2.116 | 9.86 | [56] | 5.10 |
| 2H11/2 | 0.7125 | 0.4123 | 0.0925 | 2.116 | 9.86 | 112.55 | ||
| 4F7/2 | 0 | 0.1468 | 0.6266 | 2.116 | 9.86 | 21.46 | ||
| 32 bd | 4S3/2 | 0 | 0 | 0.2285 | 1.831 | 5.83 | [57] | 2.69 |
| 2H11/2 | 0.7056 | 0.4109 | 0.0870 | 1.831 | 5.83 | 52.82 | ||
| 4F7/2 | 0 | 0.1467 | 0.6273 | 1.831 | 5.83 | 11.58 | ||
| 33 b | 4S3/2 | 0 | 0 | 0.2275 | 1.77 | 5.18 | [58] | 13.54 |
| 2H11/2 | 0.7141 | 0.4112 | 0.0866 | 1.77 | 5.18 | 84.03 | ||
| 4F7/2 | 0 | 0.1473 | 0.6285 | 1.77 | 5.18 | 47.84 | ||
| 34 bd | 4S3/2 | 0 | 0 | 0.2285 | 1.8 | 5.49 | [76] | 14.65 |
| 2H11/2 | 0.7056 | 0.4109 | 0.0870 | 1.8 | 5.49 | 29.33 | ||
| 4F7/2 | 0 | 0.1467 | 0.6273 | 1.8 | 5.49 | 41.21 | ||
| 35 bc | 4S3/2 | 0 | 0 | 0.2211 | 2.02 | 8.30 | [60] | 4.90 |
| 2H11/2 | 0.7125 | 0.4123 | 0.0925 | 2.02 | 8.30 | 223.35 | ||
| 4F7/2 | 0 | 0.1468 | 0.6266 | 2.02 | 8.30 | 20.51 | ||
| 36 c | 4S3/2 | 0 | 0 | 0.2211 | 2.01 | 8.15 | [61] | 11.68 |
| 2H11/2 | 0.7125 | 0.4123 | 0.0925 | 2.00 | 8.00 | 240.22 | ||
| 4F7/2 | 0 | 0.1468 | 0.6266 | 2.00 | 8.00 | 38.82 | ||
| 37 ad | 4S3/2 | 0 | 0 | 0.2211 | 2.16 | 10.66 | [55,77] | 20.30 |
| 2H11/2 | 0.7125 | 0.4125 | 0.0925 | 2.16 | 10.66 | 279.11 | ||
| 4F7/2 | 0 | 0.1469 | 0.6266 | 2.16 | 10.66 | 85.18 | ||
| 38 d | 4S3/2 | 0 | 0 | 0.2285 | 2.05 | 8.76 | [63] | 4.38 |
| 2H11/2 | 0.7056 | 0.4109 | 0.0870 | 2.05 | 8.76 | 143.07 | ||
| 4F7/2 | 0 | 0.1467 | 0.6273 | 2.05 | 8.76 | 15.60 | ||
| 39 bd | 4S3/2 | 0 | 0 | 0.2285 | 2.0 | 8.00 | [78] | 3.11 |
| 2H11/2 | 0.7056 | 0.4109 | 0.0870 | 2.0 | 8.00 | 167.32 | ||
| 4F7/2 | 0 | 0.1467 | 0.6273 | 2.0 | 8.00 | 15.37 | ||
| 40 bd | 4S3/2 | 0 | 0 | 0.2285 | 2.0 | 8.00 | [79] | 5.32 |
| 2H11/2 | 0.7056 | 0.4109 | 0.0870 | 2.0 | 8.00 | 139.07 | ||
| 4F7/2 | 0 | 0.1467 | 0.6273 | 2.0 | 8.00 | 22.40 | ||
| Initial Level | U2 | U4 | U6 | U2(C) | U4(C) | U6(C) | U2(W) | U4(W) | U6(W) |
|---|---|---|---|---|---|---|---|---|---|
| 4S3/2 | 0 | 0 | 0.2224 | 0 | 0 | 0.6 | 0 | 0 | 2.7 |
| 2H11/2 | 0.6889 | 0.3989 | 0.0874 | 3.3 | 3.3 | 5.5 | 2.4 | 2.9 | 0.5 |
| 4F7/2 | 0 | 0.1468 | 0.6254 | 0 | 0 | 0.2 | 0 | 0.1 | 0.3 |
| No. | Higher Level | ΔE | Sr (300 K) [% K−1] | B | Sa (300 K) [K−1] | max(Sa) [K−1] | T(max(Sa)) [K] (°C) | Sr (T(max(Sa)) [% K−1] |
|---|---|---|---|---|---|---|---|---|
| 1 | 2H11/2 | 727 | 1.16 | 10.66 | 0.003792 | 0.0055 | 523 (250) | 0.38 |
| 4F7/2 | 2024 | 3.24 | 4.40 | 0.000009 | 0.0008 | 1456 (1183) | 0.14 | |
| 2 | 2H11/2 | 765 | 1.22 | 7.37 | 0.002297 | 0.0036 | 550 (277) | 0.36 |
| 4F7/2 | 2059 | 3.29 | 4.24 | 0.000007 | 0.0008 | 1481 (1208) | 0.14 | |
| 3 | 2H11/2 | 801 | 1.28 | 6.05 | 0.001663 | 0.0028 | 576 (303) | 0.35 |
| 4F7/2 | 2178 | 3.48 | 5.40 | 0.000005 | 0.0009 | 1567 (1294) | 0.13 | |
| 4 | 2H11/2 | 685 | 1.10 | 35.26 | 0.014453 | 0.0194 | 493 (220) | 0.41 |
| 4F7/2 | 2031 | 3.25 | 6.58 | 0.000013 | 0.0012 | 1461 (1188) | 0.14 | |
| 5 | 2H11/2 | 694 | 1.10 | 17.03 | 0.006772 | 0.0092 | 499 (226) | 0.40 |
| 4F7/2 | 2084 | 3.30 | 5.66 | 0.000009 | 0.0010 | 1499 (1226) | 0.13 | |
| 6 | 2H11/2 | 694 | 1.10 | 7.65 | 0.003043 | 0.0042 | 499 (226) | 0.40 |
| 4F7/2 | 2084 | 3.30 | 4.87 | 0.000007 | 0.0009 | 1499 (1226) | 0.13 | |
| 7 | 2H11/2 | 993 | 1.59 | 33.60 | 0.004557 | 0.0128 | 714 (441) | 0.28 |
| 4F7/2 | 2394 | 3.83 | 6.82 | 0.000003 | 0.0011 | 1722 (1449) | 0.12 | |
| 8 | 2H11/2 | 800 | 1.28 | 9.07 | 0.002501 | 0.0043 | 576 (303) | 0.35 |
| 4F7/2 | 1950 | 3.12 | 4.85 | 0.000013 | 0.0009 | 1403 (1130) | 0.14 | |
| 9 | 2H11/2 | 855 | 1.37 | 8.21 | 0.001858 | 0.0036 | 615 (342) | 0.33 |
| 4F7/2 | 2126 | 3.40 | 5.21 | 0.000007 | 0.0009 | 1529 (1256) | 0.13 | |
| 10 | 2H11/2 | 860 | 1.37 | 41.42 | 0.009209 | 0.0181 | 619 (346) | 0.32 |
| 4F7/2 | 2195 | 3.51 | 6.57 | 0.000006 | 0.0011 | 1579 (1306) | 0.13 | |
| 11 | 2H11/2 | 850 | 1.36 | 31.60 | 0.007284 | 0.0140 | 612 (339) | 0.33 |
| 4F7/2 | 2162 | 3.46 | 5.34 | 0.000006 | 0.0009 | 1555 (1282) | 0.13 | |
| 12 | 2H11/2 | 641 | 1.02 | 6.55 | 0.003104 | 0.0038 | 461 (188) | 0.43 |
| 4F7/2 | 2066 | 3.30 | 4.78 | 0.000008 | 0.0009 | 1486 (1213) | 0.13 | |
| 13 | 2H11/2 | 742 | 1.19 | 9.99 | 0.003373 | 0.0051 | 534 (261) | 0.37 |
| 4F7/2 | 2156 | 3.45 | 5.02 | 0.000006 | 0.0009 | 1551 (1278) | 0.13 | |
| 14 | 2H11/2 | 718 | 1.15 | 4.27 | 0.001566 | 0.0022 | 517 (244) | 0.39 |
| 4F7/2 | 1937 | 3.10 | 4.29 | 0.000012 | 0.0008 | 1394 (1121) | 0.14 | |
| 15 | 2H11/2 | 694 | 1.11 | 5.46 | 0.002173 | 0.0030 | 499 (226) | 0.40 |
| 4F7/2 | 1912 | 3.06 | 4.38 | 0.000014 | 0.0009 | 1376 (1103) | 0.15 | |
| 16 | 2H11/2 | 812 | 1.30 | 15.17 | 0.004009 | 0.0070 | 584 (311) | 0.34 |
| 4F7/2 | 2068 | 3.31 | 4.68 | 0.000008 | 0.0009 | 1488 (1215) | 0.13 | |
| 17 | 2H11/2 | 792 | 1.27 | 15.30 | 0.004339 | 0.0073 | 570 (297) | 0.35 |
| 4F7/2 | 2075 | 3.32 | 5.04 | 0.000008 | 0.0009 | 1493 (1220) | 0.13 | |
| 18 | 2H11/2 | 779 | 1.25 | 8.48 | 0.002519 | 0.0041 | 560 (287) | 0.36 |
| 4F7/2 | 2073 | 3.31 | 4.58 | 0.000007 | 0.0008 | 1491 (1218) | 0.13 | |
| 19 | 2H11/2 | 792 | 1.27 | 9.14 | 0.002594 | 0.0043 | 570 (297) | 0.35 |
| 4F7/2 | 2075 | 3.32 | 4.45 | 0.000007 | 0.0008 | 1493 (1220) | 0.13 | |
| 20 | 2H11/2 | 792 | 1.27 | 8.50 | 0.002411 | 0.0040 | 570 (297) | 0.35 |
| 4F7/2 | 2075 | 3.32 | 4.33 | 0.000007 | 0.0008 | 1493 (1220) | 0.13 | |
| 21 | 2H11/2 | 802 | 1.28 | 7.50 | 0.002052 | 0.0035 | 577 (304) | 0.35 |
| 4F7/2 | 2085 | 3.33 | 4.29 | 0.000006 | 0.0008 | 1500 (1227) | 0.13 | |
| 22 | 2H11/2 | 926 | 1.48 | 31.12 | 0.005428 | 0.0126 | 666 (393) | 0.30 |
| 4F7/2 | 2118 | 3.39 | 6.16 | 0.000008 | 0.0011 | 1524 (1251) | 0.13 | |
| 23 | 2H11/2 | 799 | 1.28 | 25.90 | 0.007167 | 0.0122 | 575 (302) | 0.35 |
| 4F7/2 | 2244 | 3.59 | 6.00 | 0.000005 | 0.0010 | 1614 (1341) | 0.12 | |
| 24 | 2H11/2 | 796 | 1.27 | 25.24 | 0.007058 | 0.0119 | 573 (300) | 0.35 |
| 4F7/2 | 2100 | 3.36 | 6.05 | 0.000009 | 0.0011 | 1511 (1238) | 0.13 | |
| 25 | 2H11/2 | 743 | 1.19 | 12.46 | 0.004194 | 0.0063 | 535 (262) | 0.37 |
| 4F7/2 | 2084 | 3.33 | 5.07 | 0.000008 | 0.0009 | 1499 (1226) | 0.13 | |
| 26 | 2H11/2 | 709 | 1.13 | 8.00 | 0.003025 | 0.0042 | 510 (237) | 0.39 |
| 4F7/2 | 2007 | 3.21 | 4.83 | 0.000010 | 0.0009 | 1444 (1171) | 0.14 | |
| 27 | 2H11/2 | 845 | 1.35 | 15.13 | 0.003551 | 0.0067 | 608 (335) | 0.33 |
| 4F7/2 | 2142 | 3.42 | 4.66 | 0.000006 | 0.0008 | 1541 (1268) | 0.13 | |
| 28 | 2H11/2 | 849 | 1.36 | 16.50 | 0.003818 | 0.0073 | 611 (338) | 0.33 |
| 4F7/2 | 2109 | 3.37 | 4.46 | 0.000006 | 0.0008 | 1517 (1244) | 0.13 | |
| 29 | 2H11/2 | 849 | 1.36 | 13.83 | 0.003199 | 0.0061 | 611 (338) | 0.33 |
| 4F7/2 | 2109 | 3.37 | 4.23 | 0.000006 | 0.0008 | 1517 (1244) | 0.13 | |
| 30 | 2H11/2 | 800 | 1.28 | 18.82 | 0.005190 | 0.0089 | 576 (303) | 0.35 |
| 4F7/2 | 1950 | 3.12 | 4.67 | 0.000013 | 0.0009 | 1403 (1130) | 0.14 | |
| 31 | 2H11/2 | 625 | 1.00 | 24.40 | 0.012168 | 0.0147 | 450 (177) | 0.44 |
| 4F7/2 | 2102 | 3.36 | 5.83 | 0.000008 | 0.0010 | 1512 (1239) | 0.13 | |
| 32 | 2H11/2 | 996 | 1.59 | 23.07 | 0.003093 | 0.0087 | 717 (444) | 0.28 |
| 4F7/2 | 2276 | 3.64 | 6.14 | 0.000004 | 0.0010 | 1637 (1364) | 0.12 | |
| 33 | 2H11/2 | 735 | 1.18 | 6.98 | 0.002416 | 0.0036 | 529 (256) | 0.38 |
| 4F7/2 | 2101 | 3.36 | 4.89 | 0.000007 | 0.0009 | 1512 (1239) | 0.13 | |
| 34 | 2H11/2 | 735 | 1.18 | 2.25 | 0.000779 | 0.0012 | 529 (256) | 0.38 |
| 4F7/2 | 2101 | 3.36 | 3.89 | 0.000005 | 0.0007 | 1512 (1239) | 0.13 | |
| 35 | 2H11/2 | 735 | 1.18 | 51.32 | 0.017757 | 0.0263 | 529 (256) | 0.38 |
| 4F7/2 | 2060 | 3.29 | 5.77 | 0.000010 | 0.0011 | 1482 (1209) | 0.13 | |
| 36 | 2H11/2 | 1009 | 1.61 | 23.75 | 0.003032 | 0.0089 | 726 (453) | 0.28 |
| 4F7/2 | 2301 | 3.68 | 4.67 | 0.000003 | 0.0008 | 1655 (1382) | 0.12 | |
| 37 | 2H11/2 | 809 | 1.29 | 15.65 | 0.004179 | 0.0073 | 582 (309) | 0.34 |
| 4F7/2 | 2101 | 3.36 | 5.81 | 0.000008 | 0.0010 | 1512 (1239) | 0.13 | |
| 38 | 2H11/2 | 809 | 1.29 | 37.22 | 0.009940 | 0.0173 | 582 (309) | 0.34 |
| 4F7/2 | 2101 | 3.36 | 4.94 | 0.000007 | 0.0009 | 1512 (1239) | 0.13 | |
| 39 | 2H11/2 | 699 | 1.12 | 60.18 | 0.023537 | 0.0324 | 503 (230) | 0.40 |
| 4F7/2 | 1997 | 3.19 | 6.74 | 0.000015 | 0.0013 | 1437 (1164) | 0.14 | |
| 40 | 2H11/2 | 770 | 1.23 | 29.54 | 0.009052 | 0.0144 | 554 (281) | 0.36 |
| 4F7/2 | 2030 | 3.25 | 5.76 | 0.000011 | 0.0011 | 1460 (1187) | 0.14 |
Publisher’s Note: MDPI stays neutral with regard to jurisdictional claims in published maps and institutional affiliations. |
© 2021 by the authors. Licensee MDPI, Basel, Switzerland. This article is an open access article distributed under the terms and conditions of the Creative Commons Attribution (CC BY) license (http://creativecommons.org/licenses/by/4.0/).
Share and Cite
Ćirić, A.; Gavrilović, T.; Dramićanin, M.D. Luminescence Intensity Ratio Thermometry with Er3+: Performance Overview. Crystals 2021, 11, 189. https://doi.org/10.3390/cryst11020189
Ćirić A, Gavrilović T, Dramićanin MD. Luminescence Intensity Ratio Thermometry with Er3+: Performance Overview. Crystals. 2021; 11(2):189. https://doi.org/10.3390/cryst11020189
Chicago/Turabian StyleĆirić, Aleksandar, Tamara Gavrilović, and Miroslav D. Dramićanin. 2021. "Luminescence Intensity Ratio Thermometry with Er3+: Performance Overview" Crystals 11, no. 2: 189. https://doi.org/10.3390/cryst11020189