
A Photomicroscopic Study on the Growth Rates of Calcium Oxalate Crystals in a New Synthetic Urine without Inhibitors and with Various Inhibitors


Abstract
:1. Introduction
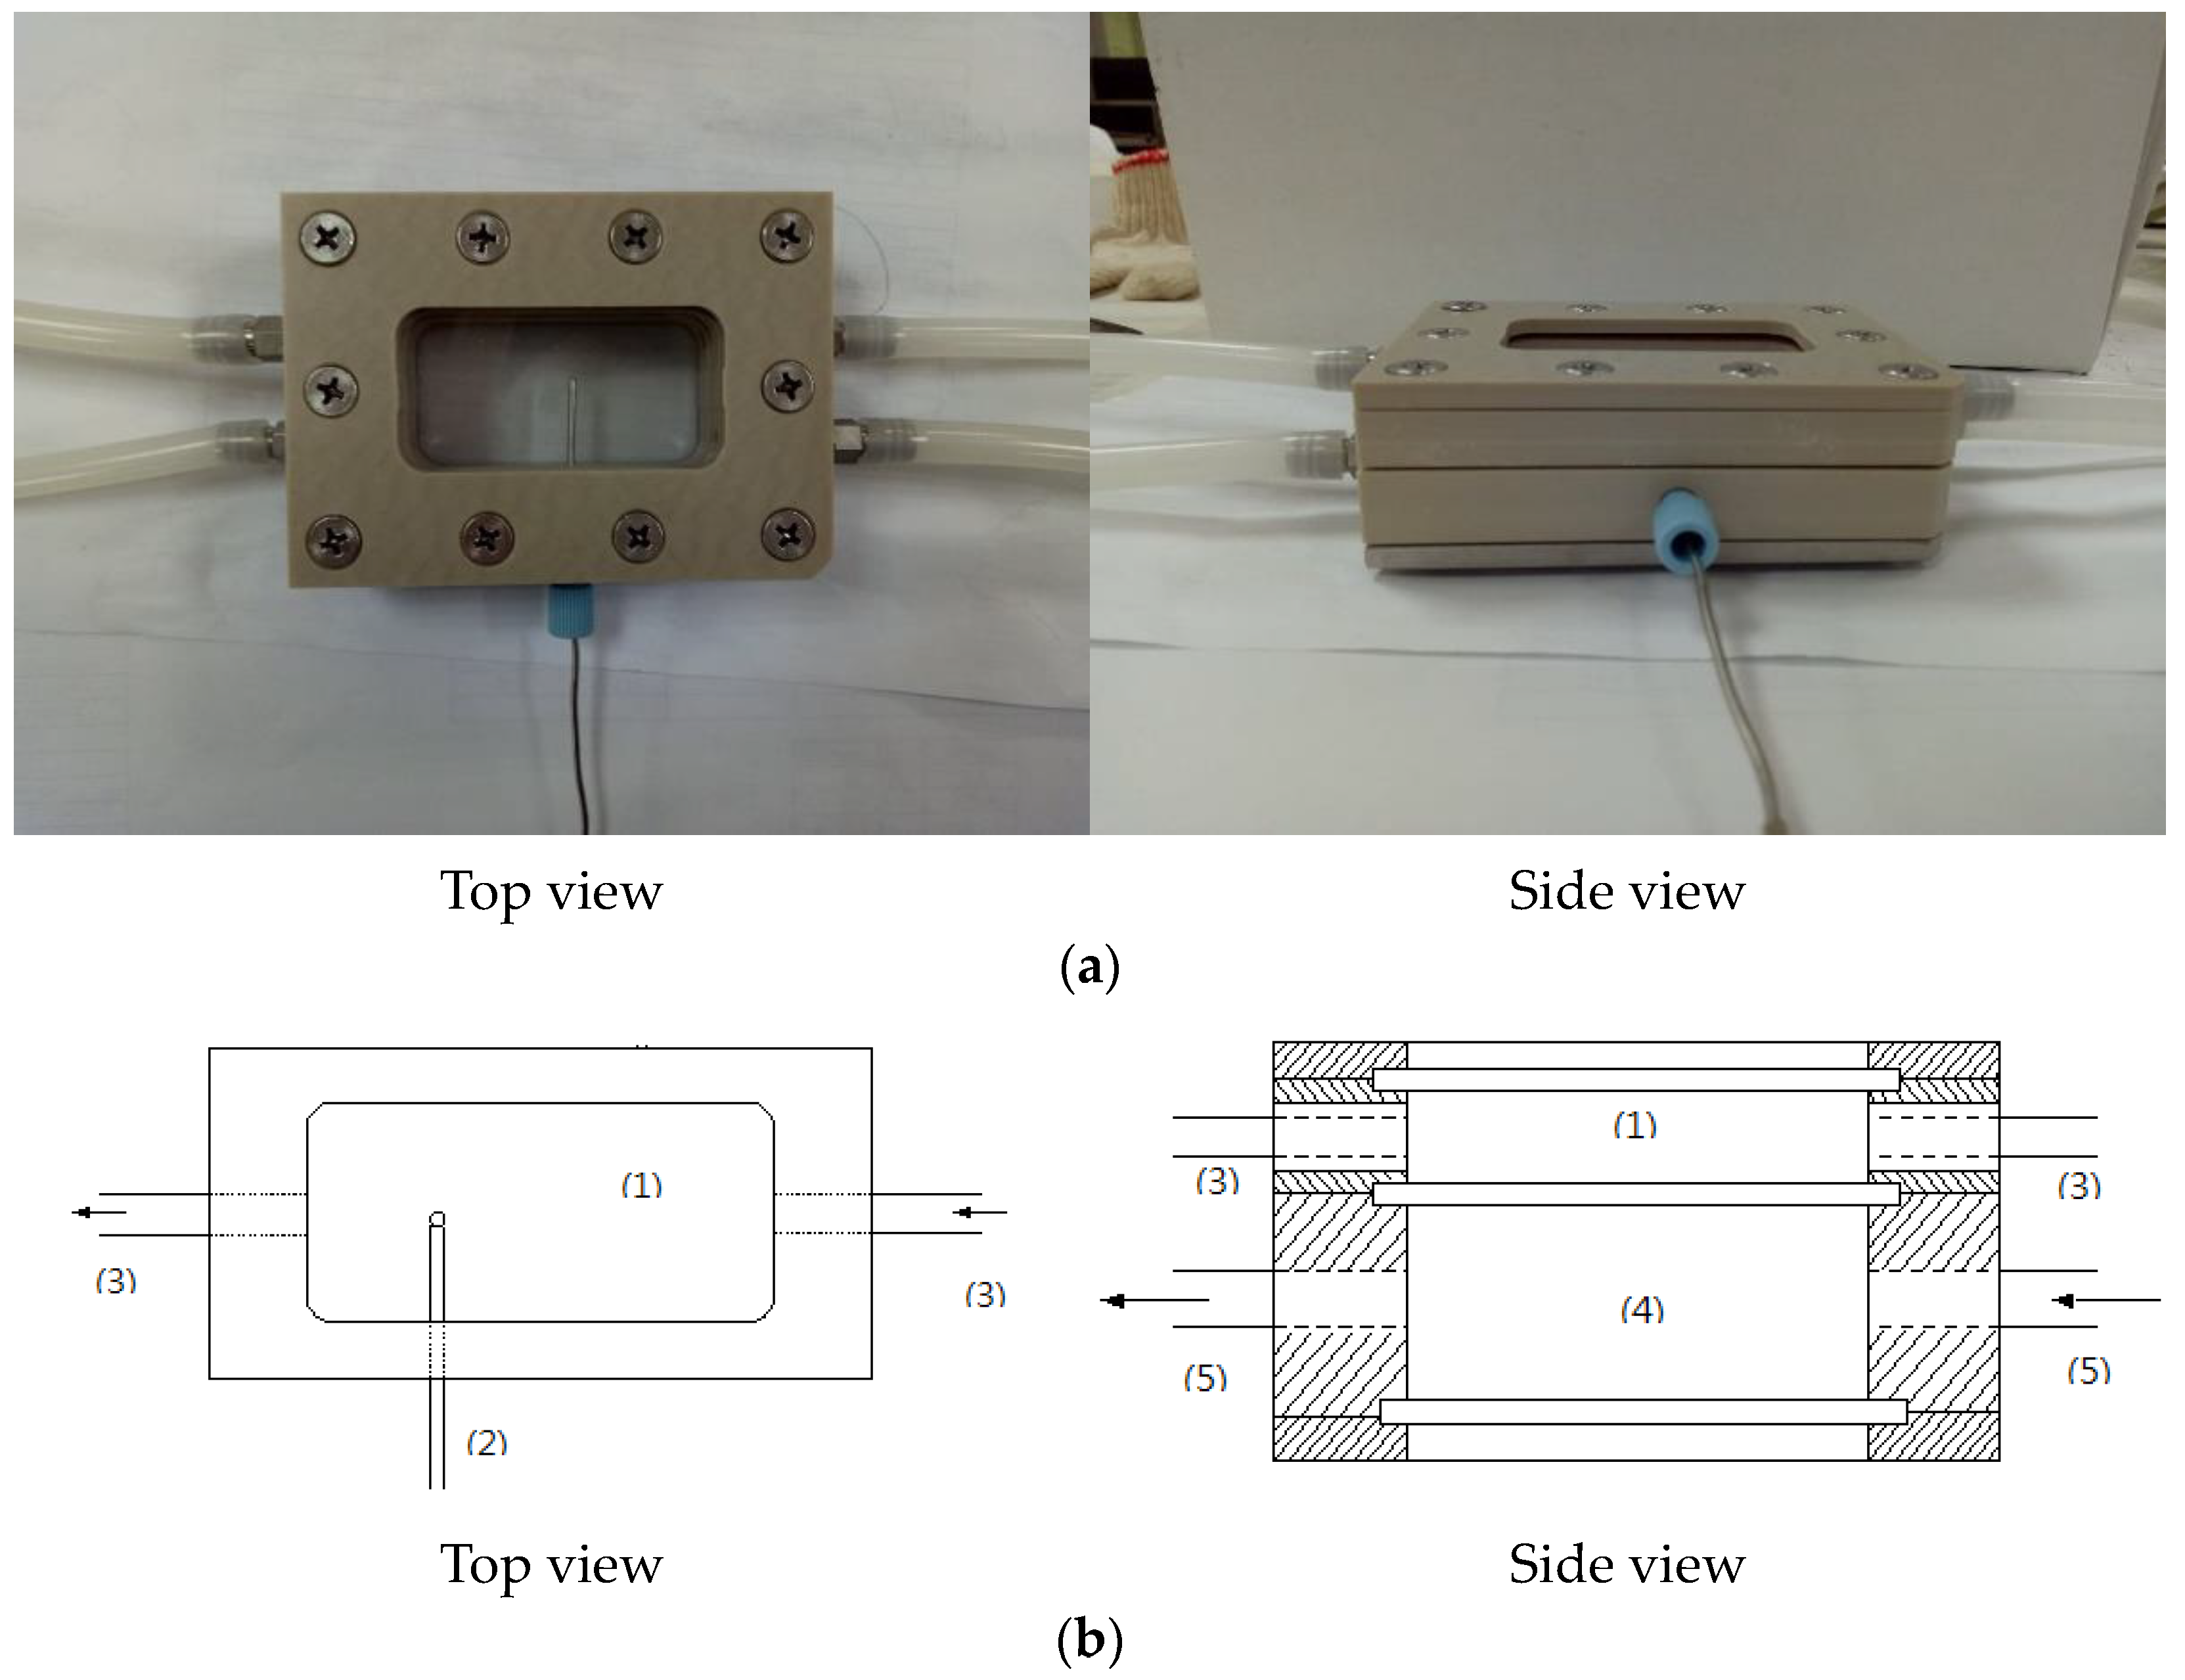
2. Experiments
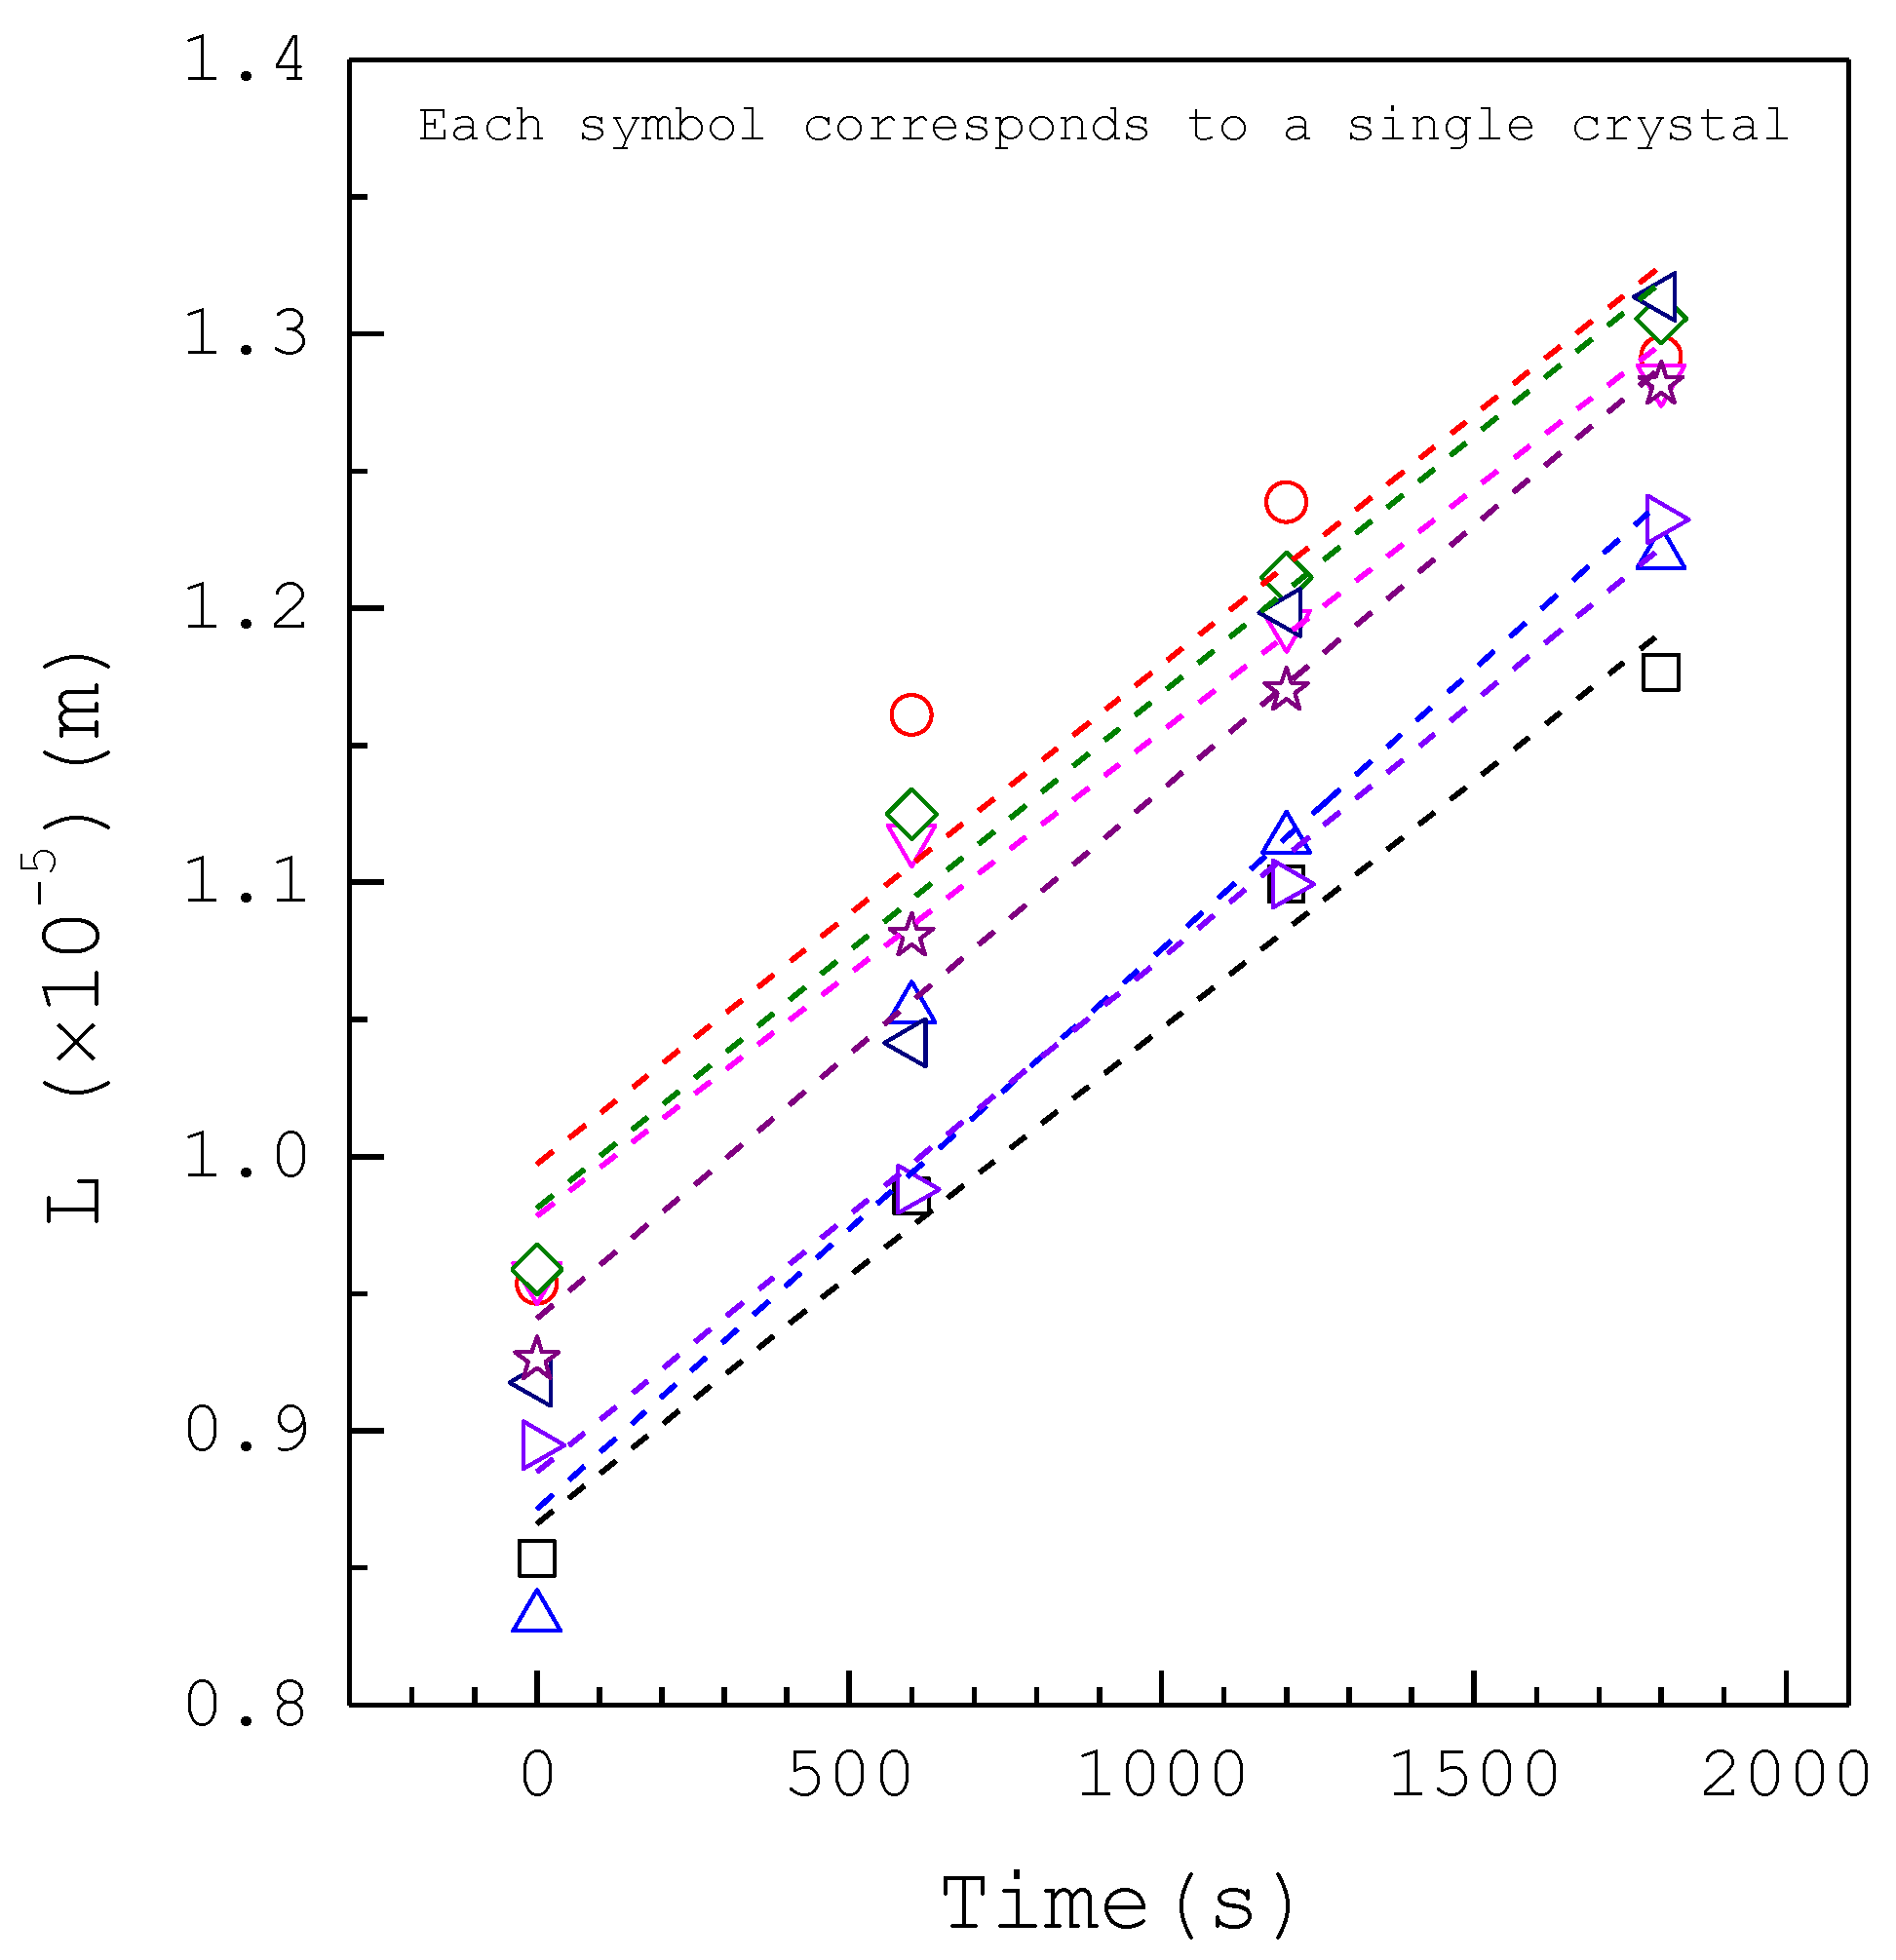
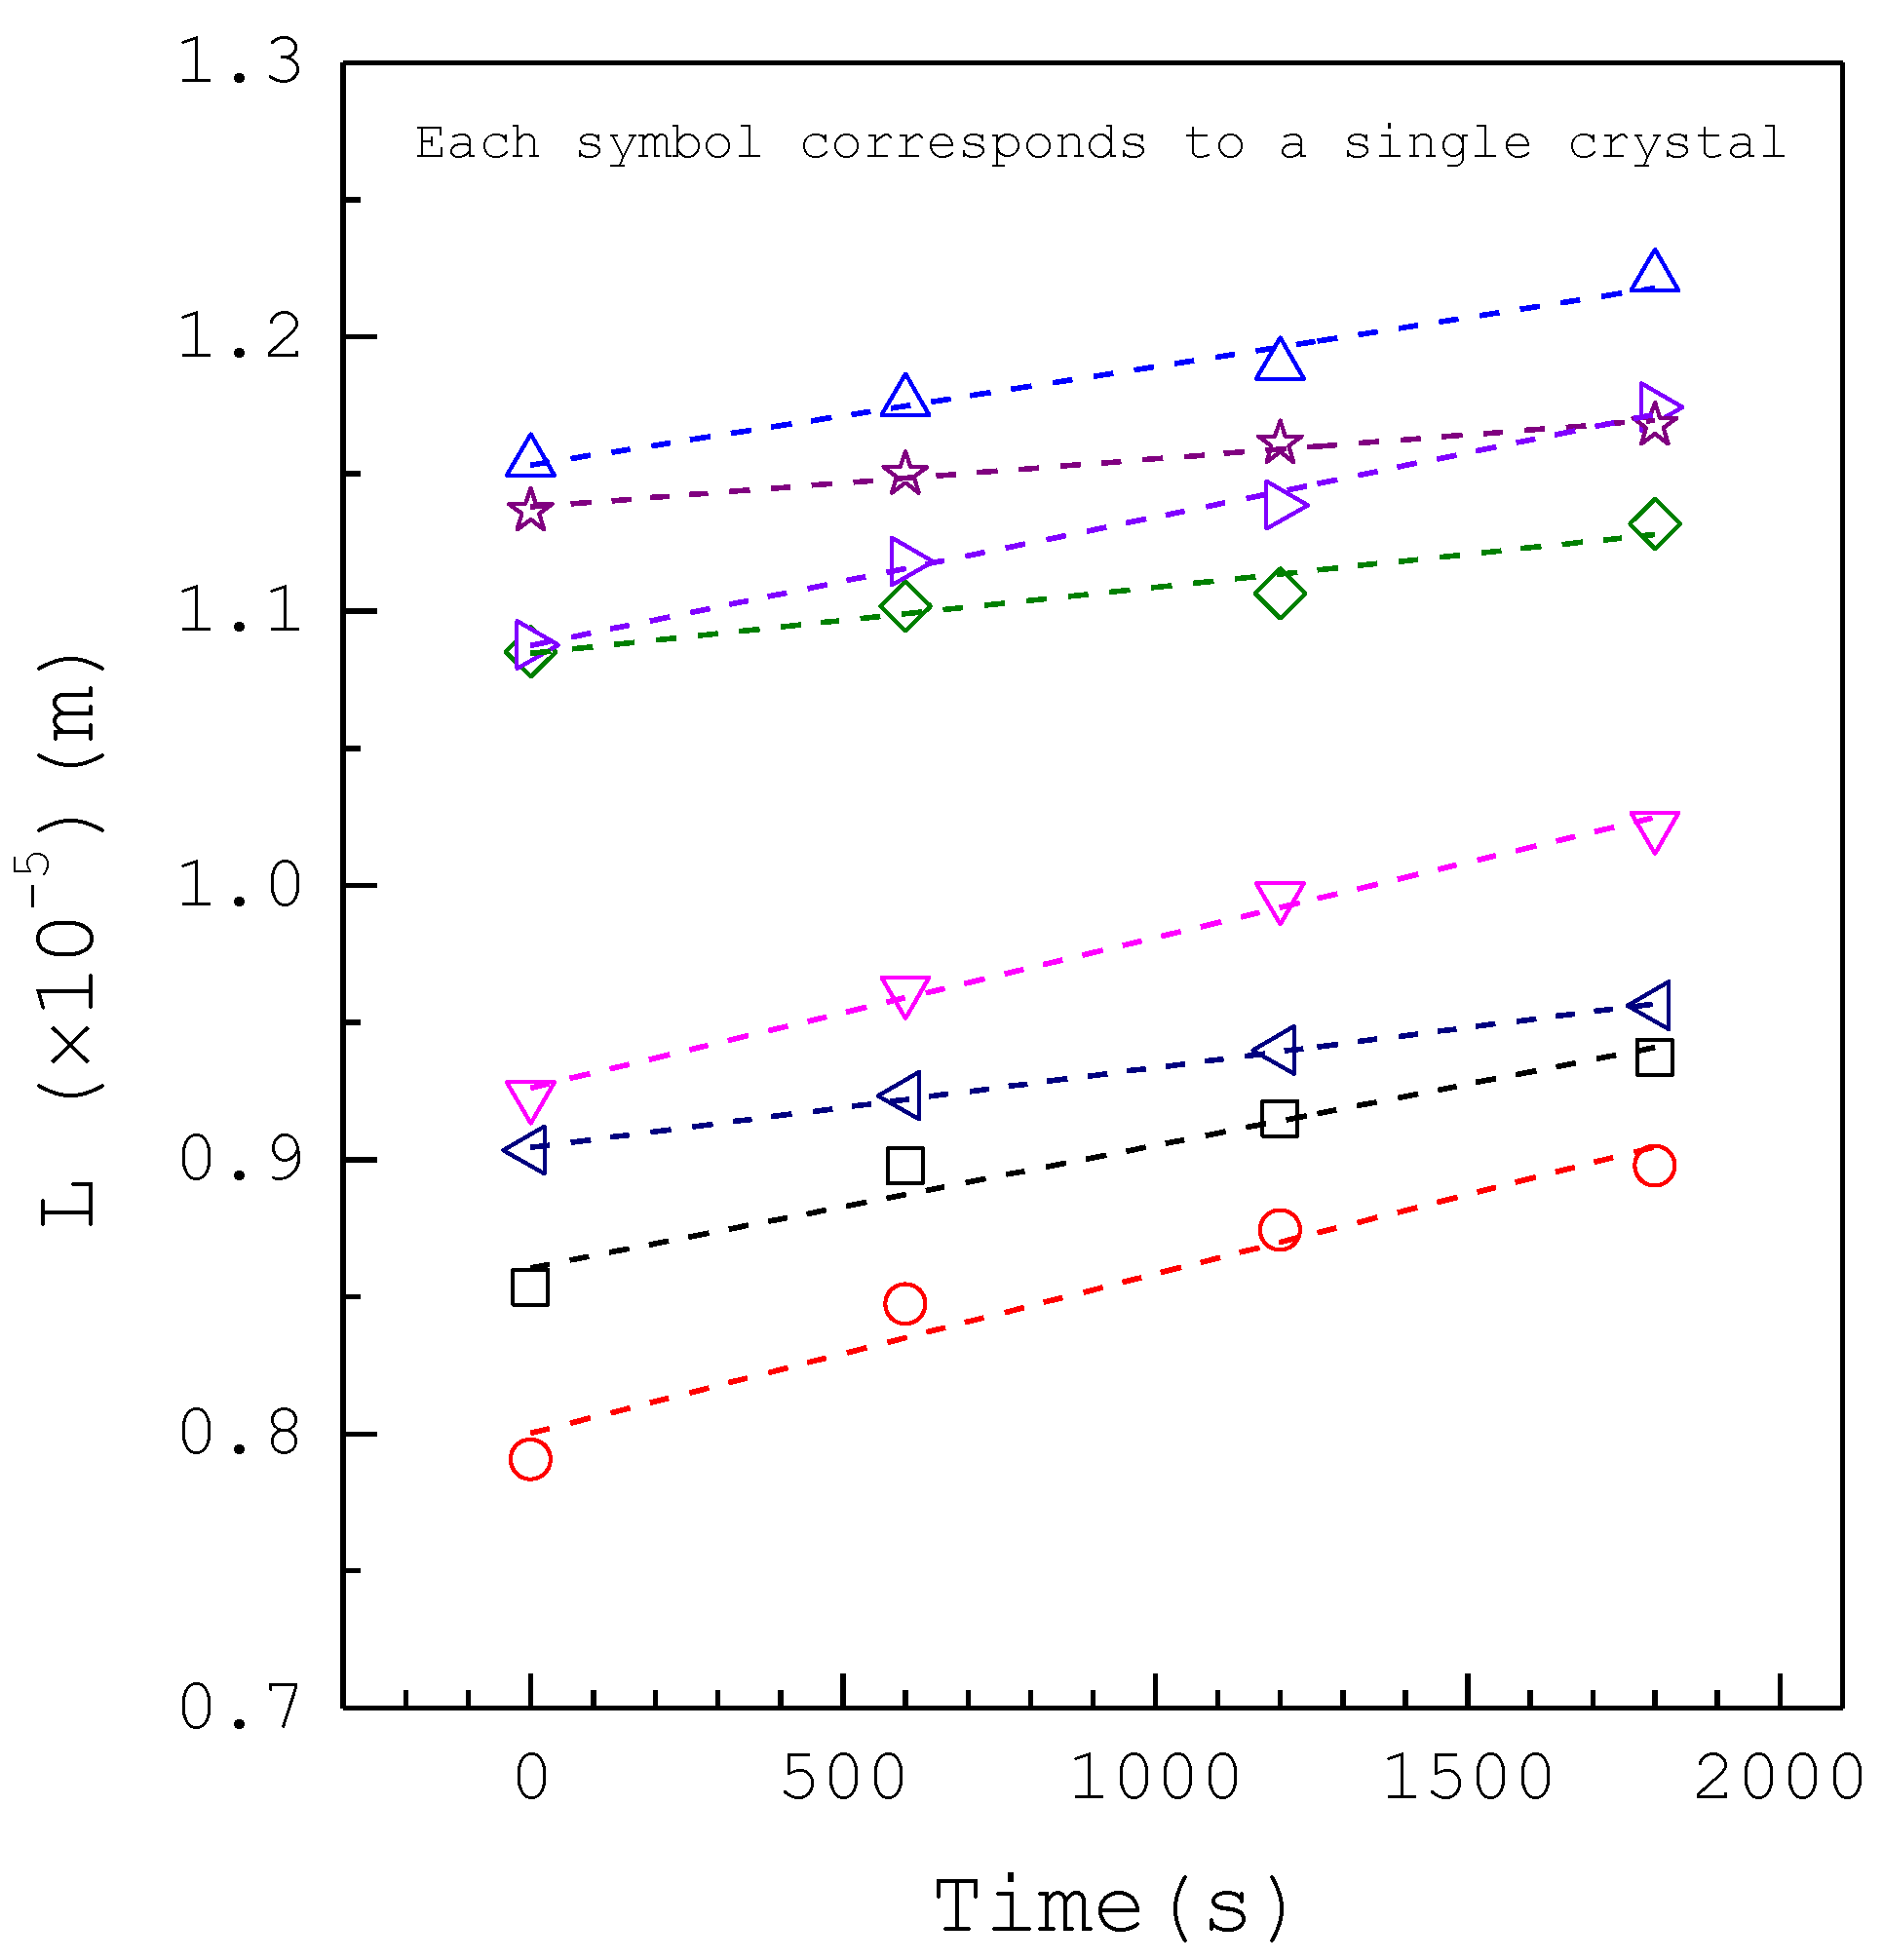
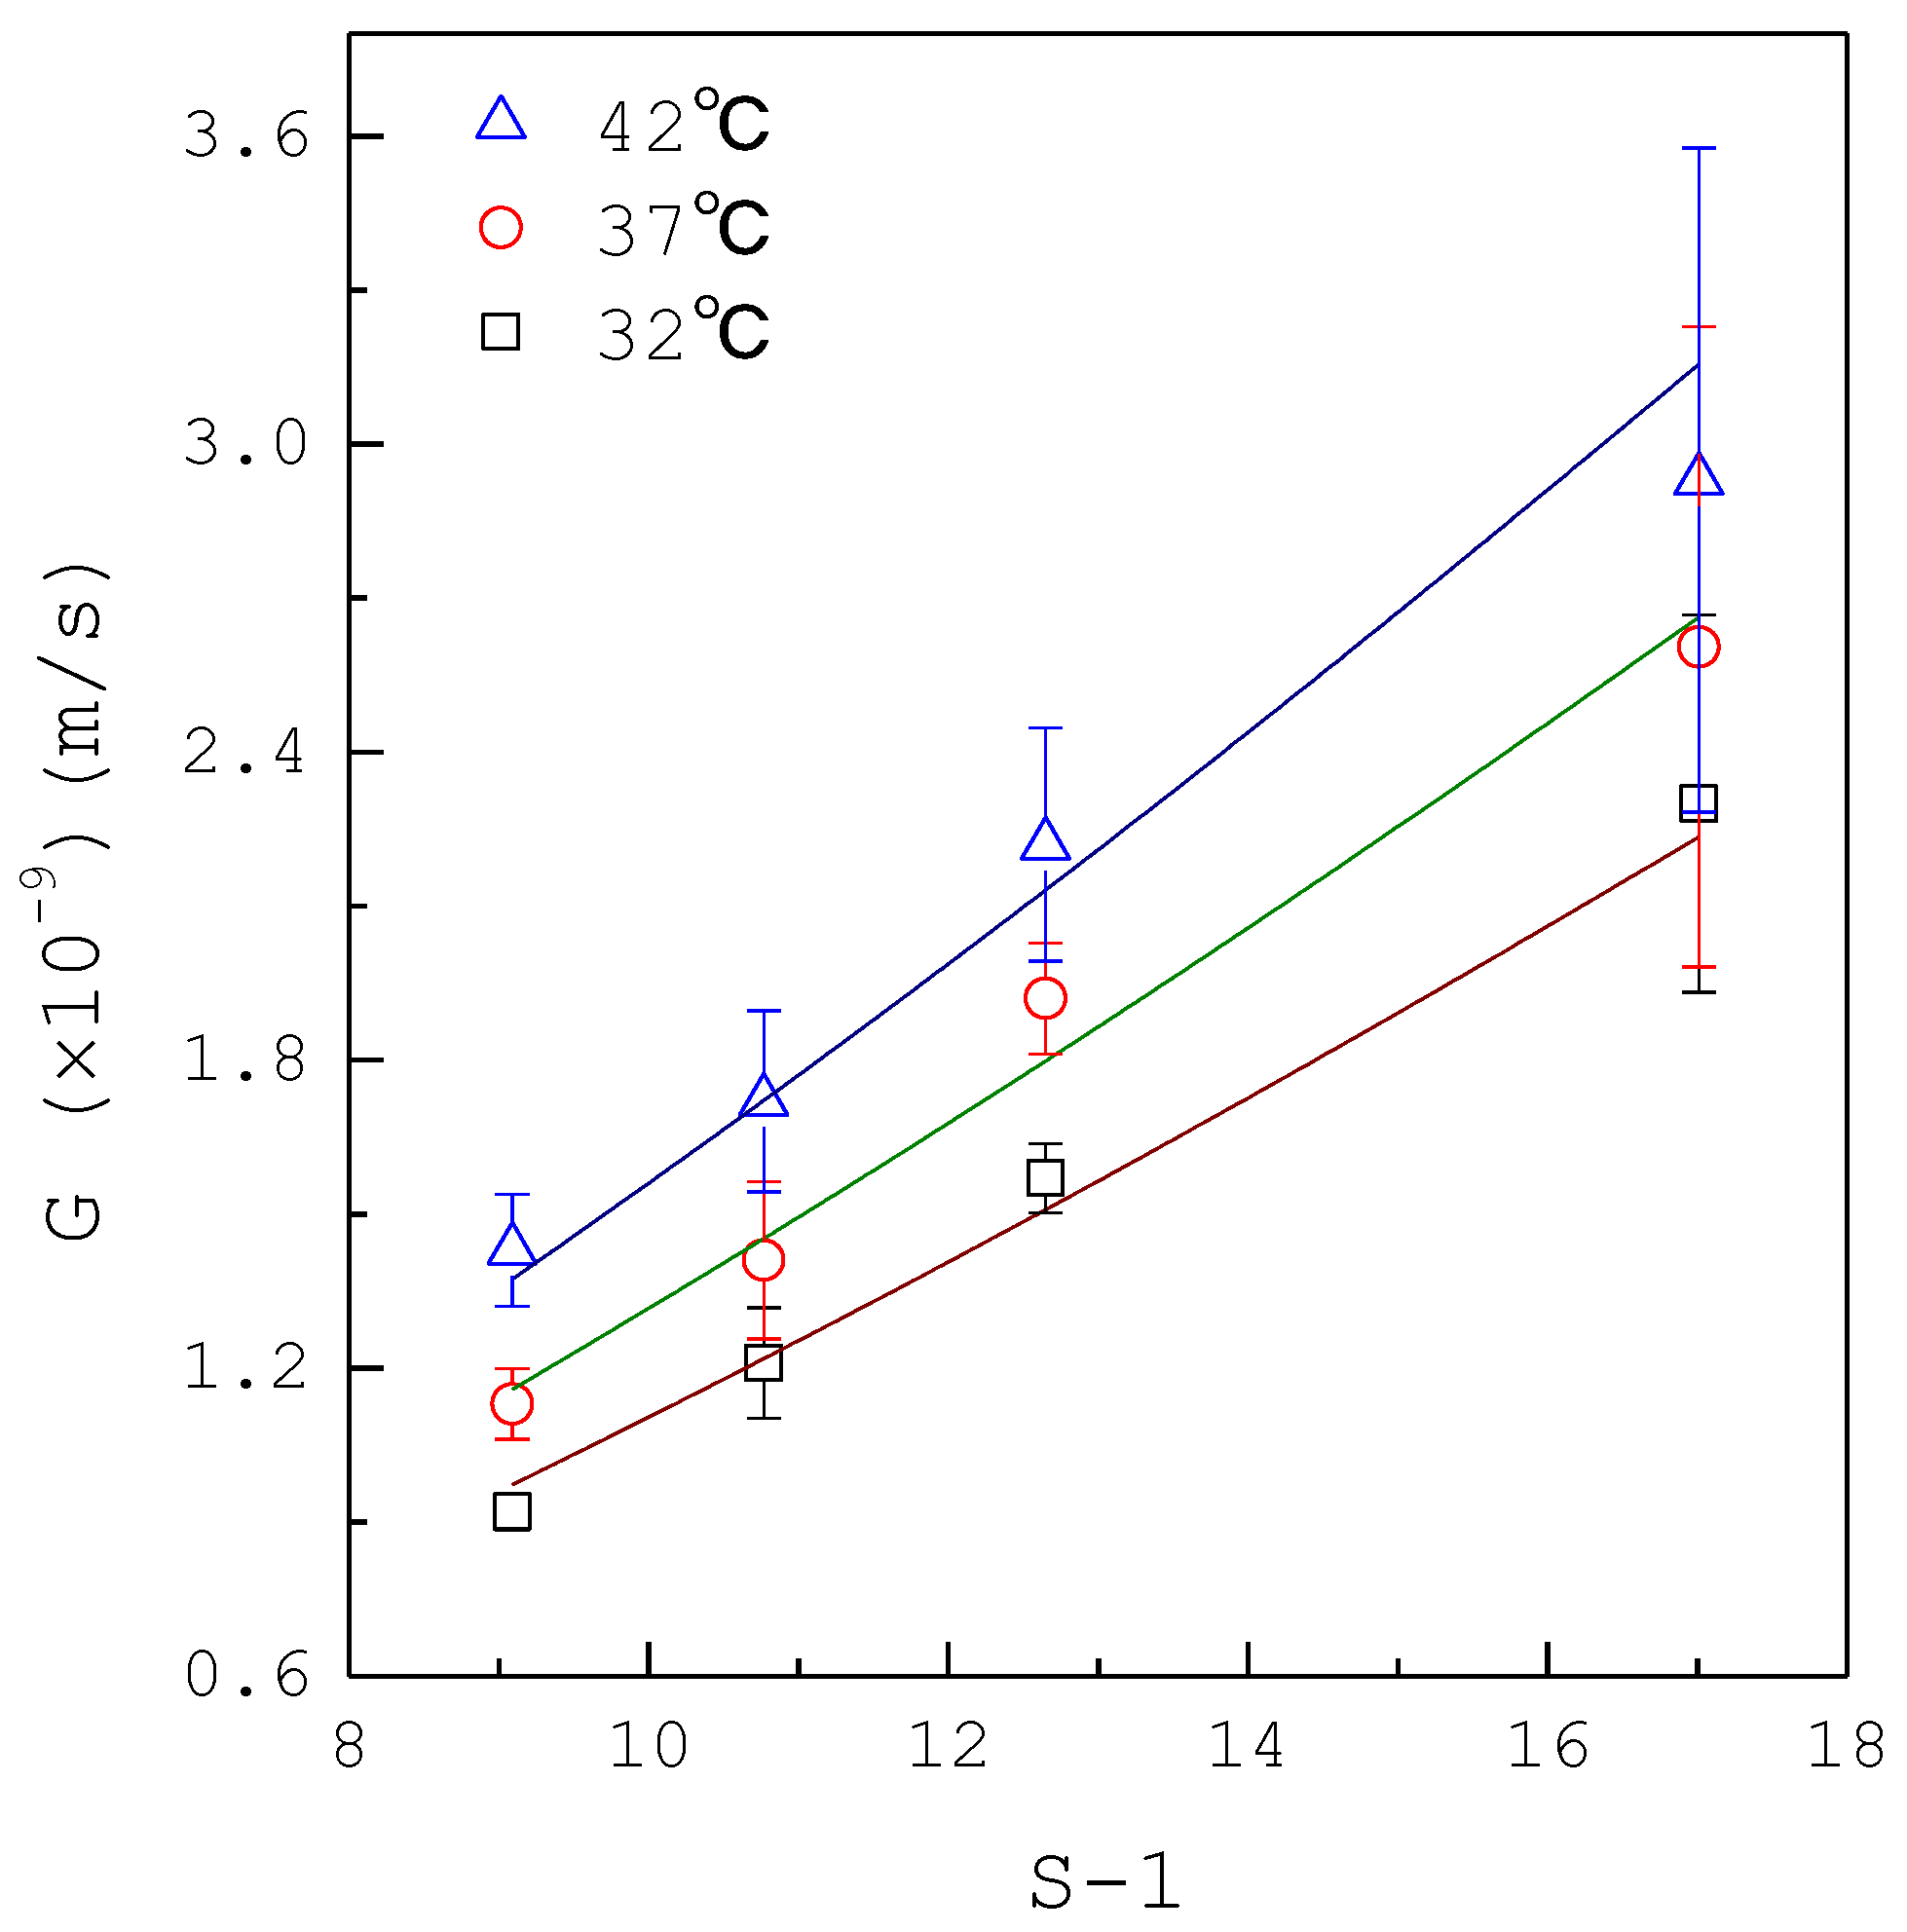
3. Results and Discussion
4. Conclusions
Supplementary Materials
Author Contributions
Funding
Institutional Review Board Statement
Informed Consent Statement
Data Availability Statement
Acknowledgments
Conflicts of Interest
Notation
| A | area |
| AG | growth kinetic parameter |
| Ci | impurity concentration |
| EG | growth activation energy |
| G | growth rate |
| g | growth rate order |
| L | size |
| R | ideal gas constant |
| S | supersaturation |
| T | temperature |
References
- Scales, C.D., Jr.; Smith, A.C.; Hanley, J.M.; Saigal, C.S. Prevalence of kidney stones in the United States. Eur. Urol. 2012, 62, 160–165. [Google Scholar] [CrossRef] [Green Version]
- Nakagawa, Y.; Abram, V.; Coe, F.L. Isolation of calcium oxalate crystal growth inhibitor from rat kidney and urine. Am. J. Physiol. 1984, 247, 765–772. [Google Scholar] [CrossRef]
- Ogbuji, L.U.; Batich, C.D. Ultrastructure of whewellite kidney stones: Electron-analytical investigation. J. Ultrastruct Res. 1985, 90, 1–8. [Google Scholar] [CrossRef]
- Kaloustian, J.; El-Moselhy, T.F.; Portugal, T.F. Determination of calcium oxalate (mono-and dihydrate) in mixtures with magnesium ammonium phosphate or uric acid: The use of simultaneous thermal analysis in urinary calculi. Clin. Chim. Acta 2003, 334, 117–129. [Google Scholar] [CrossRef]
- Opalko, F.J.; Adair, J.H.; Khan, S.R. Heterogeneous nucleation of calcium oxalate trihydrate in artificial urine by constant composition. J. Cryst. Growth 1997, 181, 410–417. [Google Scholar] [CrossRef]
- Rabinovich, Y.I.; Esayanur, M.; Daosukho, S.; Byer, K.J.; El-Shall, H.E.; Khan, S.R. Adhesion force between calcium oxalate monohydrate crystal and kidney epithelial cells and possible relevance for kidney stone formation. J. Colloid Interface Sci. 2006, 300, 131–140. [Google Scholar] [CrossRef] [PubMed]
- Ito, H.; Coe, F.L. Acidic peptide and polyribonucleotide crystal growth inhibitors in human urine. Am. J. Physiol. 1977, 233, 455–463. [Google Scholar] [CrossRef] [PubMed]
- Drach, G.W.; Randolph, A.D.; Miller, J.D. Inhibition of calcium oxalate dihydrate crystallization by chemical modifiers. I. Pyrophosphate and methylene blue. J. Urol. 1978, 119, 99–103. [Google Scholar] [CrossRef]
- Hallson, P.C.; Rose, G.A. Uromucoids and urinary stone formation. Lancet 1979, 1, 1000–1002. [Google Scholar] [CrossRef]
- Randolph, A.D.; Drach, G.W. Some measurements of calcium oxalate nucleation and growth rates in urine-like liquors. J. Cryst. Growth 1981, 53, 195–201. [Google Scholar] [CrossRef]
- Robertson, W.G.; Scurr, D.S. Factors influencing the crystallization of calcium oxalate-a critique. J. Cryst. Growth 1981, 53, 182–194. [Google Scholar] [CrossRef]
- Ryall, R.L.; Harnett, R.M.; Marshall, V.R. The effect of urine, pyrophosphate, citrate, magnesium and glycosaminoglycans on the growth and aggregation of calcium oxalate crystals in vitro. Clin. Chim. Acta 1981, 112, 349–356. [Google Scholar] [CrossRef]
- Nakagawa, Y.; Abram, V.; Kezdy, F.J.; Kaiser, E.T.; Coe, F.L. Purification and characterization of the principal inhibitor of calcium oxalate crystal growth in human urine. J. Biol. Chem. 1983, 258, 12594–12600. [Google Scholar] [CrossRef]
- Li, M.K.; Blacklock, N.J.; Garside, J. Effects of magnesium on calcium oxalate crystallization. J. Urol. 1985, 133, 123–125. [Google Scholar] [CrossRef]
- Robertson, W.G.; Scurr, D.S.; Sergeant, V.J. Ionic and macromolecular modifiers of crystallization of calcium salts in urine. Fortschr. Urol. Nephrol. 1985, 23, 1–11. [Google Scholar]
- Robertson, W.G.; Scurr, D.S. Modifiers of calcium oxalate crystallization found in urine. I. Studies with a continuous crystallizer using an artificial urine. J. Urol. 1986, 86, 1322–1326. [Google Scholar] [CrossRef]
- Pak, C.Y. Citrate and renal calculi: New insights and future directions. Am. J. Kidney Dis. 1991, 17, 420–425. [Google Scholar] [CrossRef]
- Ryall, R.L. Urinary inhibitors of calcium oxalate crystallization and their potential role in stone formation. World J. Urol. 1997, 15, 155–164. [Google Scholar] [CrossRef] [PubMed]
- Marangella, M.; Bagnis, C.; Bruno, M.; Vitale, C.; Petrarulo, M.; Ramello, A. Crystallization inhibitors in the pathophysiology and treatment of nephrolithiasis. Urol. Int. 2004, 72, 6–10. [Google Scholar] [CrossRef] [PubMed]
- Grases, F.; Isern, B.; Sanchis, P.; Perello, J.; Torres, J.J.; Costa-Bauza, A. Phytate acts as an inhibitor in formation of renal calculi. Front. Biosci. 2007, 12, 2580–2587. [Google Scholar] [CrossRef]
- Farmanesh, S.; Ramamoorthy, S.; Chung, J.; Asplin, J.R.; Karande, P.; Rimer, J.D. Specificity of Growth Inhibitors and their Cooperative Effects in Calcium Oxalate Monohydrate Crystallization. J. Am. Chem. Soc. 2013, 136, 367–376. [Google Scholar] [CrossRef]
- Grases, F.; Rodriguez, A.; Costa-Bauza, A. Efficacy of mixtures of magnesium, citrate and phytate as calcium oxalate crystallization inhibitors in urine. J. Urol. 2015, 194, 812–819. [Google Scholar] [CrossRef]
- Chung, J.; Granja, I.; Taylor, M.G.; Mpourmpakis, G.; Asplin, J.R.; Rimer, J.D. Molecular modifiers reveal a mechanism of pathological crystal growth inhibition. Nature 2016, 536, 446–450. [Google Scholar] [CrossRef] [PubMed]
- Rodgers, A.L.; Jackson, G.E. Determination of thermodynamic parameters for complexation of calcium and magnesium with chondroitin sulfate isomers using isothermal titration calorimetry: Implications for calcium kidney-stone research. J. Cryst. Growth 2017, 463, 14–18. [Google Scholar] [CrossRef]
- Kim, D.; Rimer, J.D.; Asplin, J.R. Hydroxycitrate: A potential new therapy for calcium urolithiasis. Urolithiasis 2019, 47, 311–320. [Google Scholar] [CrossRef] [PubMed]
- Grases, F.; Costa-Bauza, A. Key Aspects of Myo-Inositol Hexaphosphate (Phytate) and Pathological Calcifications. Molecules 2019, 24, 4434. [Google Scholar] [CrossRef] [PubMed] [Green Version]
- Izatulina, A.R.; Golovanova, O.A.; Punin, Y.O. Effect of Amino Acids, Magnesium Ions and Hydroxyapatite on the Formation of Oxalate Nephroliths. Chem. Sustain. Dev. 2008, 2, 163–167. [Google Scholar]
- Golovanova, O.A.; Punin, Y.O.; Izatulina, A.R.; Korol’kov, V.V. Crystallization of calcium oxalate monohydrate in the presence of amino acids: Features and regularities. J. Struct. Chem. 2014, 55, 1356–1370. [Google Scholar] [CrossRef]
- Chutipongtanate, S.; Thongboonkerd, V. Systematic comparisons of artificial urine formulas for in vitro cellular study. Anal. Biochem. 2010, 402, 110–112. [Google Scholar] [CrossRef]
- Hsu, Y.C.; Lin, Y.H.; Shiau, L.D. Effects of various inhibitors on the nucleation of calcium oxalate in synthetic urine. Crystals 2020, 10, 333. [Google Scholar] [CrossRef] [Green Version]
- Shiau, L.D. The distribution of dislocation activities among crystals in sucrose crystallization. Chem. Eng. Sci. 2003, 58, 5299–53042. [Google Scholar] [CrossRef]
- Coe, F.; Parks, J.H. Defenses of an unstable compromise: Crystallization inhibitors and the kidney’s role in mineral regulation. Kidney Int. 1990, 38, 625–631. [Google Scholar] [CrossRef] [PubMed] [Green Version]
- Finlayson, B. Calcium stones: Some physical and clinical aspects, Chapter 10. In Calcium Metabolism in Renal Failure and Nephrolithiasis; David, D.S., Ed.; John Wiley & Sons: New York, NY, USA, 1977. [Google Scholar]
- Shiau, L.D.; Berglund, K.A. Growth kinetic of fructose crystals formed by contact nucleation. AIChE J. 1987, 33, 1028–1033. [Google Scholar] [CrossRef]
- Shiau, L.D.; Berglund, K.A. Growth rate dispersion in batch crystallization. AIChE J. 1990, 36, 1669–1678. [Google Scholar] [CrossRef]
- Mullin, J.W. Crystallization; Butterworth-Heinemann: Oxford, UK, 1993. [Google Scholar]
- Yu, H.; Sheikholeslami, R.; Doherty, W.O.S. The effects of silica and sugar on the crystallographic and morphological properties of calcium oxalate. J. Cryst. Growth 2004, 265, 592–603. [Google Scholar] [CrossRef]

| Composition | Concentration (mM) |
|---|---|
| Solution 1 (100 mL): | |
| Na2SO4·10H2O | 9.67 |
| NH4Cl | 43.37 |
| KCl | 81.30 |
| CaCl2 | 5.00 |
| Solution 2 (100 mL): | |
| NaH2PO4·2H2O | 7.73 |
| Na2HPO4·12H2O | 7.82 |
| NaCl | 111.54 |
| Urea | 200 |
| Uric acid | 1.00 |
| Creatinine | 4.00 |
| Na2C2O4 | 0.76, 0.96, 1.2, 1.7 |
Publisher’s Note: MDPI stays neutral with regard to jurisdictional claims in published maps and institutional affiliations. |
© 2021 by the authors. Licensee MDPI, Basel, Switzerland. This article is an open access article distributed under the terms and conditions of the Creative Commons Attribution (CC BY) license (http://creativecommons.org/licenses/by/4.0/).
Share and Cite
Hsu, Y.-C.; Pan, L.-C.; Shiau, L.-D. A Photomicroscopic Study on the Growth Rates of Calcium Oxalate Crystals in a New Synthetic Urine without Inhibitors and with Various Inhibitors. Crystals 2021, 11, 223. https://doi.org/10.3390/cryst11030223
Hsu Y-C, Pan L-C, Shiau L-D. A Photomicroscopic Study on the Growth Rates of Calcium Oxalate Crystals in a New Synthetic Urine without Inhibitors and with Various Inhibitors. Crystals. 2021; 11(3):223. https://doi.org/10.3390/cryst11030223
Chicago/Turabian StyleHsu, Yu-Chao, Li-Cheng Pan, and Lie-Ding Shiau. 2021. "A Photomicroscopic Study on the Growth Rates of Calcium Oxalate Crystals in a New Synthetic Urine without Inhibitors and with Various Inhibitors" Crystals 11, no. 3: 223. https://doi.org/10.3390/cryst11030223