
Structural Analysis of Interstratified Illite-Smectite by the Rietveld Method


Abstract
:1. Introduction
2. Materials and Methods
2.1. Material Pretreatment
2.2. X-ray Fluorescence (XRF) Analysis
2.3. Thermal Analysis
2.4. X-ray Diffraction (XRD) Data Collection
2.5. Rietveld Refinement
3. Results and Discussion
3.1. Characterization of Samples
3.2. Rietveld Refinement on the Oriented Specimens
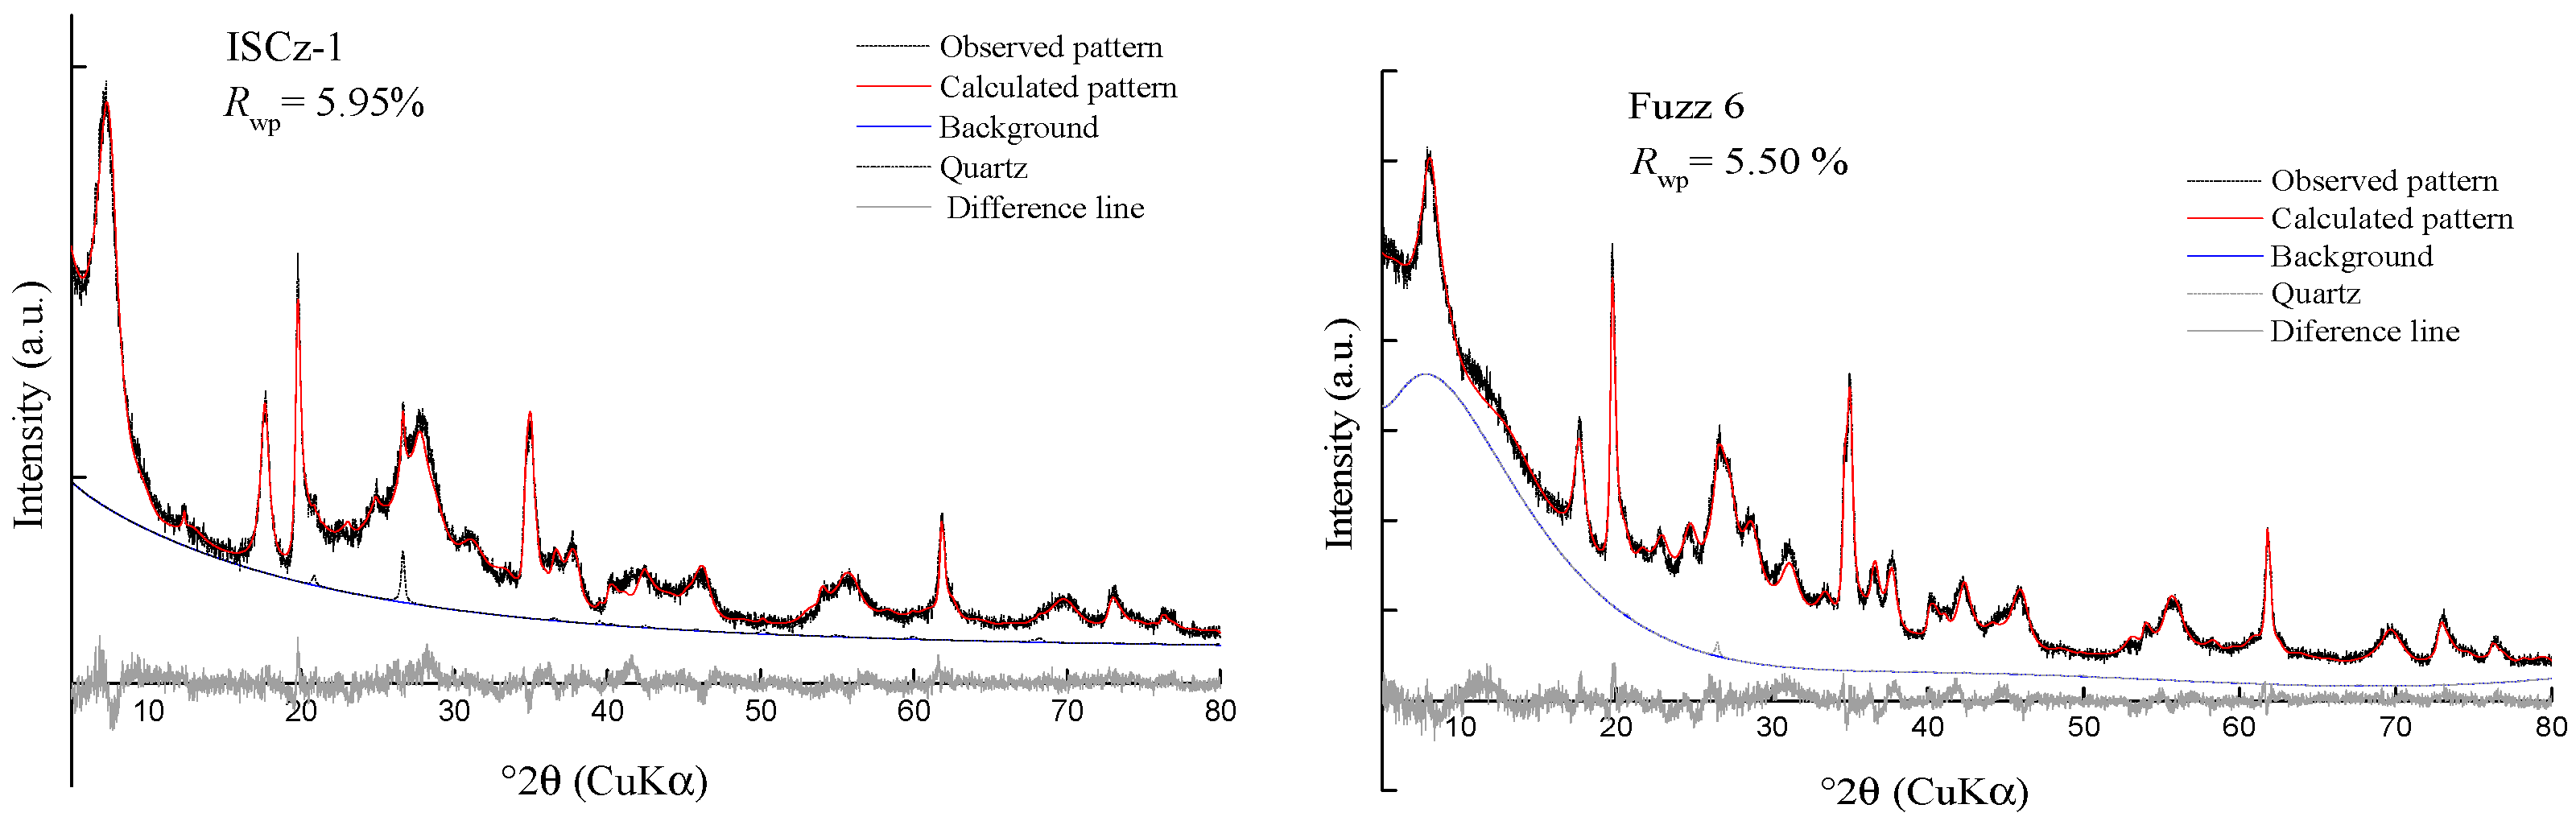
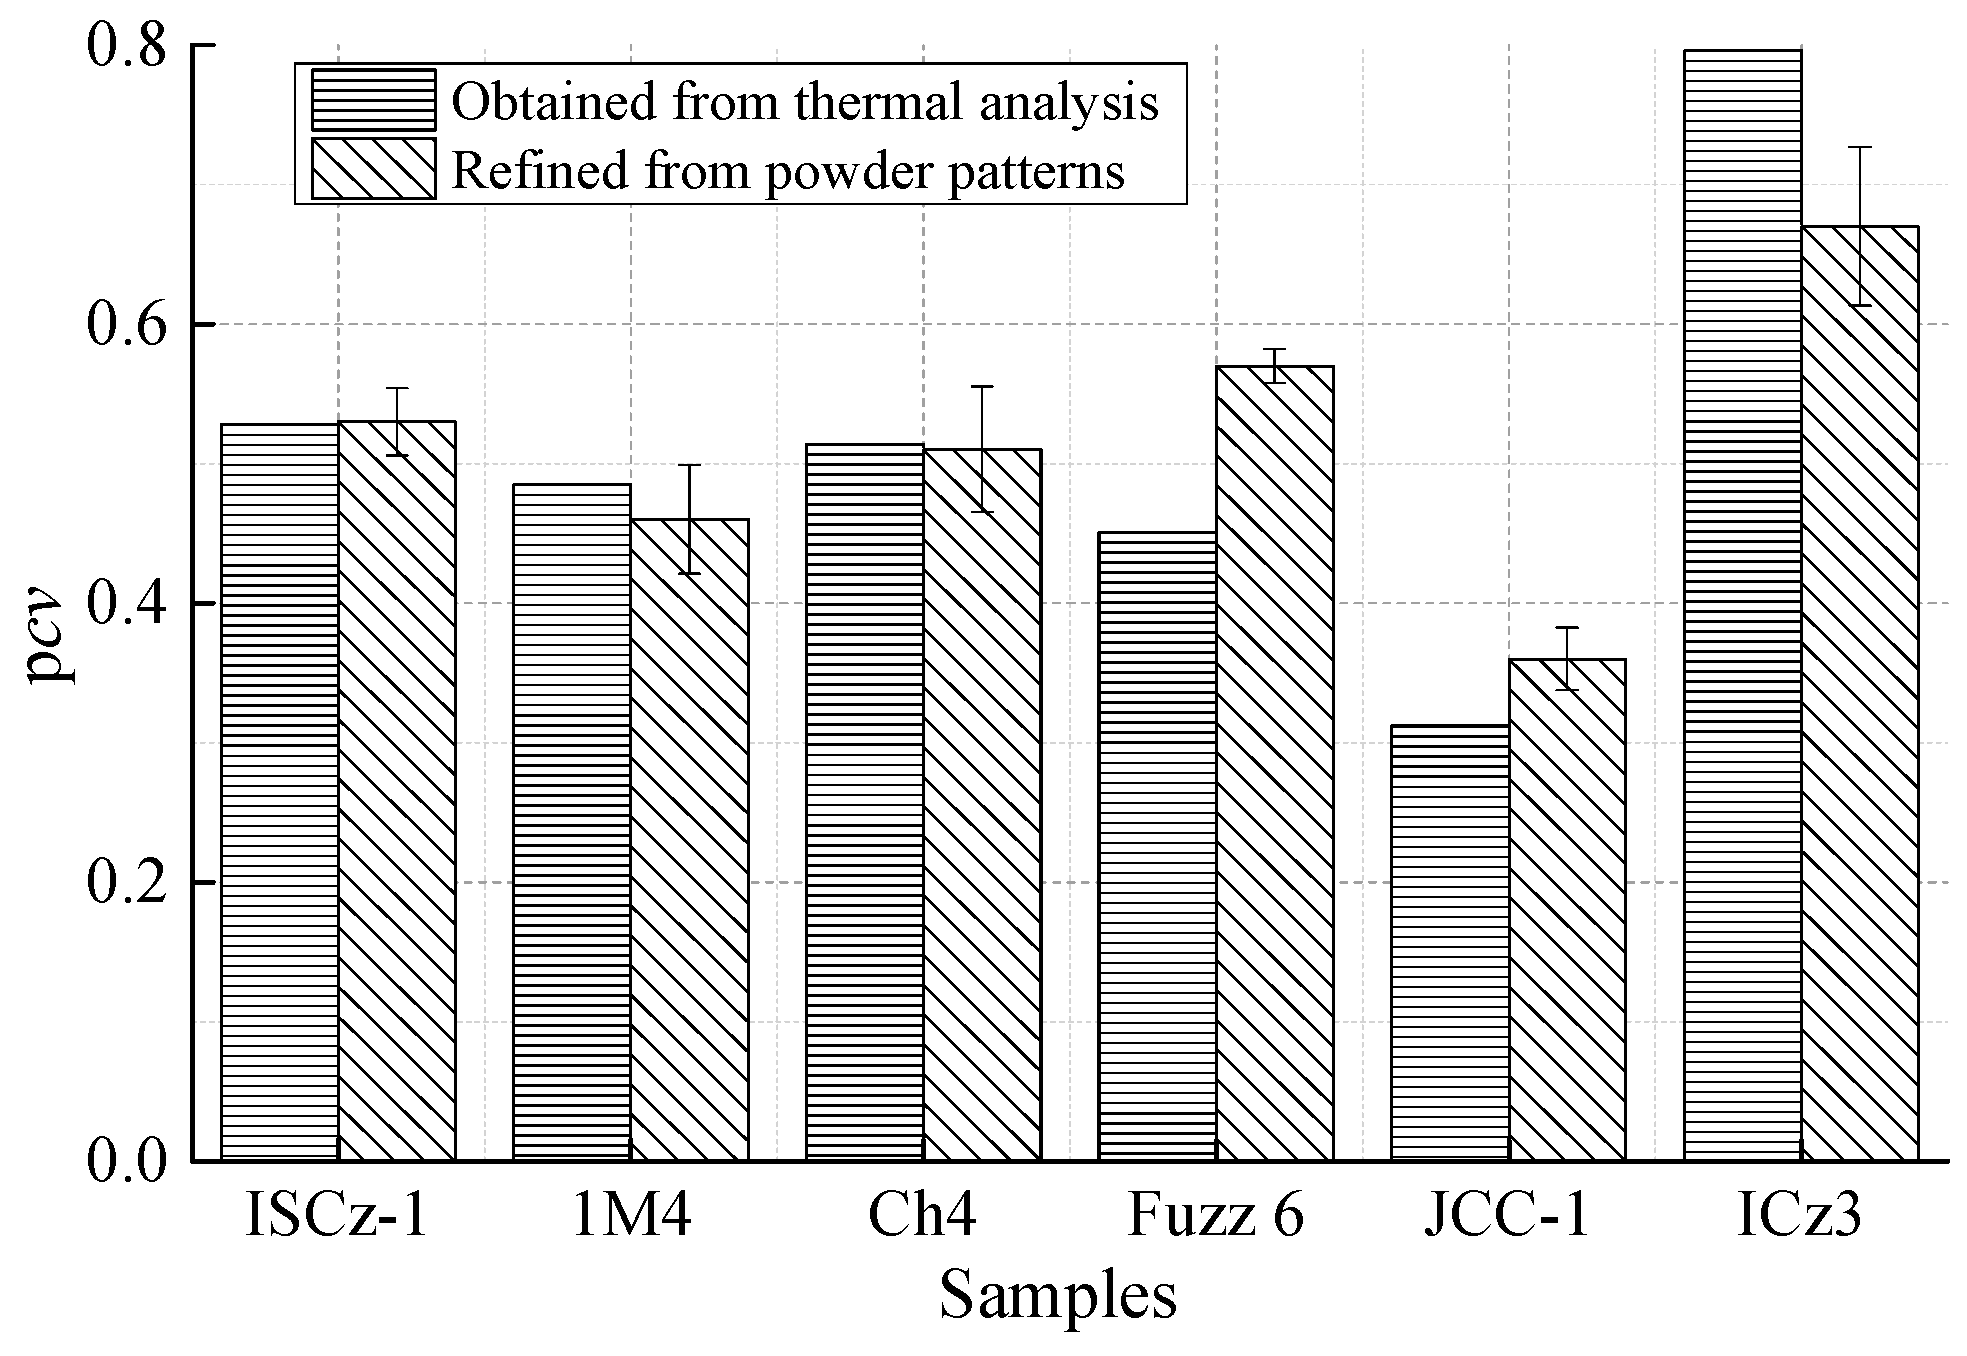
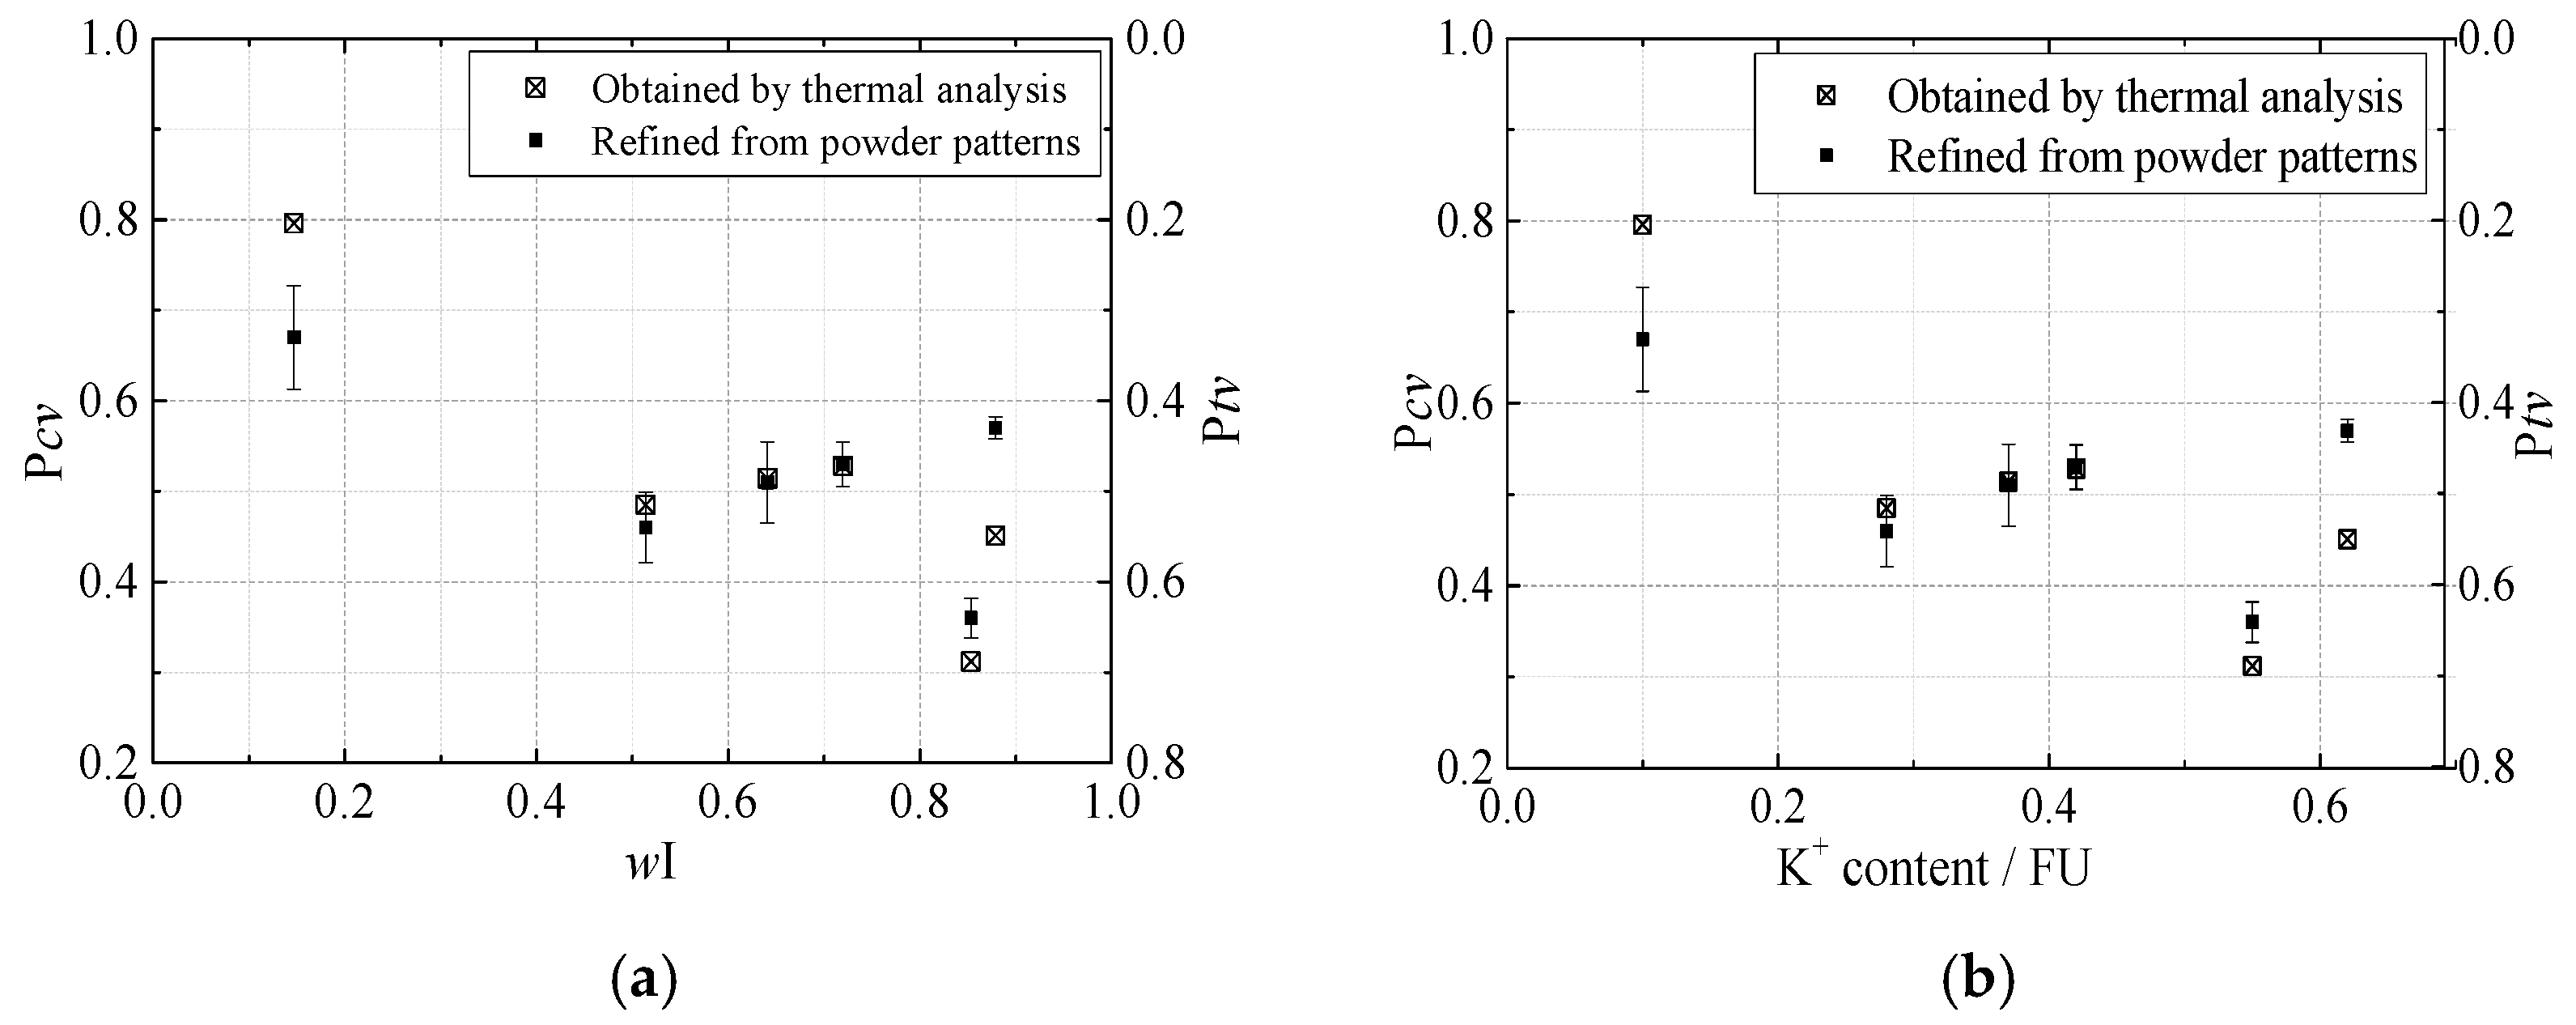
3.3. Rietveld Refinement on Powder Specimens
4. Conclusions
Author Contributions
Funding
Institutional Review Board Statement
Informed Consent Statement
Data Availability Statement
Acknowledgments
Conflicts of Interest
References
- Drits, V.A.; Lindgreen, H.; Salyn, A.L. Determination by XRD of content and distribution of fixed ammonium in illite-smectite. Application to North Sea illite-smectite. Am. Mineral. 1997, 82, 80–88. [Google Scholar] [CrossRef]
- Velde, B.; Köster, H.M.A. kinetic model of the smectite-to-illite trasformation based on diagenetic mineral series. Am. Mineral. 1992, 77, 967–976. [Google Scholar]
- Śrondoń, J. Nature of mixed-layer clays and mechanisms of their formation and alteration. Annu. Rev. Earth Planet. Sci. 1999, 27, 19–53. [Google Scholar] [CrossRef]
- Jagodzinski, H. Eindimensionale Fehlordnung in Kristallen und ihr Einfluss auf die Röntgeninterferenzen. I. Berechnung des Fehlordnungsgrades aus den Röntgenintensitäten. Acta Cryst. 1949, 2, 201–207. [Google Scholar] [CrossRef]
- Reynolds, R.C.; Hower, J. The nature of interlayering in mixed-layer illite-montmorillonites. Clays Clay Miner. 1970, 18, 25–36. [Google Scholar] [CrossRef]
- Reynolds, R.C. Interstratified Clay Minerals. In Crystal Structures of Clay Minerals and Their X-ray Identification, 2nd ed.; Brindley, G.W., Brown, G., Eds.; Mineralogical Society: London, UK, 1980; pp. 249–303. [Google Scholar]
- Moore, D.M.; Reynolds, R.C. X-ray Diffraction and the Identification and Analysis of Clay Minerals, 2nd ed.; Oxford University Press: New York, NY, USA, 1997; pp. 335–339. [Google Scholar]
- Nadeau, P.H.; Wilson, M.J.; McHardy, W.J.; Tait, J. Interstratified clays as fundamental particles. Science 1984, 225, 923–925. [Google Scholar] [CrossRef]
- Ufer, K.; Kleeberg, R.; Bergmann, J.; Dohrmann, R. Rietveld refinement of disordered illitesmectite mixed-layer structures by a recursive algorithm. II: Powder pattern refinement and quantitative phase analysis. Clays Clay Miner. 2012, 60, 535–552. [Google Scholar] [CrossRef]
- Biscoe, J.; Warren, B.E. An X-ray study of carbon black. J. Appl. Phys. 1942, 13, 364–371. [Google Scholar] [CrossRef]
- Reynolds, R.C. X-ray diffraction studies of Illite-smectite from rocks, <1 mm randomly oriented powders, and <1 mm oriented powder aggregates: The absence of laboratory-induced artifacts. Clays Clay Miner. 1992, 40, 387–396. [Google Scholar]
- Bish, D.L. Studies of clays and clay minerals using X-ray powder diffraction and the Rietveld method. In CMS Workshop, Computer Applications to X-ray Powder Diffraction Analysis of Clay Minerals; Walker, J.R., Reynolds, R.C., Eds.; Clay Minerals Society: Chantilly, VA, USA, 1993; Volume 5, pp. 79–112. [Google Scholar]
- Tsipursky, S.I.; Drits, V.A. The distribution of octahedral cations in the 2:1 layers of dioctahedral smectites studied by oblique-texture electron diffraction. Clay Miner. 1984, 19, 177–193. [Google Scholar] [CrossRef]
- Drits, V.A.; Lindgreen, H.; Salyn, A.L.; Ylagan, R.; McCarty, D.K. Semiquantitative determination of transvacantand cis-vacant 2:1 layers in illites and illite-smectites by thermal analysis and X-ray diffraction. Am. Mineral. 1998, 83, 1188–1198. [Google Scholar] [CrossRef]
- Drits, V.A.; McCarty, D.K.; Zviagina, B.B. Crystalchemical factors responsible for the distribution of octahedral cations over trans- and cis-sites in dioctahedral 2:1 layer silicates. Clays Clay Miner. 2006, 54, 131–152. [Google Scholar] [CrossRef]
- Drits, V.A.; Zviagina, B.B. Trans-vacant and cis-vacant 2:1 layer silicates: Structural features, identification, and occurrence. Clays Clay Miner. 2009, 57, 405–415. [Google Scholar] [CrossRef]
- Méring, J.; Oberlin, A. Smectite. In The Electron Optical Investigation of Clays; Gard, J.A., Ed.; Mineralogical Society: London, UK, 1971; pp. 193–229. [Google Scholar]
- Reynolds, R.C. Three dimensional X-ray powder diffraction from disordered illite: Simulation and interpretation of the diffraction patterns. In CMS Workshop, Computer Applications to X-ray Powder Diffraction Analysis of Clay Minerals; Walker, J.R., Reynolds, R.C., Eds.; Clay Minerals Society: Chantilly, VA, USA, 1993; Volume 5, pp. 43–78. [Google Scholar]
- McCarty, D.K.; Reynolds, R.C. Rotationally disordered illite-smectite in Paleozoic K-bentonites. Clays Clay Miner. 1995, 43, 271–284. [Google Scholar] [CrossRef]
- Drits, V.A.; Weber, F.; Salyn, A.L.; Tsipursky, S.L. X-ray identification of one-layer illite varieties: Application to the study of illites around uranium deposits of Canada. Clays Clay Miner. 1993, 41, 389–398. [Google Scholar] [CrossRef]
- Drits, V.A.; Besson, G.; Muller, F. An improved model for structural transformations of heat-treated aluminous dioctahedral 2:1 layer silicates. Clays Clay Miner. 1995, 43, 718–731. [Google Scholar] [CrossRef]
- Drits, V.A.; Salyn, A.L.; Šucha, V. Structural transformation of interstratified illite-smectites from Dolná Ves hydrothermal deposits: Dynamics and mechanisms. Clays Clay Miner. 1996, 44, 181–190. [Google Scholar] [CrossRef]
- Drits, V.A. Structural and chemical heterogeneity of layer silicates and clay minerals. Clay Miner. 2003, 38, 403–432. [Google Scholar] [CrossRef]
- Ylagan, R.F.; Altaner, S.P.; Pozzuoli, A. Reaction mechanisms of smectite illitization associated with hydrothermal alteration from Ponza island, Italy. Clays Clay Miner. 2000, 48, 610–631. [Google Scholar] [CrossRef]
- Lindgreen, H.; Drits, V.A.; Sakharov, B.A.; Salyn, A.L.; Wrang, P.; Dainyak, L.G. Illite-smectite structural changes during metamorphism in black Cambrian Alum shales from the Baltic area. Am. Miner. 2000, 85, 1223–1238. [Google Scholar] [CrossRef]
- Rietveld, H.M. Line profiles of neutron powder-diffraction peaks for structure refinement. Acta Cryst. 1967, 22, 151–152. [Google Scholar] [CrossRef]
- Rietveld, H.M. A profile refinement method for nuclear and magnetic structures. J. Appl. Crystallogr. 1969, 2, 65–71. [Google Scholar] [CrossRef]
- Aplin, A.C.; Matenaar, I.F.; McCarty, D.K.; van Der Pluijm, B.A. Influence of mechanical compaction and clay mineral diagenesis on the microfabric and porescale properties of deep-water gulf of Mexico mudstones. Clays Clay Miner. 2006, 54, 500–514. [Google Scholar] [CrossRef]
- Yuan, H.; Bish, D.L. Automated fitting of X-ray powder diffraction patterns from interstratified phyllosilicates. Clays Clay Miner. 2010, 58, 727–742. [Google Scholar] [CrossRef]
- Reynolds, R.C. Wildfire: A Computer Program for the Calculation of Three-Dimensional Powder X-ray Diffraction Patterns for Mica Polytypes and their Disordered Variations; Hanover: New Hampshire, MA, USA, 1994. [Google Scholar]
- Ufer, K.; Roth, G.; Kleeberg, R.; Stanjek, H.; Dohrmann, R.; Bergmann, J. Description of X-ray powder pattern of turbostratically disordered layer structures with a Rietveld compatible approach. Z. Kristallogr. 2004, 219, 519–527. [Google Scholar] [CrossRef]
- Bergmann, J.; Friedel, P.; Kleeberg, R. BGMN—A new fundamental parameters based Rietveld program for laboratory X-ray sources; it’s use in quantitative analysis and structure investigations. CPD Newsl. 1998, 20, 5–8. [Google Scholar]
- Ufer, K.; Stanjek, H.; Roth, G.; Kleeberg, R.; Dohrmann, R.; Kaufhold, S. Quantitative phase analysis of bentonites by the Rietveld method. Clays Clay Miner. 2008, 56, 272–282. [Google Scholar] [CrossRef]
- Wang, X.L.; Kleeberg, R.; Ufer, K. Routine investigation of important structural parameters of dioctahedral smectites by the Rietveld method. Appl. Clay Sci. 2018, 163, 257–264. [Google Scholar] [CrossRef]
- Wang, X.L.; Liao, L.B. Rietveld structure refinement of Cu-trien exchanged nontronites. Front. Chem. 2018, 6, 558. [Google Scholar] [CrossRef] [PubMed]
- Ufer, K.; Kleeberg, R.; Bergmann, J.; Dohrmann, R. Rietveld refinement of disordered illite-smectite mixed-layer structures by a recursive algorithm. I: One dimensional patterns. Clays Clay Miner. 2012, 60, 507–534. [Google Scholar] [CrossRef]
- Środoń, J.; Zeelmaekers, E.; Derkowski, A. Charge of component layers of illite-smectite in bentonites and the nature of end-member illite. Clays Clay Miner. 2009, 57, 649–671. [Google Scholar]
- Hong, H.; Zhao, L.; Fang, Q.; Thomas, J.A.; Wang, C.; Yu, J.; Gong, N.; Yin, K.; Ji, K. Volcanic Sources and Diagenetic Alteration of Permian–triassic Boundary K-bentonites In Guizhou Province, South China. Palaeogeogr. Palaeoclimatol. Palaeoecol. 2019, 519, 141–153. [Google Scholar] [CrossRef]
- Viczián, I. Hungarian investigations on the ‘Zempleni’ illite. Clays Clay Miner. 1997, 45, 114–115. [Google Scholar] [CrossRef]
- Wang, X.L.; Li, Y.; Wang, H.J. Structural characterization of octahedral sheet in dioctahedral smectites by thermal analysis. Minerals 2020, 10, 347. [Google Scholar] [CrossRef]
- Wolters, F.; Emmerich, K. Thermal reactions of smectites-Relation of dehydroxylation temperature to octahedral structure. Thermochim. Acta 2007, 462, 80–88. [Google Scholar] [CrossRef]
- Klein, C. Elements of Crystal Chemistry. In Manual of Mineral Science, 22nd ed.; John Wiley and Sons Inc.: New York, NY, USA, 2008; pp. 38–103. [Google Scholar]
- Wolters, F.; Lagaly, G.; Kahr, G.; Nüesch, R.; Emmerich, K. A comprehensive characterization of dioctahedral smectites. Clays Clay Miner. 2009, 57, 115–133. [Google Scholar] [CrossRef]
- Köster, H.M.; Schwertmann, U. Dreischichtminerale; Tonminerale, T., Jasmund, K., Lagaly, G., Eds.; Steinkopff Verlag: Dresden, Germany, 1993; pp. 33–58. [Google Scholar]
- Cuadros, J.; Altaner, S.P. Characterization of mixed-layer illite-smectite from bentonites using microscopic, chemical and X-ray methods: Constraints on the smectite-to-illite transformation mechanism. Am. Mineral. 1998, 83, 762–774. [Google Scholar] [CrossRef]
- Cuadros, J.; Altaner, S.P. Compositional and structural features of the octahedral sheet in mixed-layer illite-smectite from bentonites. Eur. J. Mineral. 1998, 10, 111–124. [Google Scholar] [CrossRef]
- Sato, T.; Watanabe, T.; Otsuka, R. Effects of layer charge, charge location, and energy change on expansion properties of dioctahedral smectites. Clays Clay Miner. 1992, 40, 103–113. [Google Scholar] [CrossRef]
- Sato, T.; Murakami, T.; Watanabe, T. Change in layer charge of smectites and smectite layers in illite/smectite during diagenetic alteration. Clays Clay Miner. 1996, 44, 460–469. [Google Scholar] [CrossRef]
- Ferrage, E.; Lanson, B.; Sakharov, B.A.; Drits, V.A. Investigation of smectite hydration properties by modeling experimental X-ray diffraction pattern. Part, I. Montmorillonite hydration properties. Am. Mineral. 2005, 90, 1358–1374. [Google Scholar] [CrossRef] [Green Version]


| Samples | Geological Conditions | Origin | References |
|---|---|---|---|
| ISCz-1 | - | Slovakia | Clay Minerals Society (CMS) |
| Ch4 | Diagenetic | Upper Silesian Basin Poland | Środoń et al. [37] |
| 1M4 | |||
| 1CZ3 | |||
| Fuzz 6 | Hydrothermal | Füzérradvány, Hungary | Viczián [39] |
| JCC-1 | Diagenetic | PTB sections, Guizhou Province, South China | Hong et al. [38] |
| Refined Probability and Proportion Parameters | |
|---|---|
| wI | proportion of illitic layers |
| p0 | probability of adjacent layers without rotation |
| P60/120 | The ratio of n·60° rotation to n·120° rotation |
| p60 | probability of adjacent layers with n·60° rotation |
| p120 | probability of adjacent layers with n·120° rotation |
| Pcv | probability of a cis-vacant layer |
| Samples | Oxides (%) | |||||||||||||
|---|---|---|---|---|---|---|---|---|---|---|---|---|---|---|
| SiO2 | Al2O3 | K2O | CaO | MgO | Fe2O3 | ZnO | NiO | P2O5 | TiO2 | ZrO2 | CuO | LOI * | Sum before Normalization | |
| ISCz-1 | 47.10 | 25.53 | 4.47 | 0.88 | 2.15 | 1.65 | 0.04 | 0.00 | 0.00 | 0.00 | 0.00 | 0.00 | 18.18 | 97 |
| 1M4 | 52.56 | 22.46 | 3.15 | 1.58 | 2.97 | 2.95 | 0.08 | 0.08 | 0.00 | 0.00 | 0.00 | 0.00 | 14.25 | 96.6 |
| Ch4 | 52.21 | 25.09 | 4.16 | 1.15 | 2.90 | 2.48 | 0.00 | 0.00 | 0.00 | 0.00 | 0.00 | 0.00 | 12.02 | 96.6 |
| Fuzz 6 | 50.41 | 30.08 | 7.22 | 0.72 | 2.47 | 0.42 | 0.00 | 0.00 | 0.00 | 0.00 | 0.00 | 0.00 | 8.67 | 96.4 |
| JCC-1 | 50.09 | 29.00 | 6.37 | 0.88 | 1.75 | 1.87 | 0.00 | 0.00 | 0.08 | 0.32 | 0.03 | 0.00 | 9.60 | 95.2 |
| ICz3 | 51.03 | 20.20 | 1.09 | 2.34 | 2.96 | 3.03 | 0.07 | 0.00 | 0.00 | 0.00 | 0.00 | 0.07 | 19.28 | 96.8 |
| Samples | Chemical Formulae/FU | Occupancy of Octahedral Sites | Octahedral Iron Occupancy |
|---|---|---|---|
| ISCz-1 | 2.06 | 0.044 | |
| 1M4 | 2.03 | 0.079 | |
| Ch4 | 2.06 | 0.063 | |
| Fuzz 6 | 2.05 | 0.010 | |
| JCC-1 | 2.02 | 0.050 | |
| ICz3 | 2.03 | 0.084 |
| Samples | Proportion of tv/% | Proportion of cv/% | Classification |
|---|---|---|---|
| ISCz-1 | 47.2 | 52.8 | cv/tv |
| 1M4 | 51.5 | 48.5 | tv/cv |
| Ch4 | 48.6 | 51.4 | cv/tv |
| Fuzz 6 | 54.9 | 45.1 | tv/cv |
| JCC-1 | 68.8 | 31.2 | tv/cv |
| ICz3 | 20.4 | 79.6 | cv/tv |
| Models | Rwp/% | |||||||||||
|---|---|---|---|---|---|---|---|---|---|---|---|---|
| ISCz-1 | 1M4 | Ch4 | Fuzz 6 | JCC-1 | ICz3 | |||||||
| AD | EG | AD | EG | AD | EG | AD | EG | AD | EG | AD | EG | |
| R0 | 21.07 | 22.86 | 20.15 | 21.43 | 19.61 | 21.87 | 19.26 | 23.54 | 24.16 | 23.06 | 7.06 | 8.5 |
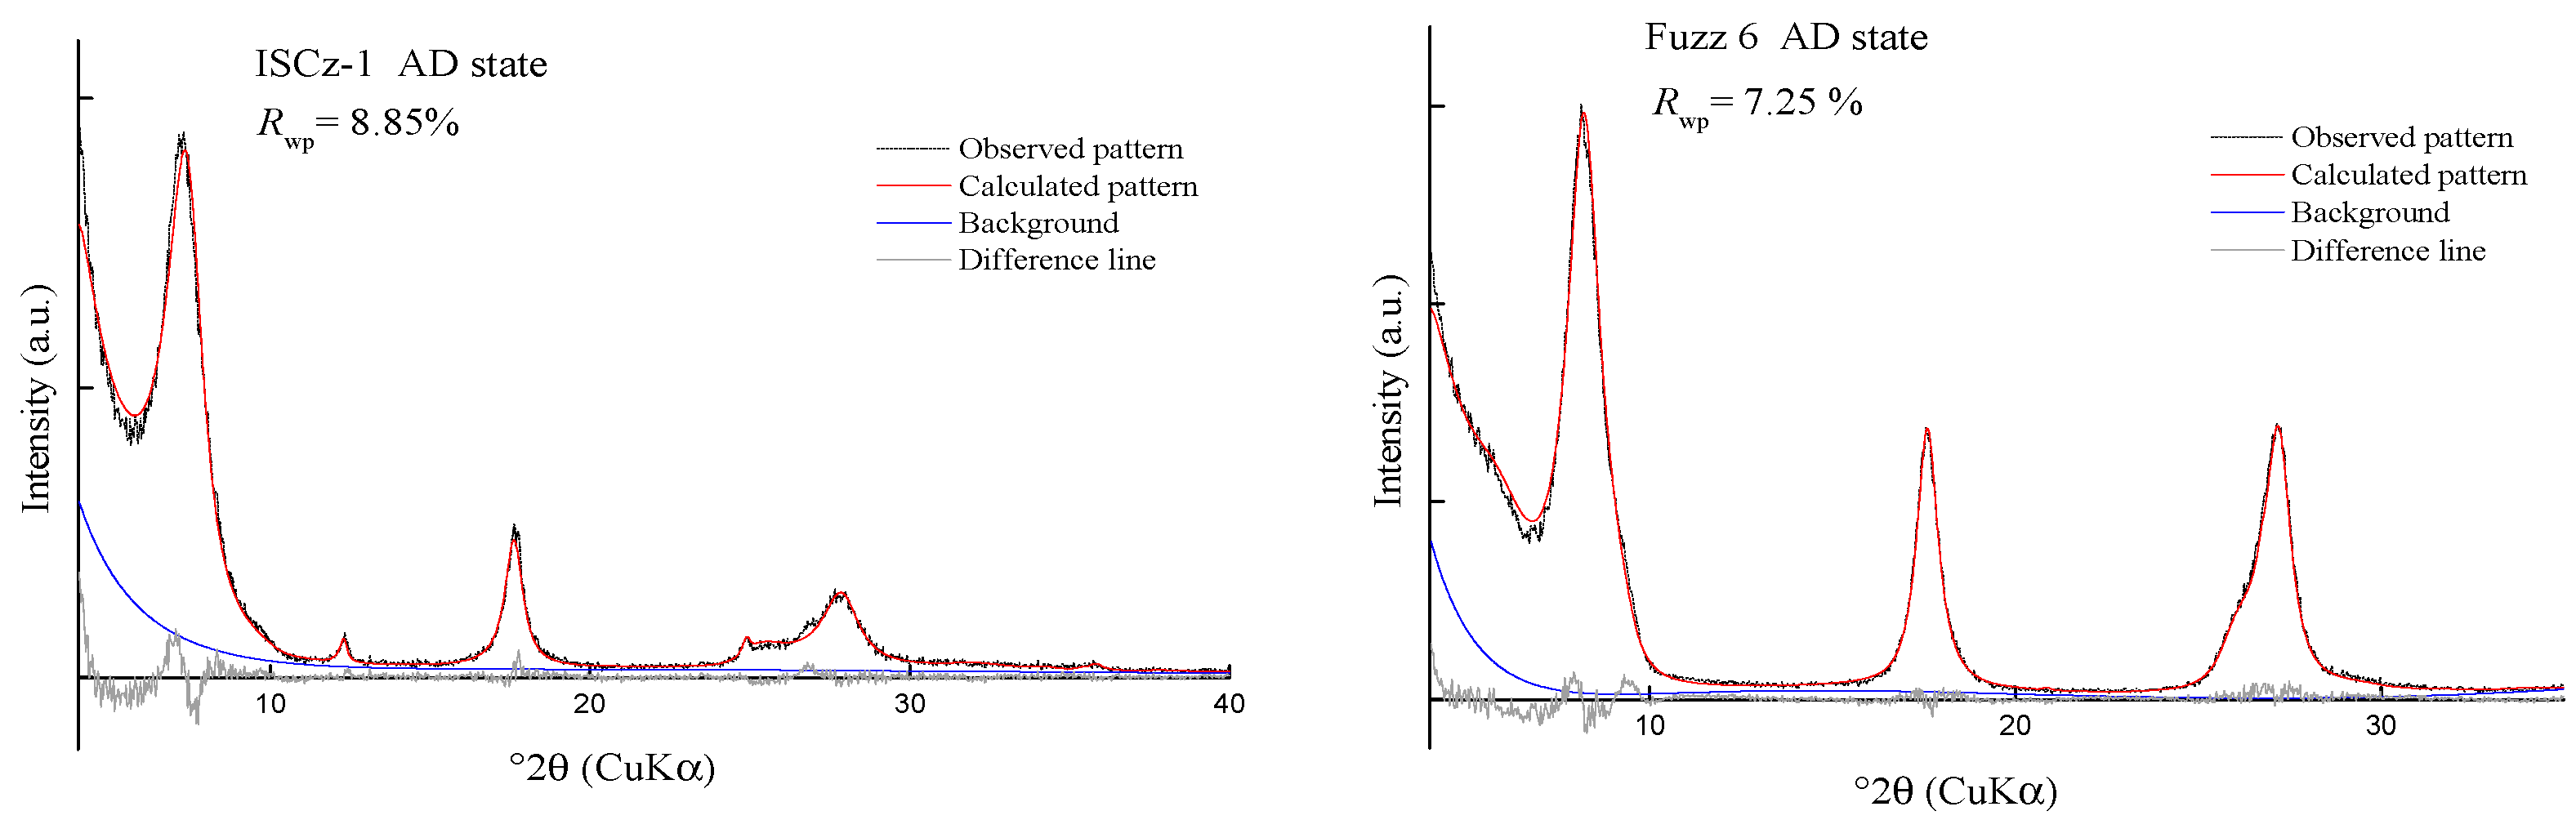
| R1 | 8.85 | 9.69 | 7.66 | 8.2 | 8.67 | 10.47 | 13.89 | 20.16 | 16.29 | 20.74 | 8.54 | 9.07 |
| R2 | 9.52 | 10.37 | 9.21 | 10.58 | 10.38 | 13.64 | 9.73 | 18.62 | 13.88 | 15.68 | 23.42 | 26.13 |
| R3 | 19.06 | 23.49 | 19.64 | 23.97 | 21.96 | 22.09 | 7.25 | 8.54 | 10.75 | 8.95 | 25.56 | 27.2 |
| Start Value | Refinement Limits | ISCz-1 (R1) | 1M4 (R1) | Ch4 (R1) | ||||
|---|---|---|---|---|---|---|---|---|
| AD Rwp = 8.85% Rexp = 6.63% | EG Rwp = 9.69% Rexp = 6.69% | AD Rwp = 7.66% Rexp = 6.46% | EG Rwp = 8.20% Rexp = 6.60% | AD Rwp = 8.67% Rexp = 6.83% | EG Rwp = 10.47% Rexp = 6.58% | |||
| Atomic occupancies | ||||||||
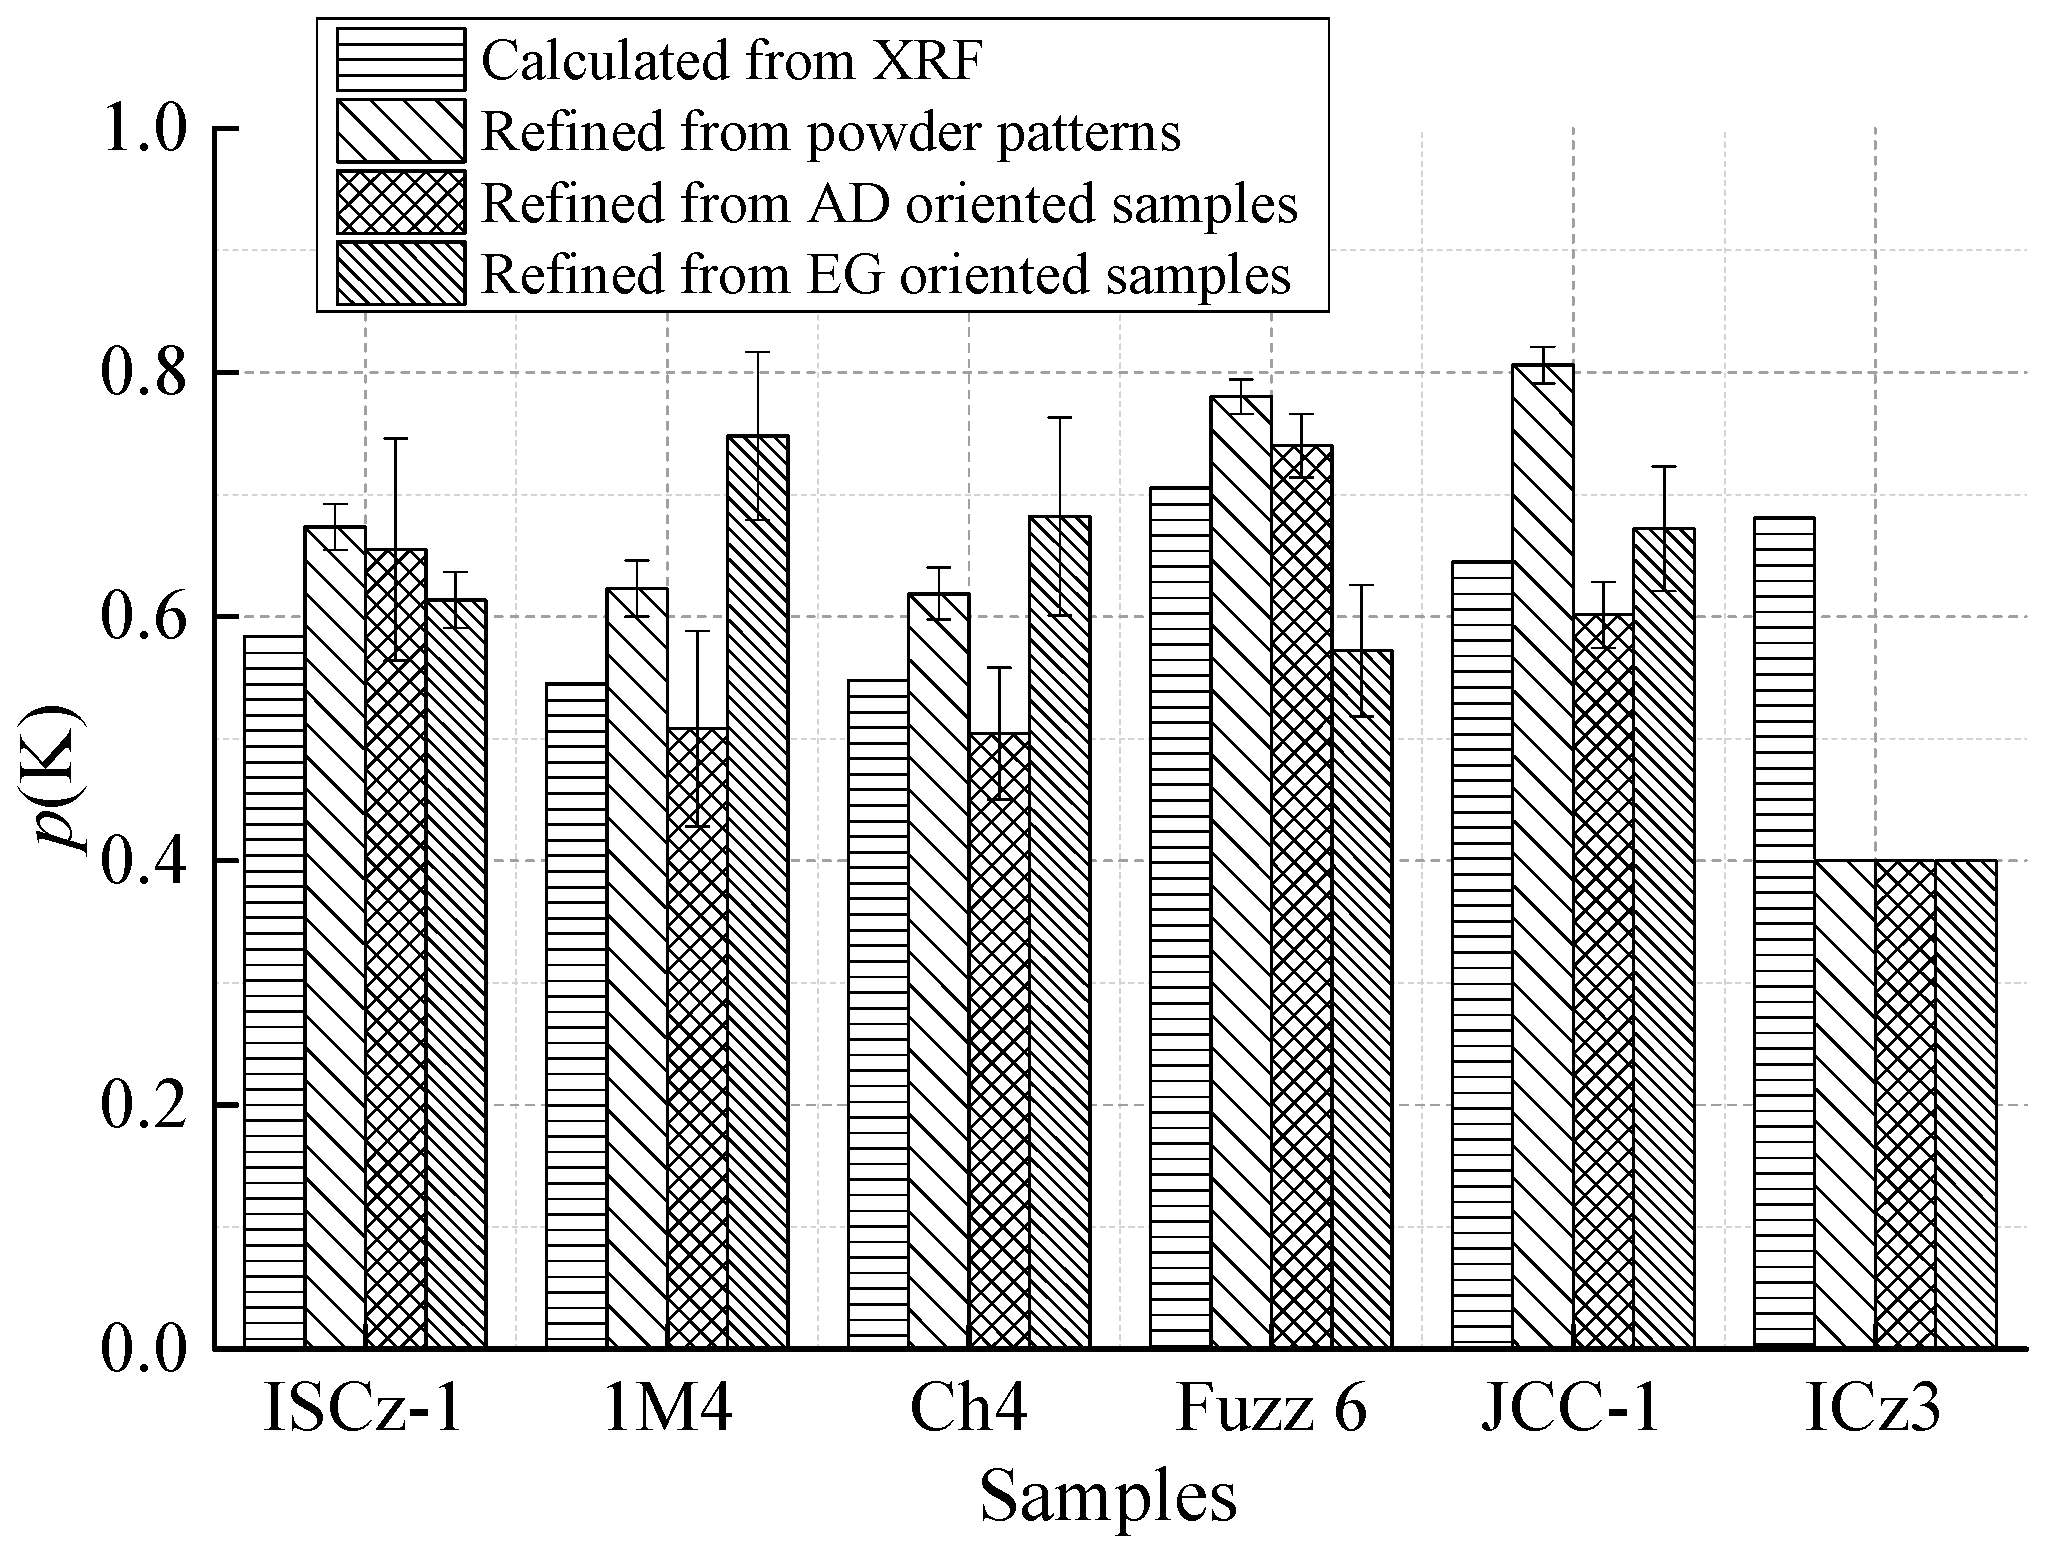
| p(K) (3σ) | 0.4 | 0.4–1 | 0.66 (9) | 0.61 (2) | 0.51 (9) | 0.75 (7) | 0.50 (5) | 0.68 (8) |
| p(Ca) (3σ) | 0.2 | 0.1–0.3 | 0.1 | - | 0.3 | - | 0.1 | - |
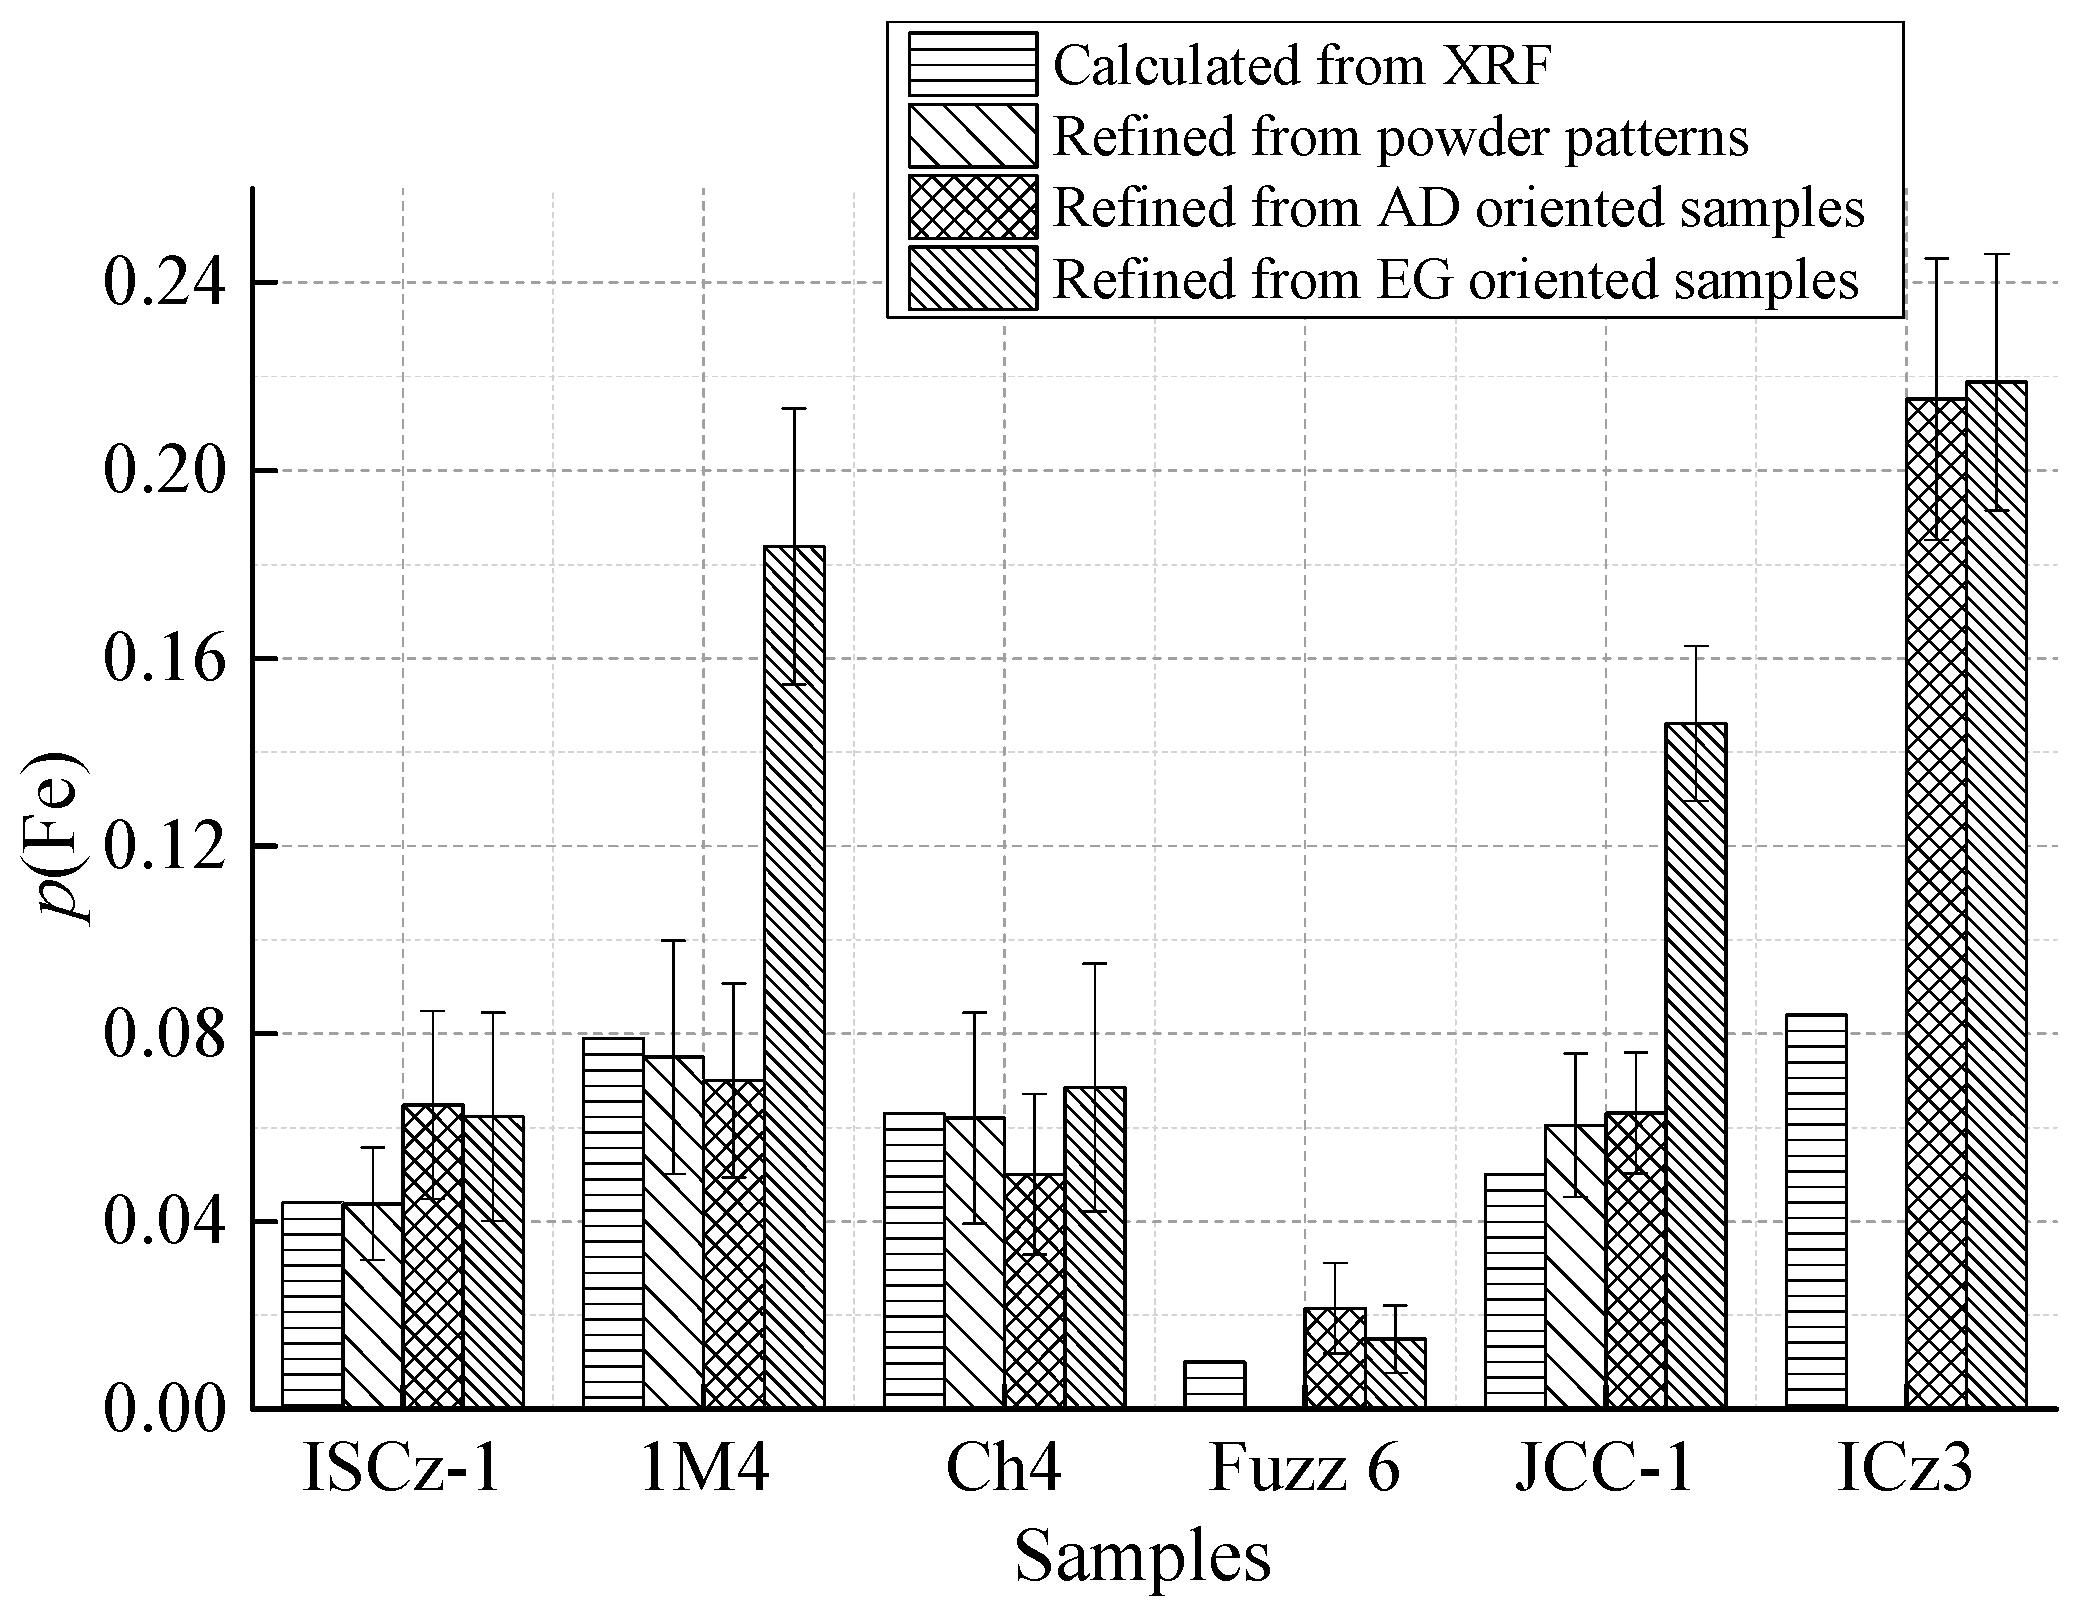
| p(Fe) (3σ) | 0.1 | 0–0.6 | 0.065 (2) | 0.062 (2) | 0.070 (2) | 0.18 (3) | 0.05 (1) | 0.069 (3) |
| Proportion and probabilities | ||||||||
| wI (3σ) | 0.5 | 0–1 | 0.69 (1) | 0.68 (1) | 0.61 (4) | 0.52 (3) | 0.71 (2) | 0.64 (3) |
| Start Value | Refinement Limits | Fuzz 6 (R3) | JCC-1 (R3) | ICz3 (R0) | ||||
| AD Rwp = 7.25% Rexp = 4.87% | EG Rwp = 8.54% Rexp = 5.22% | AD Rwp = 10.75% Rexp = 8.32% | EG Rwp = 8.95% Rexp = 7.98% | AD Rwp = 7.06% Rexp = 4.96% | EG Rwp = 8.50% Rexp = 5.54% | |||
| Atomic occupancies | ||||||||
| p(K) (3σ) | 0.4 | 0.4–1 | 0.74 (3) | 0.57 (5) | 0.60 (3) | 0.67 (5) | 0.4 | 0.4 |
| p(Ca) (3σ) | 0.2 | 0.1–0.3 | 0.3 | - | 0.1 | - | 0.17 | - |
| p(Fe) (3σ) | 0.1 | 0–0.6 | 0.022 (1) | 0.015 (7) | 0.063 (1) | 0.15 (2) | 0.22 (3) | 0.22 (3) |
| Proportion and probabilities | ||||||||
| wI (3σ) | 0.5 | 0–1 | 0.87 (1) | 0.85 (5) | 0.86 (1) | 0.86 (1) | 0.22 (4) | 0.13 (2) |
| Start Value | Refinement Limits | ISCz-1 R1 | 1M4 R1 | Ch4 R1 | Fuzz6 R3 | JCC-1 R3 | ICz3 R0 | |
|---|---|---|---|---|---|---|---|---|
| Rwp = 5.95% Rexp = 3.89% | Rwp = 4.47% Rexp = 3.22% | Rwp = 4.61% Rexp = 3.38% | Rwp = 5.50% Rexp = 3.60% | Rwp = 4.44% Rexp = 3.42% | Rwp = 6.59% Rexp = 3.06% | |||
| Contents [mass %] | ||||||||
| I-S (3σ) | 98.7 (2) | 100.0 | 96.6 (3) | 99.6 (1) | 98.3 (1) | 100.0 | ||
| Quartz (3σ) | 1.3 (2) | 0 | 3.4 (3) | 0.4 (1) | 1.7 (1) | 0 | ||
| Lattice parameter | ||||||||
| a [nm] (3σ) | 0.5193 | 0.51–0.53 | 0.5197 (0) | 0.5194 (1) | 0.5199 (0) | 0.5195 (5) | 0.5194 (0) | 0.5167 (0) |
| Atomic occupancies | ||||||||
| p(K) (3σ) | 0.4 | 0.4–1 | 0.67 (2) | 0.62 (2) | 0.62 (2) | 0.78 (1) | 0.81 (2) | 0.4 |
| p(Ca) (3σ) | 0.2 | 0.01–0.3 | 0.3 | 0.3 | 0.3 | 0.3 | 0.3 | 0.1 |
| p(Fe) (3σ) | 0.2 | 0–0.7 | 0.044 (3) | 0. 075 (2) | 0.063 (2) | 0 | 0.060 (2) | 0 |
| Proportion and probabilities | ||||||||
| wI (3σ) | 0.5 | 0–1 | 0.72 (3) | 0.55 (4) | 0.64 (3) | 0.88 (1) | 0.85 (2) | 0.15 (3) |
| P0 (3σ) | 0.6 | 0.333–1 | 0.49 (12) | 0.39 (3) | 0.33 (2) | 0.64 (9) | 0.69 (9) | 0.49 (9) |
| P60/120 (3σ) | 0.5 | 0–1 | 0.49 (2) | 0.55 (4) | 0.51 (5) | 0.44 (2) | 0.47 (2) | 0.54 (5) |
| P60, P180, P300 (3σ) | 0.083 (4) | 0.11 (5) | 0.095 (4) | 0.053 (3) | 0.060 (4) | 0.11 (7) | ||
| P120, P240 (3σ) | 0.13 (10) | 0.14 (1) | 0.14 (1) | 0.10 (5) | 0.10 (7) | 0.14 (2) | ||
| Pcv (3σ) | 0.5 | 0–1 | 0.53 (2) | 0.46 (4) | 0.51 (5) | 0.57 (1) | 0.36 (2) | 0.67 (6) |
Publisher’s Note: MDPI stays neutral with regard to jurisdictional claims in published maps and institutional affiliations. |
© 2021 by the authors. Licensee MDPI, Basel, Switzerland. This article is an open access article distributed under the terms and conditions of the Creative Commons Attribution (CC BY) license (http://creativecommons.org/licenses/by/4.0/).
Share and Cite
Wang, X.; Wang, H. Structural Analysis of Interstratified Illite-Smectite by the Rietveld Method. Crystals 2021, 11, 244. https://doi.org/10.3390/cryst11030244
Wang X, Wang H. Structural Analysis of Interstratified Illite-Smectite by the Rietveld Method. Crystals. 2021; 11(3):244. https://doi.org/10.3390/cryst11030244
Chicago/Turabian StyleWang, Xiaoli, and Hejing Wang. 2021. "Structural Analysis of Interstratified Illite-Smectite by the Rietveld Method" Crystals 11, no. 3: 244. https://doi.org/10.3390/cryst11030244