Article

Energy Band Gap Modeling of Doped Bismuth Ferrite Multifunctional Material Using Gravitational Search Algorithm Optimized Support Vector Regression

by
Taoreed O. Owolabi
1,2 and
Mohd Amiruddin Abd Rahman
2,*
1
Physics and Electronics Department, Adekunle Ajasin University, Akungba Akoko 342111, Ondo State, Nigeria
2
Department of Physics, Faculty of Science, Universiti Putra Malaysia, UPM Serdang 43400, Selangor Darul Ehsan, Malaysia
*
Author to whom correspondence should be addressed.
Crystals 2021, 11(3), 246; https://doi.org/10.3390/cryst11030246
Submission received: 15 January 2021 / Revised: 31 January 2021 / Accepted: 4 February 2021 / Published: 28 February 2021

Abstract

:
Bismuth ferrite (BiFeO3) is a promising multiferroic and multifunctional inorganic chemical compound with many fascinating application potentials in sensors, photo-catalysis, optical devices, spintronics, and information storage, among others. This class of material has special advantages in the photocatalytic field due to its narrow energy band gap as well as the possibility of the internal polarization suppression of the electron-hole recombination rate. However, the narrow light absorption range, which results in a low degradation efficiency, limits the practical application of the compound. Experimental chemical doping through which the energy band gap of bismuth ferrite compound is tailored to the desired value suitable for a particular application is frequently accompanied by the lattice distortion of the rhombohedral crystal structure. The energy band gap of doped bismuth ferrite is modeled in this contribution through the fusion of a support vector regression (SVR) algorithm with a gravitational search algorithm (GSA) using crystal lattice distortion as a predictor. The proposed hybrid gravitational search based support vector regression HGS-SVR model was evaluated by its mean squared error (MSE), correlation coefficient (CC), and root mean square error (RMSE). The proposed HGS-SVR has an estimation capacity with an up to 98.06% accuracy, as obtained from the correlation coefficient on the testing dataset. The proposed hybrid model has a low MSE and RMSE of 0.0092 ev and 0.0958 ev, respectively. The hybridized algorithm further models the impact of several doping materials on the energy band gap of bismuth ferrite, and the predicted energy gaps are in excellent agreement with the measured values. The precision and robustness exhibited by the developed model substantiate its significance in predicting the energy band gap of doped bismuth ferrite at a relatively low cost while the experimental stress is circumvented.

Graphical Abstract

1. Introduction

Bismuth ferrite with the chemical formula BiFeO3 has been known since the 1950s [1]. However, its potential applications as a semiconductor multifunctional material in piezoelectric devices, spintronics, sensors, photosensitizers, and photocatalyisis have recently gained significant interest [2,3,4,5]. The narrow energy band gap characterizing this material allows the maximum and efficient utilization of the visible light from solar radiation energy as compared to the widely used TiO2 photocatalyst that absorbs in the UV range as a result of its wide band gap [6]. Other promising technological application areas of bismuth ferrite include wastewater treatment, in photovoltaics, in the photodegredation of organic dyes, in air purification processes, and in the generation of clean energy through hydrogen generation from water splitting [7]. The response of bismuth ferrite to visible light due to the nature of its band gap is of particular interest in photocatalytic applications because the material combines many unique features such as cost effectiveness, nontoxicity, long-term stability, special crystalline structure, electro-optical properties, and electrical conductivity [3]. This work determines the band gap energy of doped-bismuth ferrite from the crystal lattice distortion caused by doping using a hybrid gravitational search (HGS) algorithm and support vector regression (SVR) algorithm.
Bismuth ferrite is a visible light-driven inorganic perovskite photocatalyst with the general crystal structural formula ABX3, in which A and B represent the periodic table metal ions while X stands for anionic group [8,9,10]. Altering both the A and B sites of this material through doping mechanisms enhances the photocatalytic activity of bismuth ferrite through band gap tuning and consequently distorts its crystal structure. Pure bismuth ferrite is characterized by a distorted rhombohedral perovskite structure with a room temperature space group of R3c [11]. It should be noted that this space group allows spontaneous polarization formation, while the orbital overlap between O and Fe as well as magnetic exchange are controlled by the Fe-O-Fe angle. The corner and center crystal structural positions are occupied by Bi3+ and Fe3+ ions, respectively, while O2- ions occupy the face centers of the cube. The unit cell crystal lattice parameters are a = b = 0.559 nm (α = β = 90°) and c = 1.387 nm (γ = 120°) [12]. The rotational angle for oxygen octahedra contributes to the structural key description of the crystal structure of the compound. The angle 00 characterizing the cubic perovskite matches the ionic sizes completely. The perovskite structure of bismuth ferrite contains ferro-electricity at the Bi-site while the Fe-site describes its magnetism. The active lone pair of Bi3+ ions (which is stereo chemical in nature) contributes significantly to the compound polarization, while the polarization resides along the c-axis crystal structural parameter of the rhombohedral structure as a result of the dislocation of Bi ions as compared with the octahedral of FeO6 crystal. The perovskite structure of this compound is governed by the tolerance factor prescribed by Gold-Schmidt in 1926 [1]. If the change in the tolerance factor value is accompanied with a change in atomic species Fe3+ and Bi3+, the crystallographic symmetry becomes influenced and might change to tetragonal, orthorhombic, or monoclinic. The particle size, morphology, surface area, electronic band structure, and porosity are significant factors that affect the photo-activity of bismuth ferrite, while all this information is embedded in the crystal lattice parameters [1,12,13]. The crystal field that alters the electronic band structures, dipole moments, and production, as well as the transportation of charge carriers generated by photo, can be easily influenced by the oxygen octahedral, which is manifested from crystal lattice distortion after doping. The resulting distortion from doping is employed in this work to determine the corresponding band gap energy of doped bismuth ferrite.
Support vector regression (SVR) is a computational intelligence-based machine learning modeling method with the minimization principle (structural risk) as the mathematical bedrock of its formulation [14]. The algorithm relates the descriptive predictors with the desired target through the acquisition of patterns. In principle, real-life non-linear problems that are difficult to solve with a high degree of precision in the problem real space are mapped to feature space characterized with a high dimensionality with the aid of non-linear functions. Therefore, this method of problem handling brings about uniqueness to the SVR algorithm and has facilitated its application in many fields, such as condensed matter physics [15,16,17], laser physics [18,19,20], and material science [21,22,23], among others. Since the precision and accuracy of proposed model significantly depend on the choice of some hyper-parameters, the parameters were selected in this work using a gravitational search algorithm. The developed hybrid gravitational search based support vector regression HGS-SVR model is characterized by a high degree of robustness as well as precision, as observed from the obtained results, while the model is evaluated using three performance-measuring parameters.
The rest of the manuscript is arranged as follows: Section 2 of the manuscript presents the mathematical formulation of the developed model. The hybridization as well as the computational methodology implemented while developing the algorithms are presented in Section 3. Section 3 also includes the dataset description and acquisition. The results of the developed model are discussed in Section 4, while Section 5 presents the conclusions drawn from the outcomes of the research work.

2. Mathematical Description of the Algorithms Employed for the Modeling and Simulation

This section presents the mathematical background of the components of the developed model.

2.1. Gravitational Search Algorithm

The gravitational search algorithm (GSA) is a population-based heuristic intelligent optimization algorithm that was developed recently [24]. The algorithm is governed by gravitational principles and Newton’s second law of motion. The basic gravitational law governing the operational principles and procedures of the algorithm is mathematically stated as presented in Equation (1):
F = G M a M b R 2 ,
where G represents the gravitational constant; F stands for the magnitude of the gravitational pull; while Ma and Mb, respectively, represent the masses of agent a and b navigating the Newtonian search space defined by the user.
Objects in Newtonian mechanics are treated as agents in GSA and their global searching potentials are determined by the heaviness of the agents, as demonstrated by their sluggishness towards convergence. The objects are made to attract each other by the force of gravity, resulting in a gross movement of lighter objects towards heavier objects. The movement of the heavier objects is slower than that of the lighter objects, and the heavier objects offer a better solution to the problem. GSA begins by considering a gravitational system containing N number of agents; the ith agent’s position is defined as depicted in Equation (2):
X i =   ( x i 1 . x i d . x i n )   f o r   i = 1 , 2 , 3 , . , N ,
where n represents the space dimension of the problem and x i d defines the i t h agent position in the d t h dimension.
The gravitational pull acting on objects of mass i from objects with mass j at time t is presented in Equation (3):
F i j d ( t ) = G ( t ) M i ( t ) × M j ( t ) R i j ( t ) + ε ( x j d ( t ) x i d ( t ) ) ,
where G ( t ) is the gravitational constant at time t ; M i and M j are the masses of agents i and j , respectively; R i j ( t ) is the Euclidian distance between i and j agents defined as in Equation (4); and ε is a small constant that ensures the randomness of the algorithm.
R i j ( t ) = X i ( t ) , X j ( t ) 2 .
The total gravitational force acting on the i t h agent in the d t h dimension is taken to be a weighted sum of the d t h component of other forces brought into play by neighboring agents. The formulation representing the total force is presented in Equation (5):
F i d ( t ) = j = 1 , j i N r a n d j F i j d ( t ) ,
where r a n d j stands for a random number spanning between 0 and 1.
Accordingly, the acceleration of the i t h agent at iteration time t and in d t h direction, a i d (t), is defined as presented in Equation (6):
a i d ( t ) = F i d ( t ) M i i ( t ) ,
where M i i represents the i t h agent’s inertial mass.
The subsequent velocity of an agent incorporates the sum of its previous velocity and acceleration. Therefore, the subsequent agent’s position and velocity can be computed through the implementation of Equations (7) and (8), respectively.
x i d ( t + 1 ) = x i d ( t ) +   v i d ( t + 1 ) ,
v i d ( t + 1 ) = r a n d i × v t d ( t ) +   a i d ( t ) ,
where v t d ( t ) and x i d ( t ) are the respective agents’ velocity and position.
The randomly initialized gravitational constant G at the commencement of the optimization processes is reduced as time proceeds to control the search accuracy. This indicates that G is a function of the initially defined value of G 0 as well as time t . The relationship is presented in Equation (9):
G ( t ) = G 0 e α t T ,
where α and G 0 are the positive constant and initial value of the gravitational constant, respectively.
Gravitational and inertial masses are calculated after a fitness evaluation. The heavier the mass of an agent, the more efficient the agent is in terms of the solution it represents. In other words, heavier masses will move slower than lighter masses. The masses are updated using Equations (10) and (11) with the assumption that:
M a i = M p i = M i i = M i ,   w h e r e   i = 1 , 2 , N ,
m i ( t ) = f i t i ( t ) w o r s t ( t ) b e s t ( t ) w o r s t ( t ) ,
M i ( t ) = m i ( t ) j = 1 N m j ( t ) ,
where f i t i ( t ) is the fitness value of agent i at time t , and the w o r s t ( t ) and b e s t ( t ) fitness are defined mathematically in Equations (12) and (13), respectively, for the minimization problem:
w o r s t ( t ) = max j ϵ { 1 , N } f i t j ( t ) ,
b e s t ( t ) = min j ϵ { 1 , N } f i t j ( t ) .

2.2. Support Vector Regression Based Algorithm

SVR is a supervised learning algorithm with an excellent capacity to recognize subtle patterns in a set of complex data. The algorithm belongs to the data analysis algorithms family governed by convex quadratic programming [25]. SVR is an extension of the work of Vapnik and co-workers on support vector machine (SVM) [26], which is a tool that is obtained from statistical learning theory for carrying out classification tasks. Several implementations of SVM have been achieved in different areas of research shortly after its proposal [27,28]. SVM is therefore a universal term that can be grouped into classification and regression algorithms based on the nature of the problem under consideration [29]. Support vector classification (SVC) employs only one slack variable, while SVR uses two slack variables. Both SVC and SVR employ very similar algorithms, and the difference in the algorithms includes the number of slack variables and the inclusion of loss function among others. In general, a support vector regression function relating the descriptors (x) with the targets is defined as presented in Equation (14).
f ( x , ) =   w , x + b
where w   ϵ   K and b .
The algorithm precisely determines the parameters w and b in a manner such that the bound error does not go beyond a threshold value represented by epsilon ε for the whole training set of data. A small value for vector ω is sought for achieving the aims of the algorithm. The Euclidean norm w 2 is subjected to minimization as well as convex optimization transformation in order to attain a flat function in Equation (14). The modified optimization problem is presented in Equation (15):
Minimize 1 2 w 2 .
Subject to:
{ f k w , x k b ε w , x k + b f k ε
Constraints that may prevent the possibility of attaining a convex optimized problem in Equation (15) are factored in through the inclusion of slack variables ( ξ k and ξ k * ). The new optimization problem is presented in Equation (16).
Minimize 1 2 w 2 + C k = 1 K ( ξ k + ξ k * ) .
Subject to:
{ f k w , x k b ε + ξ k w , x k + b f k ε + ξ k *   ξ k , ξ k * 0  
where the parameter C contained in Equation (16) is referred to as the penalty factor which regularizes the complexity of the generated function.
The predictive and future generalization strength of an SVR-based model can be strongly influenced by the optimal choice of hyper-parameters such as epsilon ε, penalty factor C, and the kernel option contained in the non-linear mapping function for data transformation. The acquired support vectors present in insensitive zones are controlled through epsilon, while the trade-off between the complexities in the SVR-based model and the maximum allowed error is regularized through the penalty factor defined by the user. The kernel option controls the extent and the degree of mapping while transforming from one feature space to another [30,31]. The choice of these parameters is meta-heuristically controlled using a gravitational search algorithm. The final regression function constructed in feature space with a high dimension with the inclusion of Lagrange multipliers (λ and λ*) and a non-linear mapping function is presented in Equation (17):
f ( x ) = k = 1 K ( λ k λ k * ) δ x k , x + b
where δ x k , x represents the kernel function.
The mathematical formulation of the implemented Gaussian function is defined by Equation (18):
δ x m , x = exp ( x j x i ψ )
where ψ stands for the kernel option.

3. Empirical Study and Computational Details of the Proposed Hybrid Model

This section presents the data acquisition method as well as the computational details of the proposed hybrid model. The initial results of the statistical analysis carried out on the implemented dataset are also presented.

3.1. Data Acquisition Description and Statistical Analysis

The structural distortion in the crystal lattice attributed to the introduction of different classes of doping materials into the rhombohedrally distorted perovskite structure of bismuth ferrite is the descriptive input to the developed HGS-SVR model. The distortions are encoded in the lattice parameters of the doped bismuth ferrite compounds extracted from the literature [3,11,32,33,34,35,36,37,38]. The corresponding experimentally measured energy band gap for all forty-three bismuth ferrite compounds are also drawn from the same source. The dataset employed for the simulation is analyzed and presented in Table 1. The entire content of the available data can be inferred from the obtained means, minimums, and maximums of each of the descriptors as well as the measured band gaps. The consistency in the dataset is inferred from the values of the standard deviations, while the coefficients of correlation relate the degree of linear relation existing between the energy band gaps and the crystal lattice parameters.
A low value of the coefficient of correlation between the crystal lattice parameter along the c-axis of rhombohedral and the measured band gap shows insufficiency of linear model in acquiring all the intricacies as well as pattern connecting the descriptor with the desired band gap. The crystal lattice parameter along the a-axis of the rhombohedral perovskite structure is negatively correlated with the measured band gap. The hybridization of the gravitational search algorithm and support vector regression proposed in this work captures and approximates the connections (which are non-linear) existing between the crystal lattice distortions and band gap energy of bismuth ferrite compound doped with other materials.

3.2. Computational Methodology Involved in the Developed HGS-SVR Model

The computational strategy employed in the hybridization of GSA with SVR algorithm was carried out using a MATLAB computing environment. The main function of the hybridized GSA is to optimally select hyper-parameters with which the SVR algorithm makes predictions. The acquired dataset available for the simulation was initially randomized and subsequently partitioned into two (a training and testing set). The partitioning ratio is 4:1, in which 80% of the total data (thirty-five data points) were implemented at the training phase of model development, while the remaining 20% (eight data points) serve as the testing dataset. The randomization process adopted allows the uniform allocation of data points into the training and testing phases and ensures efficient and effective computation. The optimized SVR hyperparameters include the penalty factor (C), epsilon ( ε ), and kernel option (ψ) of the most effective Gaussian kernel function. Step by step details of the computational methodology are described as follows:
Step I: Separation of data into phases after randomization: The extracted data from forty-three doped bismuth ferrite compounds were initially randomized to prevent unjust data distribution and further separated into training and testing sets in the ratio of 4:1.
Step II: Selection of a mapping function: Since data transformation to high-dimensional feature space is an integral part of SVR algorithm, a function was selected for this purpose among many functions, which include Sigmoid, Polynomial, and Gaussian.
Step III: Population of probable solutions within GSA frame: A specific number of agents was populated within GSA frame. Each agent encodes information about hyper-parameters and span within the search space. The upper search spaces for the penalty factor, kernel option and epsilon were set at 1000, 0.3, and 0.3, respectively, while the lower search spaces of the hyper-parameters were, respectively, set at 1, 0.001, and 0.001. Each agent goes into SVR algorithm using a training set of data and the root mean square error (RMSE) between the measured and predicted energy band gap was computed. The future generalization strength of the entire SVR model (corresponding to the number of the agents) was evaluated using a testing set of data with RMSE as the fitness function.
Step IV: Computation of agent mass, gravitational pull and acceleration: The mass of each of the agents, the gravitational pull, and the acceleration were, respectively, computed using Equations (5), (6) and (10).
Step V: Population replacement through position and velocity computation: implementation of Equations (7) and (8) leads to population replacement with most probable solution within the search space.
Step VI: Stopping criteria: The algorithm stops when Step II to Step V are repeated 100 times, while the optimum hyper-parameters and kernel functions were saved for subsequent implementation. Figure 1 depicts the flow chart of the entire computational methodology.

4. Results and Discussion

This section presents the results of the developed hybrid HGS-SVR model. Parameters that measure the estimation accuracy of the developed model are also presented. The dependency of the number of objects exploiting and exploring the defined search space on the model precision is presented. The implementation of the developed model to investigate the band gap energy of doped bismuth ferrite is discussed in this section.

4.1. Convergence of the Developed Hybrid Model

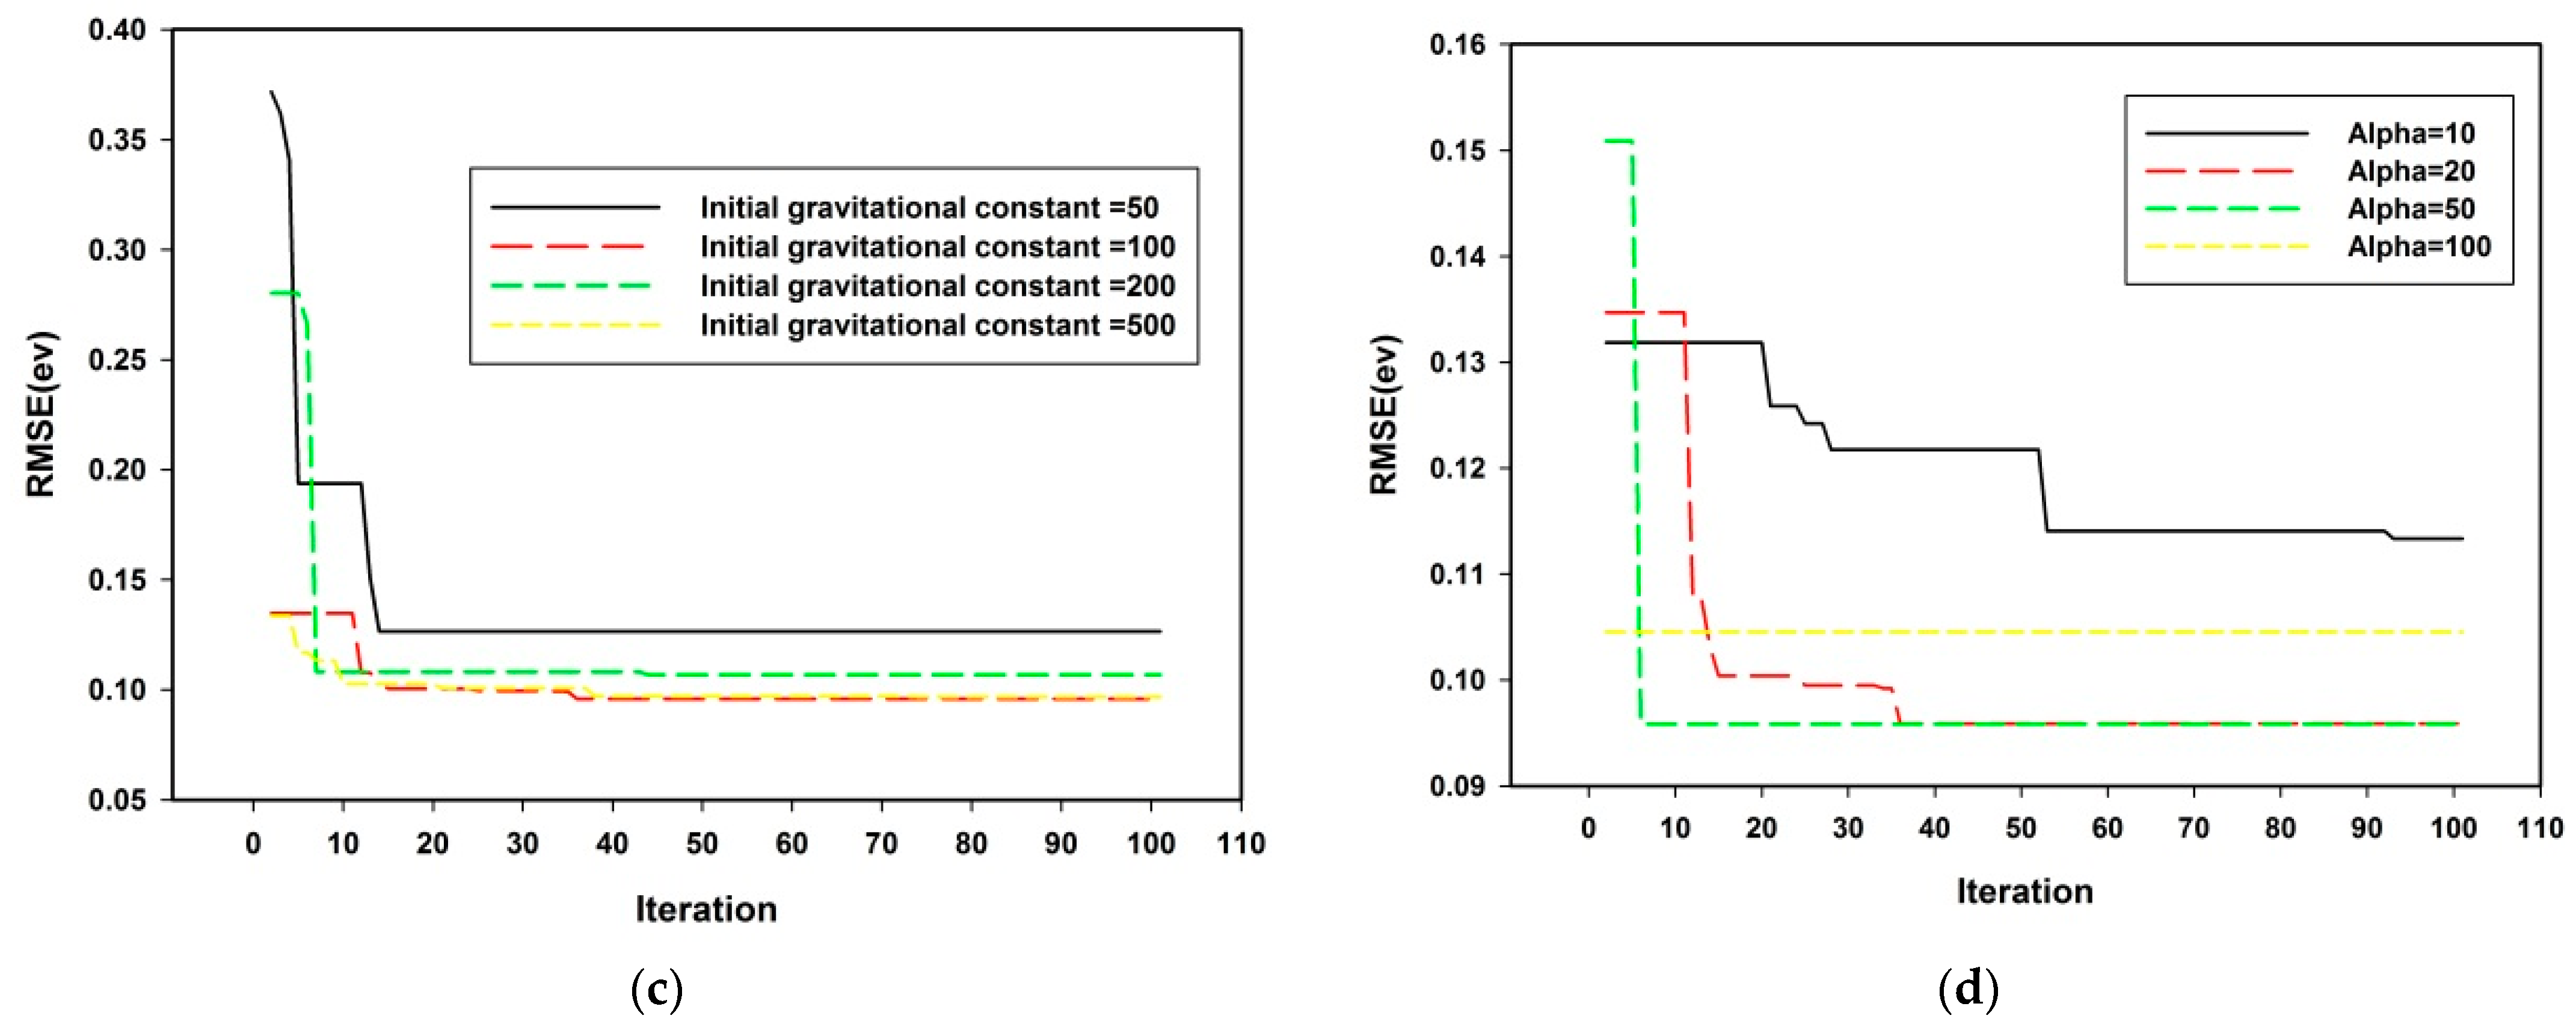
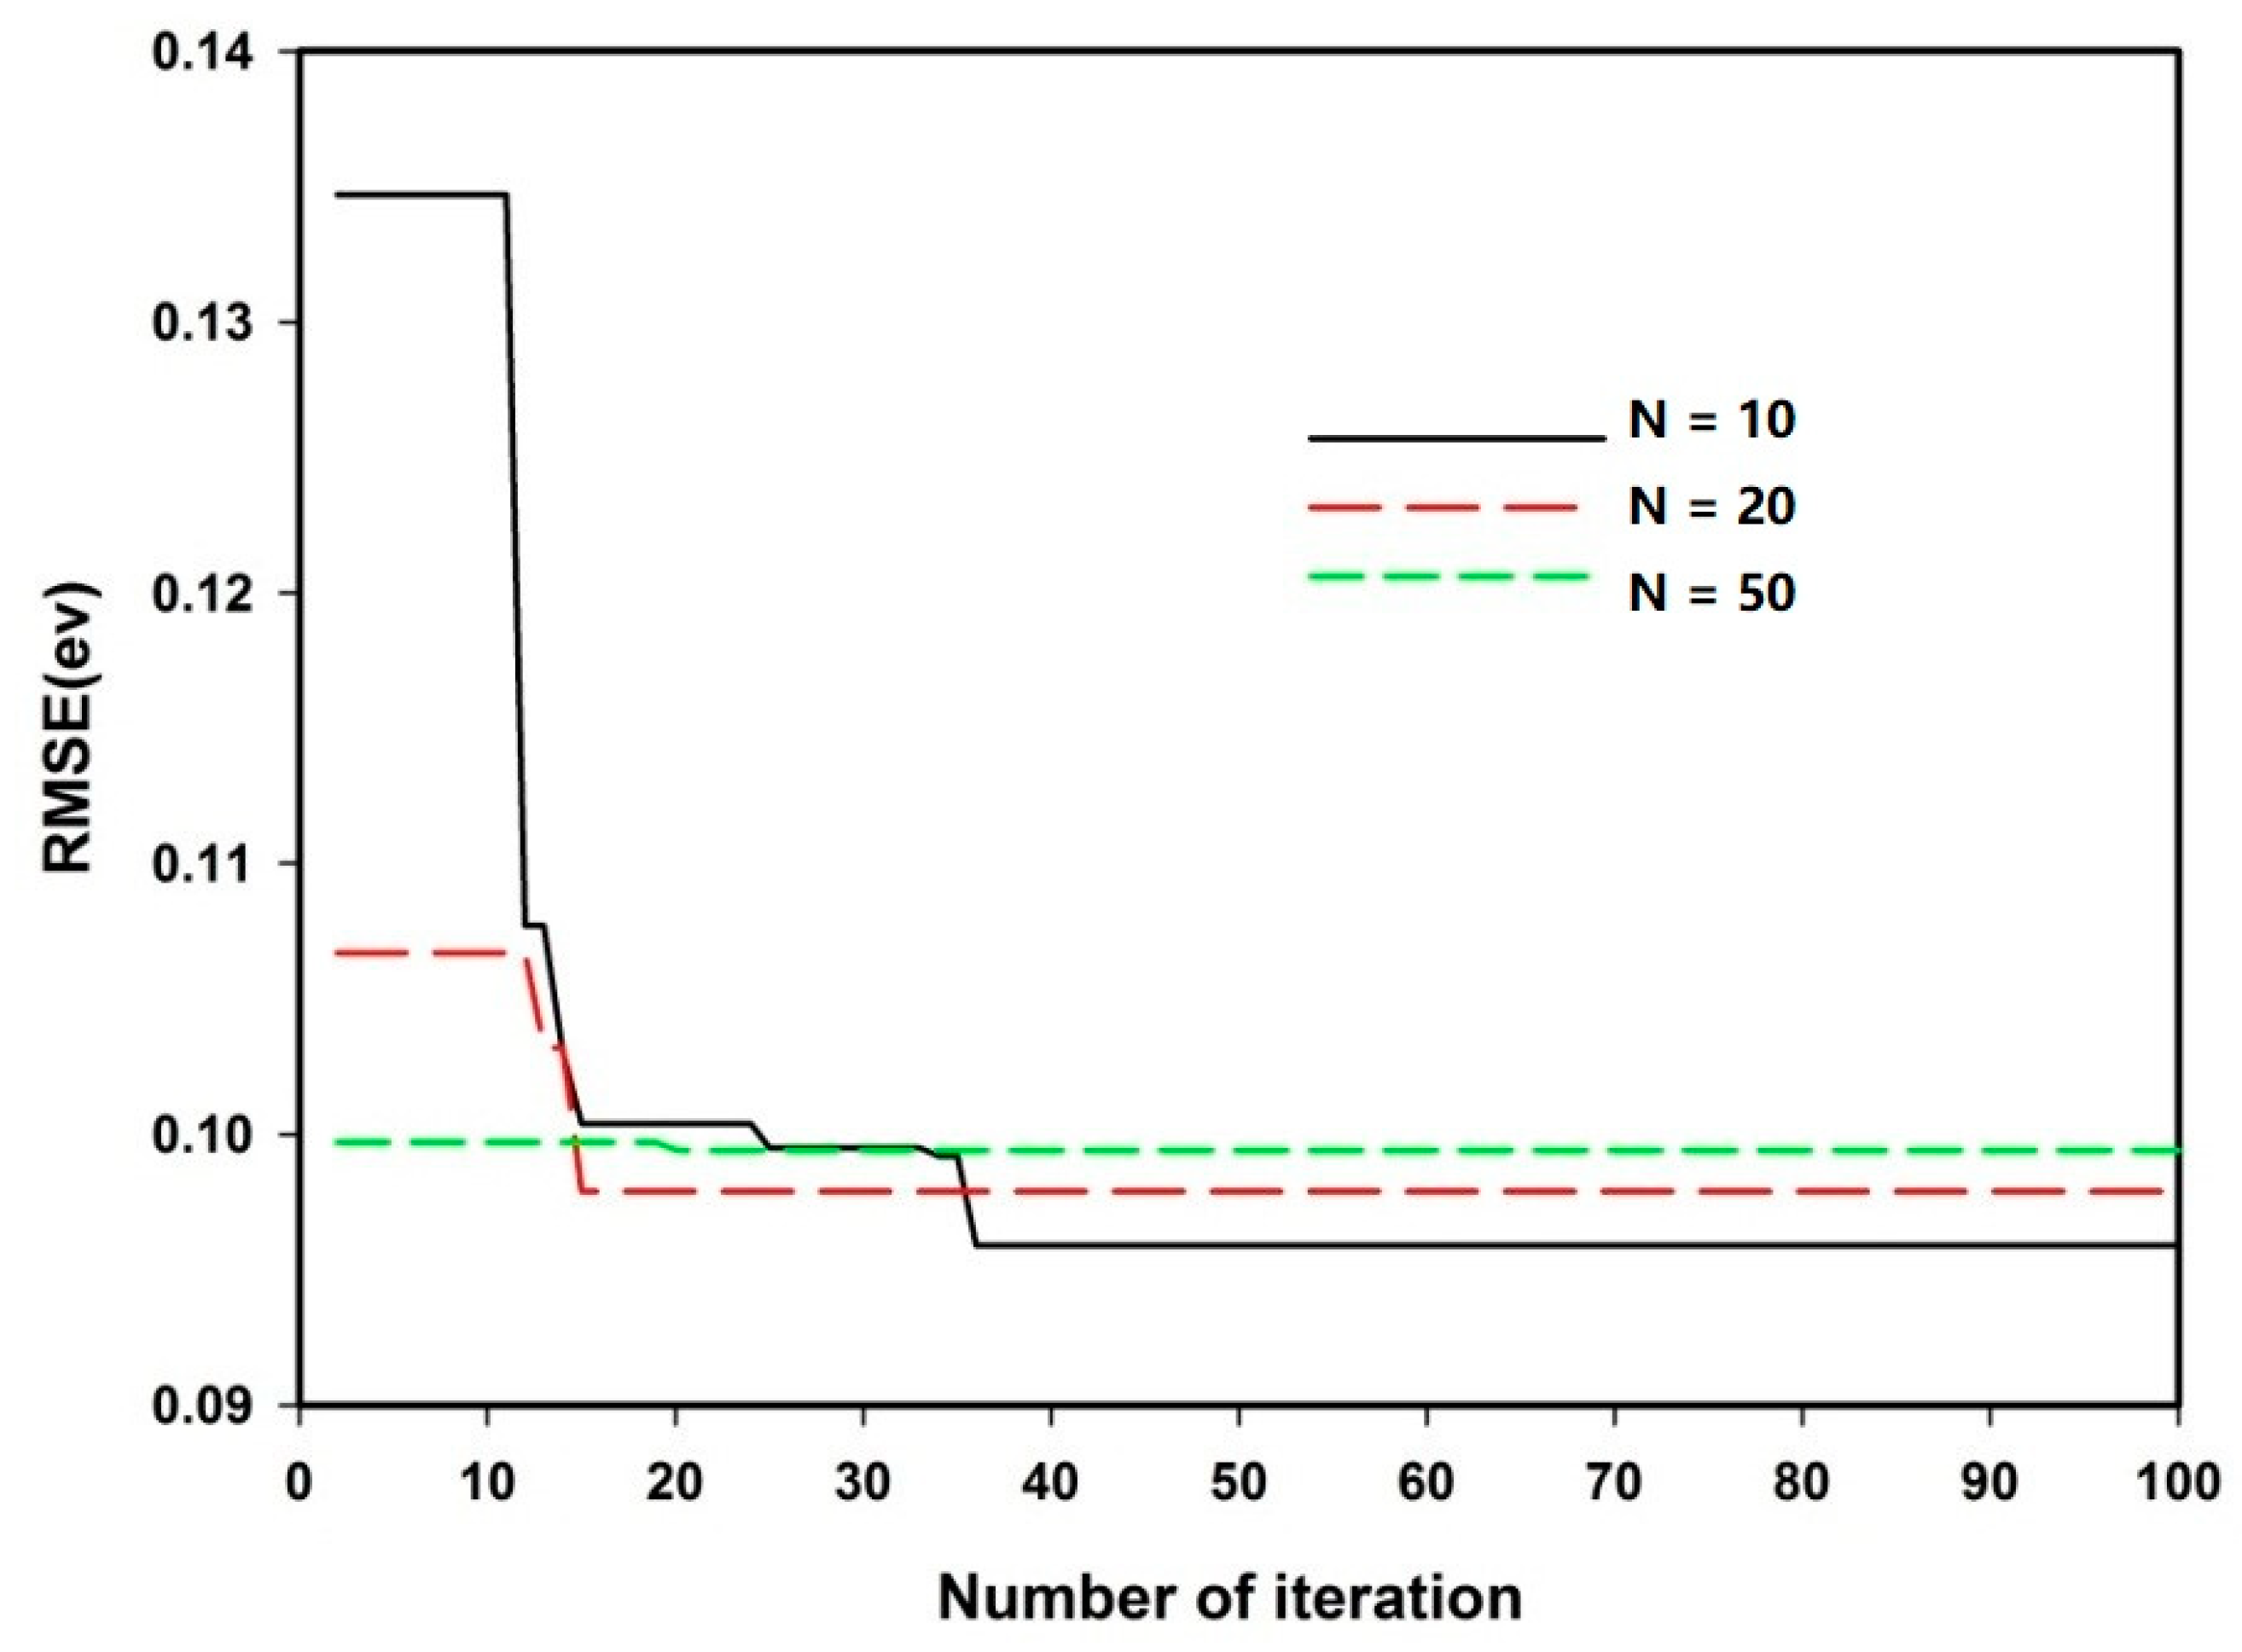
The performance of the employed gravitational search algorithm depends on the initial value of gravitational constant G 0 , positive constant alpha α, the initial population of the agent, and the maximum number of iterations. The maximum number of iterations was set at 100, since the search spaces of the hyper-parameters are well explored and convergence is frequently attained before reaching the maximum iteration of 100. Figure 2a presents five different runs of convergence of the developed hybrid model, while the number of the initial population, the initial gravitational constant, and the parameter alpha were set at ten, one hundred, and twenty, respectively. Similarly, Figure 2b presents the model convergence for an initial population of agents of twenty, while the initial gravitational constant and parameter alpha were also set at one hundred and twenty, respectively. Similarly, an investigation was carried out for a total of fifty in the initial population. The influence of the initial value of the gravitational constant and alpha on the performance of the developed hybrid model is, respectively, presented in Figure 2c,d. The optimum values of the initial value of gravitational constant and alpha are presented in Table 2. The best number of runs for each of the initial population of agents is presented in Figure 3. The figure presents the variation in the convergence as the number of objects exploiting and exploring the defined search space changes. Optimum convergence is attained when ten objects explore the search space. When the number of objects within gravitational pull of Newtonian mechanics increases to twenty, premature convergence occurs as a result of the complexity due to the large number of agents exploiting a limited search space. A further increase in the number of objects subjects the optimization problem to converge within local solutions. The optimum values of the hyper-parameters obtained using GSA are presented in Table 2.

4.2. Evaluation of the Developed Hybrid Model

Parameters that measure model performance such as the correlation coefficient (CC) between the measured band gap of doped bismuth ferrite and the predicted values using the developed HGS-SVR model, root mean square error (RMSE), and mean squared error (MSE) are used for the model evaluation during the training and testing phase of model development.
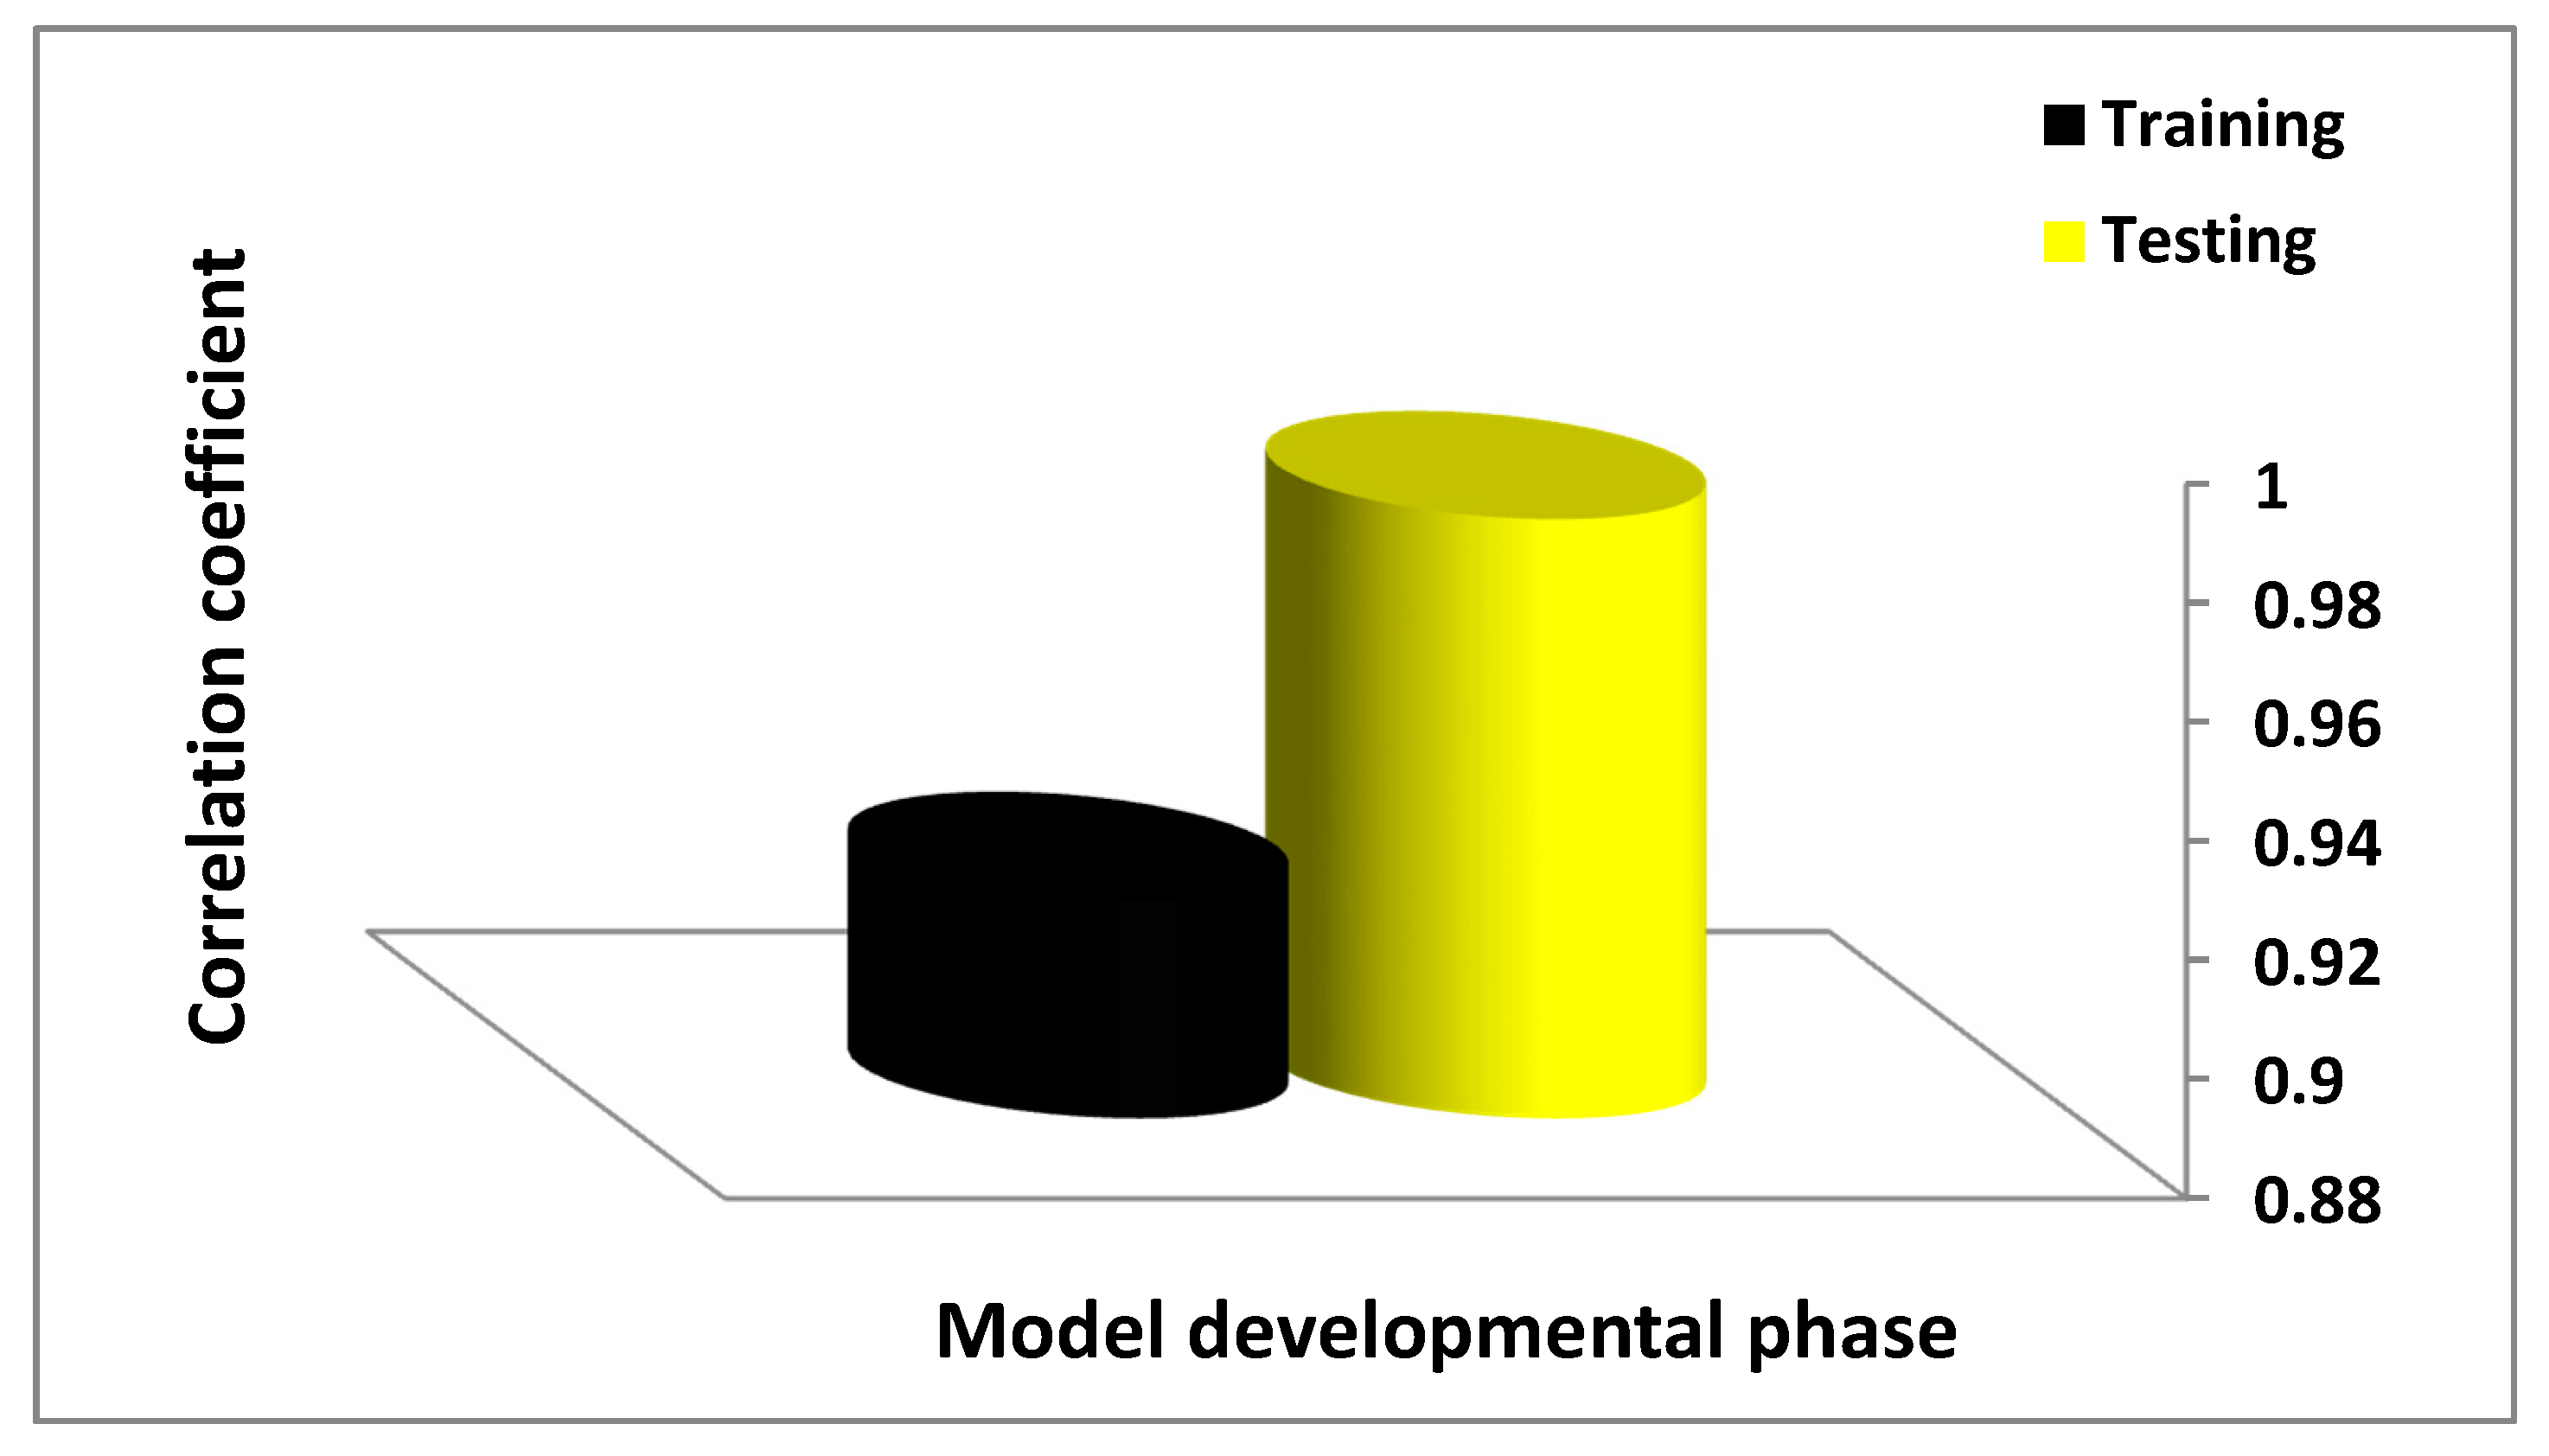
Figure 4 presents the values of the coefficient of correlation of the developed hybrid HGS-SVR model during the training and testing stages. The testing set of data shows a better performance as compared with the training set. The performance enhancement during the testing stage is 6.94% as compared with the result obtained during the training stage of the model. Figure 5 depicts the performance comparison on the basis of RMSE. The testing phase shows a reduced error while a performance improvement of 55.56% is obtained. Table 3 presents the values for each of the parameters during the training and testing stages of model development.
In order to further justify the predictive and generalization capacity of the developed hybrid model over the entire dataset, several experiments were conducted randomly using different portions of the dataset, while the hyper-parameters of SVR algorithm were set at optimum values, as presented in Table 2. Table 4 presents the results of the performance measuring the parameters for each of the runs. The mean value and the standard deviation for each of the runs for the two performance measuring parameters are also presented in Table 4. Relatively small values of standard deviation show the consistency of the predictive strength of the developed hybrid model, while the mean values of the performance measuring parameters still maintain a better performance during the testing stage of model development.

4.3. Influence of Aluminum Particles on Band Gap of Bismuth Ferrite Using HGS-SVR Model

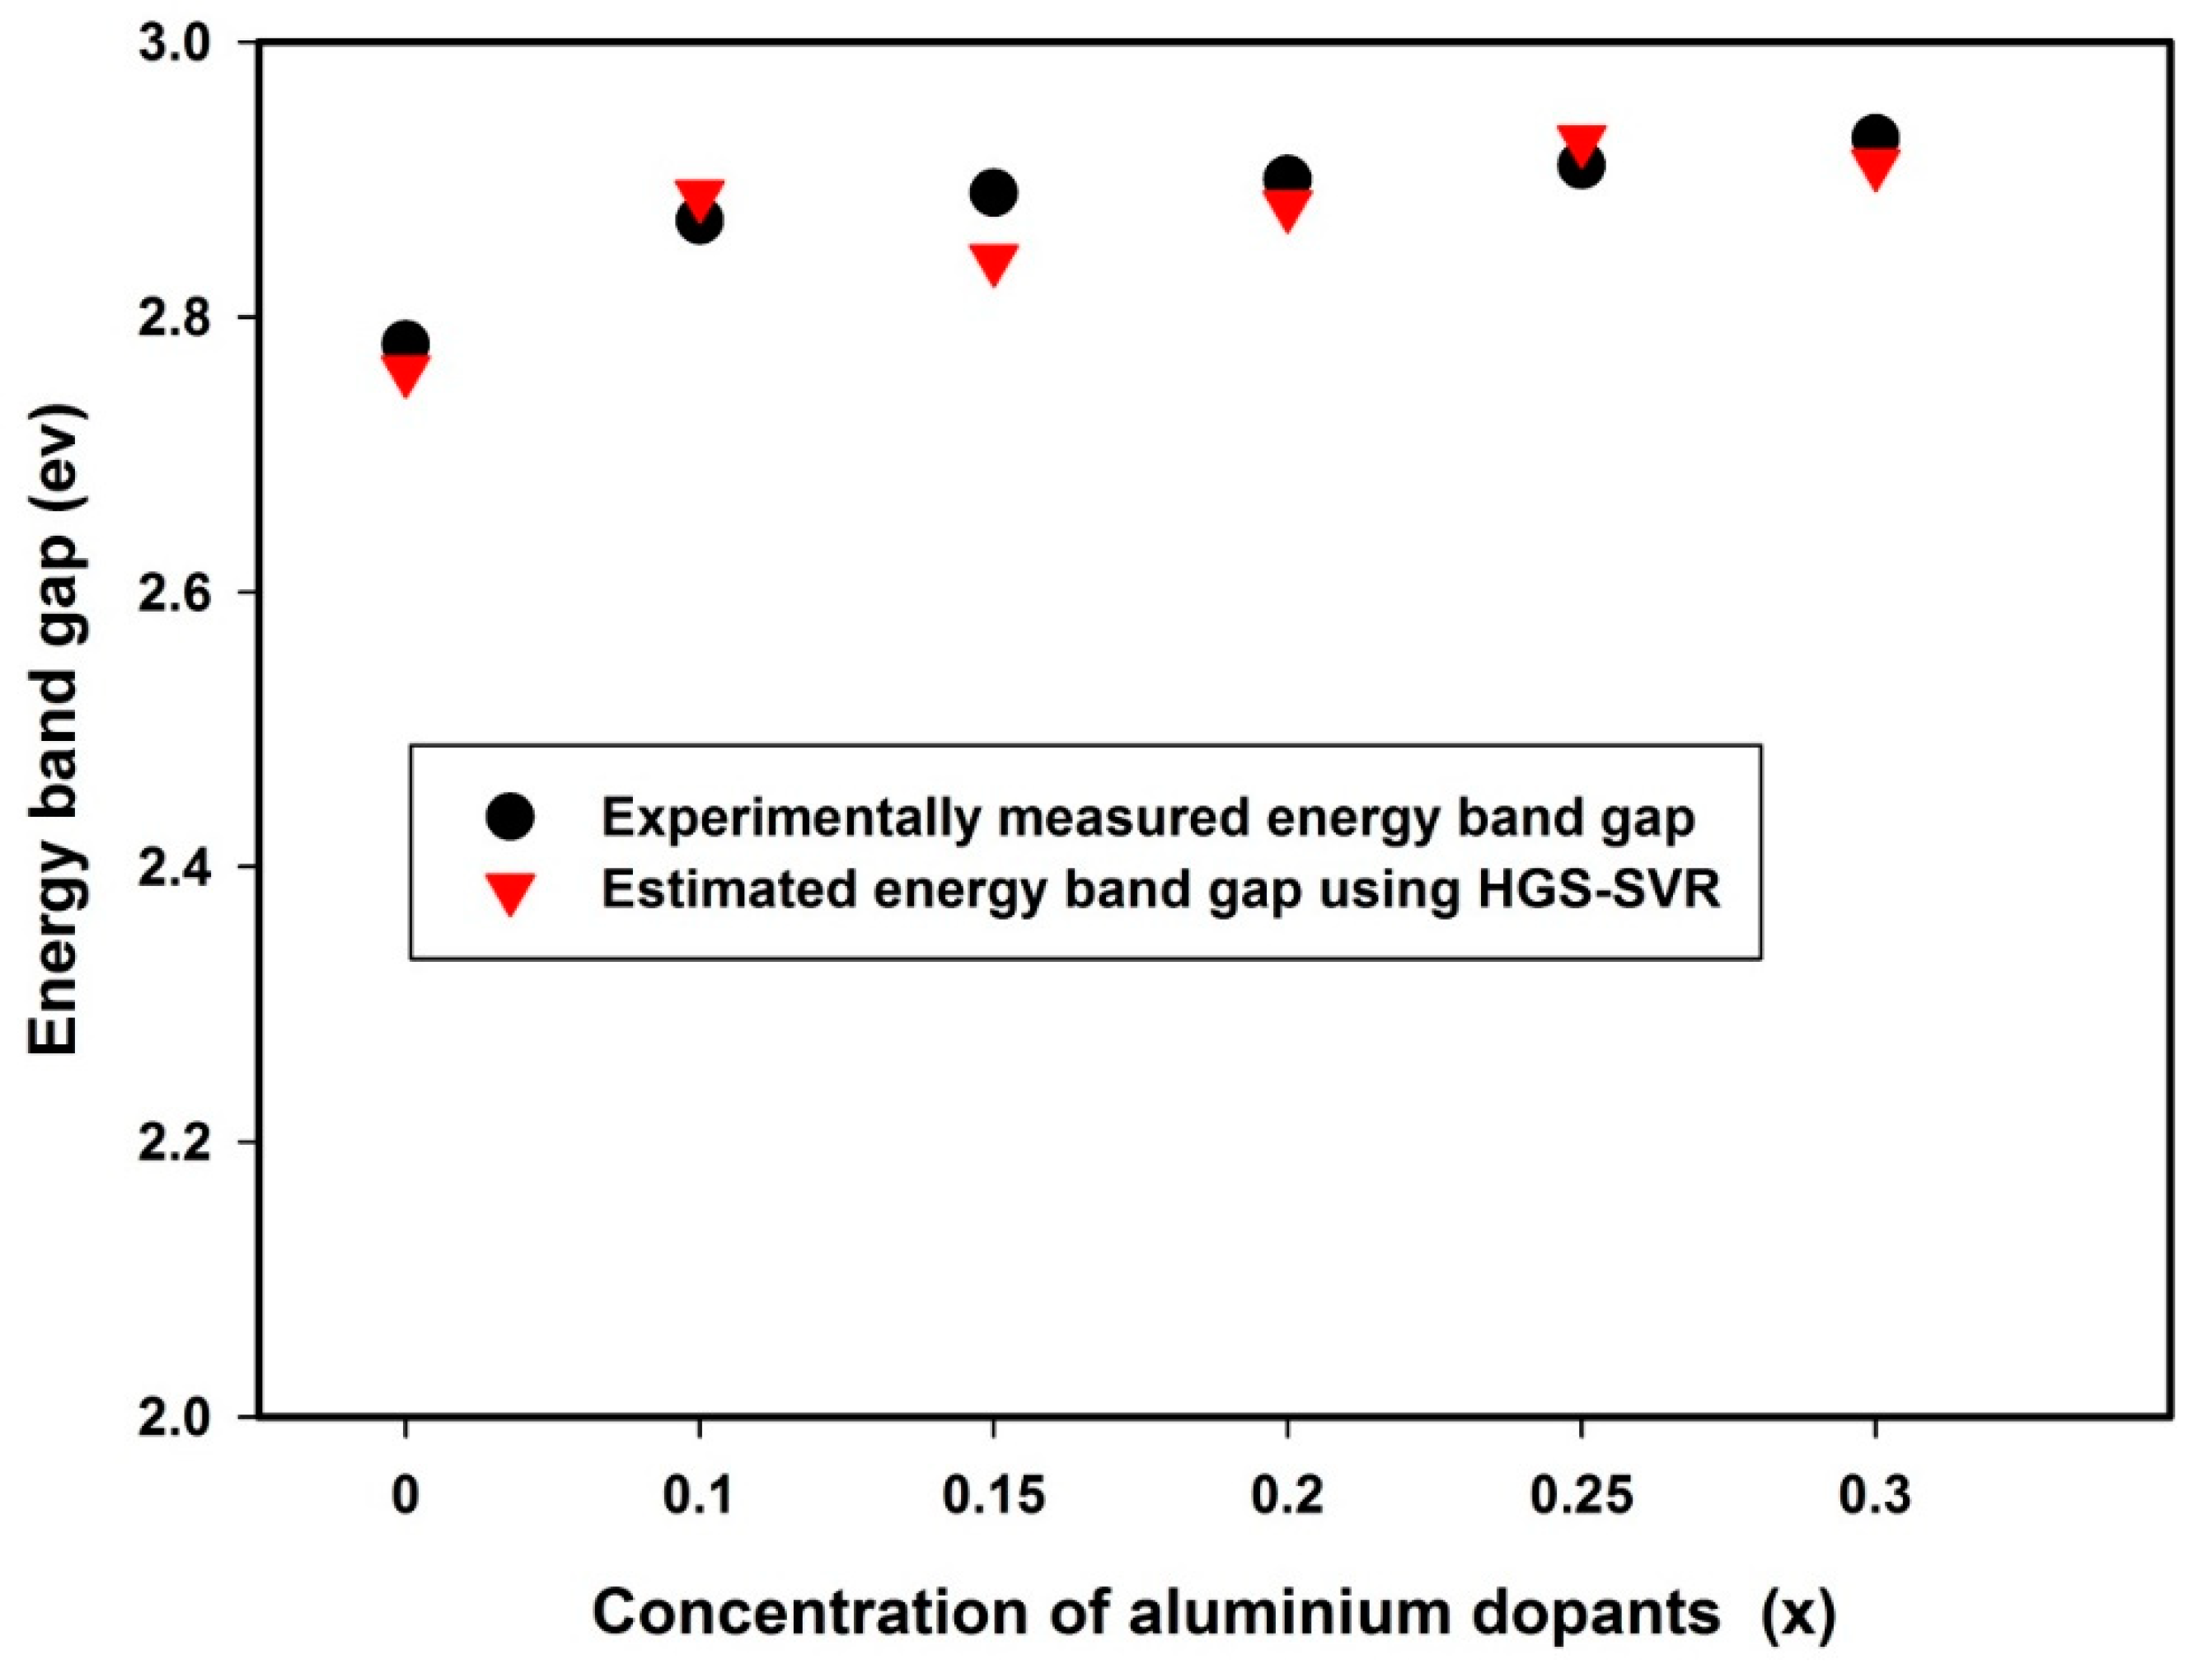
The effect of doping bismuth ferrite with aluminum of different concentrations is presented in Figure 6. The band gap energy of the compound increases with the concentration of the aluminum [33]. Since the substituted aluminum particles in the compound are characterized with a reduced ionic radius as compared with that of Fe and Bi, an increase in the energy band gap is expected. The developed model captures the results of the experimentally measured band gap, as presented in Figure 6. The influence of the dopants has been observed to translate to reduced crystal lattice parameters of the prepared samples [33].

4.4. The Effect of Lanthanum on Band Gap Energy of Bismuth Compound Using HGS-SVR

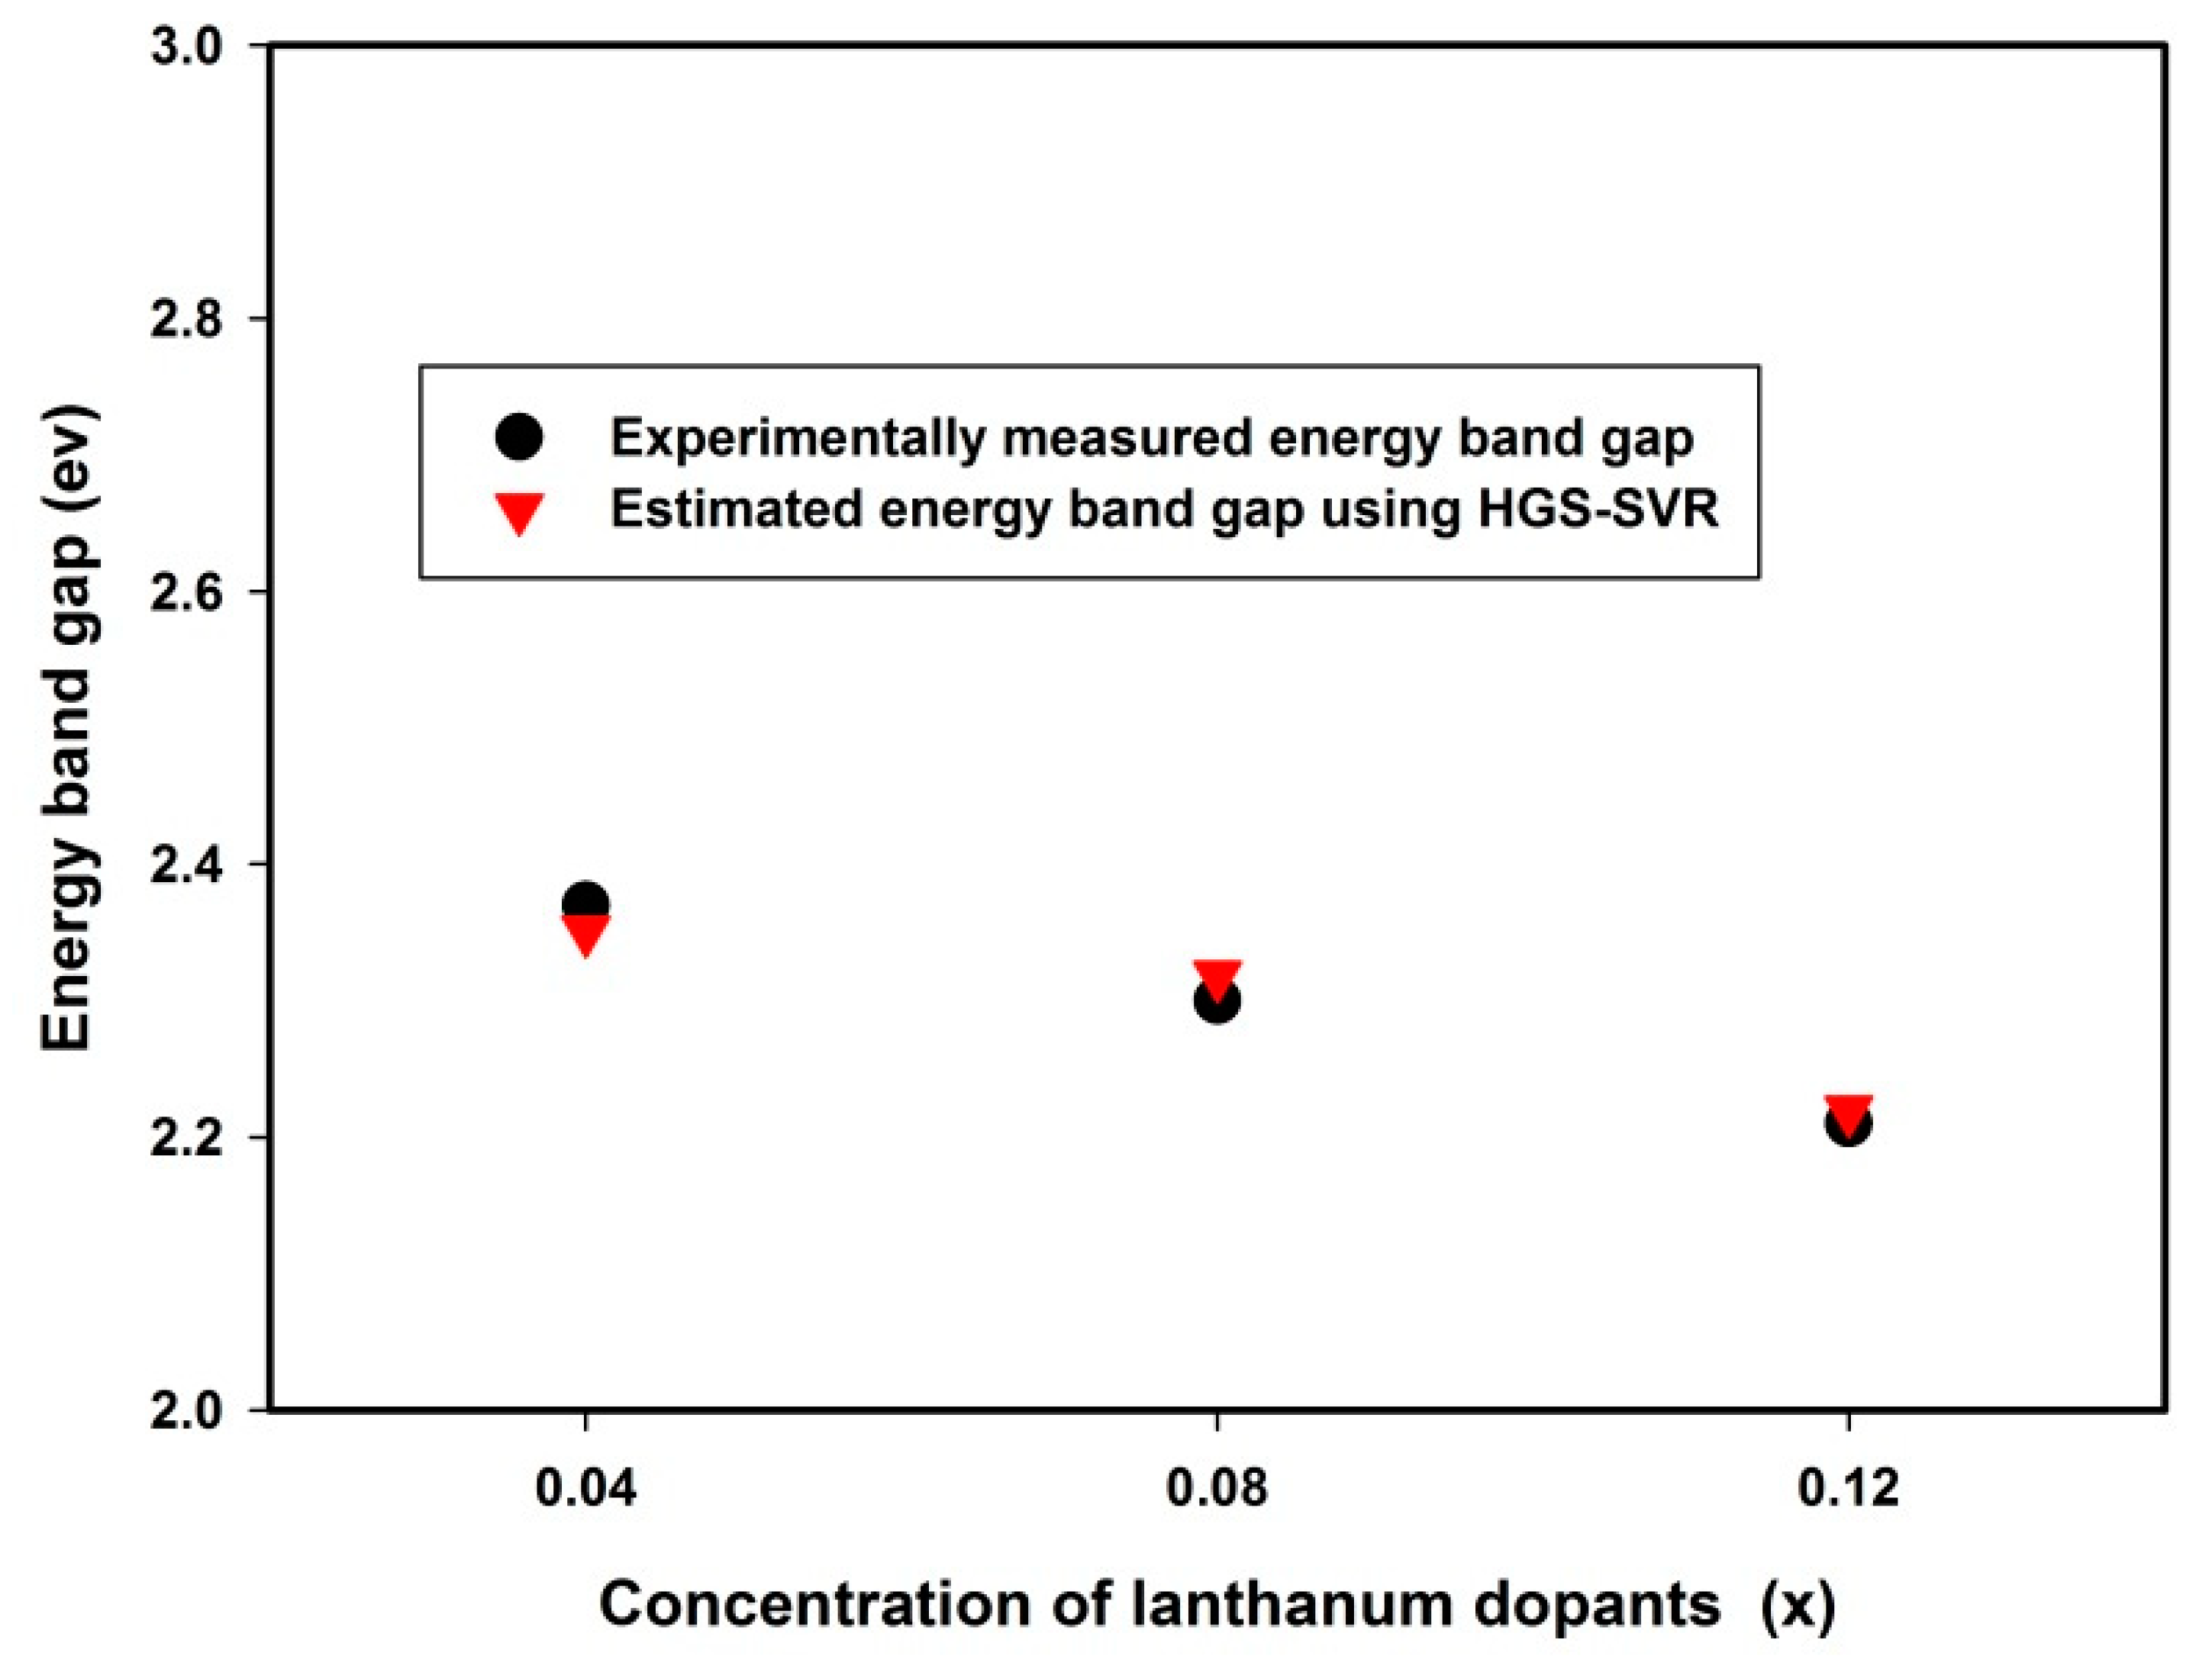
The significance of lanthanum doping on the band gap energy of bismuth ferrite is presented in Figure 7. The difference in ionic radii between the substituted rare earth lanthanum and the host bismuth ferrite leads to FeO6 octahedra modulation coupled with structural changes [39]. The predictions of the developed hybrid HGS-SVR model match the measured values excellently.

4.5. Impact of Yttrium Substitution on Energy Band Gap of Bismuth Ferrite Using the Developed Model

The influence of the incorporation of yttrium particles on the parent bismuth ferrite is depicted in Figure 8. The figure further presents a comparative study between the results of the developed hybrid HGS-SVR model and the experimentally measured values [38]. The results of the model show that an increase in the concentration of yttrium leads to reduction in the energy band gap which agree excellently well with the experimental values. The incorporation of yttrium dopants contracts the unit cell volume of the compound consequent upon contraction in lattice parameters along both axes [38]. The observed pattern is expected, since the ionic radius of Bi3+ ion is larger than that of Y3+ ion.

4.6. Significance of Samarium Dopants on the Energy Band Gap of Bismuth Ferrite

Figure 9 presents the obtained energy band gap when samarium particles are introduced into the parent bismuth ferrite compound. The figure also compares the experimental values with the predicted band gaps [35]. Samarium particle incorporation reduces the energy band gap of the host material as depicted in the figure. The tolerance factor that incorporates the ionic radii of the perovskite constituent surfers a reduction due to the difference in ionic radii of Sm3+ ions and Bi3+ions. Consequently, the Fe-O bond compresses and leads to lattice distortion in the crystal structure [35].

5. Conclusions

Modeling the band gap energy of bismuth ferrite doped with several classes of materials is presented. A support vector regression algorithm is hybridized with a gravitational search algorithm for hyper-parameter optimization using forty-three different samples of bismuth ferrite-doped compounds. The observed distortion in the lattice structure of bismuth ferrite, as detailed in the crystal lattice parameters, is the input feature to the developed hybrid HSG-SVR model. The effect of the initial number of objects exploring the Newtonian mechanics search space on the model convergence was investigated and presented. The testing phase of the developed model outperforms the training phase, as evaluated using three different parameters that measure model performance. The developed hybrid model further investigates the influence of aluminum dopants, lanthanum particles, yttrium dopants, and samarium particles on the energy band gap of the parent bismuth ferrite, while the results of the developed model agree excellently well with the measured values. The precision, accuracy, and robustness demonstrated by the developed model will definitely facilitate the quick determination of the energy band gap of doped bismuth ferrite through an elegant approach which is efficient and less costly.

Author Contributions

T.O.O. conceptualized and designed the experiment and drafted the manuscript; M.A.A.R. was involved in data collection, analysis, and the interpretation of results. All authors have read and agreed to the published version of the manuscript.

Funding

This research was funded by Universiti Putra Malaysia, grant number GP-IPM/2020/9694700 and The APC was funded by Universiti Putra Malaysia.

Institutional Review Board Statement

Not applicable.

Informed Consent Statement

Not applicable.

Data Availability Statement

The raw data required to reproduce these findings are available in the cited references in Section 3.1 of the manuscript.

Acknowledgments

This project is funded by Universiti Putra Malaysia GP-IPM Funding Scheme with reference number of GP-IPM/2020/9694700.

Conflicts of Interest

Authors declare no Competing Financial or Non-Financial Interests.

References

  1. Irfan, S.; Zhuanghao, Z.; Li, F.; Chen, Y.-X.; Liang, G.-X.; Luo, J.-T.; Ping, F. Critical review: Bismuth ferrite as an emerging visible light active nanostructured photocatalyst. J. Mater. Res. Technol. 2019, 8, 6375–6389. [Google Scholar] [CrossRef]
  2. Yao, L.; Wu, X.; Yang, S.; Zhang, Y. Structural and optical properties of Ca doped BiFeO3 thin films prepared by a sol-gel method. Ceram. Int. 2017, 43, S470–S473. [Google Scholar] [CrossRef]
  3. Haruna, A.; Abdulkadir, I.; Idris, S.O. Heliyon Photocatalytic activity and doping effects of BiFeO3 nanoparticles in model organic dyes. Heliyon 2020, 6, e03237. [Google Scholar] [CrossRef] [PubMed] [Green Version]
  4. Castelli, E.; Olsen, T. Towards photoferroic materials by design: Recent progress and perspectives towards photoferroic materials by design: Recent progress and perspectives. J. Phys. Energy 2020. [Google Scholar] [CrossRef]
  5. Peng, L.; Deng, H.; Tian, J.; Ren, Q.; Peng, C.; Huang, Z. Influence of Co doping on structural, optical and magnetic properties of BiFeO3 films deposited on quartz substrates by sol—Gel method. Appl. Surf. Sci. 2013, 268, 146–150. [Google Scholar] [CrossRef]
  6. Owolabi, T.O. Development of a particle swarm optimization based support vector regression model for titanium dioxide band gap characterization. J. Semicond. 2019, 40. [Google Scholar] [CrossRef]
  7. Ahmad, S.; Hamad, T.; Sultan, G.; Murtaza, N.U.; Amin, M.W. Effect of Sr 2 + doping on the structural, electrical and optical properties of BiFeO3. Chin. J. Phys. 2018, 56, 2371–2380. [Google Scholar] [CrossRef]
  8. Puhan, B.; Bhushan, S.; Satpathy, S.; Meena, S.; Nayak, A.K.; Rout, D. Applied surface science facile single phase synthesis of Sr, Co co-doped BiFeO3 nanoparticles for boosting photocatalytic and magnetic properties. Appl. Surf. Sci. 2019, 493, 593–604. [Google Scholar] [CrossRef]
  9. Vishwakarma, K.; Tripathi, P.; Srivastava, A. Science direct band gap engineering of Gd and Co doped BiFeO3 and their application in hydrogen production through photoelectrochemical route. Int. J. Hydrog. Energy 2017, 42, 22677–22686. [Google Scholar] [CrossRef]
  10. Satar, N.S.A.; Adnan, R.; Lee, H.L.; Hall, S.R.; Kobayashi, T.; Kassim, M.H.M.; Kaus, N.H.M. Facile green synthesis of ytrium-doped BiFeO3 with highly e ffi cient photocatalytic degradation towards methylene blue. Ceram. Int. 2019, 45, 15964–15973. [Google Scholar] [CrossRef]
  11. Maleki, H. Characterization and photocatalytic activity of Y-doped BiFeO3 ceramics prepared by solid-state reaction method. Adv. Powder Technol. 2019, 30, 2832–2840. [Google Scholar] [CrossRef]
  12. Sinha, K.; Bhushan, B.; Gupta, N.; Sen, S.; Prajapat, C.L.; Nuwad, J. Effect of cobalt-doping on dielectric, magnetic and optical properties of BiFeO3 nanocrystals synthesized by sol—Gel technique. Solid State Sci. 2020, 102, 106168. [Google Scholar] [CrossRef]
  13. Wang, T.; Xu, T.; Gao, S.; Song, S. Effect of Nd and Nb co-doping on the structural, magnetic and optical properties of multiferroic BiFeO3 nanoparticles prepared by sol-gel method. Ceram. Int. 2017, 43, 4489–4495. [Google Scholar] [CrossRef]
  14. Shamsah, S.M.I.; Owolabi, T.O. Newtonian mechanics based hybrid machine learning method of characterizing energy band gap of doped zno semiconductor. Chin. J. Phys. 2020, 68, 493–506. [Google Scholar] [CrossRef]
  15. Owolabi, T.O.; Akande, K.O.; Olatunji, S.O. Application of computational intelligence technique for estimating superconducting transition temperature of YBCO superconductors. Appl. Soft Comput. J. 2016, 43, 143–149. [Google Scholar] [CrossRef]
  16. Owolabi, T.O. Modeling the magnetocaloric effect of manganite using hybrid genetic and support vector regression algorithms. Phys. Lett. A 2019, 383, 1782–1790. [Google Scholar] [CrossRef]
  17. Owolabi, T.O. Extreme learning machine and swarm- based support vector regression methods for predicting crystal lattice parameters of pseudo-cubic/cubic perovskites Extreme learning machine and swarm-based support vector regression methods for predicting crystal lat. J. Appl. Phys. 2020, 245107. [Google Scholar] [CrossRef]
  18. Owolabi, T.O.; Gondal, M.A. Quantitative analysis of LIBS spectra using hybrid chemometric models through fusion of extreme learning machines and support vector regression. J. Intell. Fuzzy Syst. 2018, 35, 6277–6286. [Google Scholar] [CrossRef]
  19. Owolabi, T.O.; Gondal, M.A. Development of hybrid extreme learning machine based chemo-metrics for precise quantitative analysis of LIBS spectra using internal reference pre-processing method. Anal. Chim. Acta 2018, 1030, 33–41. [Google Scholar] [CrossRef] [PubMed]
  20. Cisewski, J.; Snyder, E.; Hannig, J.; Oudejans, L. Support vector machine classification of suspect powders using laser-induced breakdown spectroscopy (LIBS) spectral data. J. Chemom. 2012, 26, 143–149. [Google Scholar] [CrossRef]
  21. Owolabi, T.O.; Akande, K.O.; Olatunji, S.O. Development and validation of surface energies estimator (SEE) using computational intelligence technique. Comput. Mater. Sci. 2015, 101, 143–151. [Google Scholar] [CrossRef]
  22. Owolabi, T.O.; Akande, K.O.; Olatunji, S.O. Estimation of average surface energies of transition metal nitrides using computational intelligence technique. Soft Comput. 2017, 21, 6175–6182. [Google Scholar] [CrossRef]
  23. Owolabi, T.; Faiz, M.; Olatunji, S.O.; Popoola, I.K. Computational intelligence method of determining the energy band gap of doped ZnO semiconductor. Mater. Des. 2016, 101, 277–284. [Google Scholar] [CrossRef]
  24. Rashedi, E.; Nezamabadi-pour, H.; Saryazdi, S. GSA: A Gravitational Search Algorithm. Inf. Sci. 2009, 179, 2232–2248. [Google Scholar] [CrossRef]
  25. Basak, D.; Pal, S.; Patranabis, D.C. Support vector regression. Neural. Inf. Process. Lett. Rev. 2007, 11, 67–80. [Google Scholar]
  26. Vapnik, V. The Nature of Statistical Learning Theory; Springer: New York, NY, USA, 1995. [Google Scholar]
  27. Adewumi, A.; Owolabi, T.O.; Alade, I.O.; Olatunji, S.O. Estimation of physical, mechanical and hydrological properties of permeable concrete using computational intelligence approach. Appl. Soft Comput. J. 2016, 42, 342–350. [Google Scholar] [CrossRef]
  28. Oyehan, T.A.; Alade, I.O.; Bagudu, A.; Sulaiman, K.O.; Olatunji, S.O.; Saleh, T.A. Predicting of the refractive index of haemoglobin using the Hybrid GA-SVR approach. Comput. Biol. Med. 2018, 98, 85–92. [Google Scholar] [CrossRef]
  29. Ghorbani, M.; Zargar, G.; Jazayeri-Rad, H. Prediction of asphaltene precipitation using support vector regression tuned with genetic algorithms. Petroleum 2016, 2, 301–306. [Google Scholar] [CrossRef] [Green Version]
  30. Wu, J.; Wang, Y. A working likelihood approach to support vector regression with a data-driven insensitivity parameter. arXiv 2020, arXiv:2003.03893. [Google Scholar]
  31. Awad, M.; Khanna, R. Efficient Learning Machines: Theories, Concepts, and Applications for Engineers and System Designers, 1st ed.; Springer Nature Switzerland: Cham, Switzerland, 2015. [Google Scholar]
  32. Puhan, A.; Bhushan, B.; Kumar, V.; Panda, H.S.; Priyam, A.; Das, D.; Rout, D. Materials Science & Engineering B Tailoring the structural, optical and magnetic properties of BiFeO3 multiferroic nanoparticles by Ba, Cr co-doping. Mater. Sci. Eng. B 2019, 241, 48–54. [Google Scholar]
  33. Azam, A.; Jawad, A.; Ahmed, S.; Chaman, M.; Naqvi, A.H. Structural, optical and transport properties of Al 3 + doped BiFeO3 nanopowder synthesized by solution combustion method. J. Alloys Compd. 2011, 509, 2909–2913. [Google Scholar] [CrossRef]
  34. Singh, V.; Sharma, S.; Kumar, M.; Kotnala, R.K.; Dwivedi, R.K. Journal of magnetism and magnetic materials structural transition, magnetic and optical properties of Pr and Ti co-doped BiFeO3 ceramics. J. Magn. Magn. Mater. 2014, 349, 264–267. [Google Scholar] [CrossRef]
  35. Hu, Z.; Chen, D.; Wang, S.; Zhang, N.; Qin, L.; Huang, Y. Facile synthesis of Sm-doped BiFeO3 nanoparticles for enhanced visible light photocatalytic performance. Mater. Sci. Eng. B 2017, 220, 1–12. [Google Scholar] [CrossRef]
  36. Thang, D.V.; Do Chung, P.; Hung, N.M.; Van Quang, N.; Van Minh, N. Enhancement of ferroelectric and ferromagnetic properties of Gadolinium. Ceram. Int. 2020, 46, 17423–17429. [Google Scholar]
  37. Wang, F.L.; Jain, A.; Li, Y.; Wang, N.; Lu, Y.L.; Zhu, L.; Wang, Y.G.; Chen, F.G. Enhanced magnetic, ferroelectric, and photocatalytic properties of (1-x). Ceram. Int. 2020, 46, 16416–16421. [Google Scholar] [CrossRef]
  38. Fki, H.; Koubaa, M.; Sicard, L.; Cheikhrouhou-koubaa, W.; Cheikhrouhou, A. Influence of Y doping on structural, vibrational, optical and magnetic properties of BiFeO3 ceramics prepared by mechanical activation. Ceram. Int. 2017, 43, 4139–4150. [Google Scholar] [CrossRef]
  39. Kumar, P.; Chand, P.; Singh, V. La 3 + substituted BiFeO3 -a proficient nanoferrite photo-catalyst under the application of visible light. Chem. Phys. Lett. 2020, 754, 137715. [Google Scholar] [CrossRef]
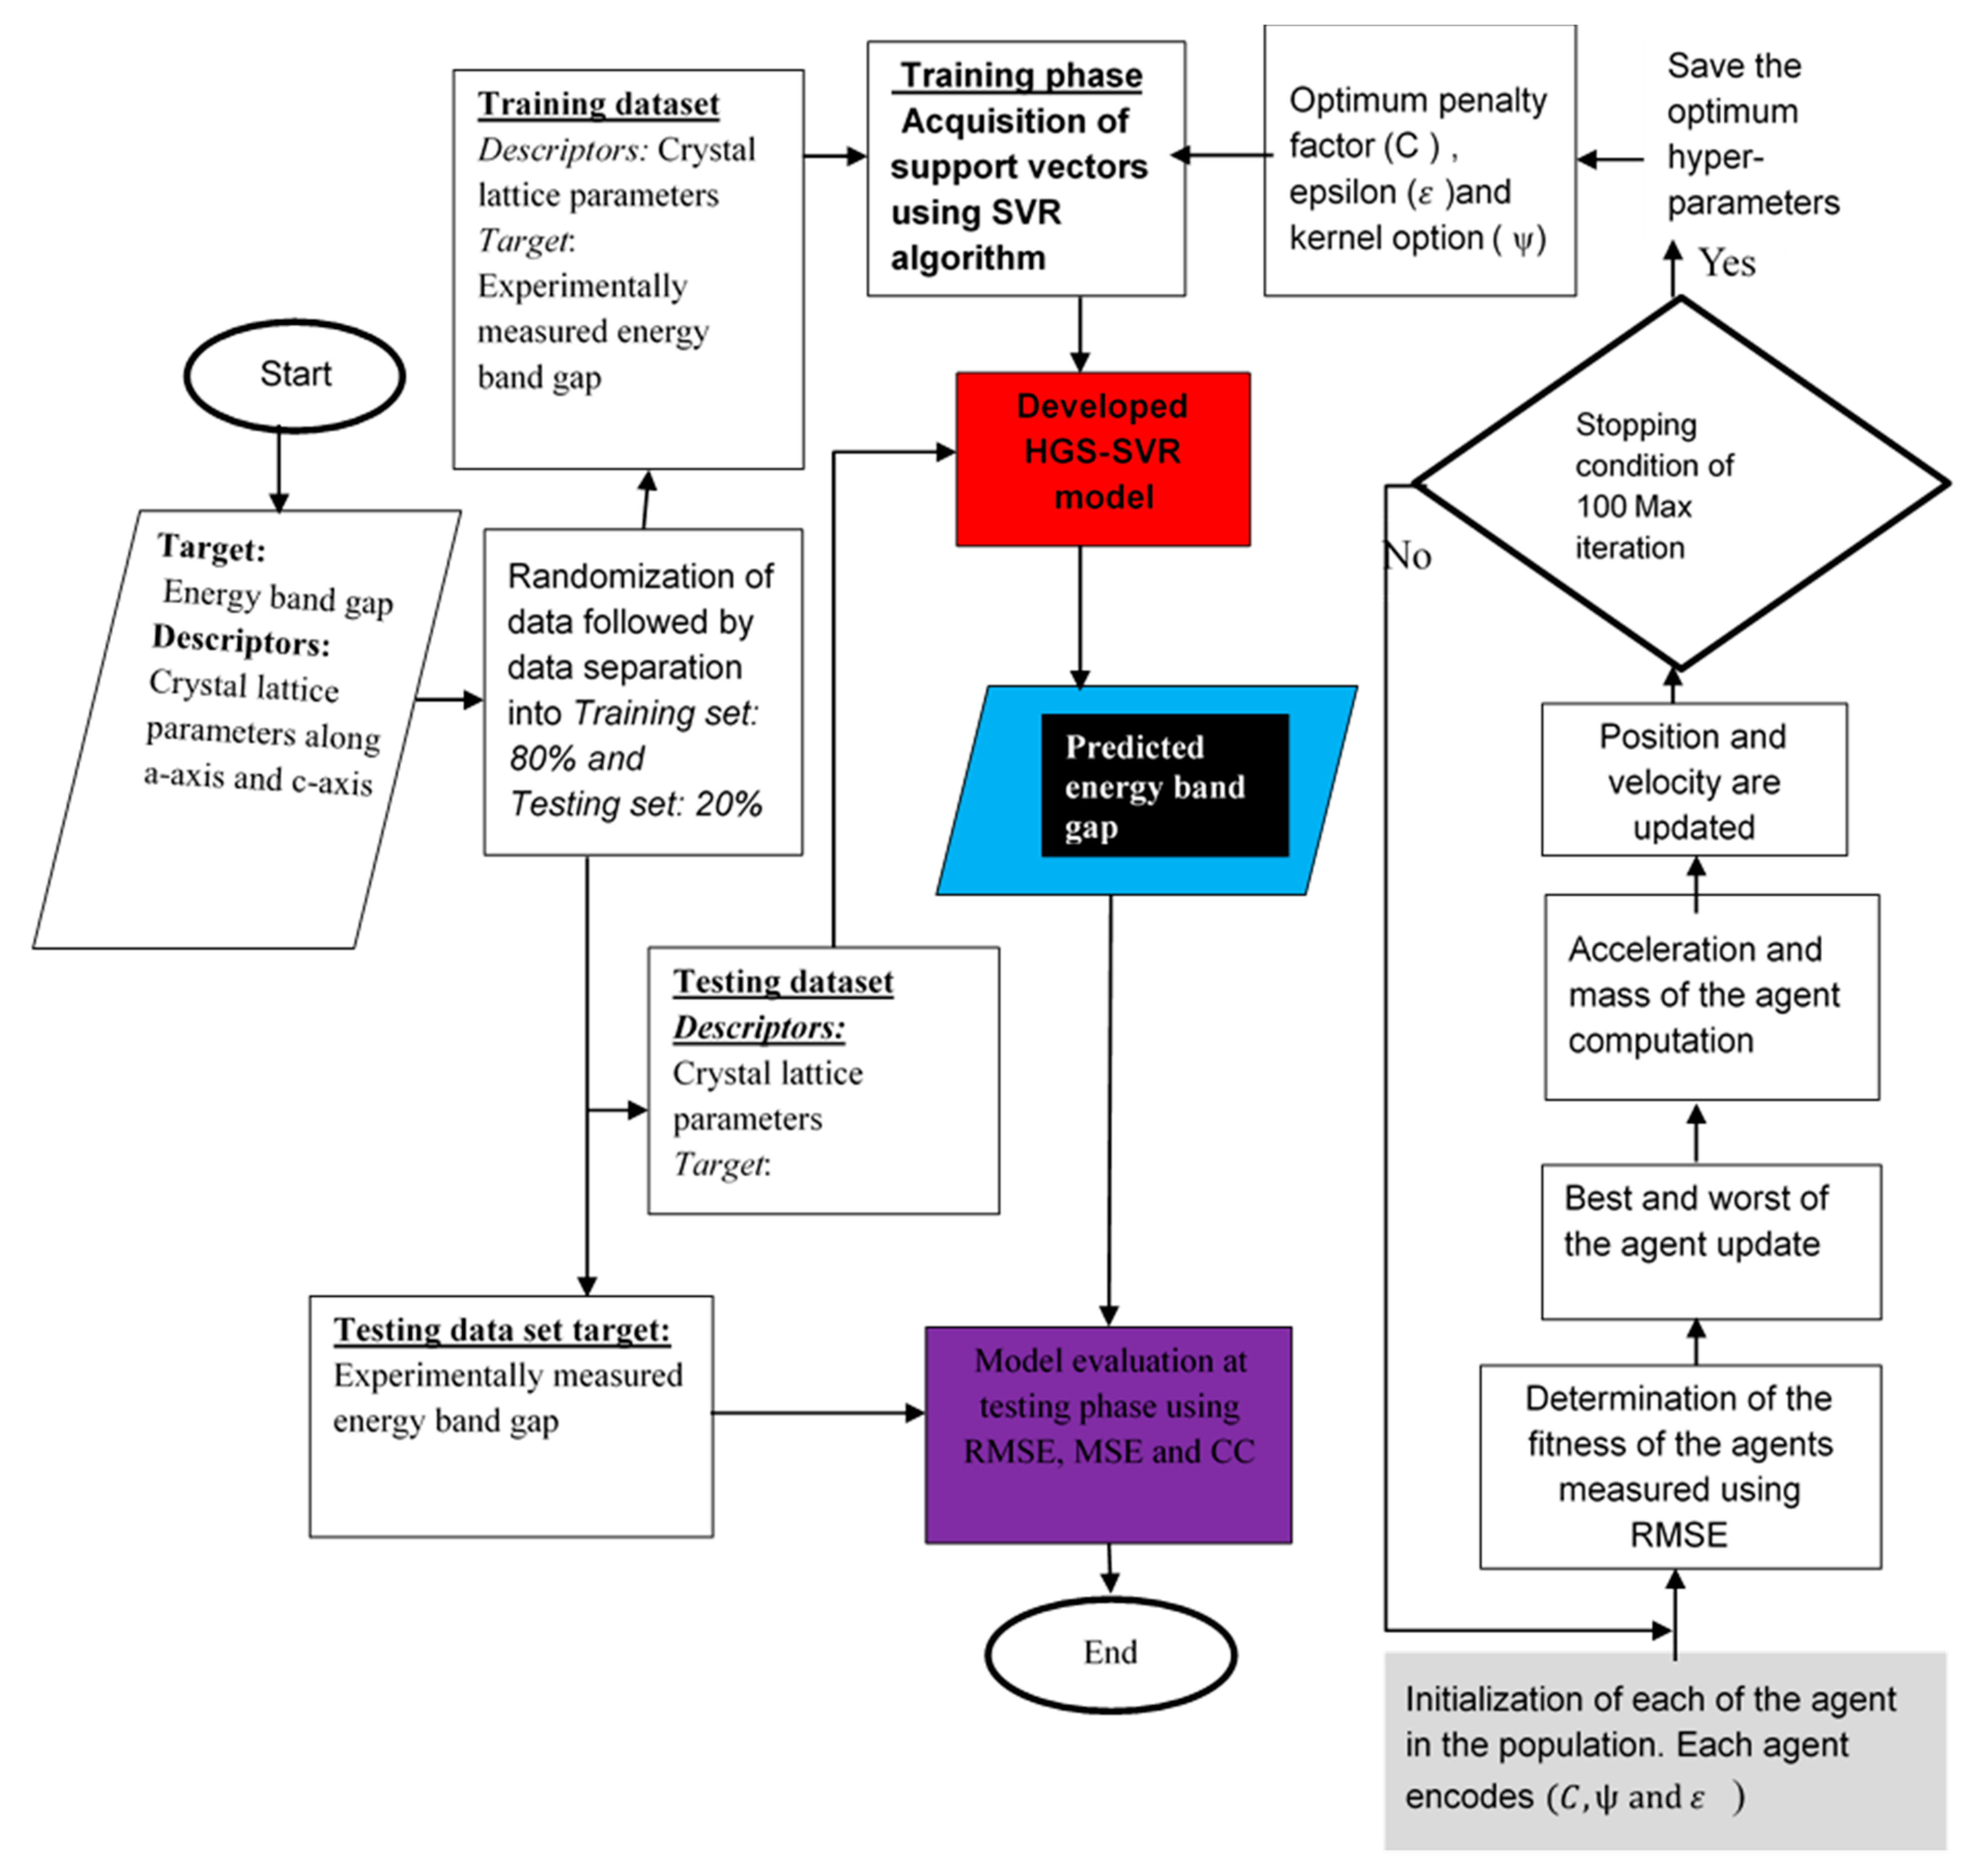
Figure 1. Computational flow chat describing the developed HGS-SVR model.
Crystals 11 00246 g001
Figure 2. Dependence of the developed model on GSA parameters. (a) Convergence3 of the developed model for ten number of initial population, (b) Convergence of the developed model of twenty number of initial population, (c) Dependence of the initial gravitational constant on the convergence of the developed model, (d) Dependence of parameter alpha on the convergence of the developed model.
Crystals 11 00246 g002aCrystals 11 00246 g002b
Figure 3. Model convergence as a function of the initial population number.
Crystals 11 00246 g003
Figure 4. Coefficient of correlation at each of the model developmental phases.
Crystals 11 00246 g004
Figure 5. Root mean square error comparison for the training and testing datasets.
Crystals 11 00246 g005
Figure 6. Effect of aluminum doping on the energy band gap of Bi1−XAl2XFe1−XO3.
Crystals 11 00246 g006
Figure 7. Significance of lanthanum doping on the energy band gap of Bi1−xLaxFeO3.
Crystals 11 00246 g007
Figure 8. Effect of yttrium doping on the energy band gap of Bi1−xYx FeO3.
Crystals 11 00246 g008
Figure 9. Influence of samarium on the band gap of Bi1−xSmxFeO3.
Crystals 11 00246 g009
Table 1. Analysis of the employed dataset.
Statistical Parametersa (Ǻ)c (Ǻ)Energy Band Gap (ev)
Mean5.576613.81472.2053
Standard deviation0.02990.11190.3659
Correlation coefficient−0.60330.0926
Maximum5.643013.91782.9300
Minimum5.502013.34081.6100
Table 2. Hyper-parameters and their corresponding best values for the HGS-SVR model.
Model Hyper-ParameterOptimized Value
Kernel mapping functionGaussian
Initial number of agents10
Penalty factor (C)307.3545
Gaussian kernel option0.0299
Epsilon0.0186
Hyper-parameter lambdaE-7
Initial value gravitational constant ( G 0 )100
Parameter alpha (α)20
Table 3. Performance measuring parameters during the model development.
DatasetCCRMSE (ev)MSE (ev)
Training phase0.9170.14370.02065
Testing phase0.98060.09580.009178
Table 4. Evaluation of the generalization and predictive capacity of the model for different number of runs.
Number of RunCC-TrainingCC-TestingRMSE-TrainingRMSE-Testing
10.91700.98060.14370.0958
20.91390.9650.14950.1073
30.90220.97470.14720.0853
40.90260.98150.14460.1405
50.90980.95250.1410.1440
60.90360.96980.14040.1155
Mean0.90810.97070.14440.1147
Standard deviation0.00630.01090.00350.0237
Publisher’s Note: MDPI stays neutral with regard to jurisdictional claims in published maps and institutional affiliations.