Article

Effect of Bi Content on the Microstructure and Mechanical Performance of Sn-1Ag-0.5Cu Solder Alloy

by
Heba Y. Zahran
1,2,
Ashraf S. Mahmoud
2 and
Alaa F. Abd El-Rehim
1,2,*
1
Physics Department, Faculty of Science, King Khalid University, P.O. Box 9004, Abha 61413, Saudi Arabia
2
Physics Department, Faculty of Education, Ain Shams University, P.O. Box 5101, Heliopolis, Roxy, Cairo 11771, Egypt
*
Author to whom correspondence should be addressed.
Crystals 2021, 11(3), 314; https://doi.org/10.3390/cryst11030314
Submission received: 28 February 2021 / Revised: 17 March 2021 / Accepted: 18 March 2021 / Published: 22 March 2021
(This article belongs to the Special Issue New Trends in Crystals at Saudi Arabia)

Abstract

:
The purpose of this work is to explore the impact of 0.5, 1.5, 2.5 and 3.5 wt.% Bi additions on the microstructure and mechanical performance of Sn-1Ag-0.5Cu solder alloy. Scanning electron microscope (SEM) and X-ray diffraction (XRD) were utilized to examine the microstructure of the present solders. Creep measurements have been used for the preliminary assessment of mechanical properties. The steady-state creep rate, έst, diminished as the Bi’s concentration increased and reached 2.5 wt.%, with this trend altering above this point. Furthermore, increasing the aging or testing temperature caused the έst values to increment for all the investigated solders. έst variations with different Bi content and aging temperature were observed by examining the Sn-Ag-Cu solders’ structural evolutions. The mean value of the activation energy of all investigated solder alloys was found to be ∼52 kJ/mol. This value is appropriate to that quoted for the dislocation climb through the core diffusion as the dominant operating mechanism. The XRD findings supported the microstructure and lattice parameters variations with both aging temperatures and bismuth concentrations.

1. Introduction

Owing to environmental issues about Pb toxicity, considerable endeavors have been done to get Pb-free solders that have a low melting temperature, low cost, good wettability, and desirable mechanical characteristics [1,2,3]. Among the various Pb-free solders available, Sn-Ag-Cu (SAC) solders have been recognized as the most attractive replacement of Pb-containing solders due to their modest melting point, excellent wetting ability, and remarkable mechanical features [4,5,6]. However, several obstacles are attributed to the SAC solders with a high Ag-content, such as the large brittle Ag3Sn development as an intermetallic compound (IMC) that degrades the mechanical properties of the solder joints [7,8]. Diminishing the silver addition can enhance the mechanical characteristics of the SAC solder joints [9,10]. However, the SAC solders with low Ag-content reveal a high melting point, worse mechanical properties, and poor wettability as compared with widely used Sn-(3.0–3.9)Ag-(0.5–0.7) Cu solders [11]. The low Ag-content SAC solders’ performance can be developed by adding second reinforcing alloying elements such as Fe, Mn, Ti, Ni, Bi, Zn, and Al [12,13]. Alloying additions of metallic elements could refine the microstructure and limit the formation brittle Ag3Sn (IMCs) [14,15,16].
Several research papers have documented the impact of minor addition of metallic elements on SAC soldiers’ microstructure and mechanical characteristics. Zhao et al. [17] investigated the impact of 1 and 3 wt.% Bi addition on Sn-3Ag-0.5Cu (SAC305) solders’ microstructures and mechanical properties. They explored that the Bi addition increased the tensile strength but decreased the elongation of SAC305 solders. Chuang et al. [18] deduced that titanium addition into SAC305 solder refined the microstructure of eutectic areas (β-Sn + Ag3Sn). As titanium percent exceeds 1.0 wt.%, a small amount of coarse Ti2Sn3 IMC exists, and the elongation decreases. A notable contribution was made by Mahdavifard et al. [19], who studied the effect of Fe and Bi on the microstructure and mechanical characteristics of Sn-1Ag-0.5Cu solder. Bi addition to SAC105-Fe solder increased the interdendritic regions of β-Sn. Also, it decreased the Ag3Sn and Cu6Sn5 IMCs, which enhanced the yield strength and ultimate tensile strength but decreased the total elongation. It was concluded by Cheng et al. [20] that minor Ni addition to SAC105/Cu increased Cu6Sn5 layer growth, but the Cu3Sn growth was obstructed through the subsequent aging of the solid-state. Zn’s impact was examined by Song et al. [21] on microstructure evolutions and tensile properties of SAC105 solder. They reported the enhancement of tensile properties and the reduction of the total elongation. Kanlayasiri et al. [22] investigated the influence of indium addition on the tensile strength of SAC105 solder. The addition of 3.0 wt.% In increased the tensile strength of SAC105 solder by around 79%.
The microstructure and mechanical response of solder joints change as they age isothermally. The creep behavior degrades drastically when solder joints are exposed to aging over time. Such variations in the creep behavior are attributed to the microstructure evolution that develops during aging. Although there have been some creep reports on the low Ag-content SAC105 solders in previous studies, the impact of heat treatment and Bi addition on the microstructure and creep behavior of low Ag-content SAC105 solders were quite limited. The insufficiency of the investigation into this topic inspired the present study.

2. Materials and Methods

In this study, low Ag-content SAC105–xBi (x = 0.0, 0.5, 1.5, 2.5, and 3.5 wt.%) solders were successfully obtained by permanent mold casting. Pure metals (99.99%) of Sn, Ag, Cu, and Bi were brought to produce the alloys under investigation. Melting was conducted in alumina crucibles at 623 K for 120 min in an electric resistance furnace under a protective argon atmosphere. The molten alloys were poured into mild steel molds of dimensions 150 mm × 10 mm × 10 mm in the air at room temperature (298 K). The five solder alloys’ chemical compositions were verified utilizing inductively coupled plasma atomic emission spectroscopy (ICP-AES) (Table 1).
The as-cast ingots were swaged and cold drawn into (i) sheets of 0.6 mm in thickness (by rolling) for microstructure investigations and (ii) wires of 0.8 mm gauge diameter and 50 mm gauge length for tensile creep measurements. For 120 min at 453 K, the samples were solution heat-treated for homogenization and quenched into iced water (273 K). They were immediately aged at various temperatures (Ta = 353, 373, 393, and 413 K) for 120 min, followed by water quenching at 273 K.
The tensile creep tests were carried out using an Instron 3360 Universal Testing Machine (Model:GT-K01, Quanzhou, China) at various testing temperatures ranging from 318 to 348 K under a certainly applied load corresponding to a stress of 19.5 MPa. The details of the tensile testing machine used in the current work are described elsewhere [23]. The precision of the temperature measurements is within the range of ±1 K.
To study SAC105–xBi samples’ microstructure, they were ground and polished according to ordinary steps for solder alloys [24]. Before the microstructure examination, a solution comprising 10 mL nitric acid, 10 mL acetic acid, and 80 mL glycerol was employed to etch the samples for about 90 s. The microstructural features of the phases present in the samples were examined by a scanning electron microscope-SEM (JEOL JSM-6360LV-Akishima, Tokyo, Japan) equipped with energy dispersive spectroscopy (EDS) (Oxfordins Inca-200, Oxford Instruments, Abingdon, UK) operating at 20 kV. Furthermore, X-ray diffraction (XRD) measurements were carried out at room temperature using a Shimadzu D6000 X-ray diffractometer (Shimadzu Corporation, Tokyo, Japan) with Ni-filtered CuKα radiation (λ = 1.5406 Å) worked at 30 kV and 40 mA. The XRD spectra were collected in the 20–80° 2θ range at a scan rate of 2° min−1 and a step size of 0.02°.

3. Results and Discussion

Creep is typically associated with time-dependent plastic deformation of materials at an elevated temperature under constant uniaxial stress [25]. Most metals and alloys display normal creep curves at temperatures above about 0.5 Tm, where Tm is the absolute melting point [26]. Typical creep curves include three parts that appear after the initial instantaneous strain (εo) upon loading. The creep rate decreases rapidly in the first stage of creep, known as primary creep. The creep rate is approximately constant in the second stage of creep, referred to as steady-state or secondary creep. Once the creep rate has accelerated to the fracture point, it becomes a tertiary creep [27].
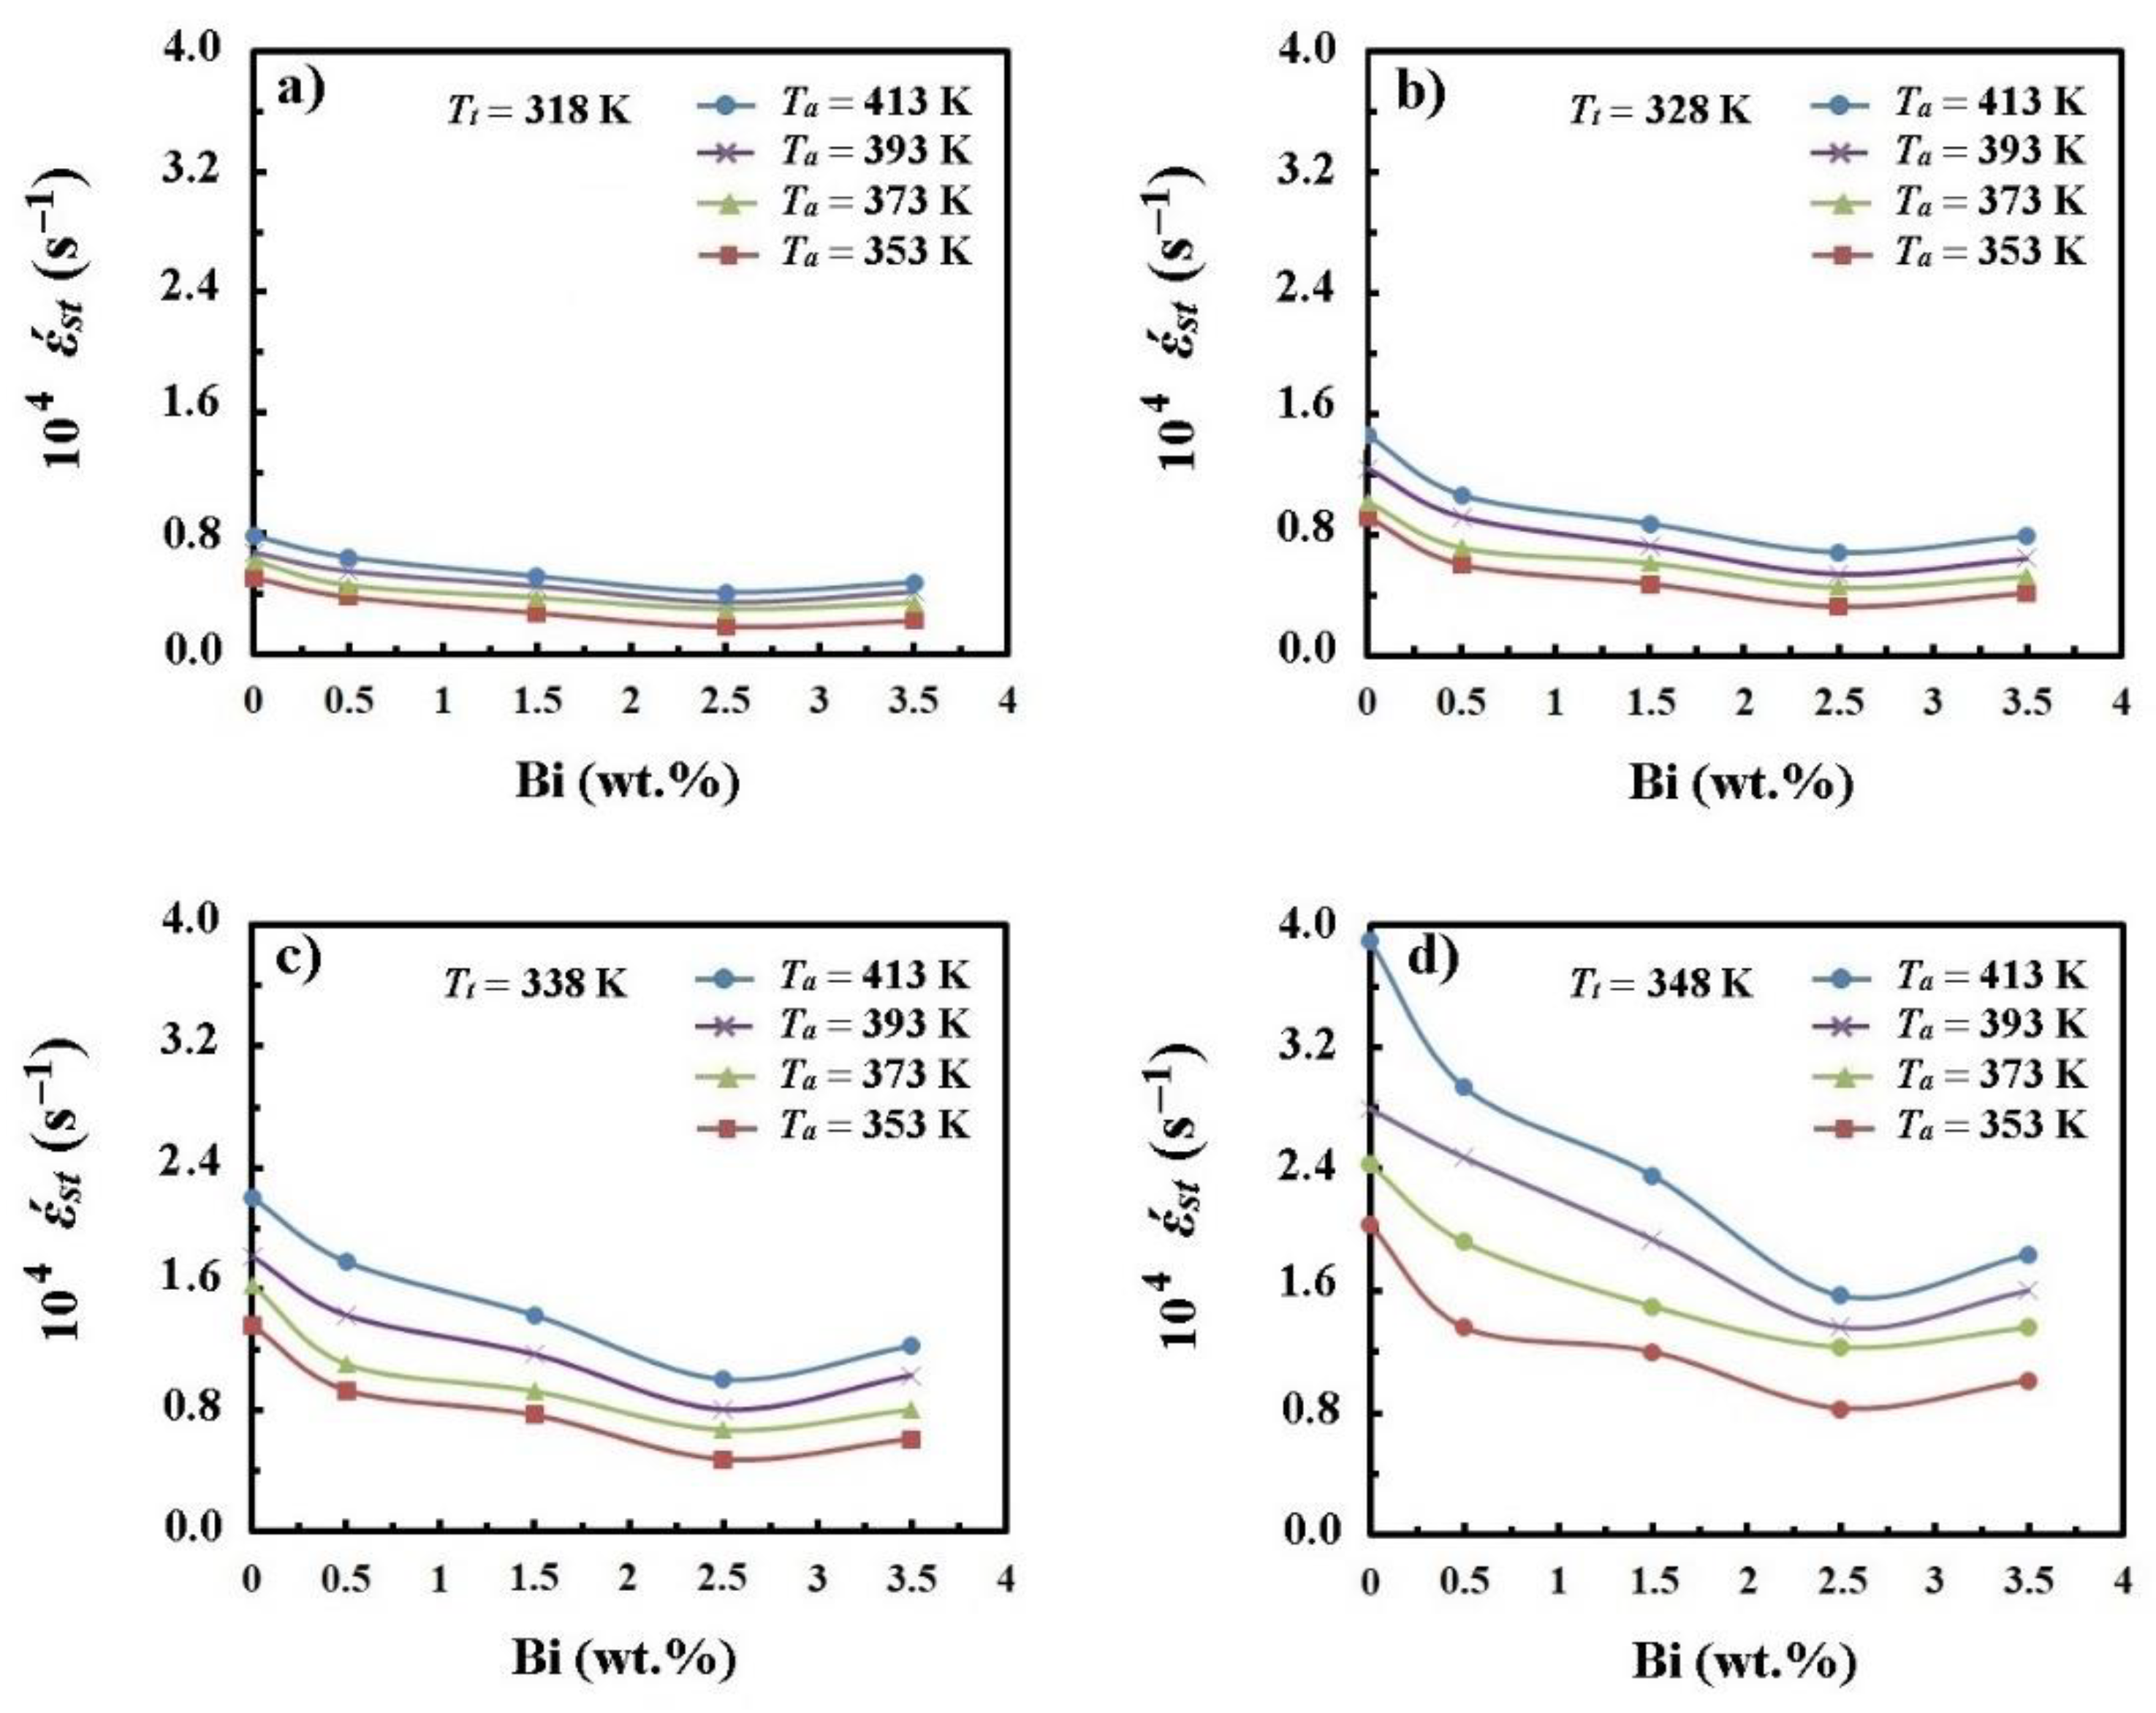
Creep curves series for SAC105-xBi solders were depicted for specimens at various aging temperatures (Ta = 353, 373, 373, and 413 K) for 120 min. Curves for specimens aged at 353 and 413 K are displayed in Figure 1 as representative creep curves. Inspection of these sets of curves indicates that the studied solders’ creep rate values are reduced with Bi-content elevation. The SAC105 solder shows the lowest creep resistance among the solders, while the SAC105-2.5Bi solder introduces the highest one. Furthermore, the creep rate values are increased with increasing aging temperature. It is possible to calculate the slope of the obtained creep curves (Figure 1) as a derivative of the creep strain and creep time. With this solution, the steady-state creep rate, έst, values can be obtained. Figure 2 demonstrates the steady-state creep rate dependence, έst, on the Bi content at different aging and testing temperatures. It is worth noting that for all aging temperatures, έst values are diminished with Bi concentration up to 2.5 wt.% then increased above this percentage. Moreover, έst values are shifted monotonically towards higher values with increasing aging and/or testing temperature.
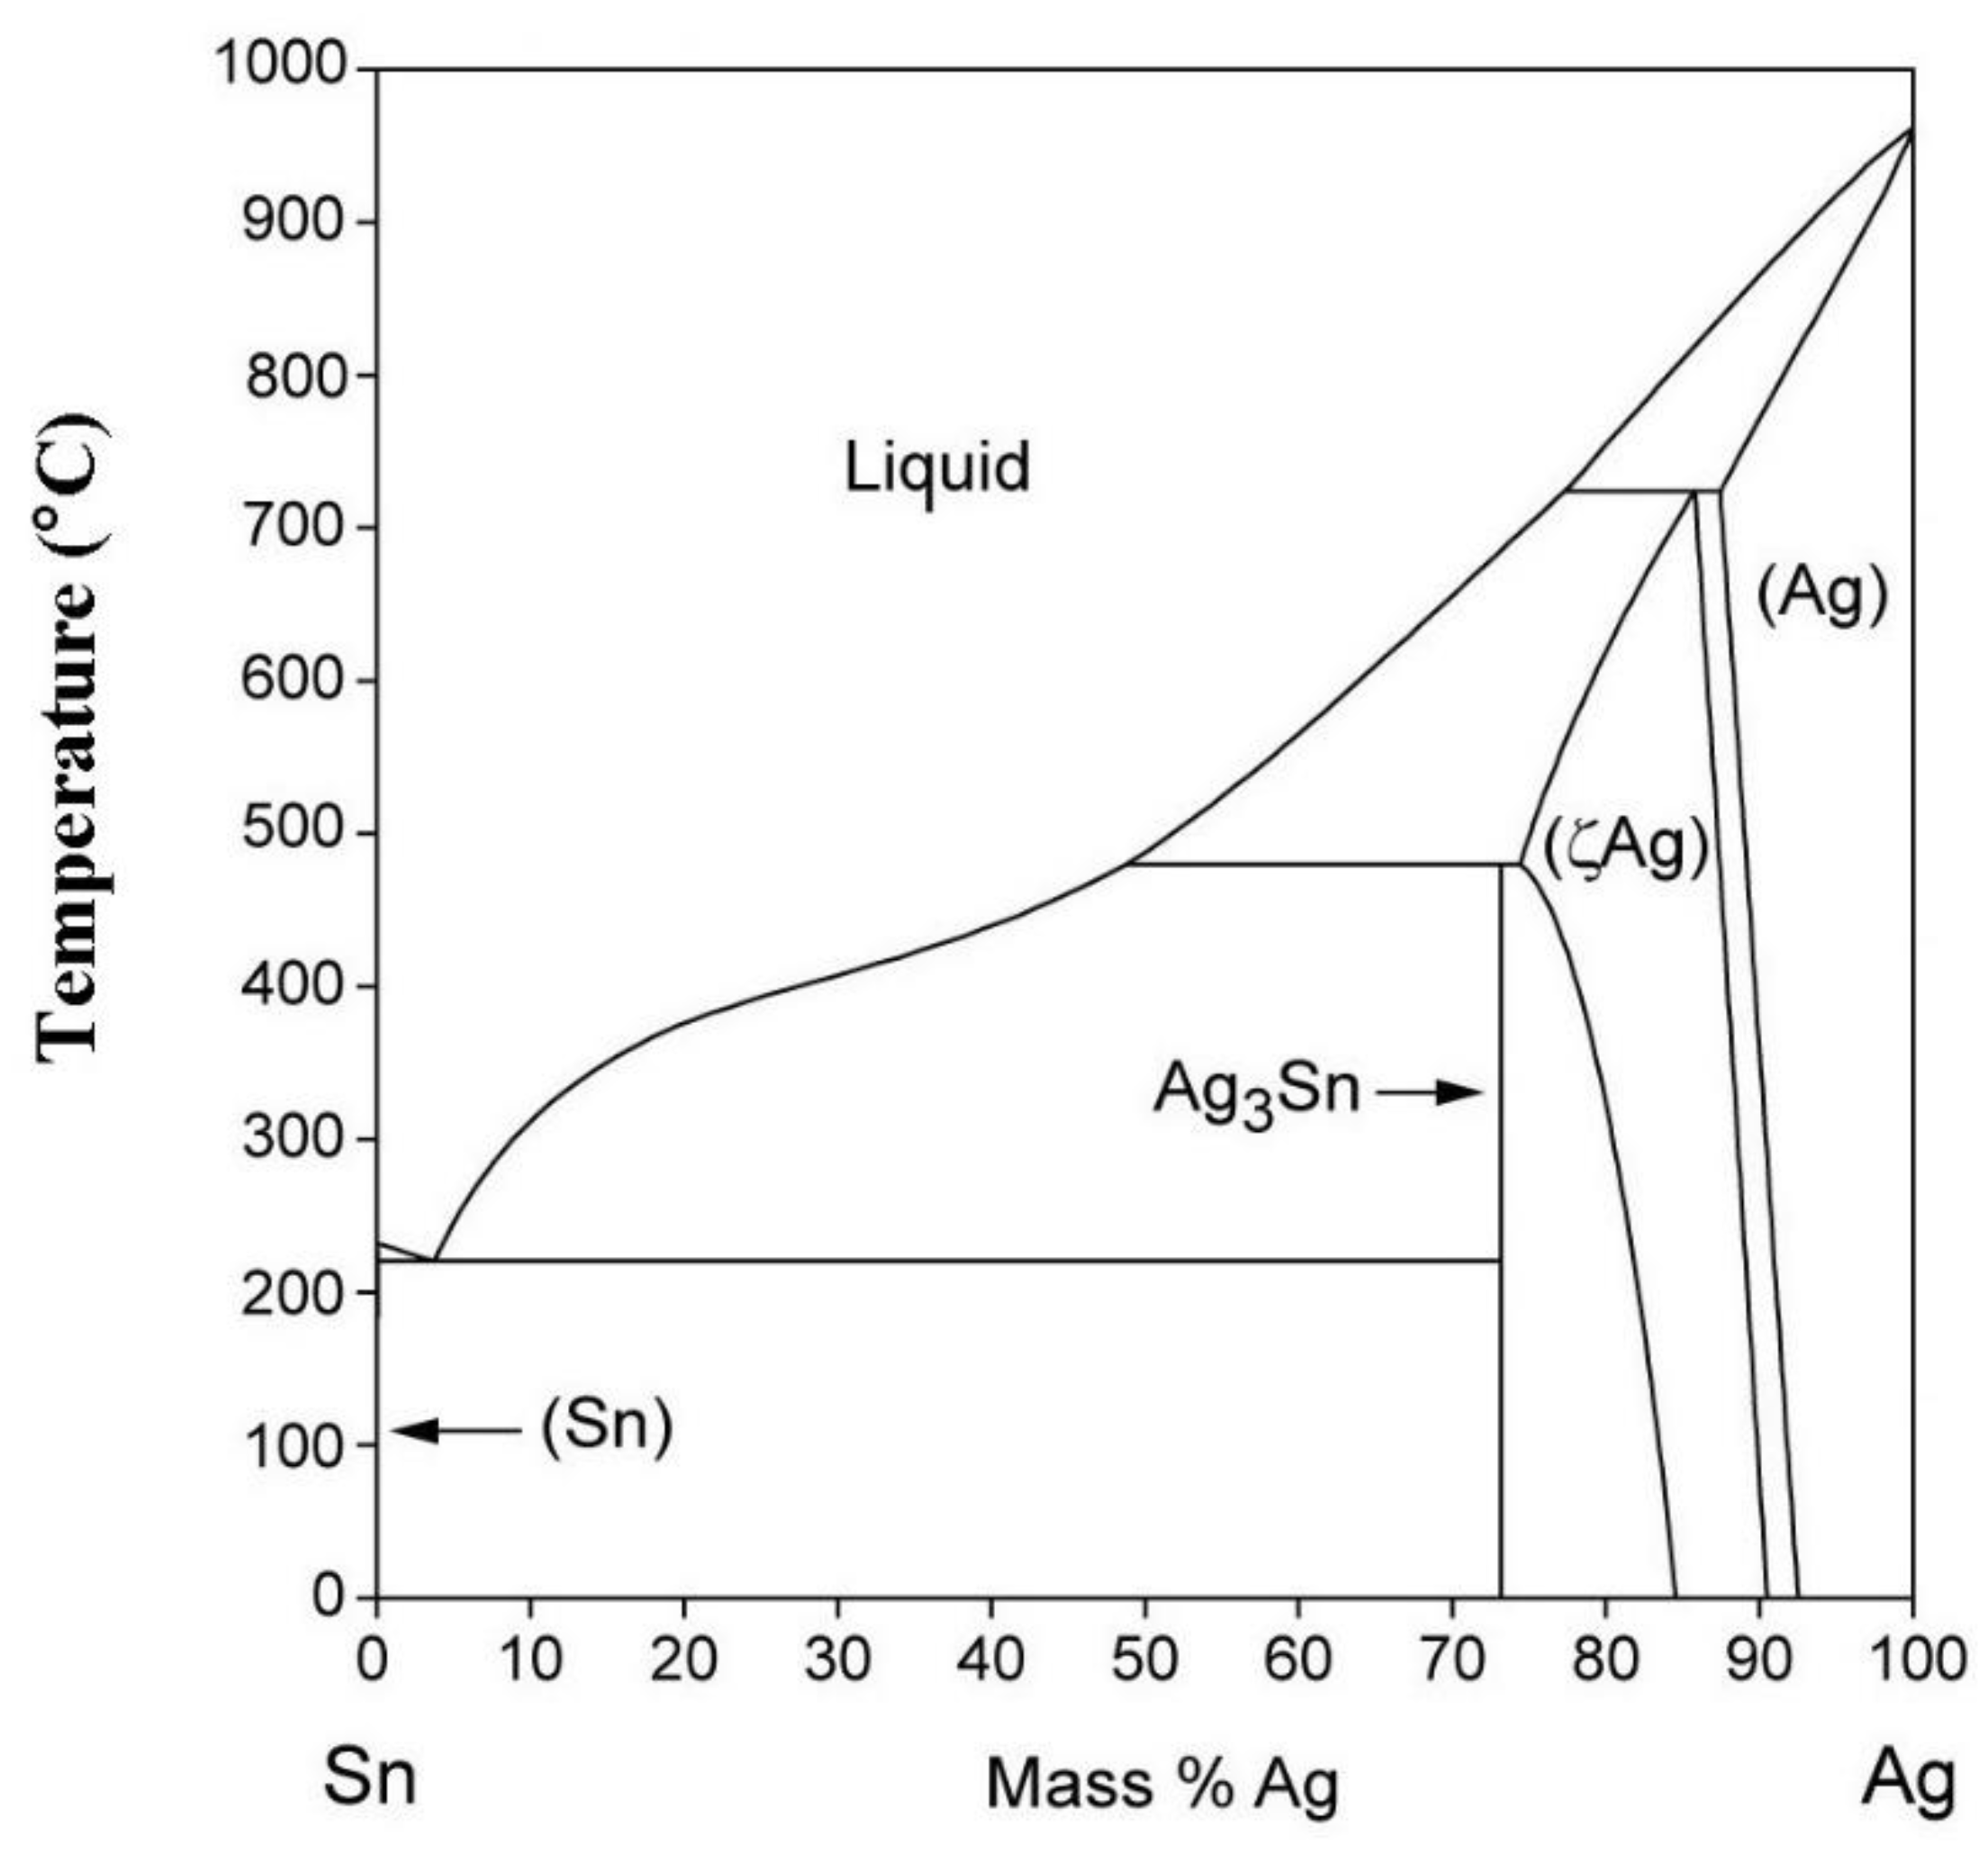
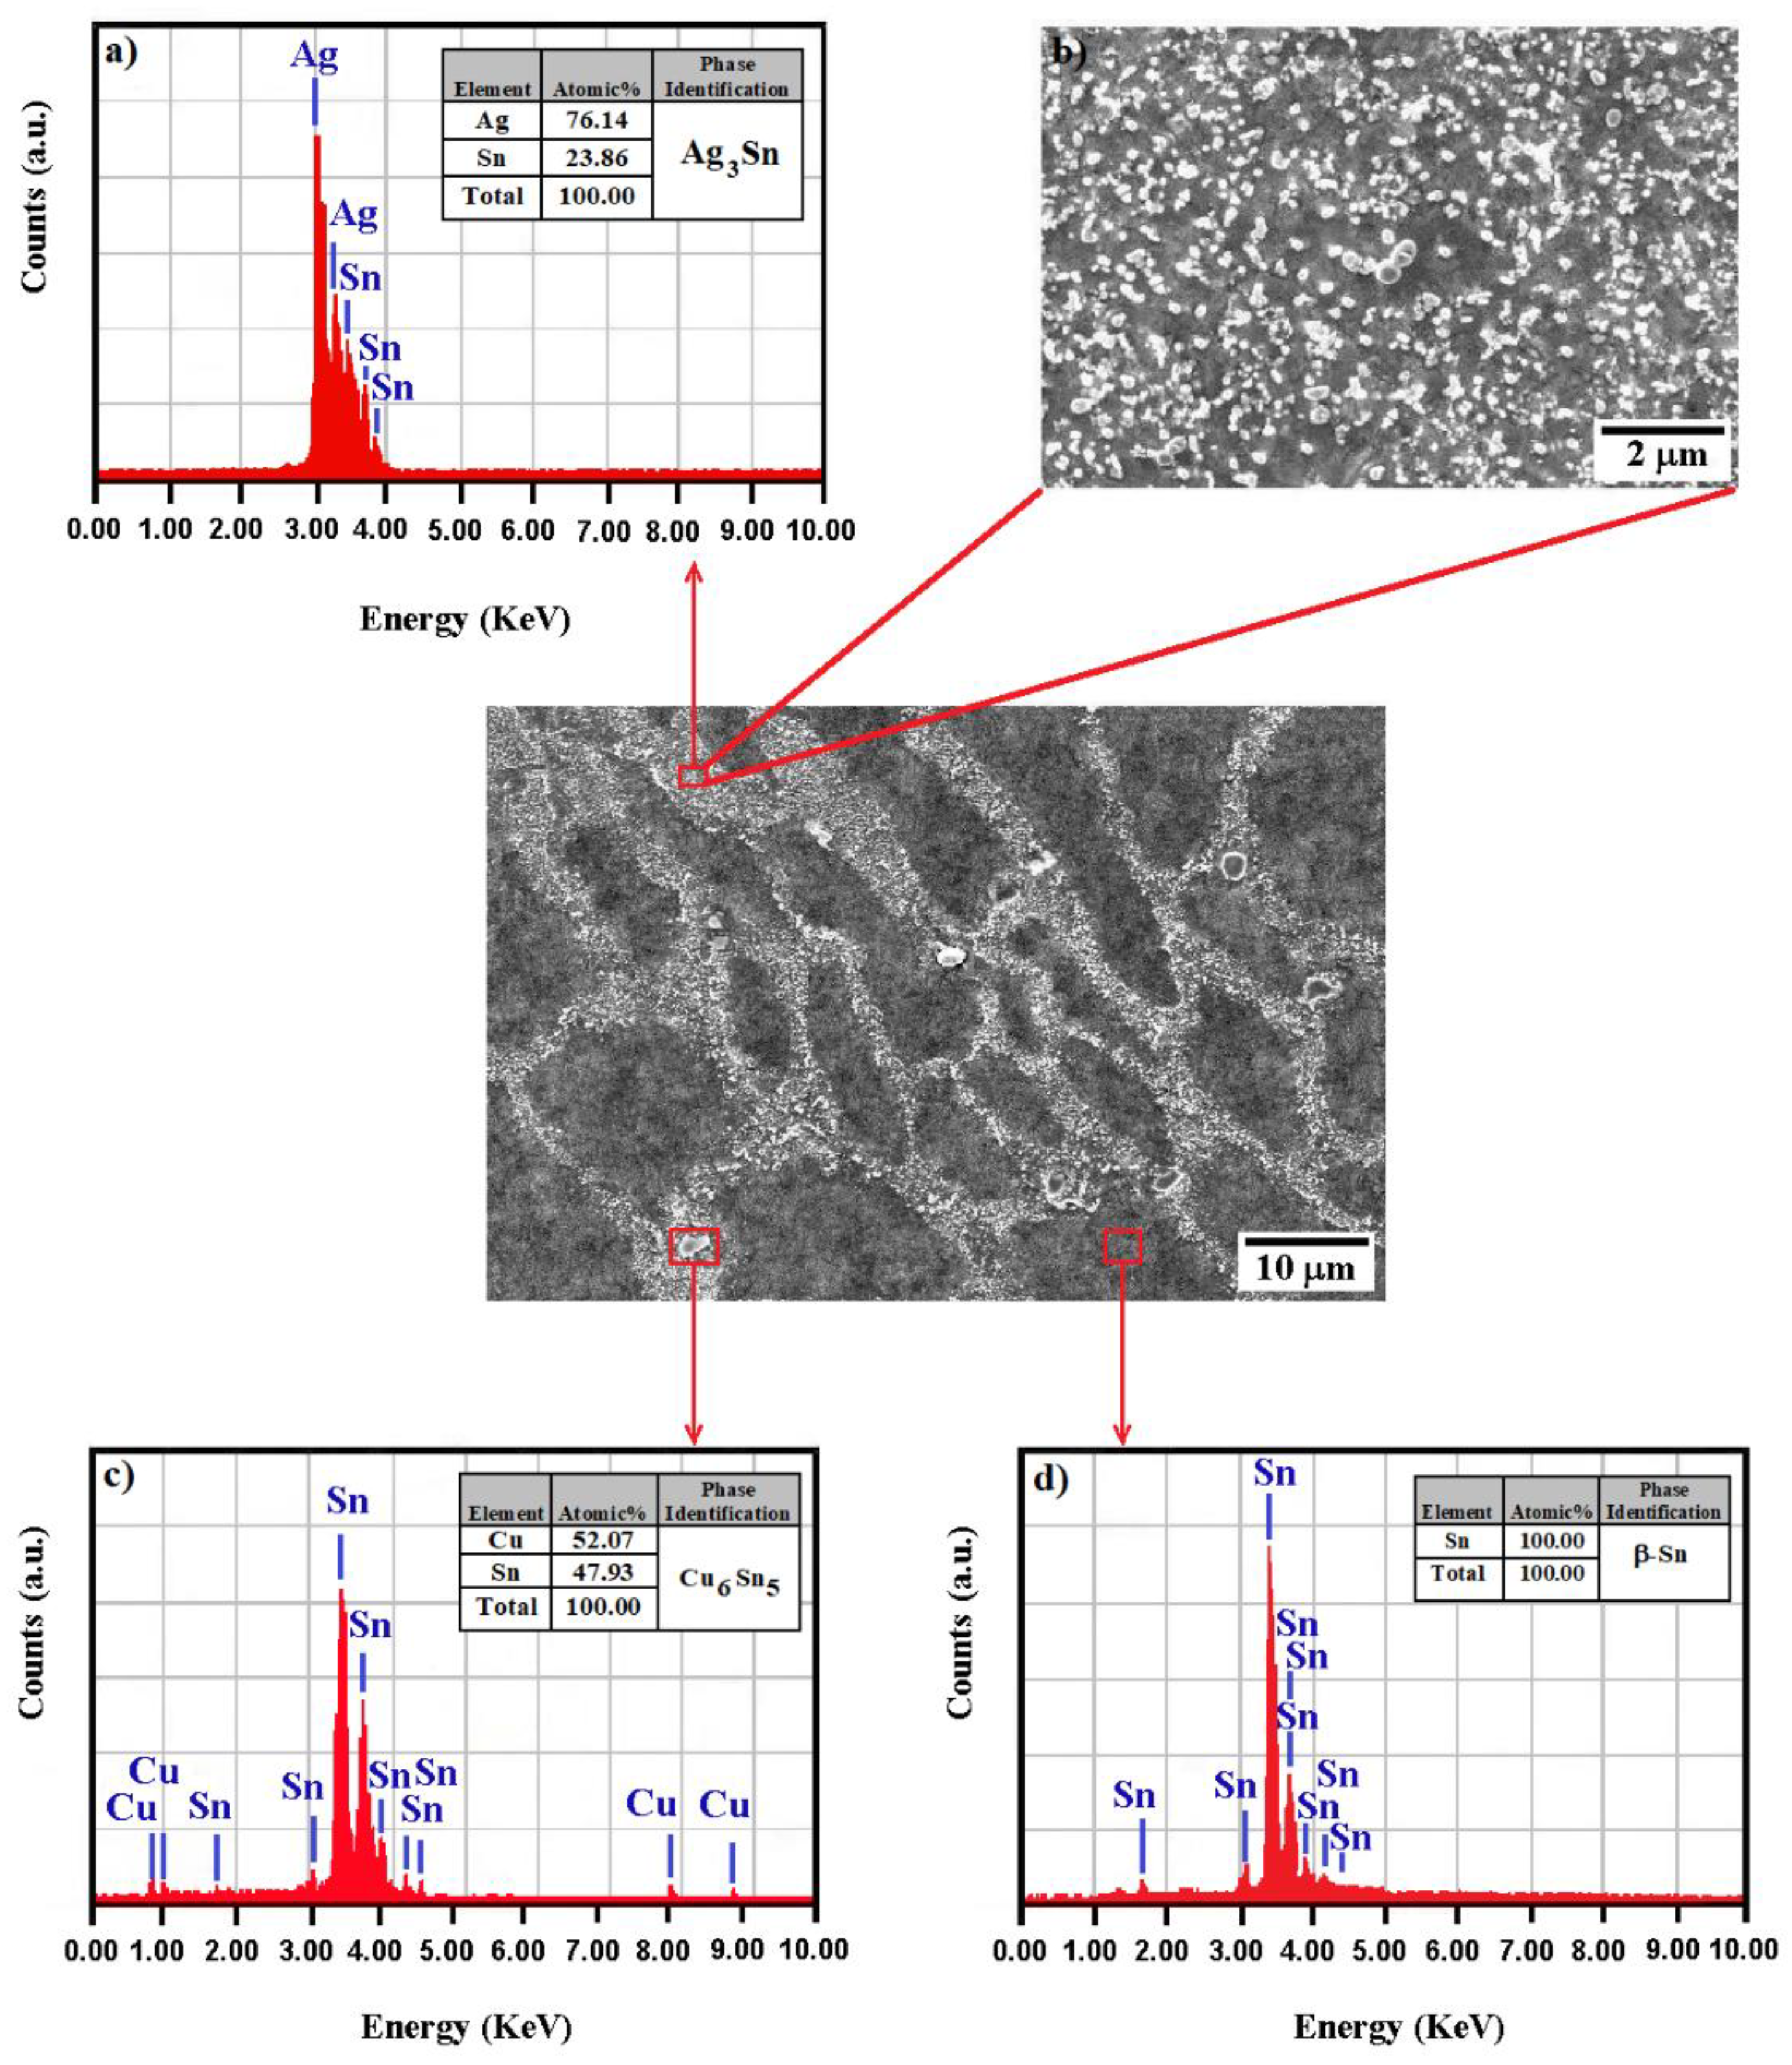
According to the binary phase diagram of Sn-Ag, Sn-Cu, and Ag-Cu systems (shown in Figure 3, Figure 4 and Figure 5, respectively), three possible phases may be established: (i) Ag reacts with Sn to form Ag3Sn (Figure 3). (ii) Due to the reaction between Sn and Cu Cu6Sn5 can be formed (Figure 4). However, when the Cu concentration is high enough, Cu3Sn will not form unless it is under elevated temperatures, which the current study did not identify. (iii) The Ag-rich phase and Cu-rich phase are established in (Figure 5). There is no reaction between Ag and Cu that results in the formation of IMCs [28,29]. Figure 6 presents a SEM micrograph that demonstrates the microstructure of the SAC105 solder after it has aged at 353 K. Interdendritic regions consist of a dot-like Ag3Sn phase and an irregular polygon of the Cu6Sn5 phase, also dark-gray β-Sn dendrites, all generate the microstructure. EDS analysis of the Ag3Sn phase verified its chemical composition, as seen in Figure 6a. A magnified view exhibited in Figure 6b showed that the Ag3Sn phase develops dot-like morphologies. According to EDS analysis, the irregular polygon phase was identified as the Cu6Sn5 phase (Figure 6c). Our observations align well with those established by other researchers [19,30,31], who detected the growth of Ag3Sn and Cu6Sn5 phases in the SAC solders. The Ag3Sn and Cu6Sn5 phases in the β-Sn matrix possess much higher strength than the bulk Sn-material. It was reported that [32] the fatigue life of the SAC solders has been improved by three to four times over the Sn-Pb eutectic solders due to the presence of Ag3Sn and Cu6Sn5 phases. It seems that the Cu6Sn5 and interspersed Ag3Sn precipitates that block and pin the dislocation motion contribute to the higher fatigue resistance.
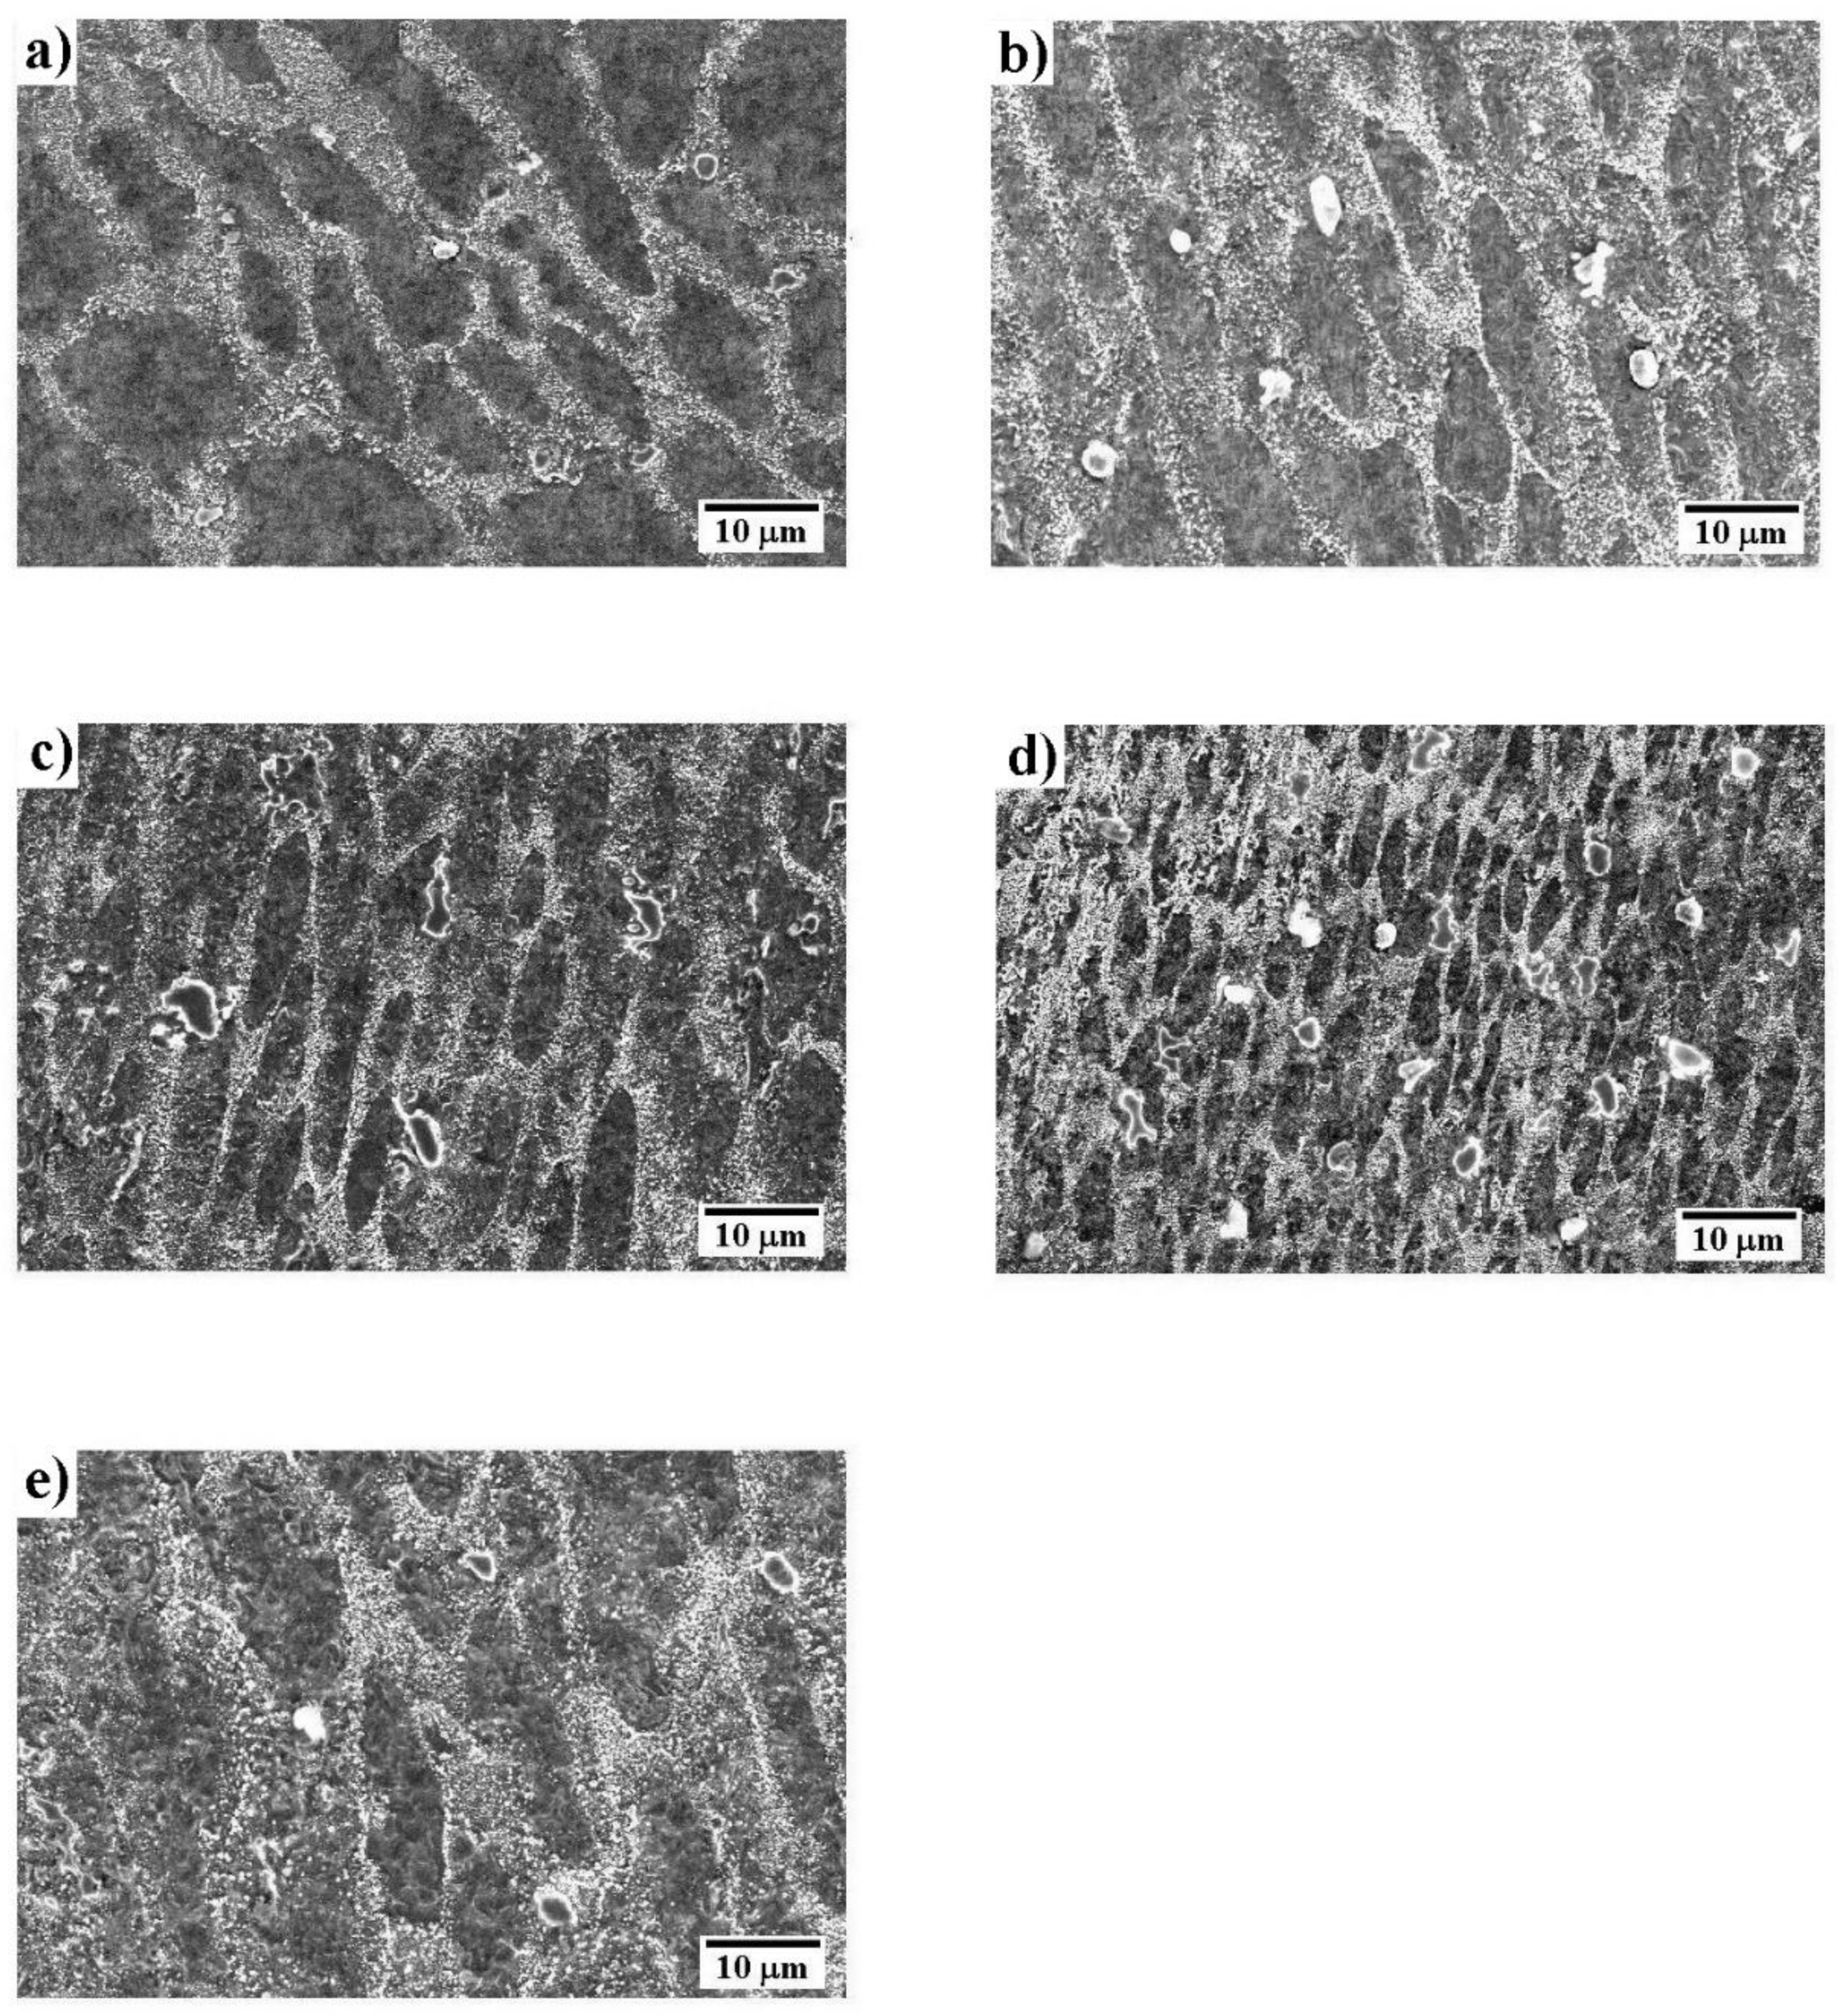
To evaluate the influence of Bi addition on the microstructure of SAC105 solder alloy, SEM was utilized. Figure 7 exhibits typical SEM images of microstructures of the SAC105-xBi (x = 0, 0.5, 1.5, 2.5, and 3.5 wt.%) solders aged at 353 K. Notably, the addition of Bi to the SAC105 solder produced significant microstructural changes, as shown in Figure 7a–e. All specimens contain a basic microstructure, which includes β-Sn, Ag3Sn, and Cu6Sn5 phases. As it is seen, the addition of Bi can promote the formation of the eutectic regions inside the β-Sn matrix and reduces the large β-Sn dendrite cell generation. The reason may be that Bi particles may act as the nucleation sites for the formation of the second phase in the eutectic colony during solidification. These fine Ag3Sn and Cu6Sn5 phases perform a predominant role in strengthening, reflecting the reduction of the έst values through Bi-content increment (see Figure 2). Our observations are well consistent with the earlier work of other investigators [17,19,33].
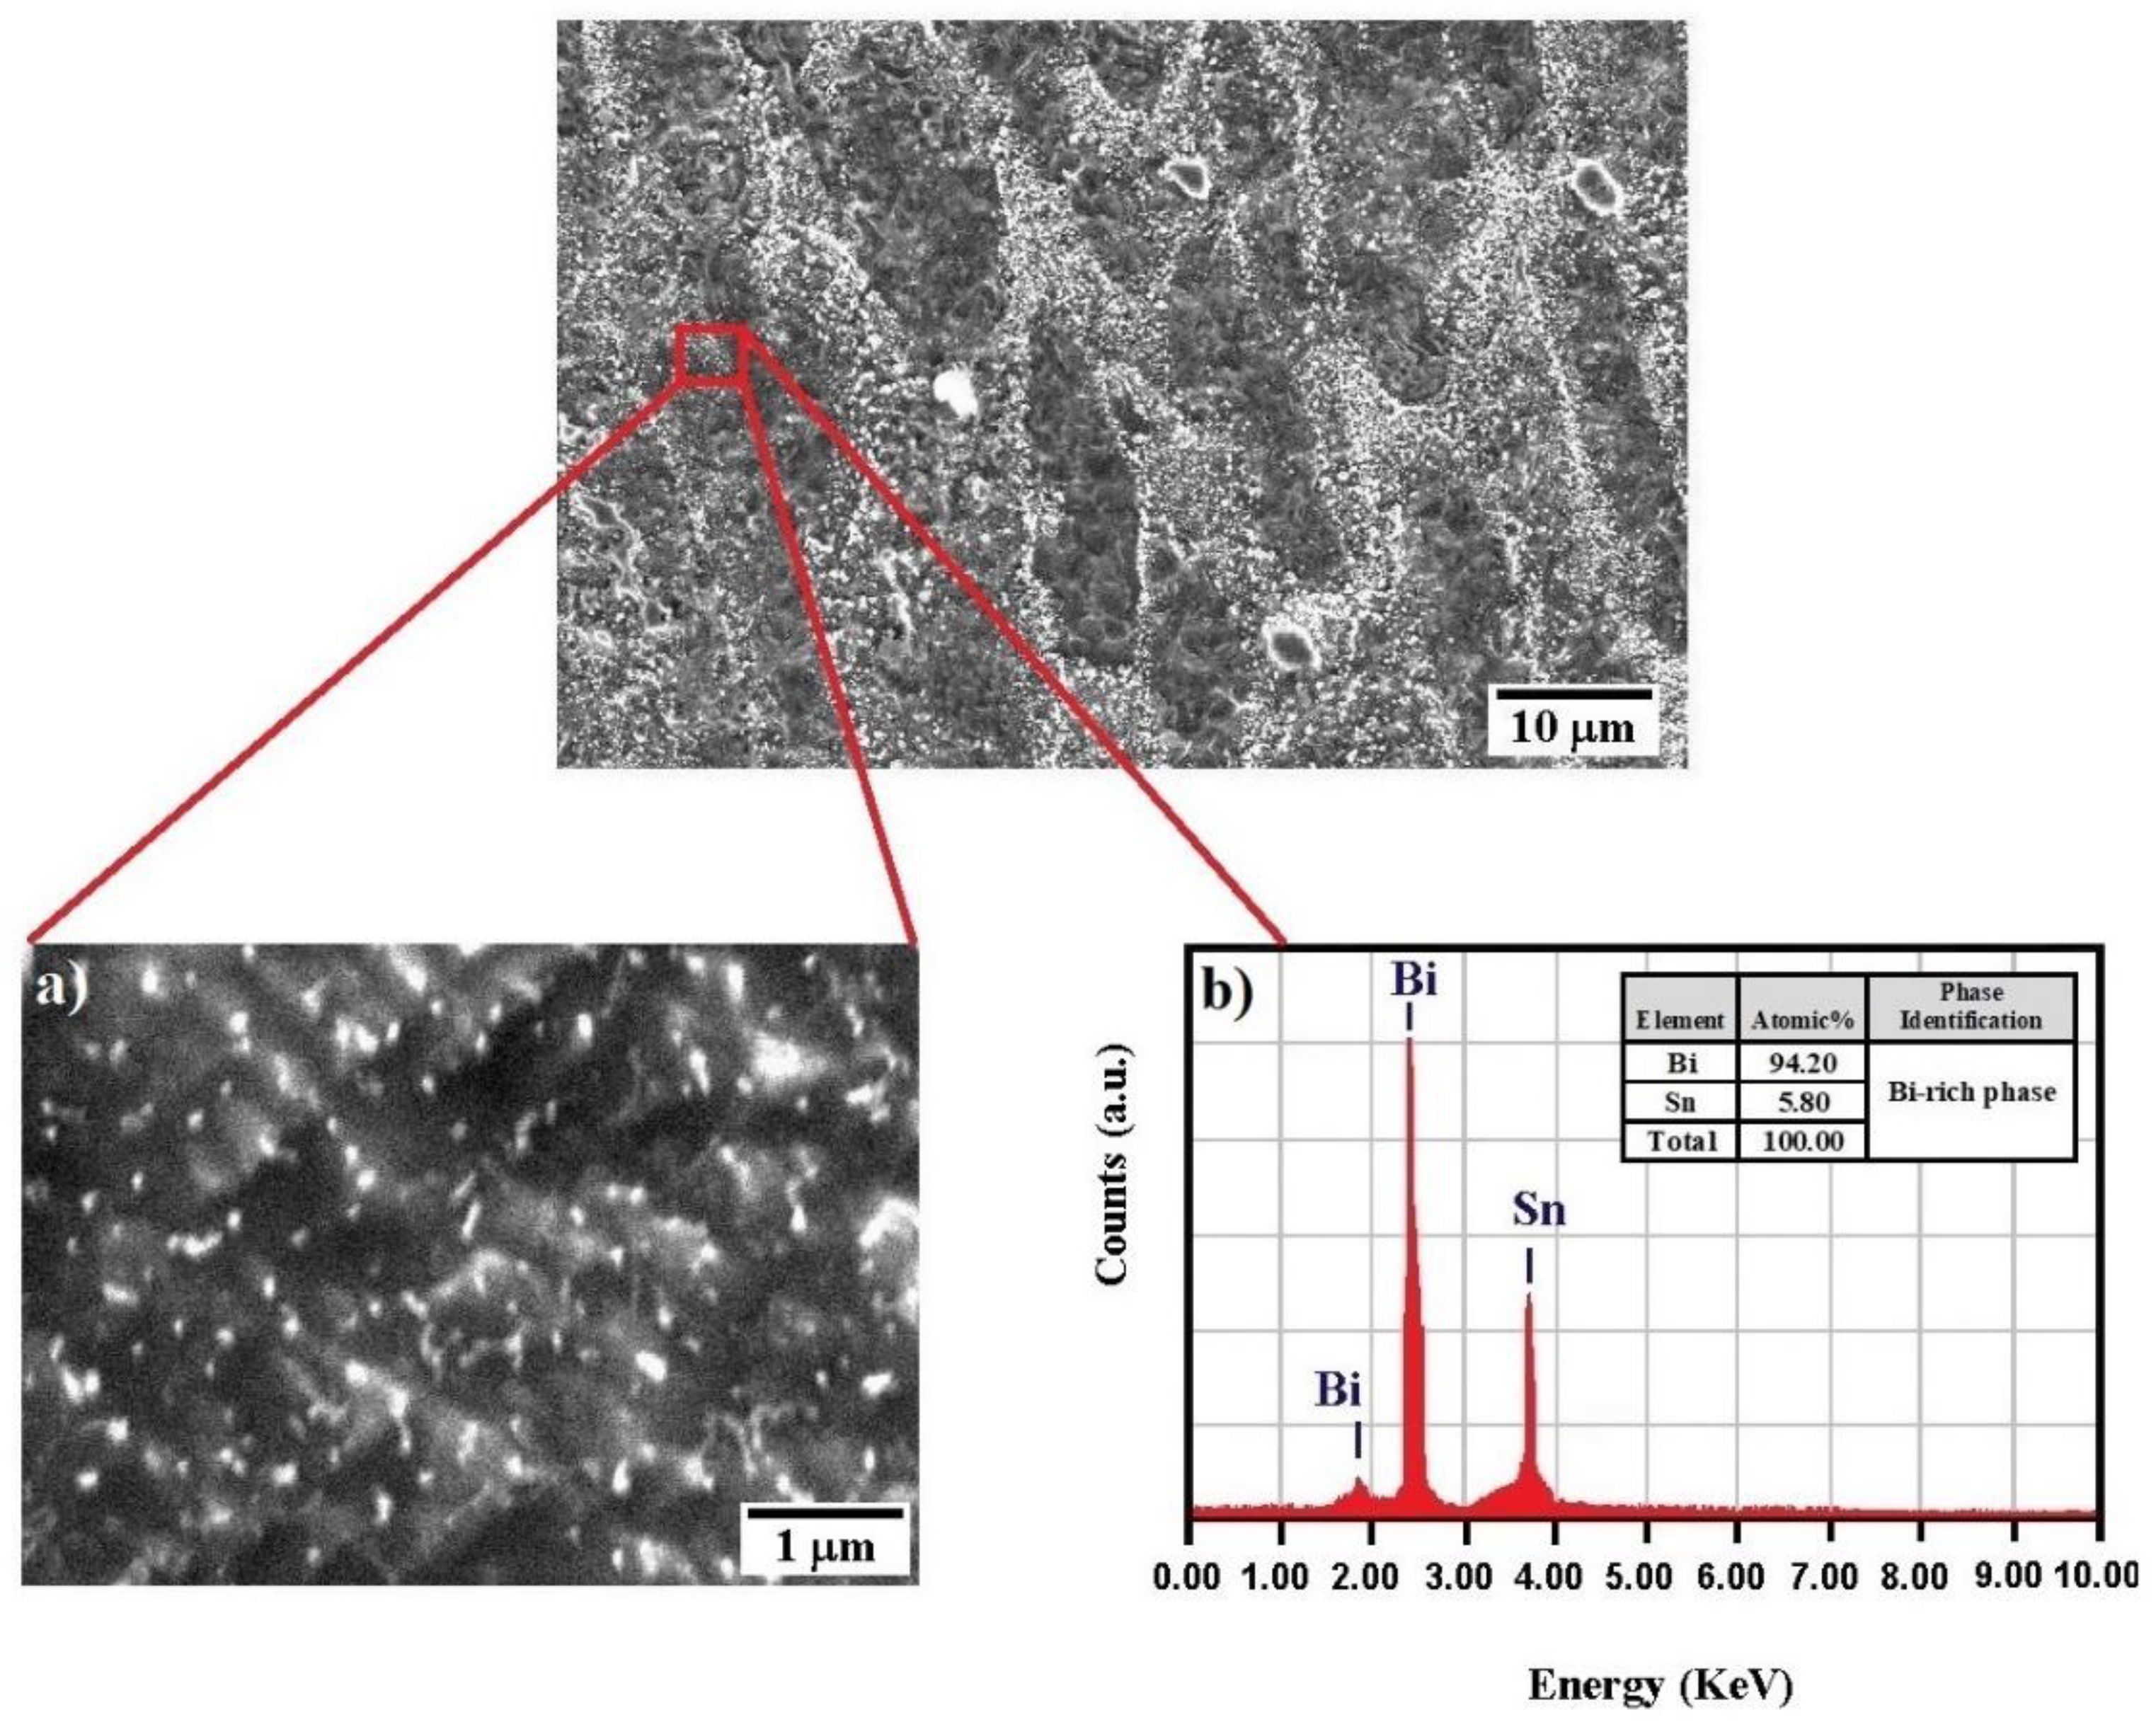
When 3.5Bi was added into the SAC105 solders, the steady-state creep rate values were found to increase abnormally (see Figure 2). These unusual observations may be elucidated as follows. The growth of larger particles at the smaller particles’ expense with a higher interfacial enthalpy is known as Ostwald ripening. The process’s driving force diminishes the total interface area between the dispersed particles and the matrix. Depending on the particle size variation, the free energy of a particle alters. This alteration leads to solubility variation at the particle/matrix interface (Gibbs–Thomson effect). The result is that the matrix surrounding the larger particles contains less solute than the matrix area around smaller particles, which sets up solute concentration gradients in the direction of the smaller particles to the larger particles. Consequently, the smaller particles shrink, and the larger particles grow, even while the particles’ overall volume fraction is still invariable [34,35]. The 3.5Bi addition elevates the size and spacing between Ag3Sn and Cu6Sn5 precipitates, which are still smaller for the Bi-free solders (Figure 7e). These observations may be referred to the Bi rich phase accumulation in the β-Sn matrix. Figure 8 exhibiting the microstructure of the SAC105 solder containing 3.5Bi. A magnified view disclosed in Figure 8a showing the distribution of the Bi-rich phase within the β-Sn matrix. The Bi-rich phase’s chemical composition was also characterized by EDS analysis, as shown in Figure 8b. The microstructure revealed that the Bi contained in the SAC105-3.5Bi solder participated in the “enrichment” in the β-Sn dendrite cells. Our results are compatible with the previous findings of Zhao et al. [17], who concluded that fine particles of Bi rich phase are precipitated when the Bi content is more than 3 wt.%. This is in line with the previous work of Huang et al. [33], who concluded that it is not possible to observe fine Bi particles in the Sn–Ag-based solders containing 1 and 2 wt.% Bi. Since the Van der Waals’ forces cause Bi particles to become entangled with each other, bismuth concentrations reach approximately 3.5% wt.%; this is around the time that the Ag3Sn and Cu6Sn5 phases start to precipitate, resulting in lower solder reliability. This is consistent with the previously reported findings by Sayyadi and Naffakh-Moosavy [7]. They found that the SAC-Bi solder alloys’ mechanical properties were reduced by increasing the Bi concentration from 2.5 to 5 wt.%.
The results shown in Figure 2 demonstrate that the έst values are increased with increasing aging temperature, Ta, from 353 to 413 K for all five investigated solders. This might be ascribed to the coarsening and coalescence of Ag3Sn and Cu6Sn5 precipitates. Such coarsening and coalescence increase precipitates size accompanied by the reduction of their numbers, thus the matrix gets clean, and the dislocation barriers will widely be reduced, leading to higher creep rates. SEM investigations strongly support the above interpretation based on coarsening and coalescence of Ag3Sn and Cu6Sn5 precipitates. Typical SEM images of the SAC105 solders reinforced with various Bi additions aged at 413 K are presented in Figure 9. It has been reported [33] that the aging process of the SAC solders results in a growth in IMCs size, accompanied by a reduction in their numbers. When the dislocation moves, it has two possible courses of action. It can either bend around and bypass the precipitates or cut through them. The first alternative is possible only when the slip plane is continuous from the matrix through the precipitates. When the stress to move a dislocation in precipitates is comparable to that in the β-Sn matrix. When there is an interface or a change in orientation, it is impossible to cut a precipice. Under such an instance, dislocations have to bend around them and bypass. In this instance, the mechanism works similarly to a Frank–Reed source. For Ag3Sn and Cu6Sn5 precipitates, which may be regarded as incoherent precipitates of large size and a small number, dislocations will bow and leave a loop of stress field around the particle [36]. The yield stress, σo, of the solder can be determined from the relationship [37]:
σ o =   G b σ π   ( 1 v ) L  
where G is the solder shear elastic modulus, b is the Burgers vector, σ is the stress at the particle surface, ν is the Poisson’s ratio, and L is the inter-particle spacing between the two particles. According to Equation (1), as the inter-particle spacing, L, increases during aging, the yield stress, σ0, will decline. Therefore, the steady-state creep rate values, έst, are increased with the coarsening and coalescing of Ag3Sn and Cu6Sn5 precipitates. Our experimental results are consistent with those reported by Wu al. [38], who pointed out that the thickness of Ag3Sn and Cu6Sn5 precipitates increases as the aging temperature increases. Sona and Prabhu [28] reported that Ag3Sn and Cu6Sn5 IMCs grow during aging, and the strength of the SAC solder alloys decreases with the IMCs size increase. Coarsening of the microstructure may be the reason for this strength reduction after aging in the solder alloys.
A further representation for the influence of testing temperature, Tt, on the steady-state creep rate values, έst, at different aging temperatures is displayed in Figure 10. Based on dislocation density and average dislocation spacing, the increase in the steady-state creep rate, έst, values with increasing testing temperature, Tt, for all investigated solders can be clarified. A decrease in the dislocation density occurs as the testing temperature increases, providing an increase in the average distance of dislocations. A moving dislocation can then bypass the precipitates by moving in clean pieces between the precipitated and coarsened particles. Accordingly, the steady-state creep rate, έst, values rise with testing temperature increment. The other data, which has been described in other literature [39,40], is very similar to the results found in this study.
Estimating the creep process’s apparent activation energy value is attempted by applying the Arrhenius-type relation that relates the creep rate, έst, to the testing temperature, Tt, as follows [41]:
έst = A σn exp(−Q/RTt)
where A is a structure-dependent constant, σ is the applied stress, n is the stress exponent, Q is the creep activation energy, and R is the universal gas constant. The slopes of the straight lines relating ln έst against (103/Tt) were estimated, giving the creep activation energy, Q, for all investigated solders aged at various temperatures (Figure 11). The mean value of activation energy was found to be ∼52 kJ/mol. This activation energy value is consistent with that quoted for dislocation climb through core diffusion as the dominant operating mechanism [42,43].
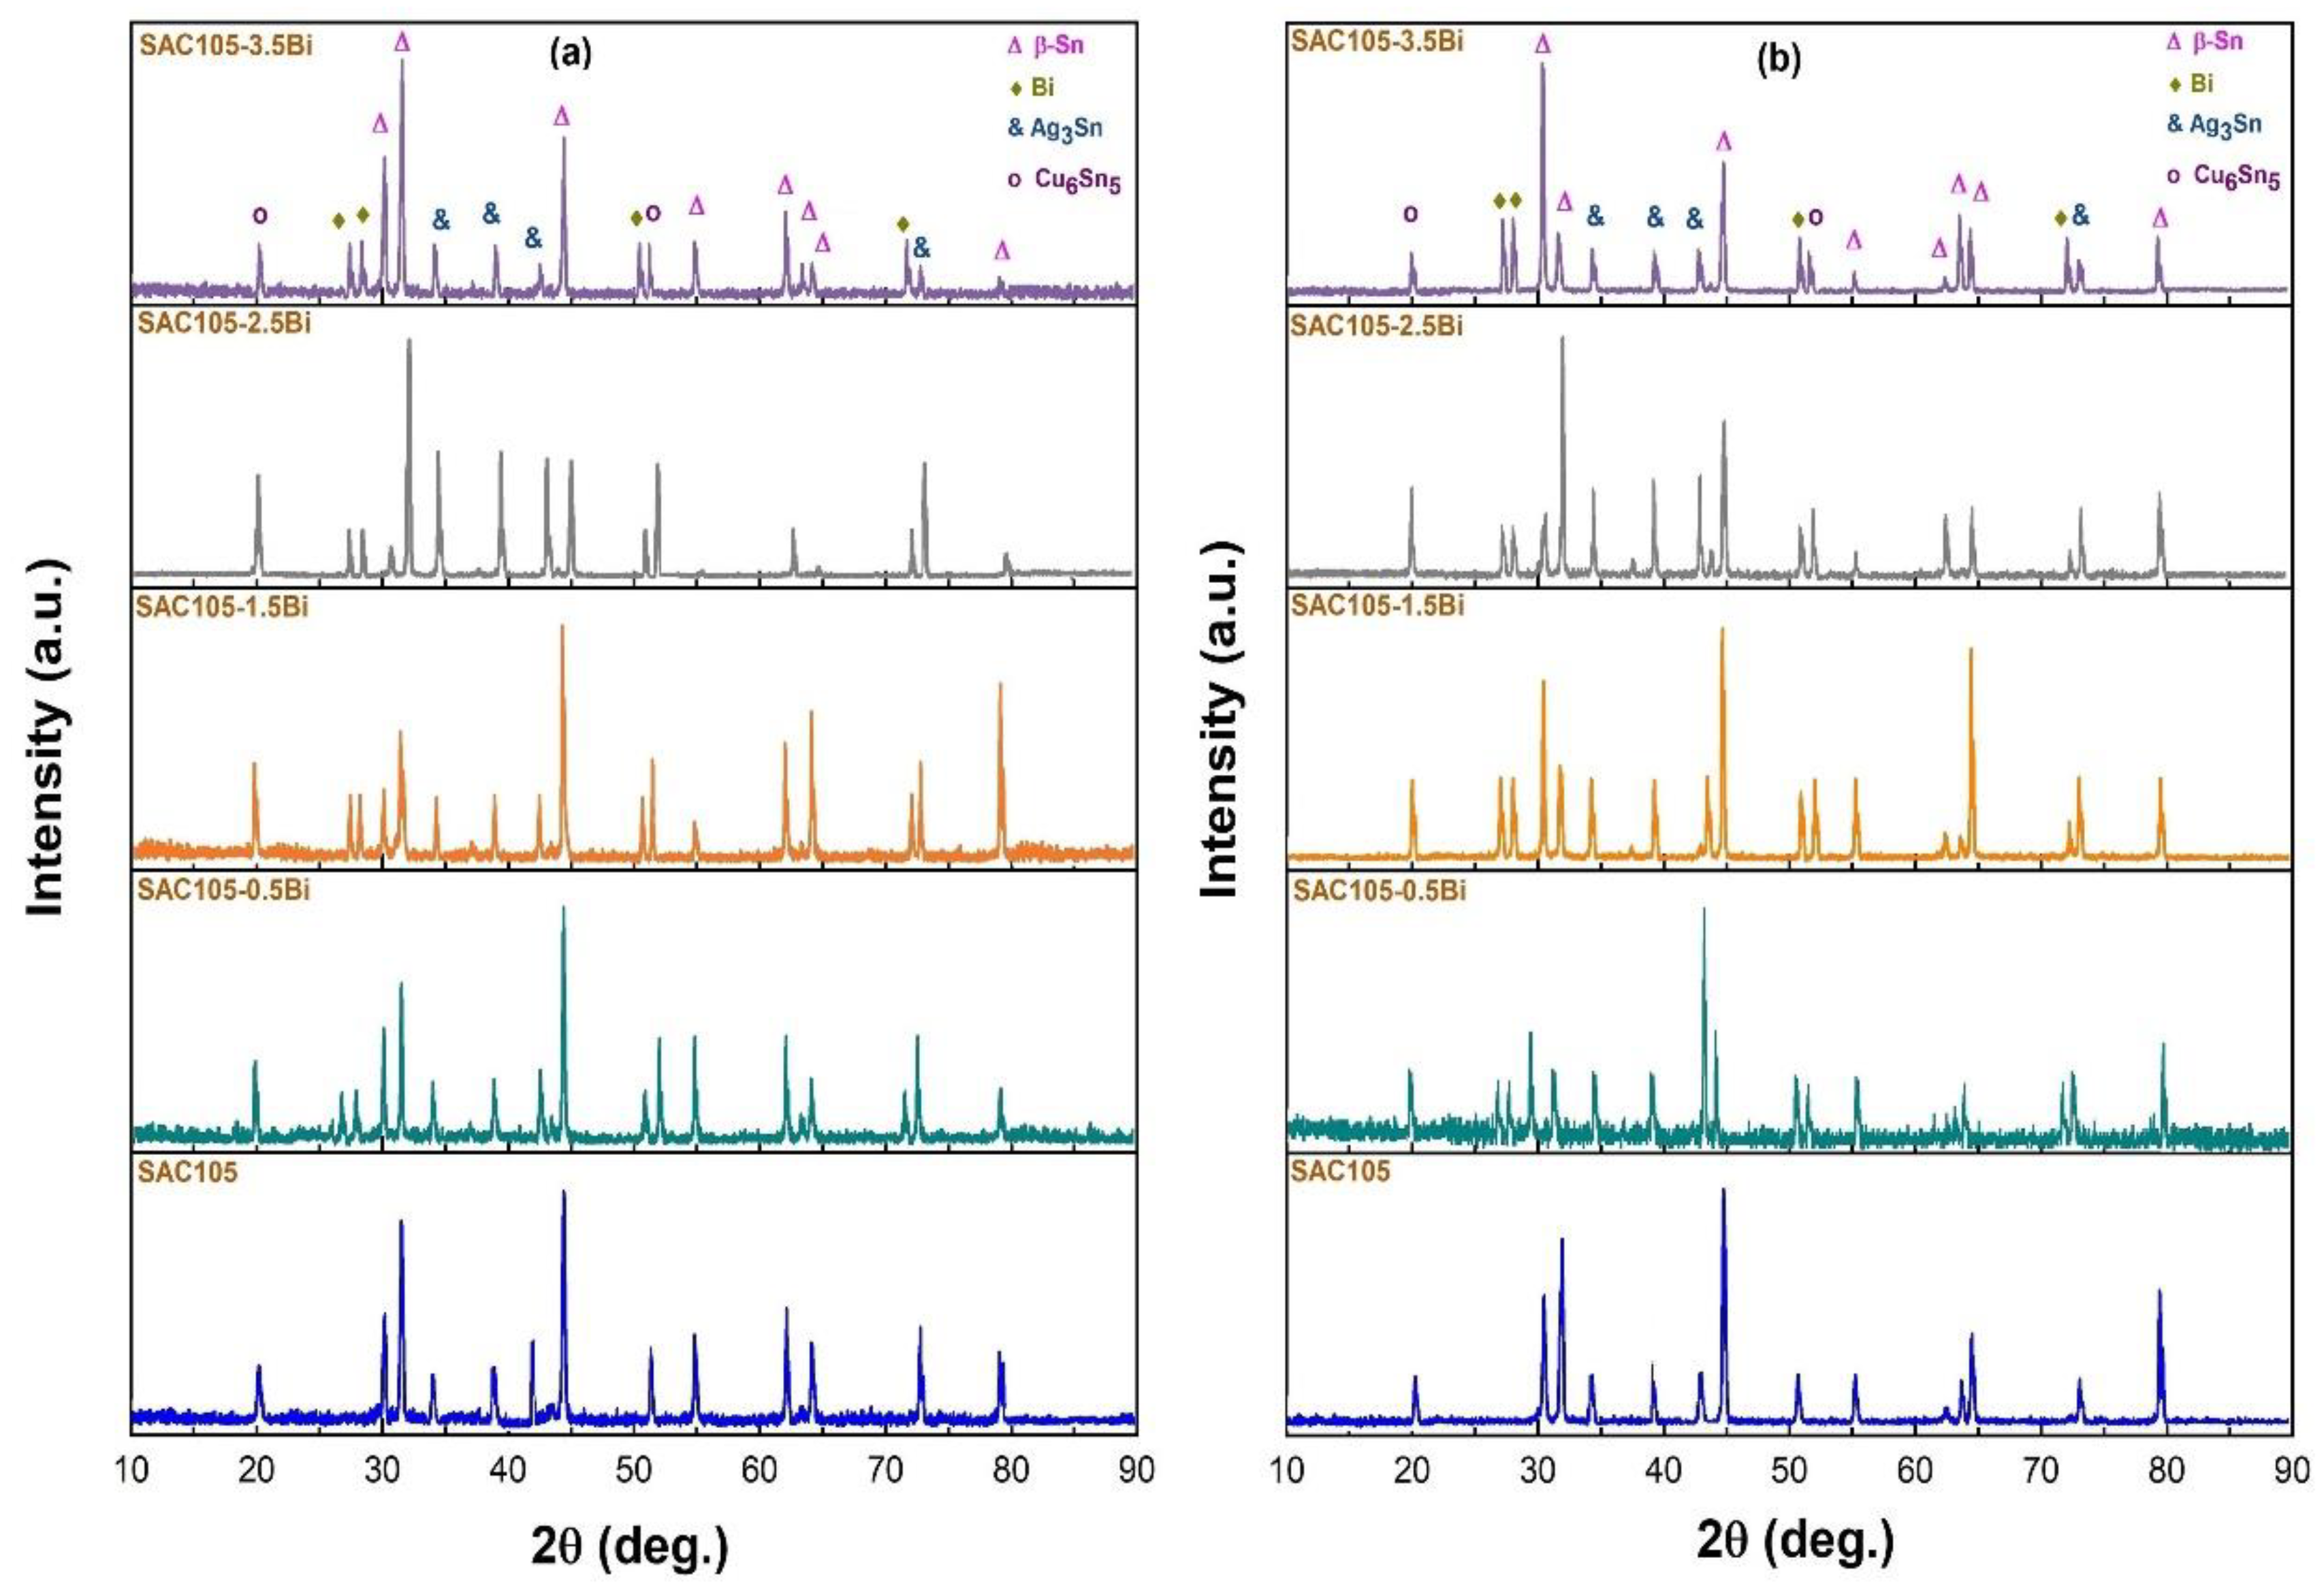
X-ray diffraction (XRD) analysis was performed to confirm the tetragonal β-Sn phase existence as a matrix (JCPDS 04-0673). Figure 12a,b shows the XRD charts for the investigated solder alloys aged at 353 K and 413 K for 120 min as a representative example. The Cu6Sn5 (JCPDS card no. 65-2303) and Ag3Sn (JCPDS card no. 44-1300) IMCs appeared as the main phases overall the solder patterns. Bismuth was observed as a separated phase (JCPDS 89-2387) for all Bi-containing alloys because it did not form IMCs in the interfacial reactions. Olofinjana et al. [44] reported Bi peaks as a primary phase and their development in a series of SAC-Bi solders. Kim et al. [45] illustrated the existence of both the Cu6Sn5 and Ag3Sn phases in Sn-Ag-Cu alloys. Figure 12 reveals that the increment of IMCs peaks intensities with the elevation of Bi content up to 2.5 wt.%. The higher bismuth concentration (3.5 wt.%) declares the reduction in the Cu6Sn5 and Ag3Sn intensities but increases Bi diffraction peaks intensities at both aging temperatures. As a result, the steady-state creep rate values reach their maxima for SAC-2.5 Bi alloy at all aging temperatures, which can be rendered to Bi precipitates formed in the matrix (up to 2.5 wt.%), decreases the size of the IMCs, and causes higher strength through the prevention of the dislocations movement, delay plasticity, and decrease ductility [7,46].
The estimation of the lattice parameters, a and c for the β-Sn rich phase with the tetragonal crystal structure was carried out by substitution d-spacing values for two diffraction planes ((200) and (101)) in the following equation [45]:
1 d 2 = h 2 + k 2 a 2 + l 2 c 2
where h, k, and l represent the Miller indices for 200 and 101 diffraction planes.
Table 2 explores that under both aging conditions and Bi-content, the lattice parameters, c/a ratio, and the unit cell volume V of the b-Sn phase slightly change for the investigated alloys. Calculation errors were recorded as separated columns in that Table. The findings reveal that the presented specimens’ lattice parameters are close to those previously determined for the Sn-lattice (JCPDS 04-0673). SAC-2.5Bi alloy has relatively low (a) values and has relatively high values of the other parameters (e.g., c and c/a ratios). The previous study [47] explored that Sn-phase’s lattice parameters changed with Bi-content, but they still close to binary alloy lattice parameters. Once the Bi atoms were dispersed into the matrix, they stopped the dislocations’ mobility. This change improved the strength and hardness simultaneously, as explained by Mahdavifard et al. [19].
Consequently, the unit cell volume was determined through the equation [45]:
V = a 2 c
The recorded V values (Table 2) are near the standard value (108.18 Å3) to β-Sn phase. These values for the unit cell volume agree with those in the literature [19,47].

4. Conclusions

The creep behavior of Sn-1Ag-0.5Cu solders has been affected by Bi addition and aging temperature at different testing temperatures through the current study. In light of these findings, the following conclusions can be drawn:
(1)
The steady-state creep rate values were decreased continuously as Bi concentration was elevating up to 2.5 wt.%; above this weight ratio, the trend runs in the opposite direction.
(2)
The steady-state creep rate values for all Bi-containing solders increased as the aging and/or testing temperatures raised.
(3)
The steady-state creep rate alterations with Bi ratio and aging temperature were attributed to the formation, growth, coarsening, and coalescence of Ag3Sn and Cu6Sn5 precipitates.
(4)
According to the activation energy mean value, the dislocation climb through the core diffusion was the predominant creep mechanism.
(5)
The unit cell volume, the lattice constants a and c of the Sn-matrix vary depending on the change in the bismuth content and aging temperature variations

Author Contributions

Conceptualization, A.F.A.E.-R., H.Y.Z. and A.S.M.; investigation, A.F.A.E.-R., H.Y.Z. and A.S.M.; methodology, A.F.A.E.-R., H.Y.Z. and A.S.M.; writing—original draft, A.F.A.E.-R.; writing—review and editing, A.F.A.E.-R. and H.Y.Z. All authors have read and agreed to the published version of the manuscript.

Funding

This research was funded by King Khalid University through research groups program under grant number R.G.P. 1/277/42.

Institutional Review Board Statement

Not applicable.

Informed Consent Statement

Not applicable.

Data Availability Statement

The data presented in this study are available on request from the corresponding author.

Acknowledgments

The authors extend their appreciation to the Deanship of Scientific Research at King Khalid University for funding this work through research groups program under grant number R.G.P. 1/277/42.

Conflicts of Interest

The authors declare no conflict of interest.

References

  1. El-Daly, A.A.; Eladly, S.A.; Mohamed, A.; Elmosalami, T.A.; Dawood, M.S. Improvement of strength-ductility trade-off in a Sn–0.7Cu–0.2Ni lead-free solder alloys through Al-microalloying. J. Mater. Sci. Mater. Electron. 2020, 31, 8649–8661. [Google Scholar] [CrossRef]
  2. Yavuzer, B.; Özyürek, D.; Tunçay, T. Microstructure and mechanical properties of Sn 9Zn-xAl and Sn-9Zn-xCu lead-free solder alloys. Mater. Sci. Pol. 2020, 38, 34–40. [Google Scholar] [CrossRef]
  3. Abd El-Rehim, A.F.; Mahmoud, A.S.; Abdelaziz, S.M. Influence of Sb2O3 nanoparticles addition on the thermal, microstructural and creep properties of hypoeutectic Sn–Bi solder alloy. Sci. Adv. Mater. 2021, 13, 20–29. [Google Scholar]
  4. Wu, J.; Xue, S.; Wang, J.; Wu, M. Coupling effects of rare-earth Pr and Al2O3 nanoparticles on the microstructure and properties of Sn-0.3Ag-0.7Cu low-Ag solder. J. Alloys Compd. 2019, 784, 471–487. [Google Scholar] [CrossRef]
  5. Jing, H.; Guo, H.; Wang, L.; Wei, J.; Xu, L.; Han, Y. Influence of Ag-modified graphene nanosheets addition into Sn–Ag–Cu solders on the formation and growth of intermetallic compound layers. J. Alloys Compd. 2017, 702, 669–678. [Google Scholar] [CrossRef]
  6. Xu, S.; Habib, A.H.; Pickel, A.D.; McHenry, M.E. Magnetic nanoparticle-based solder composites for electronic packaging applications. Prog. Mater. Sci. 2015, 67, 95–160. [Google Scholar] [CrossRef]
  7. Sayyadi, R.; Naffakh-Moosavy, H. The Role of Intermetallic Compounds in Controlling the Microstructural, Physical and Mechanical Properties of Cu-[Sn-Ag-Cu-Bi]-Cu Solder Joints. Sci. Rep. 2019, 9, 1–20. [Google Scholar] [CrossRef] [PubMed] [Green Version]
  8. El-Daly, A.; Al-Ganainy, G.; Fawzy, A.; Younis, M. Structural characterization and creep resistance of nano-silicon carbide reinforced Sn–1.0Ag–0.5Cu lead-free solder alloy. Mater. Des. 2014, 55, 837–845. [Google Scholar] [CrossRef]
  9. Sun, L.; Zhang, L.; Xu, L.; Zhong, S.-J.; Ma, J.; Bao, L. Effect of nano-Al addition on properties and microstructure of low-Ag content Sn–1Ag–0.5Cu solders. J. Mater. Sci. Mater. Electron. 2016, 27, 7665–7673. [Google Scholar] [CrossRef]
  10. Spinelli, J.E.; Garcia, A. Development of solidification microstructure and tensile mechanical properties of Sn-0.7Cu and Sn-0.7Cu-2.0Ag solders. J. Mater. Sci. Mater. Electron. 2014, 25, 478–486. [Google Scholar] [CrossRef]
  11. Cheng, F.; Gao, F.; Zhang, J.; Jin, W.; Xiao, X. Tensile properties and wettability of SAC0307 and SAC105 low Ag lead-free solder alloys. J. Mater. Sci. 2011, 46, 3424–3429. [Google Scholar] [CrossRef]
  12. Ali, B.; Sabri, M.F.M.; Jauhari, I. Microstructural behavior of iron and bismuth added Sn-1Ag-Cu solder under elevated temperature aging. In Proceedings of the 2nd International Conference on Functional Materials and Metallurgy (ICOFM 2016), Penang, Malaysia, 28 May 2016. [Google Scholar]
  13. Wang, Y.; Lin, Y.; Tu, C.; Kao, C. Effects of minor Fe, Co, and Ni additions on the reaction between SnAgCu solder and Cu. J. Alloys Compd. 2009, 478, 121–127. [Google Scholar] [CrossRef]
  14. Cheng, S.; Huang, C.-M.; Pecht, M. A review of lead-free solders for electronics applications. Microelectron. Reliab. 2017, 75, 77–95. [Google Scholar] [CrossRef]
  15. Shnawah, D.A.; Said, S.B.M.; Sabri, M.F.M.; Badruddin, I.A.; Che, F.X. High-Reliability Low-Ag-Content Sn-Ag-Cu Solder Joints for Electronics Applications. J. Electron. Mater. 2012, 41, 2631–2658. [Google Scholar] [CrossRef]
  16. Shnawah, D.A.-A.; Said, S.B.M.; Sabri, M.F.M.; Badruddin, I.A.; Che, F.X. Microstructure, mechanical, and thermal properties of the Sn–1Ag–0.5Cu solder alloy bearing Fe for electronics applications. Mater. Sci. Eng. A 2012, 551, 160–168. [Google Scholar] [CrossRef]
  17. Zhao, J.; Qi, L.; Wang, X.-M.; Wang, L. Influence of Bi on microstructures evolution and mechanical properties in Sn–Ag–Cu lead-free solder. J. Alloys Compd. 2004, 375, 196–201. [Google Scholar] [CrossRef]
  18. Chuang, C.; Tsao, L.; Lin, H.; Feng, L. Effects of small amount of active Ti element additions on microstructure and property of Sn3.5Ag0.5Cu solder. Mater. Sci. Eng. A 2012, 558, 478–484. [Google Scholar] [CrossRef]
  19. Mahdavifard, M.; Sabri, M.; Shnawah, D.; Said, S.; Badruddin, I.; Rozali, S. The effect of iron and bismuth addition on the microstructural, mechanical, and thermal properties of Sn–1Ag–0.5Cu solder alloy. Microelectron. Reliab. 2015, 55, 1886–1890. [Google Scholar] [CrossRef]
  20. Cheng, H.-K.; Huang, C.-W.; Lee, H.; Wang, Y.-L.; Liu, T.-F.; Chen, C.-M. Interfacial reactions between Cu and SnAgCu solder doped with minor Ni. J. Alloys Compd. 2015, 622, 529–534. [Google Scholar] [CrossRef]
  21. Song, H.Y.; Zhu, Q.S.; Wang, Z.G.; Shang, J.K.; Lu, M. Effects of Zn addition on microstructure and tensile properties of Sn–1Ag–0.5Cu alloy. Mater. Sci. Eng. A 2010, 527, 1343–1350. [Google Scholar] [CrossRef]
  22. Kanlayasiri, K.; Mongkolwongrojn, M.; Ariga, T. Influence of indium addition on characteristics of Sn–0.3Ag–0.7Cu solder alloy. J. Alloys Compd. 2009, 485, 225–230. [Google Scholar] [CrossRef]
  23. Yassin, A.M.; Zahran, H.Y.; El-Rehim, A.F.A. Effect of TiO2 Nanoparticles Addition on the Thermal, Microstructural and Room-Temperature Creep Behavior of Sn-Zn Based Solder. J. Electron. Mater. 2018, 47, 6984–6994. [Google Scholar] [CrossRef]
  24. Wollgramm, P.; Burger, D.; Parsa, A.B.; Neuking, K.; Eggeler, G. The effect of stress, temperature and loading direction on the creep behaviour of Ni-base single crystal superalloy miniature tensile specimens. Mater. High Temp. 2016, 33, 346–360. [Google Scholar] [CrossRef]
  25. Wilshire, B.; Whittaker, M.T. Grain boundaries: Their influence on creep strain accumulation. Mater. Sci. Technol. 2010, 26, 793–796. [Google Scholar] [CrossRef]
  26. El-Rehim, A.F.A.; Zahran, H.Y. Effect of aging treatment on microstructure and creep behaviour of Sn–Ag and Sn–Ag–Bi solder alloys. Mater. Sci. Technol. 2013, 30, 434–438. [Google Scholar] [CrossRef]
  27. Abd El-Rehim, A.F. Effect of grain size on the primary and secondary creep behaviour of Sn–3 wt.% Bi alloy. J. Mater. Sci. 2008, 43, 1444–1450. [Google Scholar] [CrossRef]
  28. Sona, M.; Prabhu, K.N. Review on microstructure evolution in Sn–Ag–Cu solders and its effect on mechanical integrity of solder joints. J. Mater. Sci. Mater. Electron. 2013, 24, 3149–3169. [Google Scholar] [CrossRef]
  29. Ma, H.; Suhling, J.C. A review of mechanical properties of lead-free solders for electronic packaging. J. Mater. Sci. 2009, 44, 1141–1158. [Google Scholar] [CrossRef]
  30. Abd El-Rehim, A.F.; Zahran, H.Y.; AlFaify, S. The mechanical and microstructural changes of Sn-Ag-Bi solders with cooling rate and Bi content variations. J. Mater. Eng. Perform. 2018, 27, 344–352. [Google Scholar] [CrossRef]
  31. El-Daly, A.A.; Fawzy, A.; Mansour, S.F.; Younis, M.J. Novel SiC nanoparticles-containing Sn–1.0 Ag–0.5 Cu solder with good drop impact performance. Mater. Sci. Eng. A 2013, 578, 62–71. [Google Scholar] [CrossRef]
  32. Ganesan, S.; Pecht, M. Lead-Free Electronics; Wiley-Interscience Publication: New York, NY, USA, 2006. [Google Scholar]
  33. Huang, M.L.; Wang, L. Effects of Cu, Bi, and In on microstructure and tensile properties of Sn-Ag-X(Cu, Bi, In) solders. Met. Mater. Trans. A 2005, 36, 1439–1446. [Google Scholar] [CrossRef]
  34. Seo, S.-K.; Kang, S.K.; Shih, D.-Y.; Lee, H.M. The evolution of microstructure and microhardness of Sn–Ag and Sn–Cu solders during high temperature aging. Microelectron. Reliab. 2009, 49, 288–295. [Google Scholar] [CrossRef]
  35. Fix, A.R.; Nüchter, W.; Wilde, J. Microstructural changes of lead-free solder joints during long-term ageing, thermal cycling and vibration fatigue. Solder. Surf. Mt. Technol. 2008, 20, 13–21. [Google Scholar] [CrossRef]
  36. Dieter, G.E. Mechanical Metallurgy, 3rd ed.; McGraw-Hill: New York, NY, USA, 1986. [Google Scholar]
  37. El-Rehim, A.F.A.; Zahran, H.Y.; Yassin, A.M. Microstructure evolution and tensile creep behavior of Sn–0.7Cu lead-free solder reinforced with ZnO nanoparticles. J. Mater. Sci. Mater. Electron. 2018, 30, 2213–2223. [Google Scholar] [CrossRef]
  38. Wu, J.; Fu, N.; Ahmed, S.; Suhling, J.C.; Lall, P. Investigation of Microstructural Evolution in SAC Solders Exposed to Short-Term and Long-Term Aging. In Proceedings of the 2018 17th IEEE Intersociety Conference on Thermal and Thermomechanical Phenomena in Electronic Systems (ITherm), San Diego, CA, USA, 29 May–1 June 2018. [Google Scholar]
  39. El-Daly, A.; El-Hosainy, H.; Elmosalami, T.; Desoky, W. Microstructural modifications and properties of low-Ag-content Sn–Ag–Cu solder joints induced by Zn alloying. J. Alloys Compd. 2015, 653, 402–410. [Google Scholar] [CrossRef]
  40. Han, Y.; Jing, H.; Nai, S.; Xu, L.; Tan, C.; Wei, J. Temperature Dependence of Creep and Hardness of Sn-Ag-Cu Lead-Free Solder. J. Electron. Mater. 2010, 39, 223–229. [Google Scholar] [CrossRef]
  41. El-Rehim, A.F.A.; Mahmoud, M.A. Transient and steady state creep of age-hardenable Al–5 wt% Mg alloy during superimposed torsional oscillations. J. Mater. Sci. 2012, 48, 2659–2669. [Google Scholar] [CrossRef]
  42. Ibrahiem, A.; El-Daly, A. Investigation on multi-temperature short-term stress and creep relaxation of Sn-Ag-Cu-In solder alloys under the effect of rotating magnetic field. Microelectron. Reliab. 2019, 98, 10–18. [Google Scholar] [CrossRef]
  43. Witkin, D. Creep Behavior of Bi-Containing Lead-Free Solder Alloys. J. Electron. Mater. 2012, 41, 190–203. [Google Scholar] [CrossRef]
  44. Olofinjana, A.; Haque, R.; Mathir, M.; Voo, N. Studies of the solidification characteristics in Sn-Ag-Cu-Bi solder alloys. Procedia Manuf. 2019, 30, 596–603. [Google Scholar] [CrossRef]
  45. Kim, K.S.; Huh, S.H.; Suganuma, K. Effects of intermetallic compounds on properties of Sn–Ag–Cu lead-free soldered joints. J. Alloys Compd. 2003, 352, 226–236. [Google Scholar] [CrossRef]
  46. Sayyadi, R.; Naffakh-Moosavy, H. Physical and mechanical properties of synthesized low Ag/lead-free Sn-Ag- Cu-xBi (x=0, 1, 2.5, 5wt%) solders. Mater. Sci. Eng. A 2018, 735, 367–377. [Google Scholar] [CrossRef]
  47. Al-Ezzi, A.; Al-Bawee, A.; Dawood, F.; Shehab, A.A. Effect of Bismuth Addition on Physical Properties of Sn-Zn Lead-Free Solder Alloy. J. Electron. Mater. 2019, 48, 8089–8095. [Google Scholar] [CrossRef]
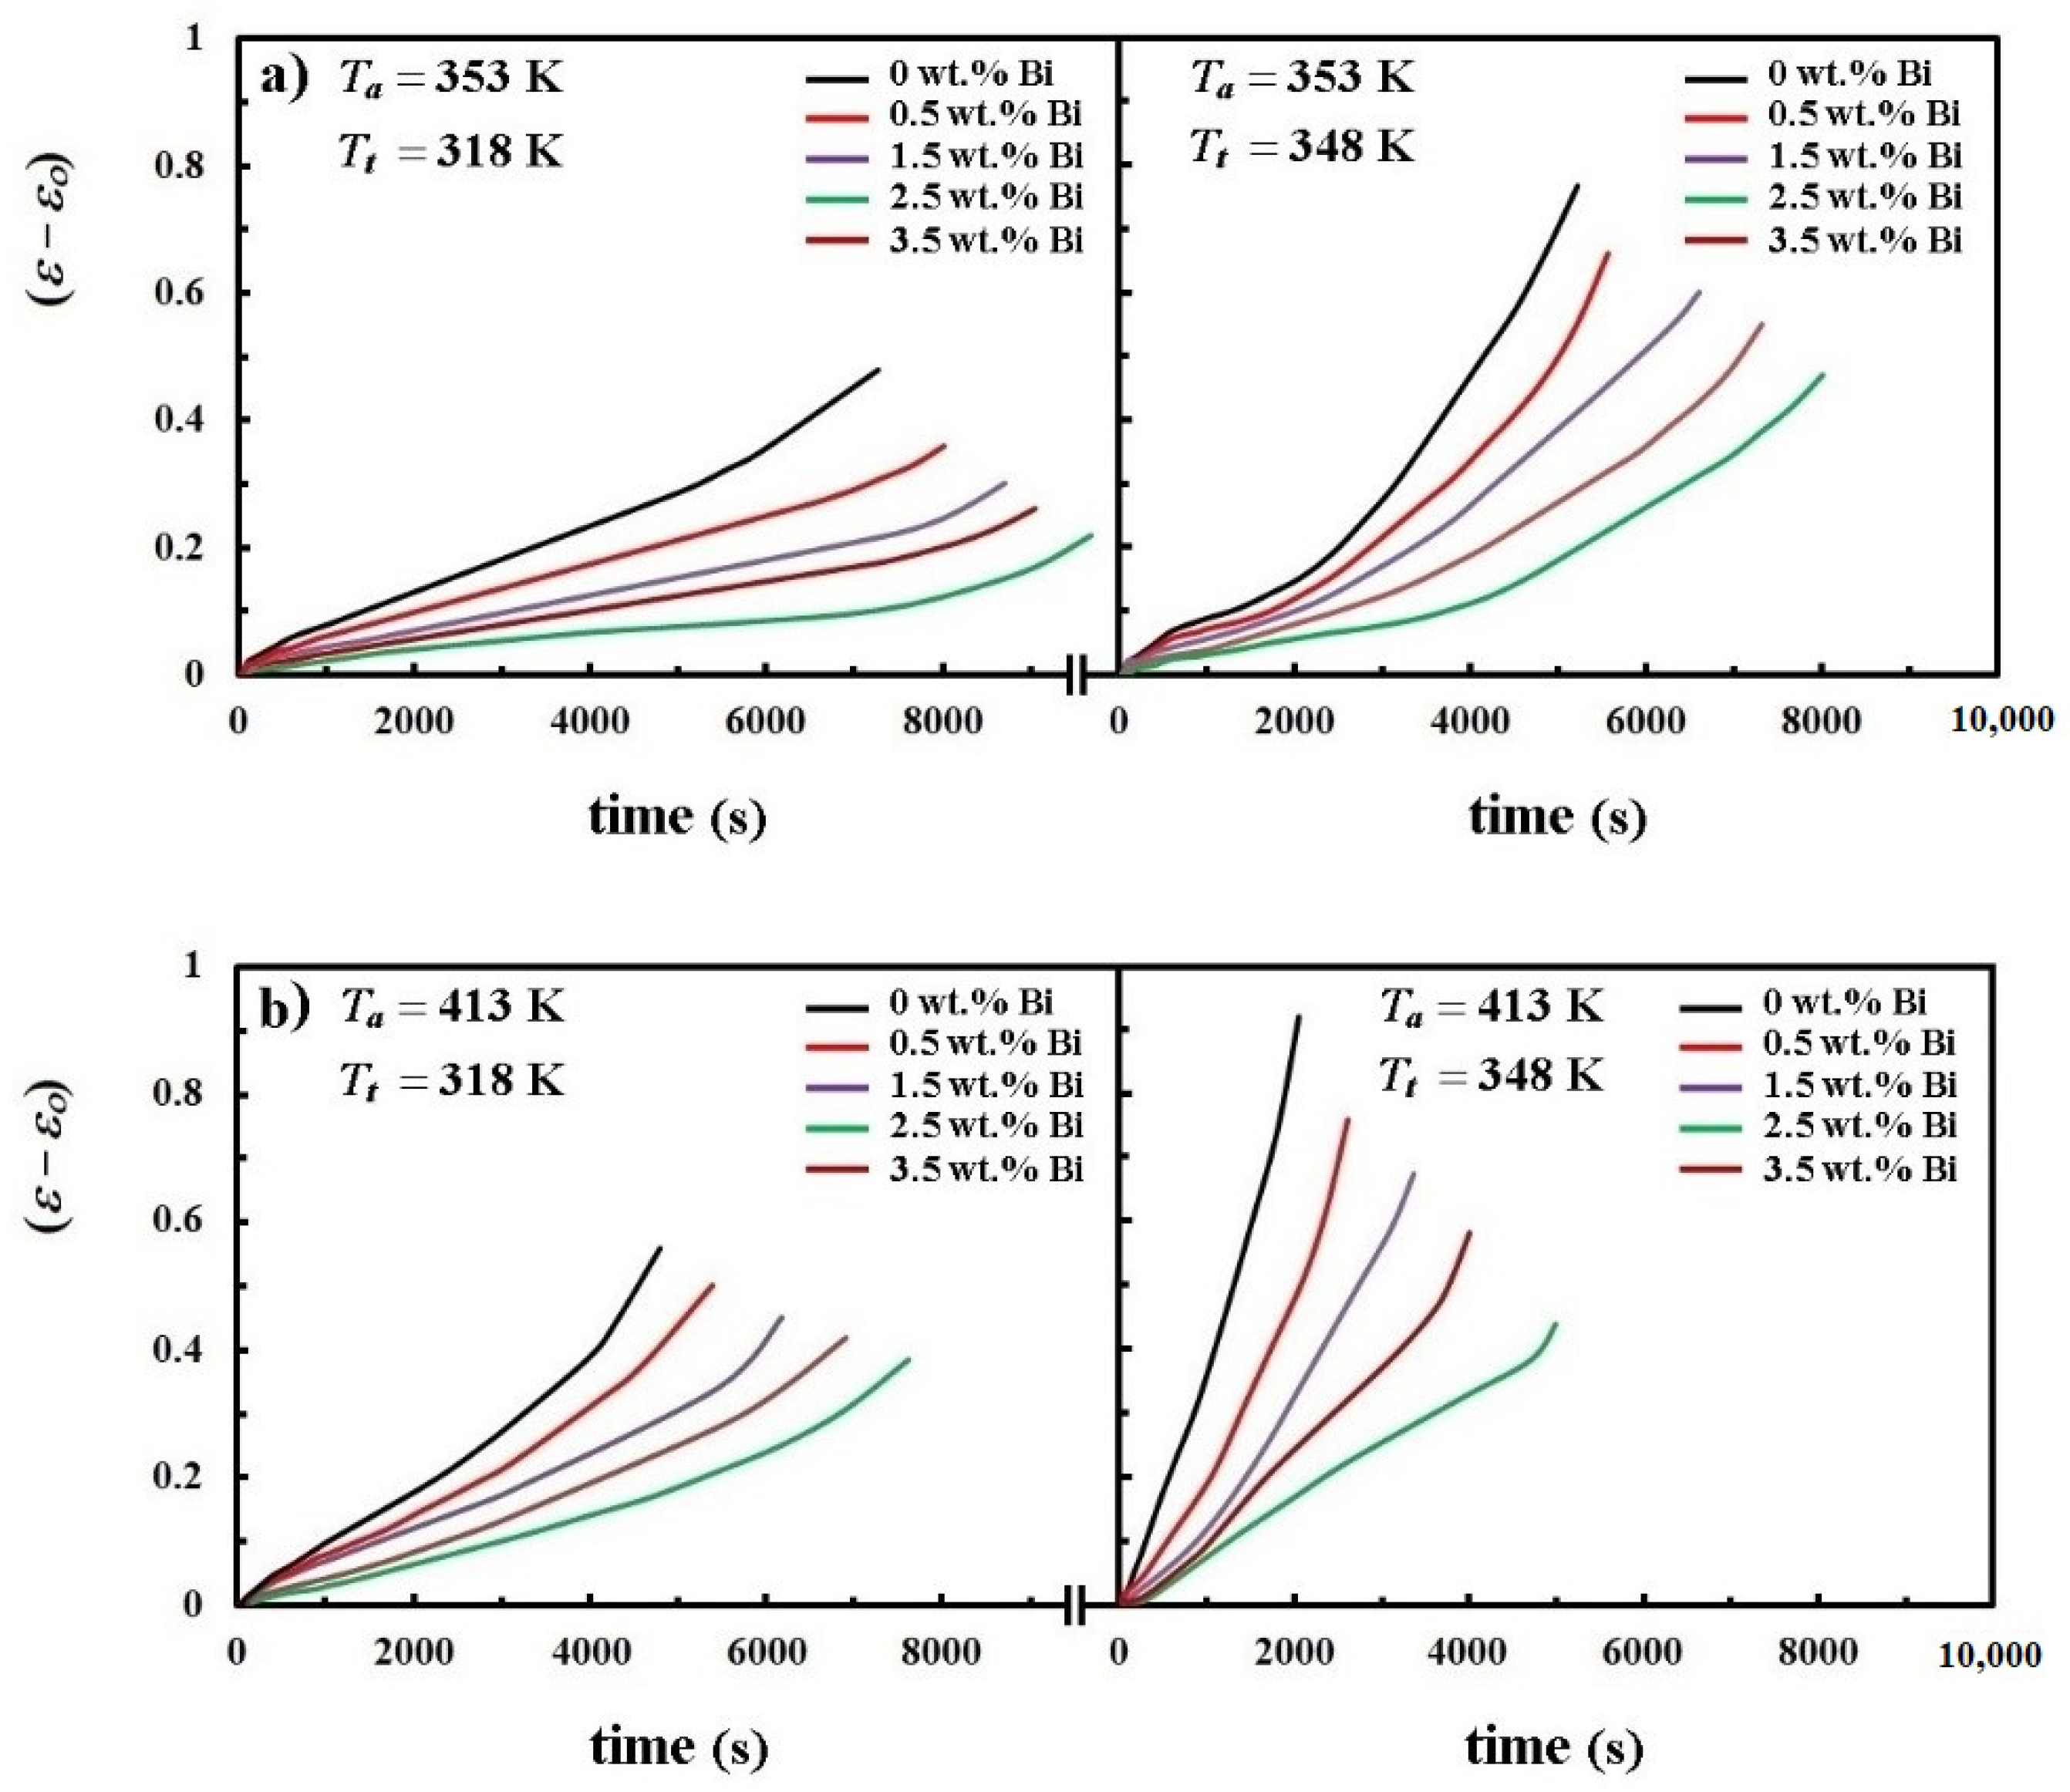
Figure 1. Representative creep curves for all investigated solders aged at (a) 353 K, and (b) 413 K for 120 min. Testing temperatures, Tt, are indicated. εo is the instantaneous creep at time = 0.
Crystals 11 00314 g001
Figure 2. Dependence of steady state creep rate, έst, on Bi content at different aging temperatures, Ta. Testing temperatures, Tt, applied are (a) 318, (b) 328, (c) 338, and (d) 348 K.
Crystals 11 00314 g002
Figure 3. Sn-Ag binary phase diagram (http://www.metallurgy.nist.gov/phase/solder/solder.html (accessed 22 March 2021)). Copyright 2011, with permission from Elsevier.
Crystals 11 00314 g003
Figure 4. Sn-Cu binary phase diagram (http://www.metallurgy.nist.gov/phase/solder/solder.html (accessed 22 March 2021)). Copyright 2011, with permission from Elsevier.
Crystals 11 00314 g004
Figure 5. Ag-Cu binary phase diagram (http://www.metallurgy.nist.gov/phase/solder/solder.html (accessed 22 March 2021)). Copyright 2011, with permission from Elsevier.
Crystals 11 00314 g005
Figure 6. SEM image and corresponding EDS spectra of the SAC105 solder aged at 353 K (a) Ag3Sn phase, (b) magnified view showing morphology the Ag3Sn phase, (c) Cu6Sn5 phase, and (d) β-Sn phase.
Crystals 11 00314 g006
Figure 7. Representative SEM micrographs of the SAC105-Bi solders aged at 353 K (a) SAC105, (b) SAC105-0.5Bi, (c) SAC105-1.5Bi, (d) SAC105-2.5Bi, and (e) SAC105-3.5Bi solders.
Crystals 11 00314 g007
Figure 8. Representative SEM micrograph of SAC105-3.5Bi solder aged at 353 K: (a) enlarged SEM of Bi particles, and (b) EDS spectra of Bi particles.
Crystals 11 00314 g008
Figure 9. Representative SEM micrographs of the SAC105-Bi solders aged at 413 K (a) SAC105, (b) SAC105-0.5Bi, (c) SAC105-1.5Bi, (d) SAC105-2.5Bi, and (e) SAC105-3.5Bi solders.
Crystals 11 00314 g009
Figure 10. Dependence of steady state creep rate, έst, on testing temperatures, Tt, for different Bi contents. Aging temperatures, Ta, applied are (a) 353, (b) 373, (c) 393, and (d) 413 K.
Crystals 11 00314 g010
Figure 11. Relation between ln έst and 103/Tt for different Bi contents. Aging temperatures, Ta, applied are (a) 353, (b) 373, (c) 393, and (d) 413 K.
Crystals 11 00314 g011
Figure 12. Representative XRD patterns of the investigated solder alloys aged at: (a) 353 K and (b) 413 K.
Crystals 11 00314 g012
Table 1. Chemical composition of the experimental SAC105-xBi solders verified by means of inductively coupled plasma atomic emission spectroscopy (ICP-AES), wt.%.
SolderElement Content
AgCuBiSn
SAC1050.970.480balance
SAC105-0.5Bi0.940.460.49balance
SAC105-1.5Bi0.930.431.45balance
SAC105-2.5Bi0.880.402.42balance
SAC105-3.5Bi0.850.393.40balance
Table 2. The calculated crystalline lattice parameters a, c, c/a ratio, and the unit cell volume V for β-Sn matrix at different aging temperatures and various bismuth concentrations.
Lattice ParameterAging Temperature (K)SAC105Error %SAC105-0.5BiError %SAC105-1.5BiError %SAC105-2.5BiError %SAC105-3.5BiError %
a (Å)3535.91531.445.931.6975.8220.1395.82350.1275.8800.840
3735.84530.2465.830.0175.8150.2575.75761.2585.8670.618
3935.85790.4625.89441.0885.7760.9285.7760.9435.8410.171
4135.86920.6555.77960.885.7301.7165.8000.5305.8500.337
c (Å)3533.23551.6823.16460.5453.0673.5973.16890.4093.1600.691
3733.19840.5163.18530.1043.1281.6853.19180.3093.0992.599
3933.20580.7483.08183.1463.1840.0803.25222.2063.1361.431
4133.19090.2803.15060.9863.1800.0423.21290.9733.1261.734
c/a3530.54690.2330.53362.2050.5263.4620.54410.2810.5371.518
3730.54710.2700.54630.1220.5371.4300.55431.5880.5283.198
3930.54720.2850.52284.1880.5511.0180.56303.1800.5361.599
4130.54360.3720.54510.1060.5551.7040.55391.5120.5342.065
V (Å)3353113.214.645111.282.860104.0063.866107.4720.662109.2560.986
373109.281.013108.260.070105.8182.191105.812.197106.6851.389
393110.011.683107.071.026106.2751.768108.500.288107.0071.092
413109.911.599105.242.721104.4633.443108.0870.093107.0321.069
Publisher’s Note: MDPI stays neutral with regard to jurisdictional claims in published maps and institutional affiliations.