Review

Structures of Impurity Defects in Lithium Niobate and Tantalate Derived from Electron Paramagnetic and Electron Nuclear Double Resonance Data

by
Valentin G. Grachev
* and
Galina I. Malovichko
*
Physics Department, Montana State University, Bozeman, MT 59717, USA
*
Authors to whom correspondence should be addressed.
Crystals 2021, 11(4), 339; https://doi.org/10.3390/cryst11040339
Submission received: 28 February 2021 / Revised: 22 March 2021 / Accepted: 23 March 2021 / Published: 27 March 2021
(This article belongs to the Special Issue New Trends in Lithium Niobate: From Bulk to Nanocrystals)

Abstract

:
Point intrinsic and extrinsic defects, especially paramagnetic ions of transition metals and rare-earth elements, have essential influence on properties of lithium niobate, LN and tantalate, LT, and often determine their suitability for numerous applications. Discussions about structures of the defects in LN/LT have lasted for decades. Many experimental methods facilitate progress in determining the structures of impurity centers. This paper gives current bird’s eye view on contributions of Electron Paramagnetic Resonance (EPR), and Electron Nuclear Double Resonance (ENDOR) studies to the determination of impurity defect structures in LN and LT crystals for a broad audience of researchers and students. Symmetry and charge compensation considerations restrict a number of possible structures. Comparison of measured angular dependences of ENDOR frequencies with calculated ones for Li and Nb substitution using dipole–dipole approximation allows unambiguously to determine the exact location of paramagnetic impurities. Models with two lithium vacancies explain angular dependencies of EPR spectra for Me3+ ions substituting for Li+ like Cr, Er, Fe, Gd, Nd, and Yb. Self-compensation of excessive charges through equalization of concentrations of Me3+(Li+) and Me3+(Nb5+) and appearance of interstitial Li+ in the structural vacancy near Me3+(Nb5+) take place in stoichiometric LN/LT due to lack of intrinsic defects.

1. Introduction

Point intrinsic and extrinsic defects, especially paramagnetic ions of transition metals and rare-earth elements, belong to the most important defects in lithium niobate (LN, LiNbO3) and tantalate (LT, LiTaO3), because of their essential influence on properties of this material, such as domain structure, electro-optical coefficients, light absorption, refractive indices, birth and evolution of wave-front dislocations ([1,2] and references there), and their consequences for present and potential applications [3,4,5,6,7]. A lot of effort was spent to establish a correlation between the observable data and the crystal composition, and to develop experimentally supported models of the defects: ion charges, identities, and position of the ions in the lattice, their nearest surroundings, ways of charge compensation and recharge mechanisms. Discussions about structures of intrinsic and extrinsic defects in LN/LT have lasted for decades [1]. With time, the proposed structures were evolved and detailed. Some early models were rejected. For instance, after a supposition that effective net charges are about 2.0+ [8], or 1.59+ for Nb and 1.21+ for Ta [9], it was natural to assume that divalent and trivalent impurities should preferably substitute for Nb, but not for Li. Later, numerous investigations have shown that the real picture is more complicated and richer.
In the course of the investigation of defect structures in LN/LT the following difficulties take place:
  • high quality conventional samples with crystal composition xC are usually grown from the congruent melt with the composition xm ≈ 48.4%, for LN and xm ≈ 48.7% for LT (x = [Li]/([Li] + [Nb/Ta]); this means that the congruent crystals with xm = xC contain many intrinsic (non-stoichiometric) defects, causing a broadening of the observable spectral lines and ambiguities in their interpretation;
  • the crystal composition xC of the undoped samples depends on both melt composition and growth conditions;
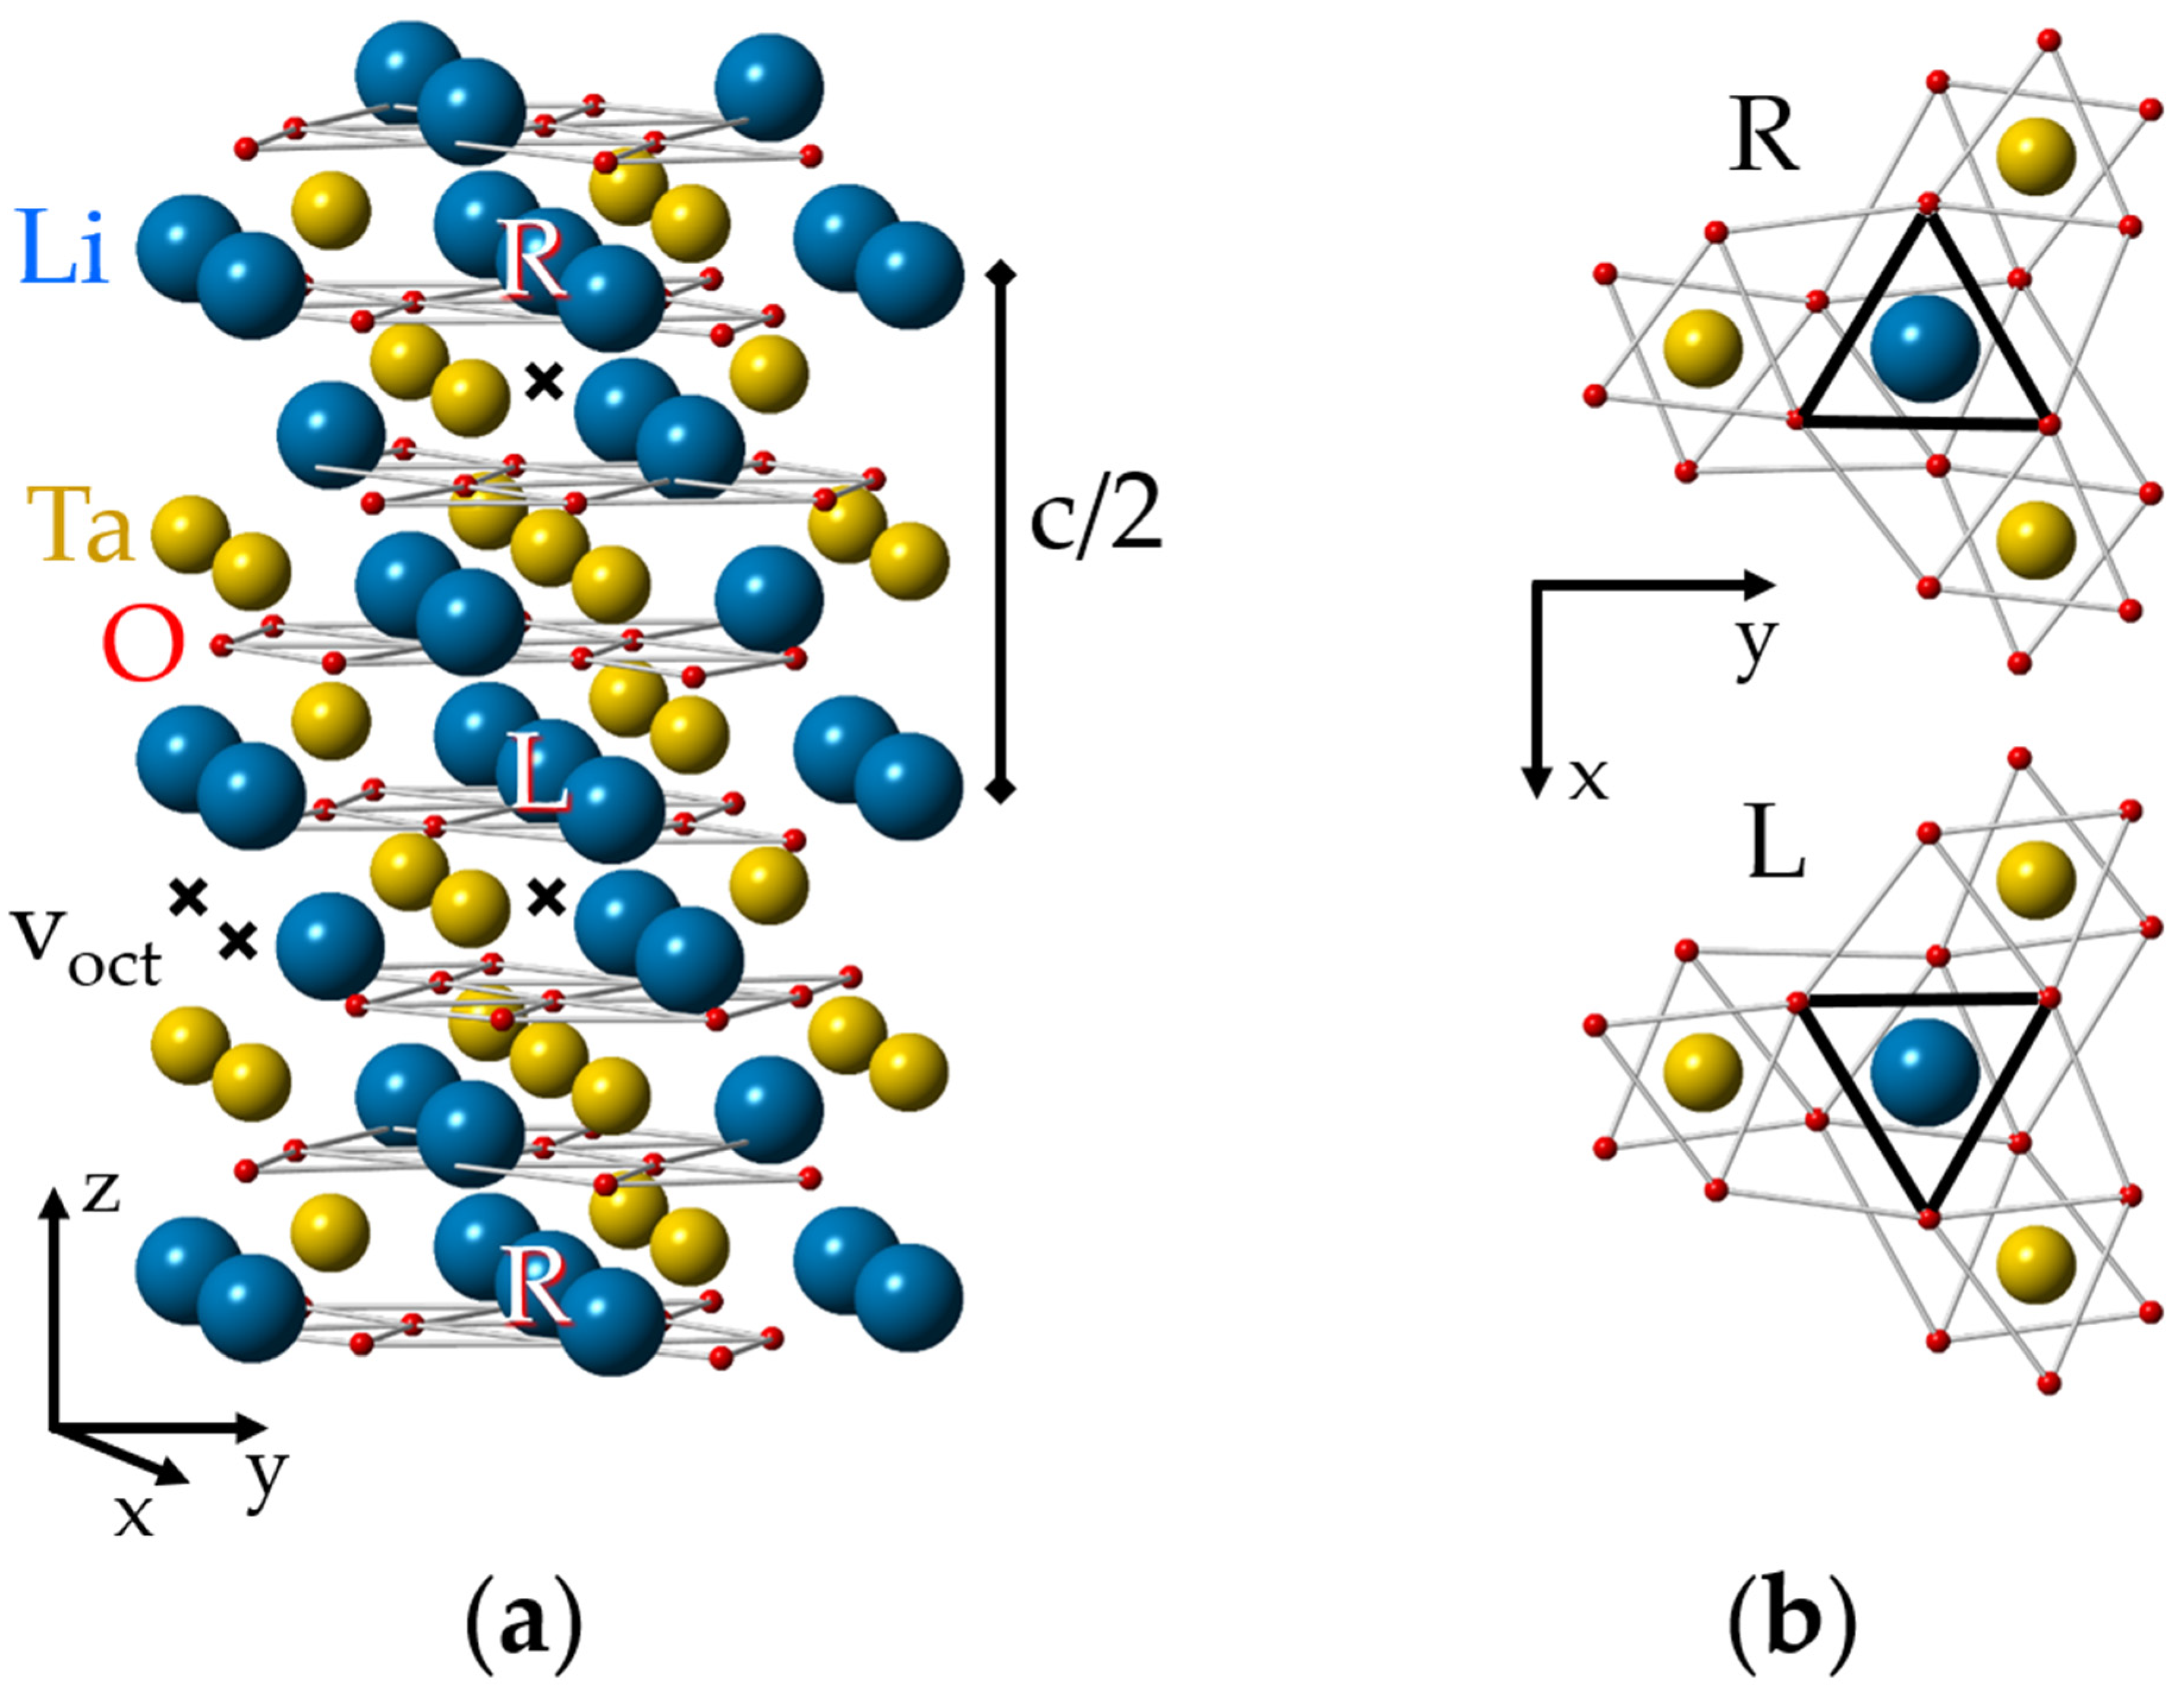
  • the most probable positions for impurity incorporation, the Li and Nb sites as well as the octahedral structural vacancy, have the same local symmetry C3; this means that they are not distinguishable by many spectroscopic techniques.
Techniques for the defect study can be conditionally divided into two groups: direct (Mössbauer spectroscopy [10], Rutherford Backscattering Spectrometry (RBS) [11], Extended X-ray Absorption Fine Structure Analysis (EXAFS), Particle Induced X-ray Emission (PIXE) combined with channeling, X-ray standing wave (XSW) [12], Electron Paramagnetic Resonance (EPR), and Electron Nuclear Double Resonance (ENDOR) [13]) and indirect (optical absorption and luminescence, measurements of electro-optical coefficients, etc.).
Attempts to determine impurity positions by indirect methods often gave contradicting information. Direct methods also have some shortcomings. For instance,
  • Mössbauer spectroscopy demands the presence of special nuclei,
  • channeling investigations are more successful in the case of heavy, many-electron ions,
  • channeling methods are not sensitive to the charge state of the impurity and do not distinguish centers with C3 and C1 symmetry,
  • due to the relatively low sensitivity the EXAFS needs high levels of crystal dopants (about 3–5 mol.%), for which clustering and occupation of both Li and Nb positions become very probable,
  • EPR/ENDOR techniques are applicable to systems with non-zero spins only.
Investigations of impurity defects were carried out by all direct and indirect techniques in parallel and together, and made invaluable contributions to the problem solution. Let’s mention briefly a few of them. The positions of many impurity ions were determined by the EXAFS, PIXE, XSW, and channeling methods. Lithium substitution was found for most elements including Sc, Ti, Mn, Ni, In, Pr, Gd, Ho, Er, Tm, Yb, Lu ([11,14,15,16,17,18], and references there), Nd [19,20], Co, Fe [21,22,23,24,25,26,27,28]. A few ions substitute for Nb in LN (Hf [29], Er [30]) and in LN heavily co-doped by Mg or Zn (Sc, In, Nd, Lu [31]). Some of the ions can occupy both positions (Cr [32], Gd, Nd). Mössbauer spectroscopy [33,34] gave indirect evidence of Fe2+ and Fe3+ substitution for Li+. Raman spectroscopy data [35] were interpreted on the base of Fe substitution for Li. Magneto-optical and luminescence studies [36,37] identified non-paramagnetic pairs CrLi-CrNb and established a correlation between optical bands and Cr3+ positions.
Convincing arguments of Fe3+ substitution for Li+ were obtained by ENDOR [38,39,40]: it was shown that spectrum angular dependencies calculated on the base of dipole-dipole interactions of Fe3+ electrons with surrounding Li nuclei are qualitatively different for Li and Nb substitution; quantitative agreement calculated and experimental data was achieved for Li substitution.
The huge amount of nonstoichiometric intrinsic defects in congruent LN/LT grown by the conventional Czochralski method [41,42] (we shall call them cLN and cLT) has often undesirable effects on crystal properties. Several techniques were invented in order to reduce the concentration of these defects. Some decrease of their concentration was achieved by using melts with Li excess (with xm up to 60%) [43,44]. Thin LN/LT samples were enriched with Li by vapor transport equilibrium treatment (VTE [45,46,47,48,49,50], we shall call them vLN and vLT). Using double crucible growth [51,52,53,54,55] with excess of Li allowed one to obtain nearly stoichiometric samples (nsLN). Crystals grown by the Czochralski method from a melt to which potassium oxide K2O has been added ([56,57,58,59,60,61,62,63,64,65,66,67], and references there) have composition xC ≈ 50% (LNK, stoichiometric LN, sLN). The method is scientifically called the High Temperature Top Seeded Solution Growth (HTTSSG).
The defect elimination in sLN crystals has led to a tremendous narrowing of the resonance lines and a corresponding increase of spectral resolution, and resulted in improved precision of obtained spectroscopic characteristics. Discovery of new centers substituting for Nb (or Ta in LiTaO3) and a change of charge compensation mechanism in sLN was accompanied by a significant progress in understanding the nature and structures of intrinsic and extrinsic defects [68,69,70,71,72,73,74,75,76]. Several methods of determination of real crystal composition were developed [68,77,78,79,80]. It should be mentioned that even crystals with xC = 50% are not completely free of intrinsic defects. There is a class of intrinsic defects which break the regular order of the LN lattice without a change of xC: the permutations NbLi and LiNb, and cyclical permutation of Nb in Li site, Li in structural vacancy, and vacancy of Nb. Such defects can cause broadening of spectral lines.
EPR is resonance absorption of microwave quanta by electron spins placed in a swept external magnetic field at definite value of magnetic field Bres. Depending on measurement conditions it has usual sensitivity about 1012–1015 spins/cm3 or higher. Equipment with wave lengths 3cm (X-band, microwave frequency ν ≈ 9.5 GHz) and 8 mm (Q-band, ν ≈ 34 GHz) are usually used. EPR lines have typical widths about 1–100 MHz. This defines the resolution ability of the EPR.
Nuclear magnetic resonance (NMR) is resonance absorption of radiofrequency quanta by nuclear spins. It has worse sensitivity due to thousand time smaller magnetic moments of nuclei. However, NMR has significantly higher resolution ability about 1–100 KHz or less. Only nuclei with large natural abundance of magnetic isotopes (like 7Li—92.5%, 93Nb—100%, 181Ta—99.99%) can be studied by NMR. Due to interactions with electron spins, nuclei in the impurity neighborhood have energy levels and resonance frequencies different from those of bulk nuclei. As their concentrations, which are about impurity concentration, are significantly smaller than concentrations of bulk nuclei, their NMR signals are too weak to be registered directly.
ENDOR is the indirect way to register NMR of nuclei in impurity surrounding via a stimulated change of intensity of the EPR signal in magnetic field Bres. ENDOR has sensitivity that is worse than EPR (about one-two orders of magnitude), but is better than NMR. Its resolution is comparable with NMR resolution. Characteristics of all nuclei (natural abundance of isotopes, their nuclear spins, magnetic and quadrupole moments) are well known and tabulated. This allows to relate observed ENDOR frequencies to interactions of impurity electrons with own nucleus and surrounding nuclei.
For a paramagnetic impurity these techniques are capable of determining: its element, charge, spin state, nearest surrounding (i.e., its location), and many spectroscopic characteristics. Fortunately, most impurities which are useful for optoelectronic application (including transition and rare-earth elements) enter LN and LT in a paramagnetic state. Li, Nb and Ta nuclei have significant (93–100%) natural abundance of magnetic isotopes. The main isotope 16O has no magnetic moment and is invisible in EPR/ENDOR/NMR experiments.
The aim of this paper is to give current bird’s eye view on contributions of EPR/ENDOR studies to the determination of impurity defect structures in LN and LT crystals for a broad audience of researchers and students. The name “center” will be used for a complex consisting of the paramagnetic impurity and its surrounding that can have zero, one or more defects besides regular ions.

2. Materials and Methods

Most of our measurements presented below were carried out on samples grown by E.P.Kokanyan from Li-rich melt or from the melt with the addition of K2O [56,57].
The EPR/ENDOR spectra were measured at microwave frequencies v ≈ 9.4 GHz (X-band) and v ≈ 34.4 GHz (Q-band) on the Bruker ELEXSYS EPR/ENDOR spectrometer at temperatures between 4.2 and 300 K at Montana State University (Bozeman, MT, USA).
The treatment and simulation of all spectra and their angular dependencies, as well as the preparation of corresponding figures were carried out with the help of the “Visual EPR” and “Visual ENDOR” program packages [81].
All lattice images were generated using CrystalMaker® program [82] and crystallographic data [83,84,85,86]. Sizes of oxygen balls were artificially reduced, since nonmagnetic O2− ions are invisible for EPR/ENDOR. As LiNbO3 and LiTaO3 are isostructural crystals, all figures with lattice and structures of impurity centers are equally applicable to both LN and LT. However, dipole-dipole interactions should be calculated taking into account a difference of their lattice constants.

3. Basics of EPR and ENDOR Spectra Interpretation

3.1. Symmetry Considerations

The ideal lattice of LN and LT crystals (Figure 1, see also [87]) has two molecules in its rhombohedral elementary unit cell and the space group symmetry is R3c (C3v6, 3m) at room temperature [8,88,89,90]. If ionic radii are taken into account, the LT/LN lattices look like consisting mainly of planar layers of closely packed oxygen ions with small voids between them, filled by Li and Nb/Ta. There are several electrically non-equivalent positions in the lattice. Some of them—the sites on the z (or optical c) axis of the crystal, including the sites of Li, Nb/Ta and the octahedral structural void (vacancy), voct—have the symmetry of the point group C3. An isolated defect in any of these positions creates a C3 (in the following also labeled “axial”) center. The tetrahedral structural void, oxygen sites and all other off axis positions have the lowest possible symmetry, C1.
A complex of two defects has C3 symmetry, if both are located on the crystal z axis, and C1 symmetry in all other cases. If the difference in positions of the nearest oxygen ions is ignored, then each unit cell has the following site sequence along the z-axis: Li, Ta, voct, Li, Ta, voct. However, oxygen octahedrons and next neighbors for two positions of one type cation are not identical, therefore, the correct assignment of the sequence should be LiL, TaL, voct,L, LiR, TaR, voct,R. The surrounding of the “Right” (R) position can be transformed to the “Left” (L) one by a reflection x ⇔ −x and a shift by c/2, because zy is a glide mirror plane in the R3c lattice (Figure 1b). The same consideration is applicable to C1 positions also. This means that each axial (C3) or low-symmetry (C1) L center has a corresponding R partner. The L and R partners are electrically identical and are not distinguishable by optical or channeling methods, but they are magnetically non-equivalent and can be resolved from each other in favorable cases (high spin value, small line width) by magnetic resonance techniques.
Each C1 center in the R3c lattice has two additional magnetically nonequivalent partners, which can be transformed into each other by a rotation around the z-axis of the crystal by 120° and 240°. They can be distinguished by the EPR at arbitrary orientations of the magnetic field.
As any crystal characteristic, the EPR spectra must reflect the crystal symmetry and symmetry of all present paramagnetic centers. The best way to determine the defect symmetry is to study angular dependence of the spectra in external magnetic field B under rotation of the crystal sample around z-axis (shortly speaking, in xy plane). For a C3 paramagnetic defect with electron spin S = 1/2 the EPR spectrum consists of one resonance at the same position Bres at any orientation of B with respect to crystallographic axes. A set of up to six lines can be observed at arbitrary orientation of B for C1 centers; however, some of them coincide for directions of B along x, y, or z. If two or more centers present in the sample studied, the spectrum has two or more sets of the lines. If a center has electron spin S > 1/2 multiplets of 2S lines can be observed for every center.
For centers with S = 1/2 the resonance line positions can be described using spin-Hamiltonian
H   =   μ B B g S
Here μB is the Bohr magneton, B is the vector of static magnetic field, g is the tensor of spectroscopic splitting, and S is the vector of electron spin.
As an example of the multi-center spectra let’s consider ion Nd3+ in LN [91,92,93] (Figure 2). Every spectrum consists of a single dominant line labeled with the number 1 and many satellite lines of smaller intensities. The positions of the dominant line have the same value of the resonance field for B||x and B||y (φ = 90 deg), whereas positions of other lines do not coincide. We have to suppose that the single line #1 belongs to the axial C3 symmetry center, Nd1.
To make correct labeling of all observed lines a detailed study of angular dependence of EPR line positions is required. For instance, we can rotate magnetic field in xy crystallographic plane, changing azimuthal angle φ between x-axis and B. Circular diagram of measured spectra (Figure 3) show that dominant line draw a circle, i.e., has no dependence of Bres(1) on φ. Angular patterns of other lines demonstrate the presence of all elements of the 3m group, namely, C3 symmetry and the mirror with respect to y-axis at φ = 90 deg. Measurement of such a diagram is redundant, since xy plane angular patterns simply repeat themselves with a period 60 deg. Due to the glide mirror plane, the 30 degree dependence measured from x axis contains all information.
Usually, 90 deg of the measured dependence is plotted (Figure 4). If spectra are measured with small angular steps (said 1 deg), it is easy to trace every line. The line tracing allows to put labels on every resonance line on Figure 2. Without doubt, at least four groups of angular branches are clearly distinguished on Figure 4: one straight branch of axial Nd1 and three sets of curved branches, which correspond to low-symmetry centers Nd2, Nd3, and Nd4. Therefore, we can conclude that Nd3+ in Nd1 center occupies one of three possible positions on the z-axis. If Nd3+ has additional defect or defects (charge compensators) in its neighborhood, the defect is located on the same axis. In the case of Nd2, Nd3, and Nd4 centers with the C1 symmetry, the additional defects are located off the z-axis. It is unlikely that Nd3+ ions occupy sites with C1 symmetry (tetrahedral void or O2−) due to large charge misfit.
Symmetry of any center reflects the symmetry of lattice sites occupied by impurity and charge compensators (if any) and their relative locations. To distinguish the C3 and C1 symmetries the measurement of angular dependence in xy plane is sufficient. However, to obtain a full set of spectroscopic characteristics of the center (like six components of g-tensor) by fitting measured angular dependence a study of spectra under three rotations in perpendicular planes (road map) is required.

3.2. Isotropic and Dipole-Dipole Interactions

Calculations of the ENDOR frequencies and transition probabilities (i.e., ENDOR line positions and relative intensities) for i-th nucleus is usually based on nuclear spin-Hamiltonians Hi
H i   =   μ n g n ( i ) B I ( i ) + S A ( i ) I ( i ) + I ( i ) Q ( i ) I ( i )
where μn—nuclear magneton, g n ( i ) —nuclear g-factor; A(i), Q(i)—tensors of hyperfine and quadrupole interactions.
In many cases there are two dominant contributions to the hyperfine tensor A(i): isotropic (contact) hyperfine interaction, a ( i ) S I ( i ) and dipole-dipole interaction of vectors of electron μ B g S and nuclear μ n g n ( i ) I ( i ) magnetic moments. The dipole–dipole interaction can be described by
A j m ( i ) d d   =   μ B μ n ( R ( i ) ) 3 g n ( i ) [ 3 ( R ( i ) ) 2 ( p   =   x , y , z g j p R p   ( i ) ) ( l   =   x , y , z R l   ( i ) δ l m ) g j m ]
where R(i) is the vector from paramagnetic impurity to the i-th nucleus. Most characteristics in Equation (3) are known: μ B ,   μ n ,   g n ( i ) are tabulated, g j m components of g-tensor are determined from EPR measurements. Therefore, comparison of measured angular dependences of ENDOR frequencies with calculated ones on the base of Equations (2) and (3) can be used for determination of R(i), i.e., the position of the paramagnetic impurity relative to surrounding nuclei.
Nuclei at the same distance from impurity ions are usually called a shell. The first shell of an impurity in a Li site has six nearest Li nuclei off the z-axis at the distance R(1) (Figure 5a). Three of them are located above the impurity (the subshell 1a), other three—below the impurity (the sub-shell 1b); if the impurity is shifted from regular Li site then R(1a)R(1b). The second shell consist of six Li nuclei in the xy plane of the impurity at the distance R(2) (subshells 2a, 2b).The first shell of an impurity in a Nb site has one Li nucleus on z-axis, the second shell has three Li nuclei (the nuclei are labelled 1 and 2 on Figure 5b). As directions from the impurity to the nuclei in a shell are different, their hyperfine interactions are magnetically non-equivalent, i.e., produce different branches in angular dependences of ENDOR spectra.
The simplest way to determine the impurity lattice site is:
  • to calculate A j m ( i ) d d for the several nearest nuclei around the impurity taking lattice distances from X-ray data and gjm from EPR measurements,
  • to calculate ENDOR frequencies, to plot patterns of their angular dependencies, and
  • to compare the patterns with measured angular dependencies of ENDOR for a definite EPR line [13,38,39].
Due to different surroundings for impurities in the Li and Nb sites, the calculated patterns are completely different (Figure 6). ENDOR frequencies for the first shell of Li nuclei for the Li site vary with rotation of magnetic field in xy plane(Figure 6a), whereas for the single Li nucleus of the first shell for Nb site two straight branches should be observed in angular dependence (Figure 6c). As Li nuclei of the all corresponding shells are closer to the impurity ion in the Nb site than in the Li site, the range of angular variation for Nb site is larger than for Li site. The branches of the 2nd and 3rd shells for Li site practically coincide with measured angular dependencies for Nd1 center (Figure 6b), whereas no branch for Nb site is close to observed one. The branches of the 1st shell for Li substitution also agree with observed ones after small correction due to isotropic hyperfine interaction (Figure 6b). Based on clear agreement of hundred measured values of ENDOR frequencies for the dominant EPR line #1 with calculated frequencies for Li site and obvious disagreement with calculated ones for Nb site, we can definitely conclude that the Nd1 line in EPR spectra (Figure 2) belongs to Nd3+ ion substituted for Li.
The simulation of dipole-dipole interactions for the Li and Nb sites has no fitting parameter. Therefore, the described qualitative and quantitative approach for the determination of impurity positions gives reliable results. Note that hyperfine interactions for Nb/Ta nuclei have additional contributions due to a polarization of inner electron shells of oxygen and niobium ions (transferred hyperfine interaction).
The characteristic of isotropic hyperfine interaction a ( i ) is related to a density of electron cloud at the location of i-nucleus R(i). For the isotropic g-factor:
a ( i )   =   8 π 3 g μ B g n ( i ) μ n | ψ ( R ( i ) ) | 2
The isotropic hyperfine interaction often (but not always) exponentially decreases with the distance from impurity. The largest value a ( i ) / g n ( i ) should correspond to nuclei nearest to the impurity. It allows to determine nuclei of the nearest surrounding by comparison of a ( i ) / g n ( i ) for Li and Nb nuclei, and therefore, to find the impurity location. Impurities substituted for Li have Nb nucleus on z-axis in the nearest surrounding, whereas ions substituted for Nb have Li nucleus (Figure 6, shell #1).
Another way to use contact and dipole-dipole interactions is:
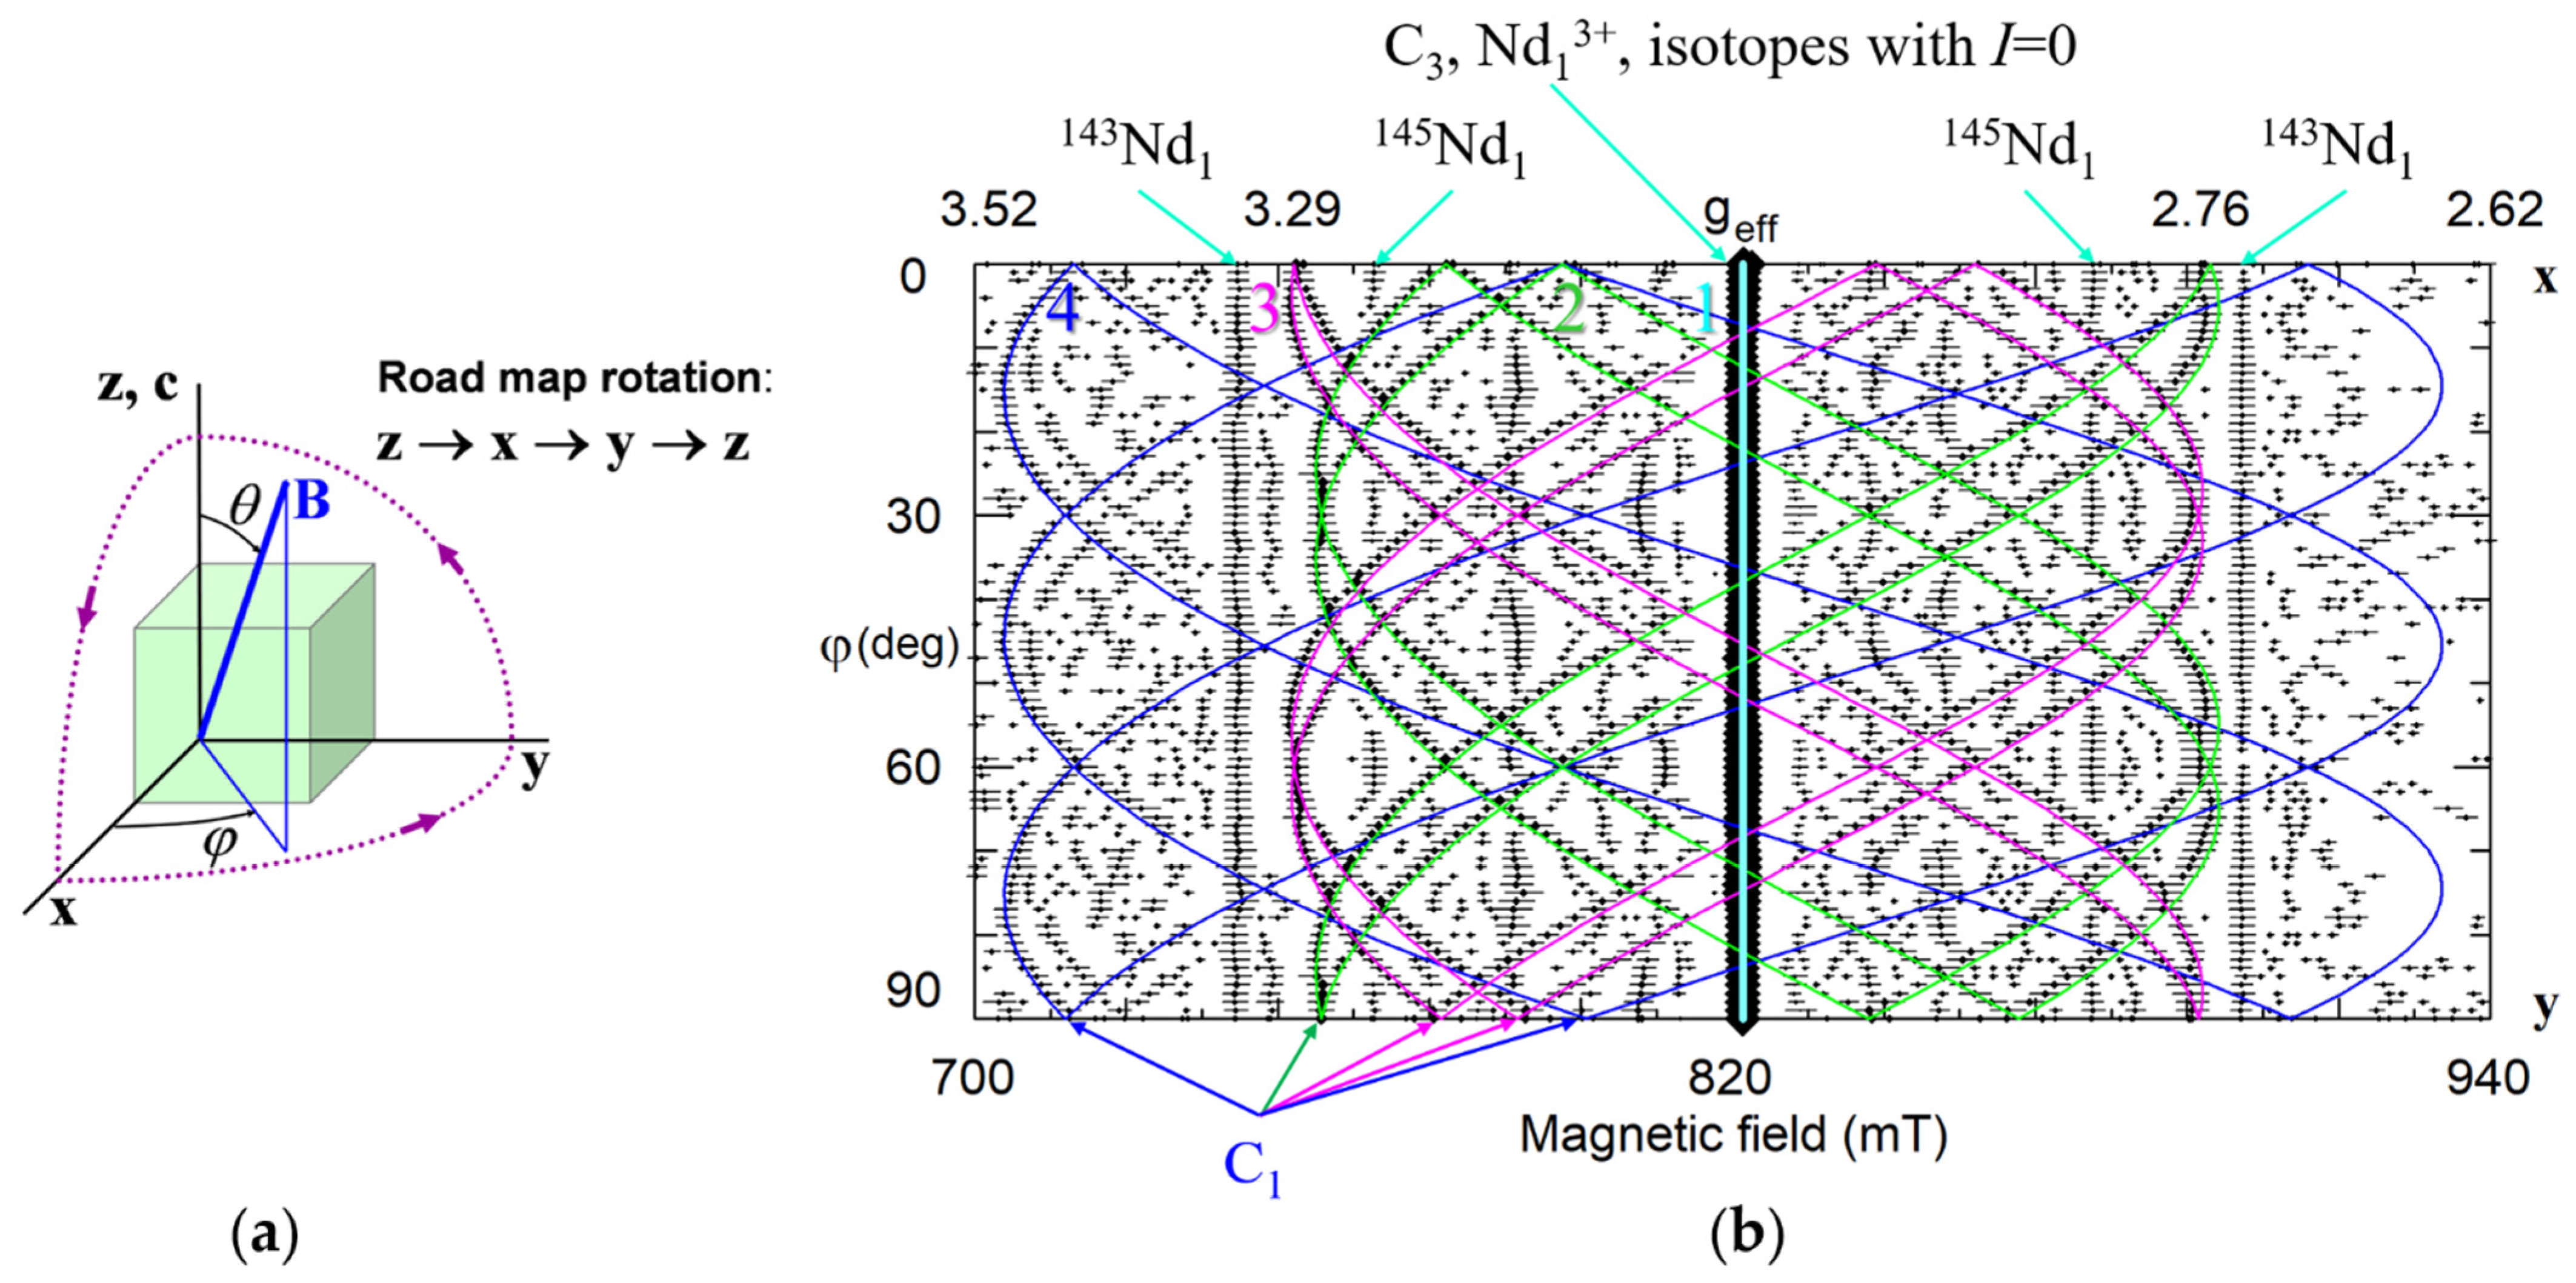
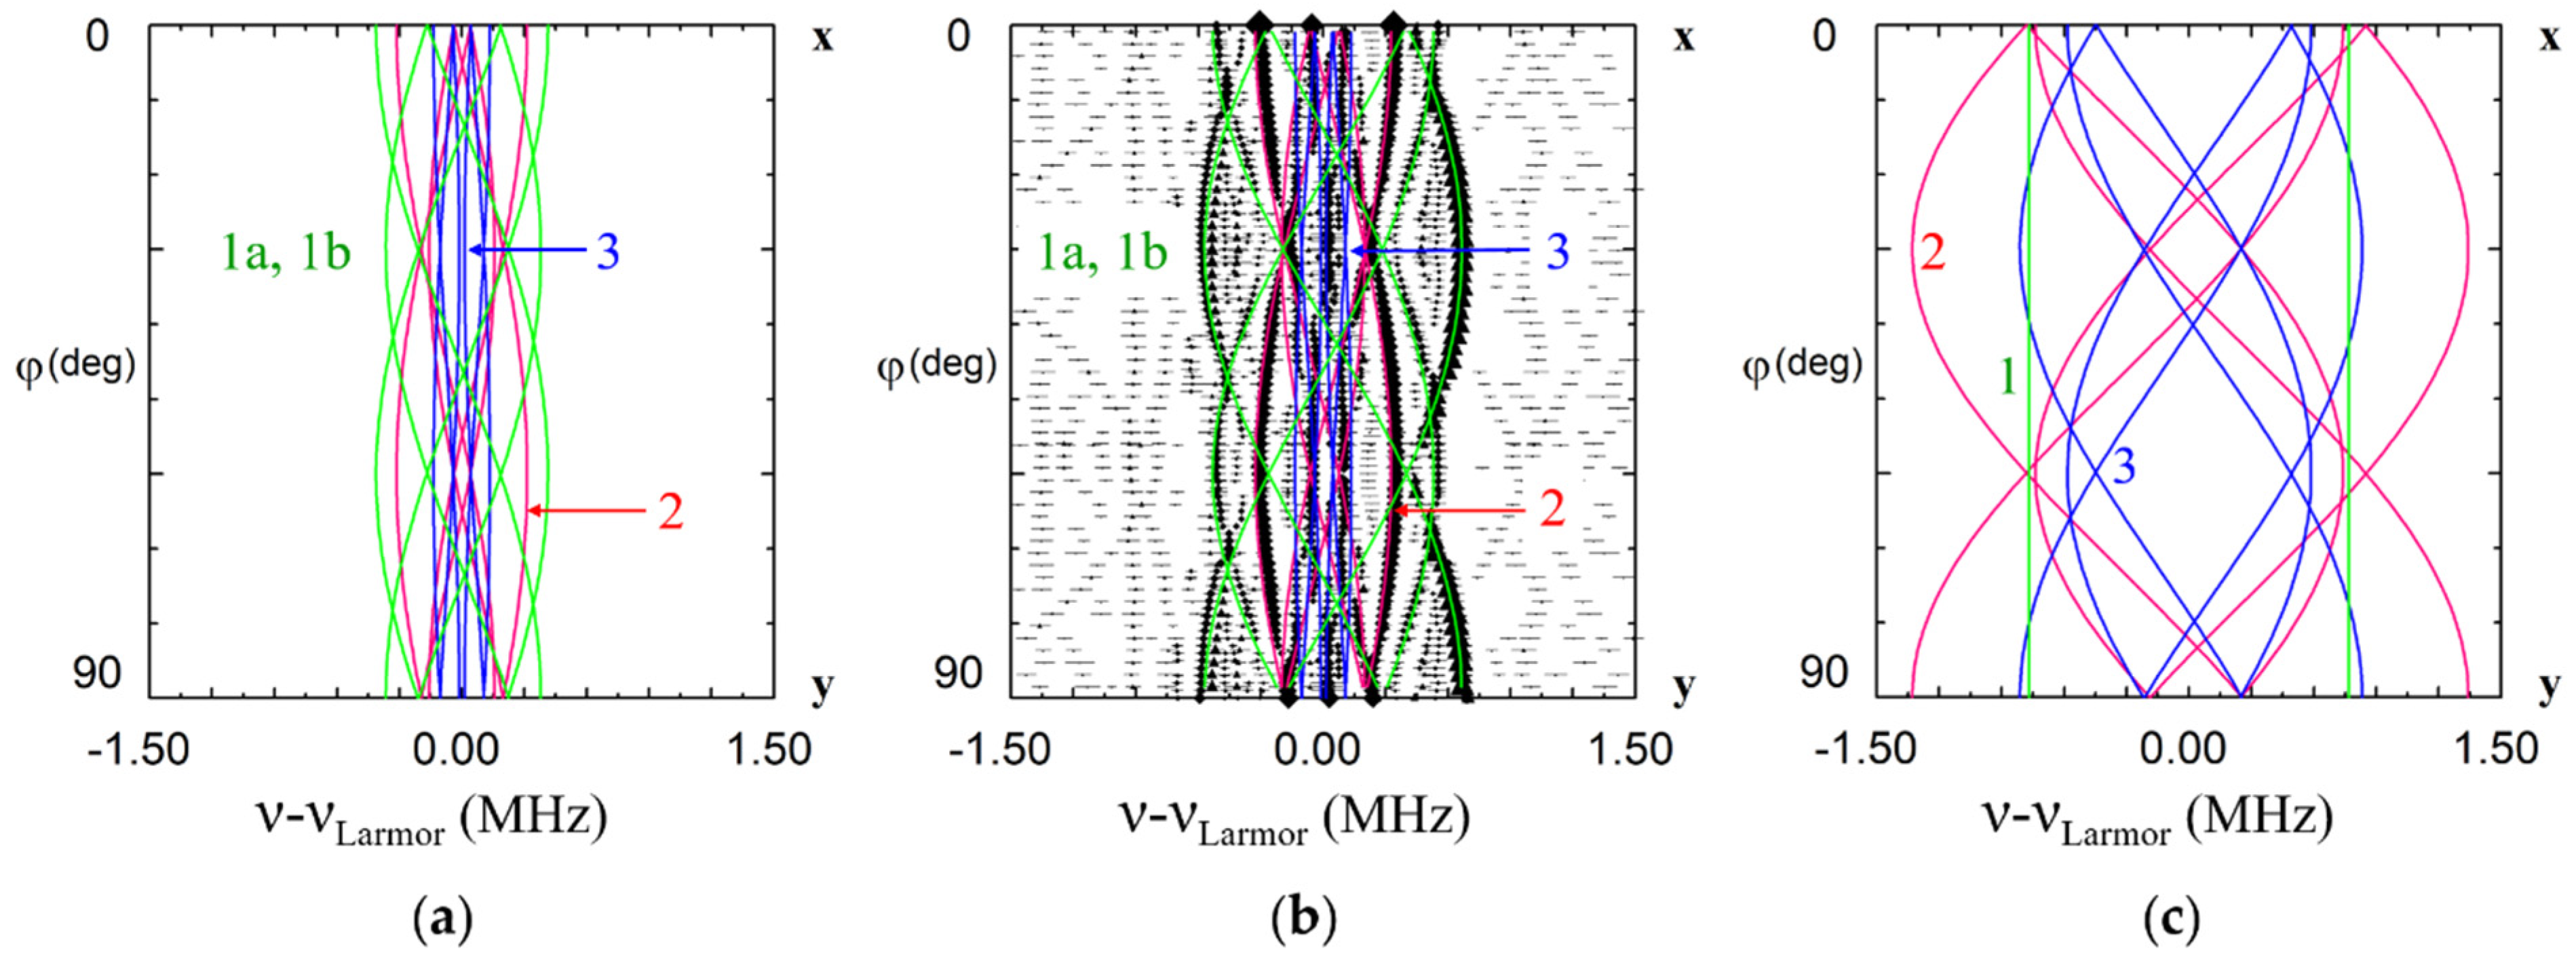
  • to measure the road map of angular dependencies in three perpendicular planes (Figure 4a),
  • to determine all components of A ( i ) tensors by fitting observed angular dependencies,
  • to separate isotropic and anisotropic parts,
  • to find principal values of the anisotropic part, and finally,
  • to compare these principal values with calculated ones on the base of Equation (3).

3.3. Charge Compensation and Intrinsic Defects

The structure of a center, in which a lattice site is occupied by an extrinsic impurity ion having a charge different from that of the respective lattice ion (in the following labeled “non-isocharged replacement”), depends on the charge of the impurity and the mechanism of charge compensation. Because of non-stoichiometry, the real lattice of conventional congruent LN contains many intrinsic defects, the relative concentrations of which have not yet been determined reliably. The following entities have been considered (their charges with respect to the lattice being given by Kröger-Vink notation in brackets): Nb5+Li+ (NbLi4•) antisite defect, vLi+ (vLi) lithium vacancy, vNb5+ (vNb5’) niobium vacancy, Nb5+v (Nbv5•) niobium on structural vacancy, Li+v (Liv) lithium on structural vacancy, vO oxygen vacancy. During recent years the existence of the following charge compensated complexes has been postulated most often: NbLi + 4vLi [90,94,95] (including three-dimensional complexes 3vLi + NbLi + vLi [96,97]), 5NbLi + 4vNb [98,99], 2NbLi + 2Nbv + 3vLi + 3vNb [96] and some others [100]. Some features accompanying the crystal growth (Li2O evaporation, variation of oxygen deficiency in Nb2O5-x [101]) and specific changes of some crystal properties after thermal oxidation and/or reduction definitely indicate that the oxygen sub-lattice is not always perfect and stable as well; therefore the oxygen non-stoichiometry has been also discussed for a long time [102,103,104,105]. The intrinsic defects by themselves or complexes of them, which are not charge compensated, can furthermore serve as local or distant charge compensators for non-isocharged extrinsic or radiation defects. Due to the high concentration of the intrinsic defects the congruent LN and LT crystals are very tolerant to substitutional or interstitial impurities, including non-controlled ones, because the necessary charge compensators (local or distant) can be easily found among the non-stoichiometric defects. Real crystals often contain H, Cu, Co, Mn, Fe, etc. in concentrations about 0.00X–0.0X.
Non-isovalent cation Men+ (n > 1) substituted for Li+ requires negative charge compensator like lithium vacancy or interstitial O2−. If Men+ (n < 5) substituted for Nb5+ or Ta5+ the n − 5 negative charge can be compensated by antisite ions, oxygen vacancies, vO or interstitial H+ and Li+.
In some cases, a self-compensation of impurity charges takes place. For instance, no additional charge is required if two Me3+ ions substitute for both Li+ and Nb5+ in nearest neighbor or next neighbor sites (local self-compensation) or even relatively far one from another (distant self-compensation). There are two critical parameters, which stimulate the self-compensation: total concentration of possible charge compensation defects, [D] and the total concentration of Me3+ ions in the sample, [Me]. The [D] includes a dominant contribution due to a deviation of the crystal composition from stoichiometry, concentrations of H+ ions and vO, as well as contributions due to non-controlled impurities (Mg, C, Si, Cl, …), which are always present in real crystal in concentrations about 1–500 ppm. If [D] >> [Me] the isolated centers with additional intrinsic defects are dominating. If [D] << [Me] then the self-compensation is preferable due to lack of charge compensators.
Distant charge compensators produce small distortions of the crystal field at the impurity site, what normally causes EPR line broadening, and an asymmetry of their shapes, but do not change the center symmetry revealed in the observed positions and splitting of EPR lines. Defects in the immediate neighborhood (local charge compensation) cause strong changes of the center characteristics (g and A tensors in the case of Nd3+) and lowering of center symmetry.

3.4. Di-Vacancy Models for Trivalent Impurities

Many impurities in LN/LT crystals create a family of paramagnetic centers that includes dominant axial center and several satellite low-symmetry centers with EPR lines of smaller intensities (like presented on Figure 2). It would be reasonable to look for center models which are able to describe the whole family.
Low-symmetry C1 centers appear in three cases:
  • Impurity ion like Nd3+ has an off-axis lattice defect (charge compensator) in the immediate neighborhood.
  • Impurity ion substitutes for O2− (this is very improbable for cations).
  • Impurity ion incorporates into a small tetrahedral void (this is possible, but often unlikely due to larger charge misfit than for Li substitution).
For axial centers, the directions of principal axes of the g-tensor are dictated by crystal symmetry: the 3rd axis of the center coincides with the crystal axis and the directions of the 1st and 2nd axes are arbitrary. For low-symmetry centers, there are no symmetry restrictions on the orientation of principal axes. However, if the symmetry lowering is related to an off-axis lattice defect, it is reasonable to expect that directions of the center axes are related to the distortion created by the off-axis defect. The 3rd axis will have some inclination from the z-axis to the defect, and projections of the 1st or 2nd axis will be close to the projection of line from the impurity ion to the defect. The distortion should decrease with the distance from the impurity ion to the defect.
ENDOR data for the dominant EPR line have confirmed that Nd3+ substitutes for Li+ and only Li and Nb nuclei were found in the neighborhood. Therefore, intrinsic defects without nuclear spin should be considered for the required 2-charge compensation. The size O2− is comparatively large to be placed into small octahedral or tetrahedral voids. Nearly stoichiometric crystals have significantly reduced concentration of vLi. Nevertheless, their concentration often exceeds the impurity concentration. Sufficient concentration of vLi can be also created in the process of growth of samples with non-isocharged impurities.
A key to the identification of models which describe all varieties of Nd3+ centers with minimal assumptions was obtained from the analysis of angular dependencies of the Nd4 center. The extrema in the xy plane and, correspondingly, projections of one principal axis of the g-tensor, are close to ϕ values of 15, 45, and 75 degrees (Figure 4b). In the projection of the LN lattice onto the xy plane (Figure 7, after [93]) there are no similar values of ϕ from Nd3+ to any ion in the lattice: directions from the Nd3+ site to all cation sites have azimuthal angles equal to n × 30°. Therefore, the simplest model, that has a single lattice defect, like a Li+ vacancy, vLi, cannot explain the observed angular dependencies of Nd4 centers. However, if two Li+ vacancies are located in the first and second shells of the surroundings of an Nd3+ ion substituted for a Li+, the three defects are organized into a triangle. The longest side of the triangle connected two vLi has a perpendicular oriented in the required direction (Figure 7).
The hypothesis that Nd3+ substituted for Li+ has two vLi as charge compensators allows for consistent models for the whole family of Nd3+ centers in LN crystals with a low concentration of neodymium doping. After analysis of principal values and axes of g-tensors it was concluded [92,93] that Nd3+ centers have lithium vacancies in sites described in Table 1. Some of possible structures are presented on Figure 7 and Figure 8.
The di-vacancy models can explain EPR spectra of many other (but not all) trivalent impurities Me3+Li.

4. Structures of Impurity Centers

4.1. Monovalent Cations

The most probable incorporations of Me+ is the substitution for Li+. No charge compensation is required in this case. The MeLi+ center should have axial C3 symmetry.
Proton H+. This is an example of off-site position: protons occupy positions between two oxygen ions in an oxygen plane. The non-paramagnetic OH centers were studied by infrared and NMR spectroscopies [80,106,107,108].
A hydrogen associated paramagnetic center (g = 2.0028, A = 3 mT at 77 K) was identified as an OH2− ion, produced because of an electron capture by a diamagnetic OH ion, substituting the O2− ion in LN [109].
Ni+ (3d9, S = 1/2). Observed EPR spectra of the Ni+ have axial symmetry at room temperature [110,111]. That excludes interstitial position in tetrahedral structural vacancies. However, at low temperatures the Ni+ center has C1 symmetry, as up to six lines were observed at arbitrary orientation of magnetic field (Figure 9a, after [111]).
The center was characterized by anisotropic g-tensor with principal values g1 = 2.246, g2 = 2.217 and g3 = 2.061; principal axes of the g-tensor are rotated with respect to crystallographic axes by Euler angles α = γ ≈ 0, β ≈ 55°. As the 3rd principal axis is directed approximately to one of the nearest oxygen ions, the reason for the low symmetry is a static Jahn-Teller effect for 3d9 ions in Ni+O62− complexes (Figure 9b, [111,112]), and not a presence of an intrinsic defect in the neighborhood. Dynamic averaging due to center reorientation leads to the axial symmetry of observed EPR spectra at room temperatures [111].
Mg+ (3s1, S = 1/2). Following vacuum reduction at 1000 °C, LN crystals heavily-doped with Mg exhibit an optical absorption spectrum that can be decomposed into two bands peaking near 760 and 1200 nm, and a broad EPR spectrum with gc = 1.82 [113]. The 1200-nm band and ESR signal are associated with an electron trap (identical to the one produced during the irradiations). This electron trap is suggested to be a Mg+ complex. There is an alternative interpretation of this spectrum [114].

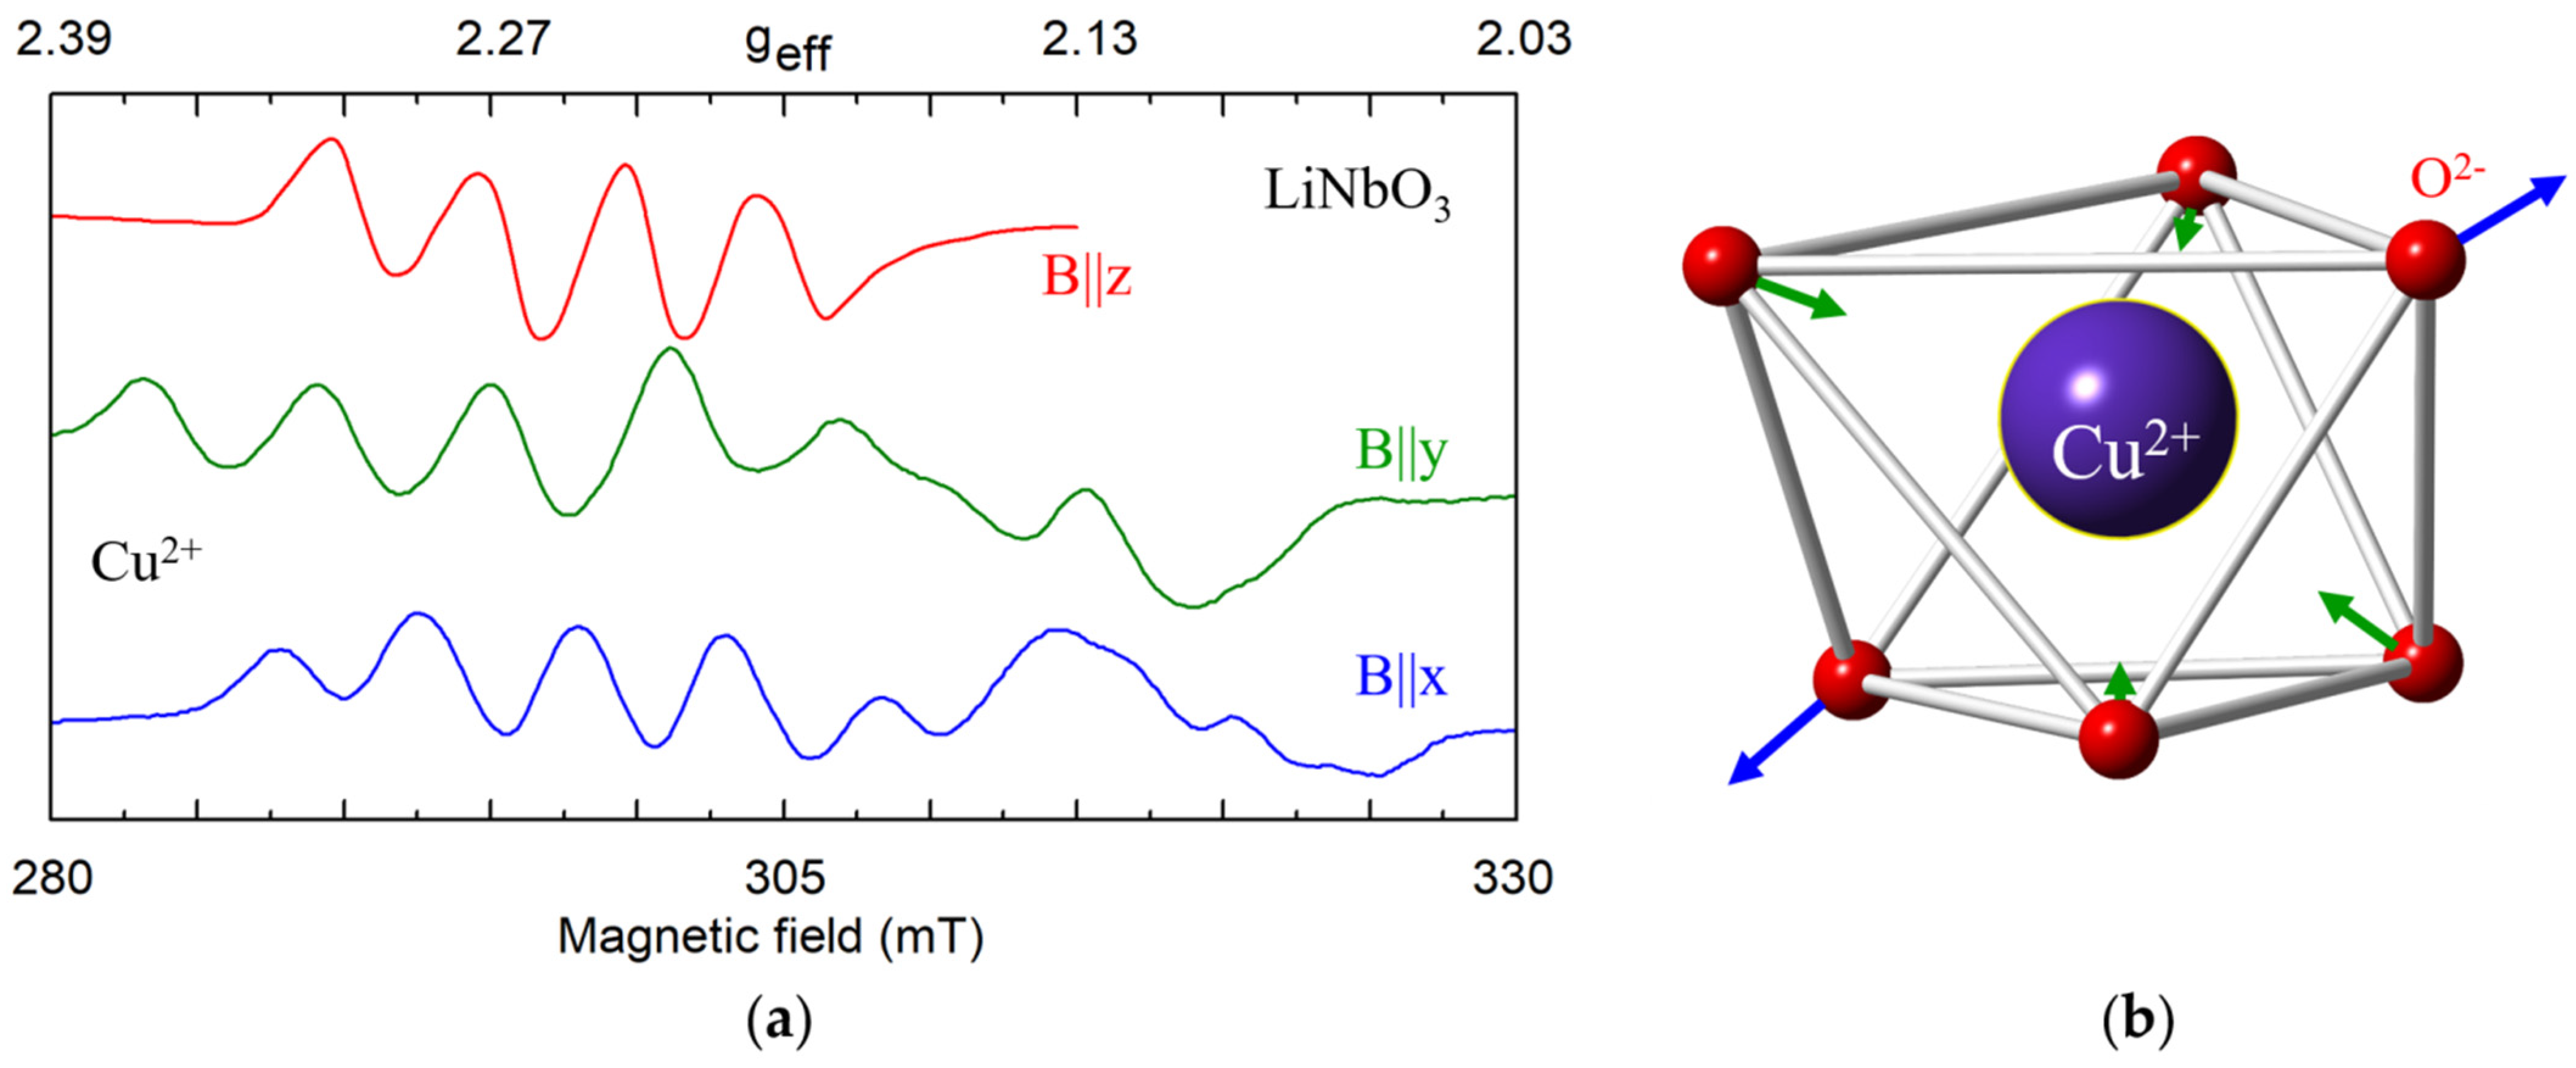
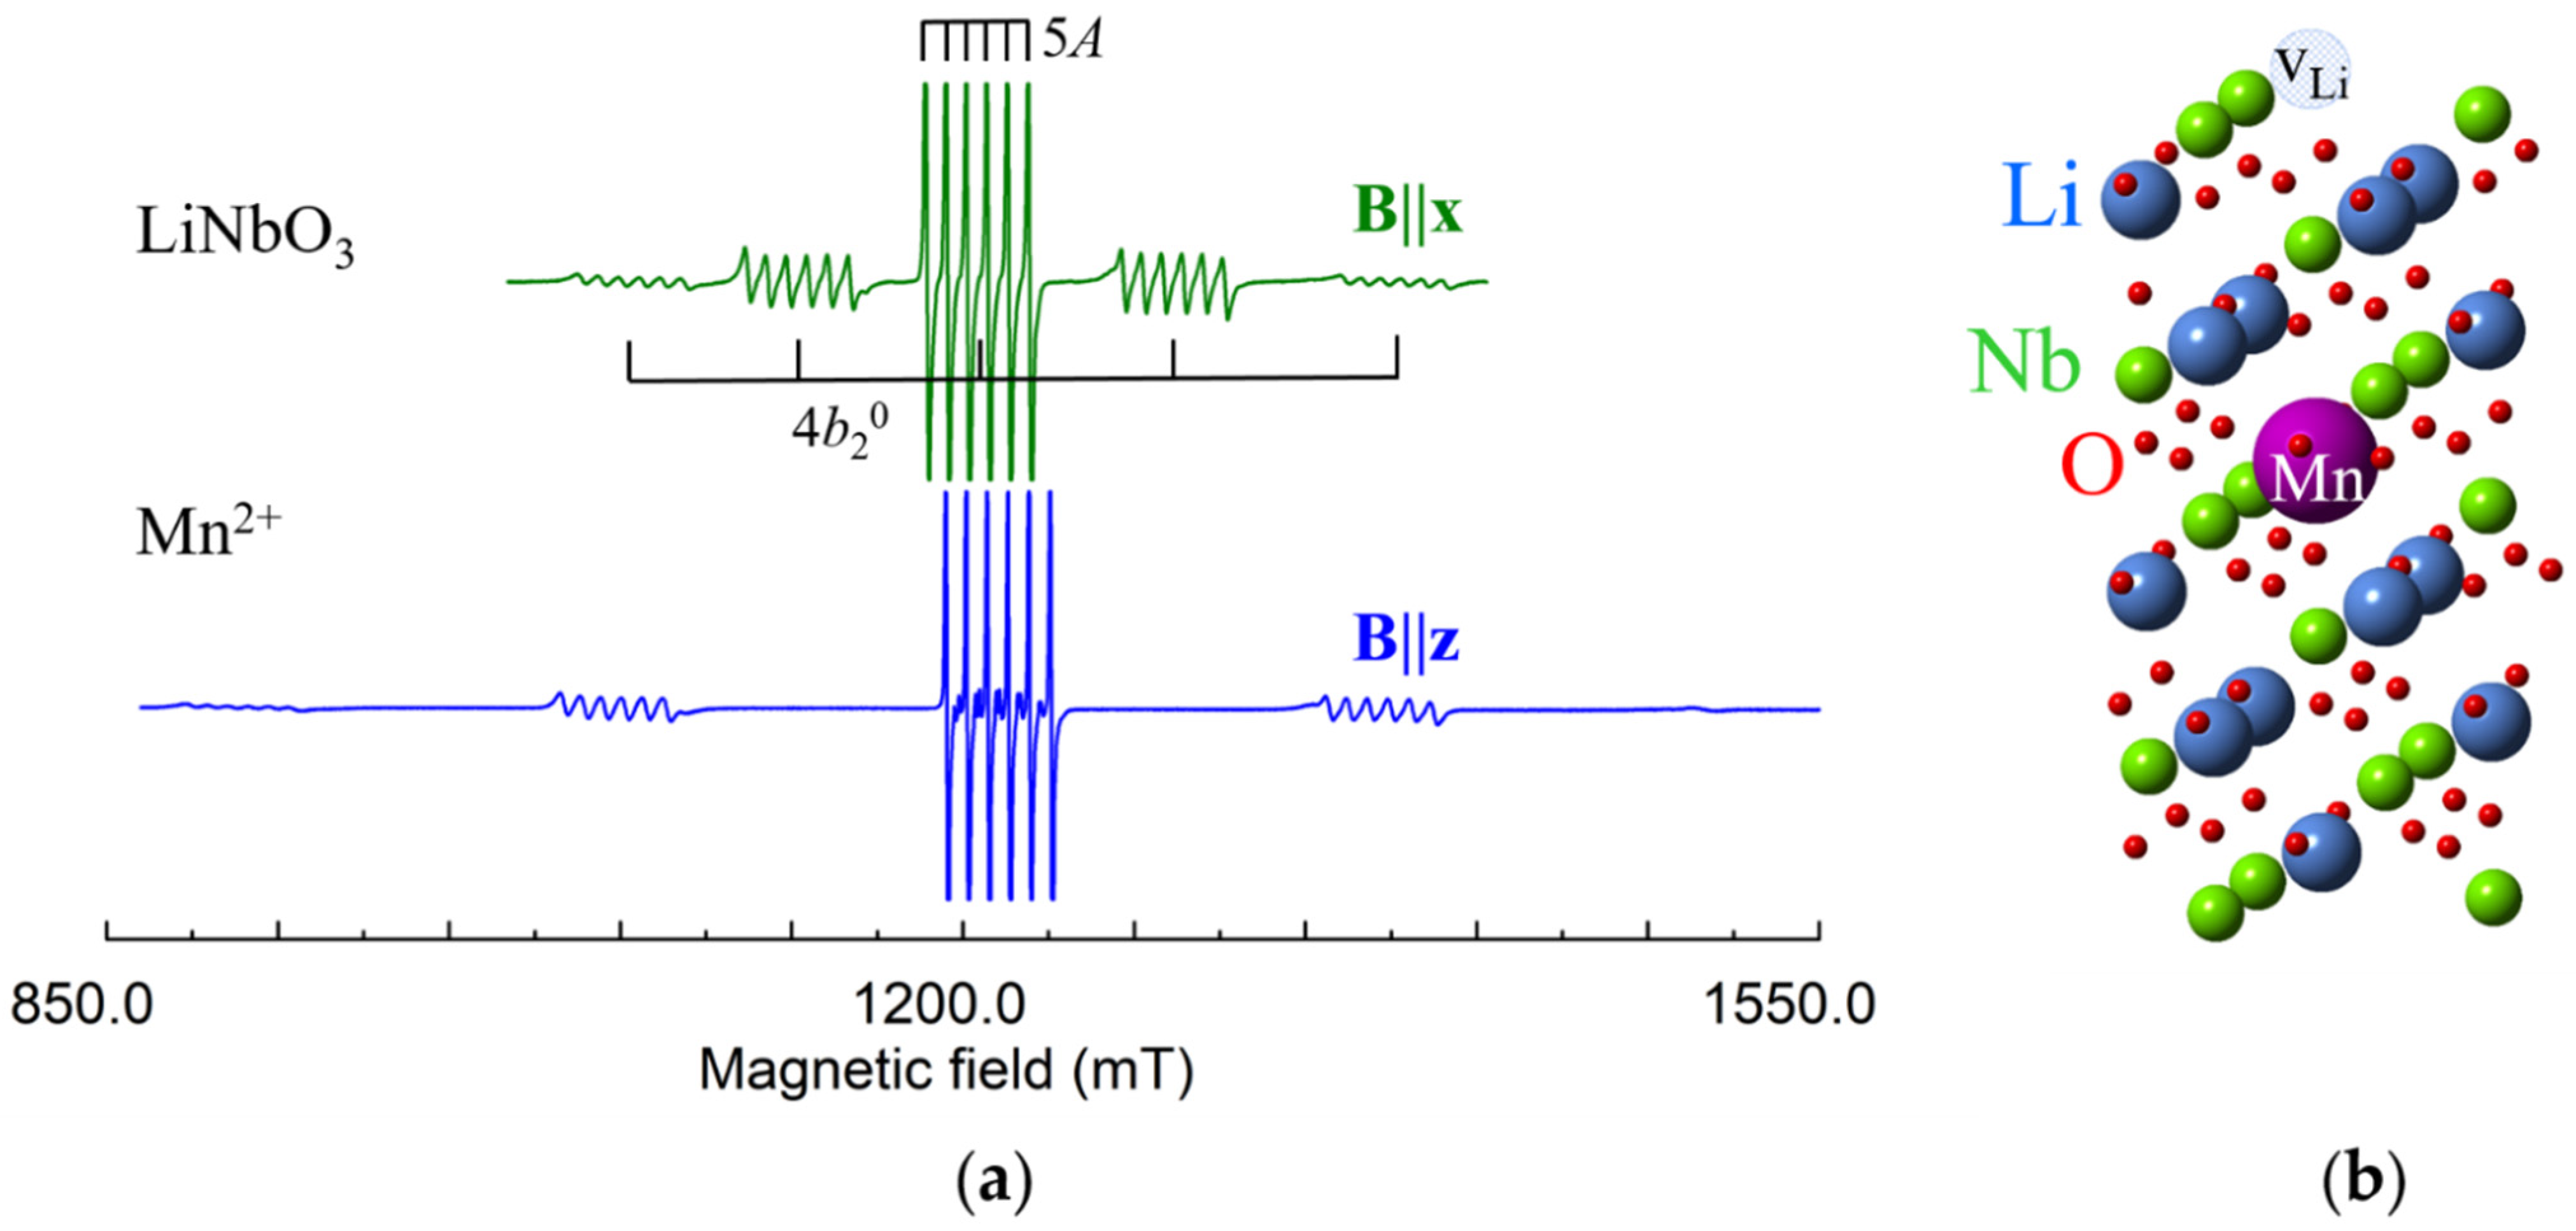
4.2. Divalent Cations

For divalent Me2+ impurities a substitution for Li+ ions and incorporation in structural vacancies has essentially less charge misfit than a substitution for Nb5+. Since the Li-Li distance is much larger than Li-Nb or voct-Li, voct-Nb, the Me2+Li + vLi centers should be slightly distorted by the presence of a local charge compensator. For vLi located on C3 axis and for distant cation vacancies (local and distant charge compensation) axial centers should be observed.
Co2+ (3d7, S = 1/2, I = 7/2). Dominant axial Co2+ center with g = 2.6 and g = 4.96 ÷ 5.04, A ≈ 0, |A| = 0.0154 cm−1, as well as low-intensity low-symmetry satellite centers were observed in cLN [115,116] and vLN [117]. Similar g- and A-values were reported for LiTaO3:Co2+ [116]. The picture agrees with Co2+ substitution for Li+ in the dominant axial center (CoLi) and excess charge compensation by vLi (the Co2+ ⇔ 2Li+ substitution mechanism). A small EPR line of axially symmetric cluster of Co2+ ions appeared in sLN [118] (Figure 10a). To explain it the substitution mechanism 4Co2+ ⇔ 3Li+ + Nb5+ [119] was considered. The four Co2+ ions can occupy nearest possible cation sites by occupying one Nb site and three neighbor Li sites, creating a trigonal pyramid with C3 symmetry (Figure 10b).
From comparison of measured and calculated characteristics it was found that Co2+ does not occupy exactly the host Li+ site but undergoes an off-center displacement 0.006 nm away from the oxygen octahedron center in LiNbO3 (or LiTaO3) [120,121].
Cu2+ (3d9, S = 1/2). Copper nuclei have two isotopes 63Cu (I = 3/2, gn = 1.484, natural abundance 69.2%) and 65Cu (I = 3/2, gn = 1.588, 30.8%). Hyperfine interaction of Cu2+ electrons with their own nucleus leads to splitting of its single EPR line into a quartet ([110,111], and references there; [122,123,124]). As magnetic moments of 63Cu and 65Cu are very close, the quartets from the two isotopes overlap in cLN (Figure 11a). The Cu2+ center in LN was characterized by anisotropic g-tensor (g1 = 2.095, g2 = 2.111 and g3 = 2.428; α = γ ≈ 0, β ≈ 51°) [111]. At low temperatures a static Jahn-Teller effect for 3d9 ions in Cu2+O62− complexes reduces the center symmetry to C1(Figure 11b). At room temperature, the Cu2+ center has axial symmetry due to center reorientation and motional averaging. The EPR parameters of the impurity Ni+, Cu2+, and Ni3+ in LiNbO3 were theoretically studied from the perturbation formulas for 3d9 ions [112,122].
Ni2+ (3d8, S = 1). Several additional terms, which describe zero field splitting (ZFS) of energy levels, should be added to the spin-Hamiltonian (1) for paramagnetic centers with S > 1/2:
H Z F S   =   k   =   2 , 4 , 6 f k [ q   =   0 k b k q O k q ( S ) + q   =   1 k c k q Ω k q ( S ) ]
Here f2 = 1/3, f4 = 1/60, f6 = 1/1260; O k q ,   Ω k q ( S ) —Stevens operators, which are non-zero for k ≥ 2S. For C3 symmetry only q equal to 0, 3, and 6 are allowed. For S = 1 only terms with k = 2 are present in Equation (5).
The Ni2+ centers in LN exhibit the EPR spectra of C3 symmetry. Therefore, the sum in (5) turns into one term b 2 0 O 2 0 / 3 . It was found that b 2 0   =   −5.31 cm−1 and Δg = gg = 0.04 [115,125]. Since EXAFS data supports Ni2+ substitution for Li+ [24], the reasonable choice for the charge compensator is one vLi that is located on the C3 axis or very far of Ni2+.
A cluster substitution 4Ni2+ ⇔ Ta5+ + 3Li+ was considered for LT [126]. Note that an agreement of measured and calculated spin-Hamiltonian parameters [127] was obtained for Ni2+ substitution for Nb5+ in LN without a charge compensator.
The charge excess of one interstitial Me2+ or two Me2+Li could be exactly compensated by an additional O2− ion. However, such a compensation looks unlikely, as the ionic radius of O2− (about 1.4 Å) is larger than the sizes of octahedral or tetrahedral vacancies.
Mn2+ (3d5, S = 5/2, I = 5/2). For S = 5/2 the ZFS causes splitting into 2S = 5 components of fine structure, each of them additionally splits into 2I + 1 = 6 lines due to the hyperfine interaction of Mn2+ electrons with their own nucleus (Figure 12).
Angular dependences of Mn2+ in both LN and LT are described by spin-Hamiltonian of axial symmetry with g ≈ 2.0, and A ≈ −0.008, b 2 0 = 0.0731 (LN), b 2 0 = 0.1694 (LT), all in cm−1, [128,129,130,131,132,133,134,135,136,137,138]. Our spectra (Figure 12) were fitted with b 2 0 = 0.074 (LN), b 2 0 = 0.175 (LT).
Hyperfine interactions with four Li and two Nb shells of surrounding nuclei were determined by ENDOR study in LN [139]. For isotropic g-tensor, the principal values of dipole-dipole interaction (3) can be described by:
b d d ( i )   =   g μ B g n ( i ) μ n ( R ( i ) ) 3
Comparison of measured values of b d d ( i ) with values calculated by Equation (6) for Li and Nb substitution has definitely shown that Mn2+ ions occupy Li site [139].

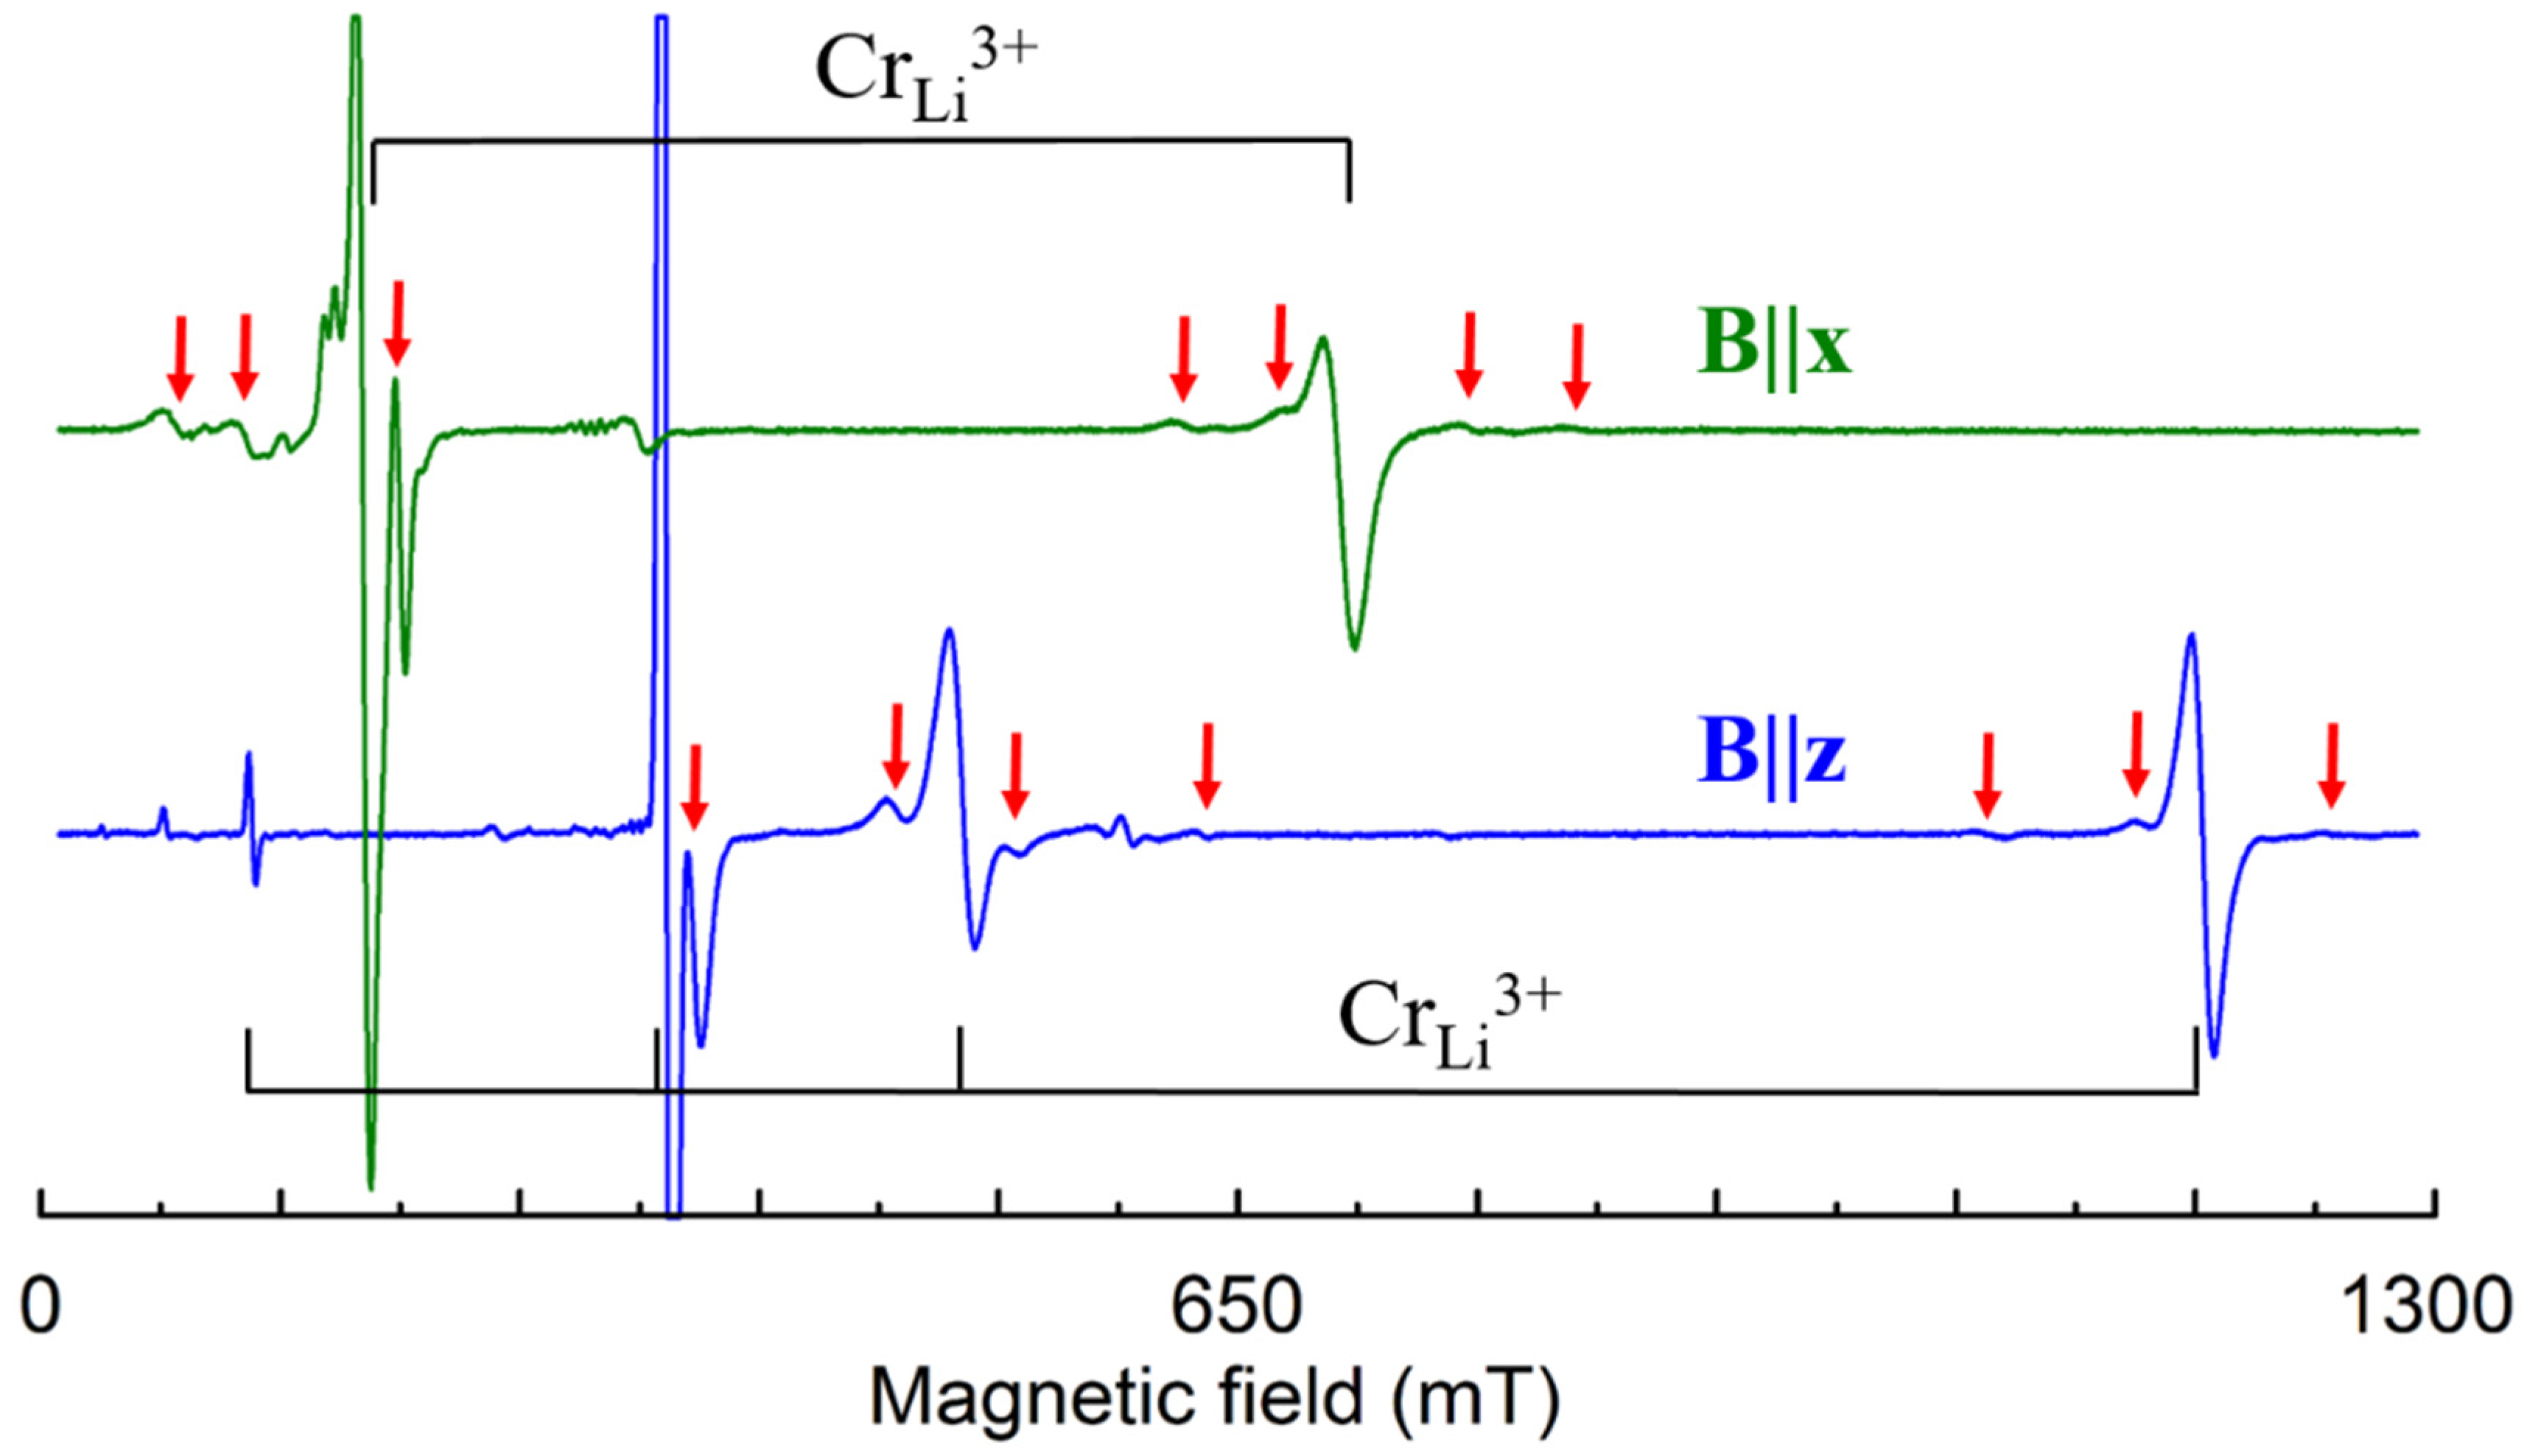
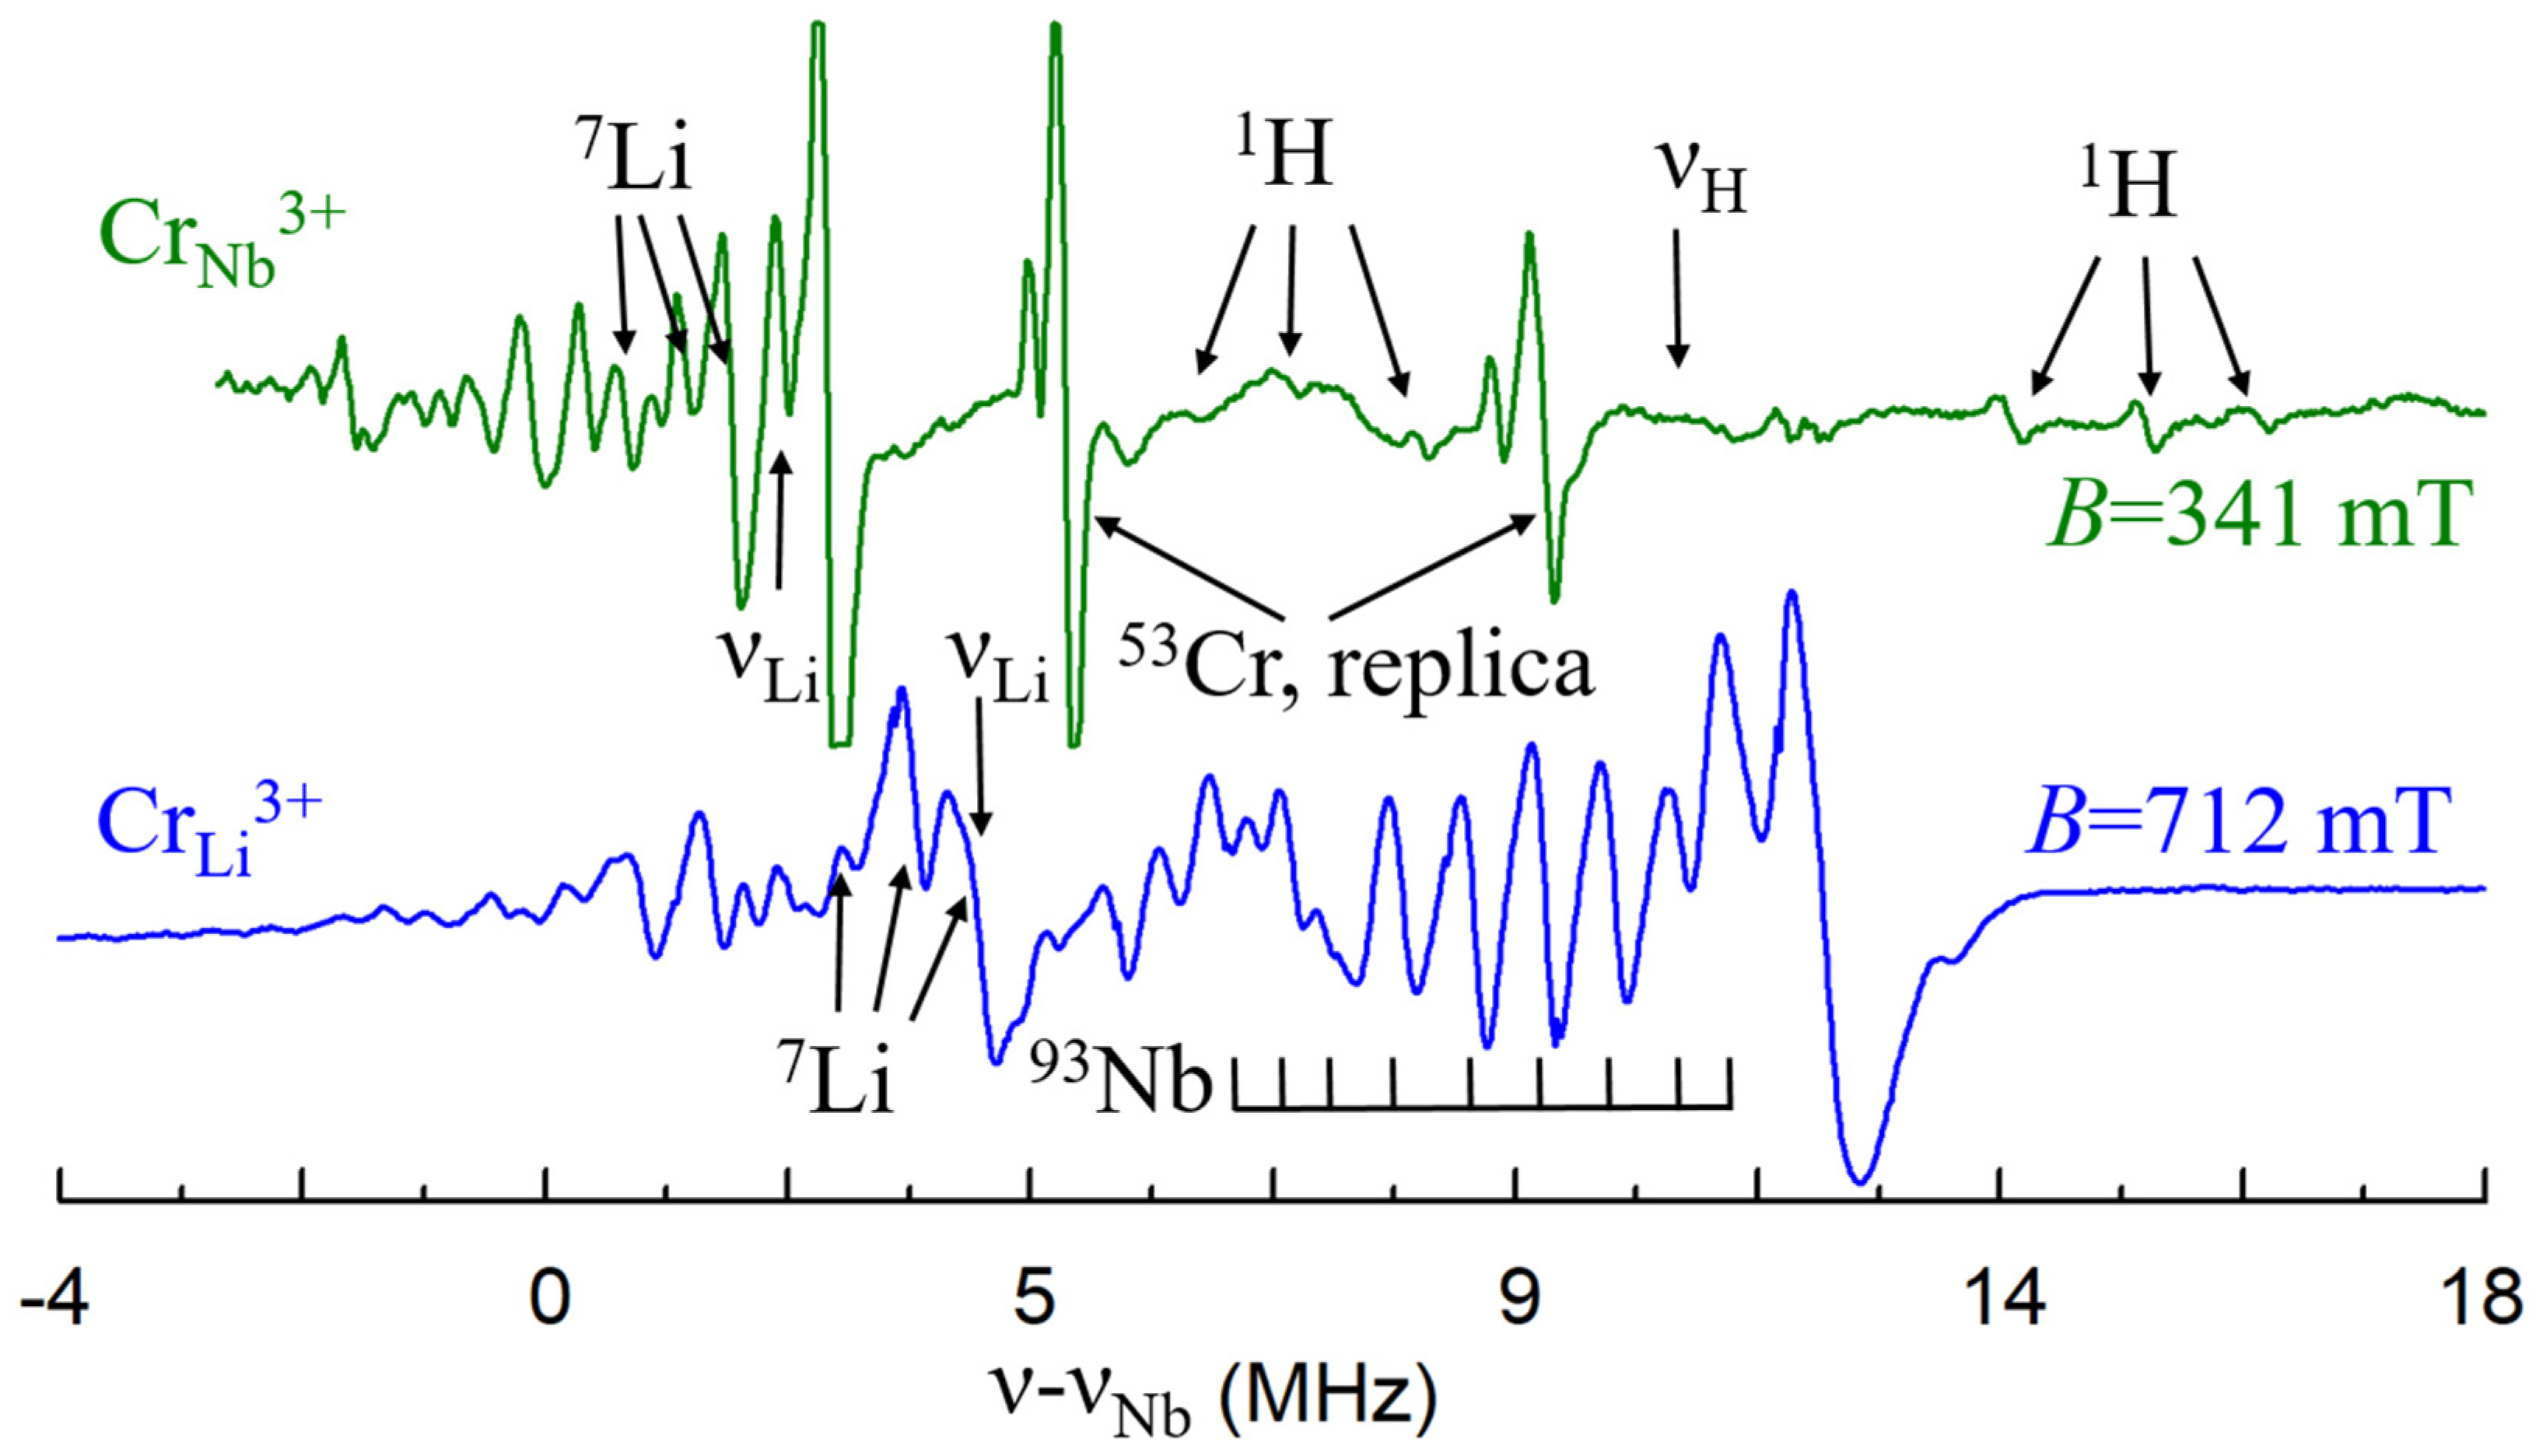
4.3. Trivalent Cations

Most transition metals (including iron, titanium, and chromium) and rare-earth elements enter LN in this valence. If Me3+ substitutes Li+ there are three possibilities to compensate its 2+ excess charge: vLi, vNb and self-compensation with Me3+Nb5+ in the nearest or distant neighborhood. Every Me3+Li can be compensated by two vLi; every five Me3+Li+ ions—by two niobium vacancies. The positive antisite defect NbLi can serve as a charge compensator for Me3+ replacing Nb5+ (but not Me3+Li+ or Me3+v). It is remarkable that one Nb5+Li+ exactly compensates the excess charge of two Me3+Nb5+ ions. Since vLi+ has only one negative charge relative to the ideal lattice, it produces a 4–5 times weaker perturbation of the crystal field than Nb5+Li+ or vNb5+. Therefore the centers with vLi+ at distances of about 6 Å should probably are not distinguishable from axial centers with non-local charge compensation.
Interstitial Li+ ions should be considered as charge compensators for Me3+Nb5+ in Li-rich, VTE treated, and stoichiometric crystals. The association of Me3+Nb5+ with one Li+ ion in the nearest vacancy (partial local charge compensation) leads to an axial center, the second Li+ in the next vacancies can decrease symmetry to C1, if located off center axis and near the impurity. Mg2+ or Zn2+ ions substituted for Li+ can be also suitable compensators for Me3+Nb.
Distances between the replaced ion and shells of possible location of compensators, various configurations of Me and charge compensators, as well as the symmetries of the corresponding complexes are given in References [87,140,141,142].
Cr3+ (3d3, S = 3/2). In congruent and Li-rich LN samples, the EPR lines of dominant axial Cr3+ center, characterized with ZFS b 2 0   ≈ 0.39 cm−1, are accompanied with small satellite lines (Figure 13). Initial discussion with plausible but contradictory arguments about Li+ or Nb5+ substitution [134,143,144,145,146,147,148] should be ended after PIXE [32] and detailed ENDOR [140] studies have shown that Cr3+ substitutes for Li+ and slightly shifted from regular Li site. ENDOR measurements confirmed that Cr3+ substitutes for Li+ also in all satellite centers. Therefore, the whole family of these Cr3+ centers can be described as Cr3+Li with location of charge compensator on C3 axis for axial or off it for low-symmetry centers.
The ENDOR measurements [140] found that hyperfine interactions with Nb nuclei of the 2nd and 3rd shells (Figure 5a) are stronger than with Li nuclei (Figure 14, bottom). However, lines of Nb nuclei on the center axis (1st and 4th shells) were not identified. It can be caused by unfortunate conditions of their observation, petal distribution of electron density for the 3d3 ion or absence of Nb ion in one of these sites, i.e., vNb. Two vNb can serves as the charge compensator for five Cr3+Li. Although the presence of vNb in undoped LN looks unlikely, the charge compensation defects in doped crystals (especially, if dopant concentrations exceed 0.X%) can differ from dominant intrinsic defects in undoped LN or LT. During the growth process, the required compensators can organize themselves around impurities or enter from air in order to minimize the creation energy for the impurity center. This is why structures with vNb were proposed for satellite centers of Cr3+Li [87].
On the other hand, vLi are considered as dominant intrinsic defects in LN and LT. Angular dependencies of EPR spectra for the dominant (C3) and satellite (C1 symmetry) Cr3+ centers (Figure 15) are pretty similar to observed patterns for Nd3+ (Figure 4). Therefore, two vacancy models for trivalent impurities (Table 1) and structures on Figure 7 and Figure 8 can be viable alternatives for Cr3+ family.
A lack of intrinsic defects in stoichiometric samples leads unavoidably to a change of charge compensation mechanism for trivalent impurities, and substitution for Nb5+ becomes possible. An axial Cr3+ center with significantly smaller ZFS b 2 0 = 0.0215 cm−1 (Figure 16a) was found in LNK samples [142]. ENDOR study has shown that hyperfine interactions with Li nuclei significantly larger than with Nb nuclei for this center, i.e., the nearest surrounding consist of Li nuclei. This means that Cr3+ substitutes for Nb5+ in this center. As lines of protons, H+, were found in the ENDOR spectra (Figure 14, top), they compensate the negative charge of Cr3+Nb5+ (Figure 16b).
Exchange interaction SAJSB between spins of Cr3+ ions (SA = SB = 3/2) leads to gaps between states with values of total spin S = SA + SB equal to 0, 1, 2, and 3. The state with S = 0 is non paramagnetic. For pairs at a close distance the gaps can exceed energies of microwave quantum (36 GHz ≈ 1.2 cm−1). It was found by magneto-optical study that for Cr3+Li–Cr3+Nb substituted for nearest Li and Nb sites (at the distance about 0.3 nm) the exchange interaction is antiferromagnetic and J ≈ 480 cm−1. As 1 K × kB ≈ 0.7 cm−1 the upper states of such pairs with non-zero S are not populated even at room temperatures, and the pairs are EPR silent. However, the pairs of the next orders with the isotropic exchange coupling parameter J ≈ 1.5 cm−1 were observed by EPR at relatively low concentration of chromium in LN (less than 0.1 at.%) [87,134,148,149,150].
PIXE/channeling study [32] revealed that chromium ions occupy both regular cation sites (60% on Li sites and 40% on Nb sites) in congruent LN doped with 0.1 mol.% of Cr. This means that the majority of chromium ions enter cLN as non-paramagnetic pair centers. The EPR observes only a top of iceberg in cLN: dominant Cr3+Li and small signals of non-nearest paramagnetic pairs.
ENDOR study of Cr3+ centers in LN heavily doped with Mg and co-doped with Cr has unambiguously shown that Cr3+ in the dominant center has ZFS b 2 0 close to zero (nearly isotropic case) and substitute for Nb [151,152,153,154,155]. Measured anisotropic hyperfine interactions of Cr3+ with for four Li shells were close to b d d ( i ) for Nb site. From comparison of data obtained by EPR, ENDOR, optical absorption, fluorescence, fluorescence line narrowing, selective excitation and radiative lifetime measurements [156,157,158,159,160,161,162] it has been concluded that the addition of Mg2+ ions to LN does not create new Cr3+ complexes, but changes the relative concentrations of the Cr3+Li and Cr3+Nb centers.
The measured value of ZFS for dominant Cr3+ in cLT b 2 0 ≈ 0.444 cm−1 [144] is very close to the value for Cr3+Li in LN. EPR spectra of this center together with signals of weaker intensities of a second center [163,164] were explained in a supposition that they originate from Cr3+ ions located at Li+ sites and that two vLi play the role of a divalent charge compensator for both centers. EPR study of Cr3+ in nsLT and superposition model analysis [165] are in good agreement with the Cr3+ substitution for Li. The temperature dependence of b20 term showed a non-monotonic behavior in the region of 40 K.
Finally, a lot of studies were devoted to various properties of Cr3+ in LN and LT crystals of different compositions in order to clarify relations of optical characteristics with structures of chromium centers [166,167,168,169,170,171,172,173,174,175] etc.
Dy3+ (4f9). The observed Zeeman splitting [143] was described with g-tensor of axial symmetry: g = 8.7 and g = 1.3. The single EPR line had width about 8–10 mT at B||z and became broader at Bz. Such a behavior can be related to unresolved splitting due to satellite centers, if Dy3+ occupies Li position and its charge is compensated by vLi. Two Dy3+ centers with gxx(1) = 2.56(1), gzz(1) = 4.43(1), and gxx(2) = 6.67(1), gzz(2) = 1.23(1) and linewidth about 20 mT were registered in LN after γ-irradiation [176]. Both centers were attributed to Dy3+Li. A broad line of the third center with gzz(3) ≈ 1.2 appeared only at B close to the z-axis. Weak hyperfine lines due to isotopes 161Dy (natural abundance 19%), 163Dy (2.49%) was observed in single crystal of LN [177].
Er3+ (4f11). Due to fast spin-lattice relaxation, the EPR signals of Er3+ are observable at low-temperatures only. Earlier studies claimed that Er3+ ions in cLN create an axial center with g ≈ 15.1–15.4 and g ≈ 2.1 [143,178] or gzz ≈ 15.5 and gxxgyy ≈ 0.8 [179]. A proposed model with lithium vacancies statistically distributed around Er3+Li [179] supposed that the center with no vacancies in surrounding, i.e., the center with axial C3 symmetry, should give a dominant (54%) line in the EPR spectra. Note that angular dependences of EPR spectra in xy-plane were not measured in these studies. Later measurements in all three principal planes [180,181,182,183] have shown that there is no line without angular dependence in the xy-plane, i.e., dominant Er3+ center in cLN has C1 symmetry. This does not agree with statistically distributed vLi around Er3+Li [179].
Significant narrowing of EPR lines in LNK (Figure 17a) allowed us to trace two different Er13+ and Er23+ centers with extrema at about 15, 45 and 75 degrees in xy plane (Figure 17b) [184,185]. The divacancy model (Figure 7) gives a possible explanation if a shift of Er3+Li from regular Li site is taken into account: RBS, XSW and ion-beam/channeling studies have determined that Er occupies Li sites, but is shifted from the ferroelectric Li position by 0.03 [186], 0.046 [187], and 0.02 nm [188]. In this case, distances from ErLi to the vLi in the 1a and 1b shells (Figure 5a and Figure 7b) are completely different, and these centers have one charge compensating vLi in the nearest neighborhood (the shell 1a for Er1, and 1b for Er2), and the second vLi in the next nearest neighborhood (shells 2a, 2b, Figure 7).
Magnetic moments μ B g S for both Er3+ centers are very large and strongly anisotropic. At low temperatures their interactions lead to magnetic ordering for Er concentration about 0.5 at.% in sLN [189].
Various models with two vLi were also extensively discussed in papers devoted to site-selective spectroscopy [190,191,192,193,194,195,196] and references there. Note that models with one of two vLi on z-axis (Figure 8) do not agree with the EPR spectra for dominant lines and hyperfine satellites on Figure 17a. However, such centers can probably be associated with weaker lines or may have no EPR lines at all, if they are non-paramagnetic.
EPR spectra detected in cLN heavily doped with Mg or Zn and co-doped with Er were described with g = 4.3, g = 7.6 for the Mg-doped samples and g = 4.26, g = 7.8 for the Zn-doped ones [197]. The spectra can be attributed to Er3+ located at the Nb5+ site of LN, as they are compared to additional centers observed for some trivalent transition metal ions (particularly Cr3+) in LN: Mg or LN:Zn.
Fe3+ (3d5, S = 5/2). EPR studies have shown that the dominant iron center, Fe1 in cLN has axial symmetry with the ZFS b 2 0 about 0.1680 cm−1 [131,133,134,198,199,200,201,202,203,204,205,206,207,208]. Calculations of optical and EPR characteristics based on the superposition models or generalized crystal field theory gave a preference for Nb substitution [209], no definite conclusion for Li or Nb substitution [210,211,212,213] or some preference for Li site [214,215]. Mössbauer [33,34] and Raman [35] spectroscopy data, Stark effect [216] were interpreted on the base of Fe substitution for Li. Iron clusters were observed at high Fe concentration [33]. Comparison of calculated dipole-dipole interactions of Fe3+ electrons with surrounding Li nuclei for Li and Nb substitution (Equation (6)) with measured ENDOR spectra [38,39,40] has shown that Fe3+ is undoubtedly located in Li site in both cLN and cLT (Figure 5a). Independently, XSW [12,28], EXAFS [21,22,23,24,25,26], and ion beam/channeling [18,27] confirmed Fe3+ substitution for Li+. It was concluded also that Fe3+ ions can be shifted from regular Li-site; however, the obtained values for the shift were very different: 0.006 nm [21] or 0.05 nm from octahedron center [24], less than 0.012 nm [25], about 0.01 nm [26], 0.018 ± 0.007 nm [28], less than 0.005 nm [39]. Fitting observed ENDOR data in LN crystals grown from Li-rich melt (xm ≈ 55%) was obtained with the shift 0.009 nm from Li site [217].
Fe3+ center with small ZFS, Fe2 observed in congruent LN doped with Mg [104,218,219,220,221,222], In [223], and Zn [224] was assigned to Fe3+Nb.
Comparison of EPR spectra of congruent (Figure 18a, 1), near-stoichiometric grown from Li enriched melts (Figure 18a, 2) and grown from congruent melt with the addition of K2O, LNK samples (Figure 18a, 3) showsa:
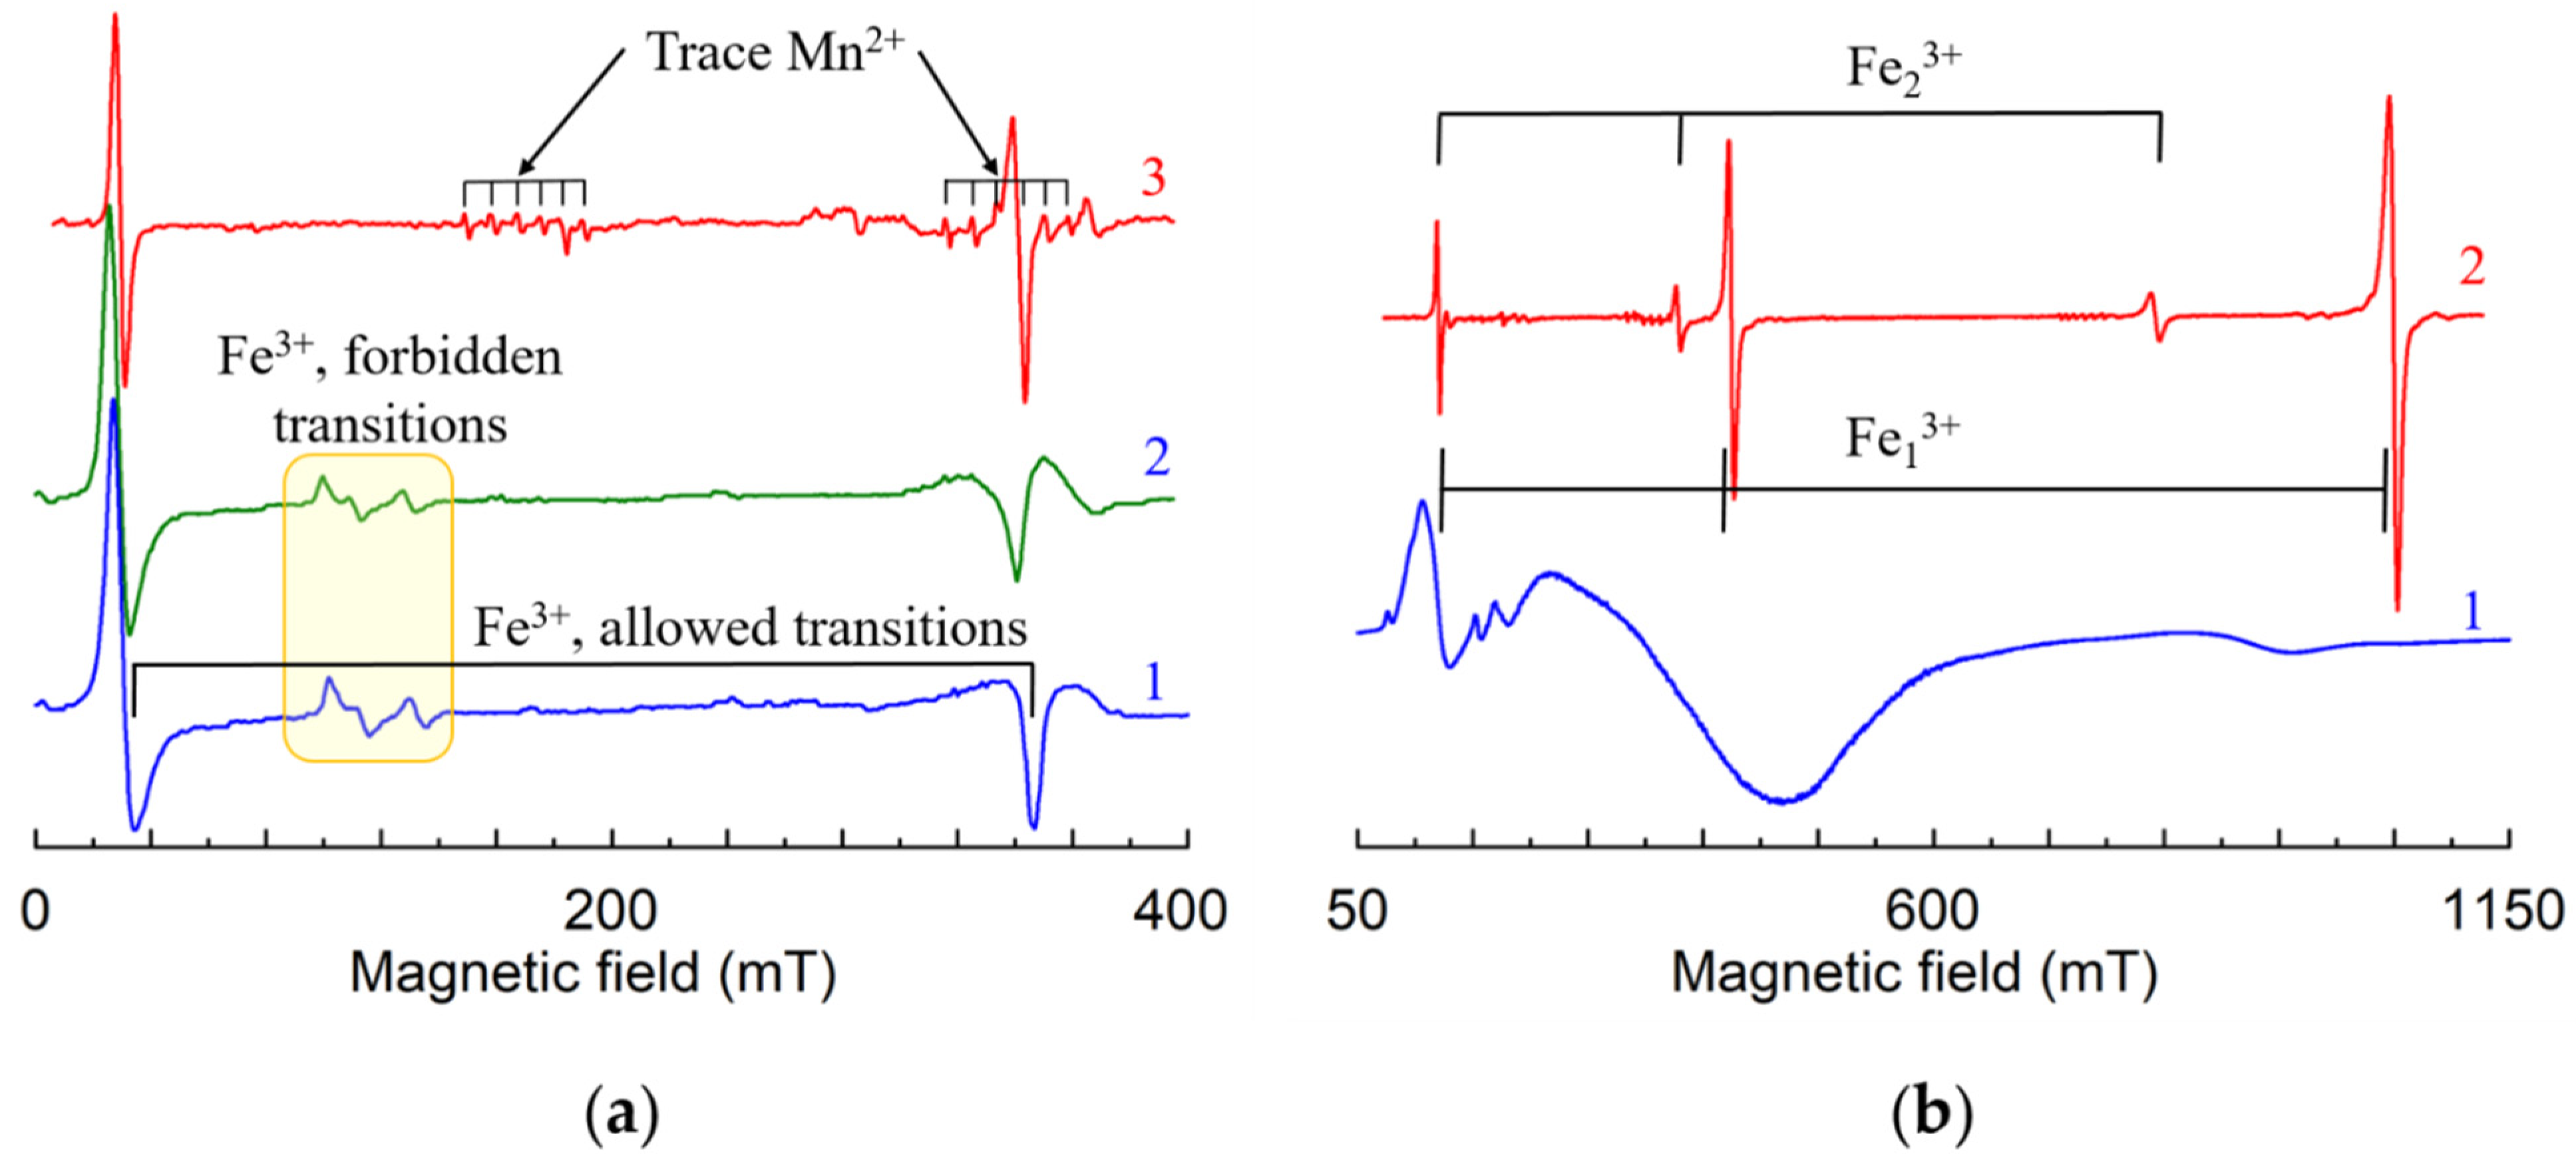
  • Lines of allowed transitions in LNK become symmetric—intensities of left (up) and right (down) wings become equal.
  • Lines of forbidden transitions (see yellow box on Figure 18) disappear in LNK.
In LNK the EPR lines become narrower (up to dozen times at some magnetic field orientation). The narrowing strongly increases spectral resolution. This allows to register even trace impurities in undoped (nominally pure) LNK samples (see lines of Fe3+ and Mn2+ on Figure 18a, 3).
aA brief glance on history of sLN for curios researchers. Looking for better crystals, G. I. Malovichko asked crystal growers for different samples of LN and LT. Dr. E. P. Kokanyan (at that time, one of the engineers in the group of Dr. V. T. Gabrielyan) was interested to grow crystals under various conditions (melt composition xm, growth under applied electric field, variation of temperature, etc.). He has prepared for her a set of non-stoichiometric LN samples grown from melts with xm from 43% to 60%. During her PhD research of LN and LT of different compositions, Malovichko found that EPR lines become narrower and more symmetric in samples grown with larger xm. Dr. V. G. Grachev has simulated EPR spectra with random distributions of non-axial components of ZFS, b 2 q (q ≠ 0) for Cr3+ and Fe3+ and confirmed that line width and asymmetry, as well as intensities of forbidden transitions are related to intrinsic defects in non-stoichiometric samples [43]. In 1991, on Malovichko’s request Dr. Kokanyan has grown several congruent samples with 2, 4, and 6% of K2O in the melt (LNK). First EPR measurement has surprisingly shown narrow symmetrical lines in LNK with traces of Fe3+ (Figure 18a, 3). Based on the experience of studies of Li-rich samples, it was concluded that the concentration of intrinsic defects in LNK is smaller than in LN grown from the melt with xm = 60%, and that K2O may serve as a catalyst in electrochemical reaction of crystal growth [56]. As abilities of research techniques in Ukraine were limited, Dr. Malovichko asked Prof. O. F. Schirmer (Osnabrueck University, Germany) for an international collaboration. Prof. Schirmer was very enthusiastic and has quickly managed to involve many of his colleagues in the investigation of LNK properties. K. Betzler, B. Faust, B. Gather, F. Jermann, S. Klauer, U. Schlarb, M. Wesselmann, M. Woehlecke and others participated in the LNK study by different techniques resulting in publications [57,69,77].
All these features are the result of significant reduction of intrinsic defects in LNK samples. Estimations of crystal composition xC made by different methods [59,68,77,79] have shown that xC can exceed 49.8–49.9%, i.e., LNK is really a stoichiometric crystal.
As for other impurities, the lack of intrinsic defects in LNK:Fe has led to the appearance of centers where impurities substitutes for Nb. Two additional axial Fe3+ centers named Fe3 and Fe4 were observed in LNK [69]. Their ZFS are b 2 0 = 0.0495 and b 2 0 = 0.0688 cm−1. Compared with Fe2, the Fe3 and Fe4 centers were also assigned to Fe3+ in Nb sites with different charge compensation. The Fe3+ center with b 2 0 = 0.0656 cm−1 (that is very close to b 2 0 for Fe4) was observed in VTE treated stoichiometric LN [76]. Therefore, Fe4, Fe3, and Fe2 were attributed to FeNb with different charge compensator ions in nearest structural vacancy voct: Fe4—non-regular, interstitial Li+v (Figure 19a), Fe3–K+v, and Fe2–Mg2+v. Two Li+v (Figure 19b), or interstitial Mg2+v or two Mg2+Li+ are required for full charge compensation of Fe3+Nb5+. Our measurements of EPR in LN:Mg show angular patterns with extrema at 15, 45 and 75 degrees in xy plane. It is why we think that models with two differently located Mg2+Li+ (Figure 19c,d) are more suitable for FeNb (similar to models with two vLi for FeLi). ENDOR measurements could confirm some of these reasonable assignments.
Dominant Fe13+ center in cLT has b 2 0 = 0.33 cm−1 [38,225] (Figure 18b, 1), and according to ENDOR data [38] it is definitely Fe3+Li. Line narrowing in nsLT grown by double crucible Czochralski method from an Li rich melt composition (about 60 mol.% Li2O) allowed to determined b20 more accurately [226].
The main features of the spectra in sLT obtained by VTE treatment are strong line narrowing, higher resolution, and a clear presence of the second axial Fe23+ center with b 2 0 = 0.205 cm−1 (Figure 18b, 2) [75]. Comparison of calculated angular dependences of ENDOR frequencies for Li and Nb substitution using Equation (6) with measured ones (Figure 20) obviously shows that in the case of Fe2 center the Fe3+ ion substitutes for Nb. Both Fe1 and Fe2 centers in sLT have C3 symmetry. No foreign nuclei in the nearest neighborhood were detected for Fe1. As sLT still have some residual concentration of vLi, the charge compensators for Fe1 centers are one vLi on center axis (shells 5a, 5b on Figure 7) and probably one other distant vLi (any vacancy cannot be directly detected by ENDOR).
A pair of ENDOR lines for Fe2 (fuchsia line on Figure 20b) were attributed to the additional Li+v in the nearest voct at the distance about 0.277 nm from Fe3+Nb. It is difficult to make a choice between two models on Figure 19a,b as lines of the second Li+i in the next or next-next voct are not identified yet. The ratio of concentrations of Fe2 and Fe1 centers changed from less than 0.2 for Fe concentrations 1.1 × 1019 cm−3 to about 1 for 6.7 × 1019 cm−3 in the crystals. Therefore, there are three different mechanisms for excessive charge compensation: distant vLi for small concentrations of Fe3+Li+, partial self-compensation of charges of Fe3+Li+ by Fe3+Nb5+ and partial compensation of Fe3+Nb5+ by Li+ in voct for Fe3+ concentrations, which exceed the concentration of vLi.
Gd3+ (4f7, S = 7/2). The EPR spectrum for every Gd3+ center consists of 2S + 1 = 8 strong lines of fine structure and many low intensity lines of so called forbidden transitions due to nearly equal values of Zeeman splitting and ZFS. Results of the first EPR study [227], were interpreted as a presence of two axial Gd1 and Gd2 centers with b 2 0 = 0.118 and b 2 0 = 0.126 cm−1. From the viewpoint of charge compensation, a preference was given to Gd3+ substitution for Nb5+. A small rhombic distortion ( b 2 2 ≈ 0.004) determined for Gd2 [228] was attributed to an off axis charge compensator, while for Gd1 the charge compensator may either be absent or must lie on the same threefold axis as Gd3+. However, no decision on whether Gd3+ substitutes for Li+ or Nb5+ or for both was made. Similar results with slightly smaller b 2 2 ≈ 0.002 were also reported [229].
At least four different Gd3+ centers were identified in our study of Li-rich LN doped with 1 wt.% Gd2O3 in the melt. As patterns for every EPR transition in xy-plane (Figure 21) are very similar to presented on Figure 4b and Figure 15, the divacancy model is suitable for Gd3+ in LN. Gd3+ substitutes for Li+ in all centers. The dominant axial Gd1 center and low-symmetry Gd2, Gd3, and Gd4 centers have vLi in positions described in Table 1. This assignment agrees with the Gd substitution for Li found by RBS and PIXE channeling [31].
Nd3+ (4f3) First EPR spectra have shown that in cLN Nd3+ creates an axial center with g ≈ 1.43 and g ≈ 2.95 (Nd1) [143,144,230] and second center with g ≈ 1.33 and g ≈ 2.95 (Nd2) [143]. EPR/ENDOR studies in sLN [91,92,93] has established that Nd3+ substitutes for Li+, and resolved eight different Nd3+ centers. Divacancy models explain angular dependencies of EPR spectra for the whole family of Nd3+ centers [93], and Section 3.1 of this paper.
It is supposed that Nd3+ center found in LN:Mg and LN:Zn belong to Nd3+ substituted for Nb [231].
Ti3+ (3d1, S = 1/2) EPR spectrum of Ti3+ consist of one line with g≈1.961 and g ≈ 1.840 in LN [232,233,234], and g = 1.948, and g = 1.827 in reduced LT [235]. An axial EPR signal observed in vacuum annealed LiNbO3 single crystals doped with 8 mol.% Mg and 0.05 mol.% Ti has g = 1.760 and g = 1.786 for T = 5 K and g = g = 1.893 for T = 74 K. The signal has been attributed to Ti3+ on Nb site [236,237,238,239,240]. The g tensor components of these centers were explained by a model calculation involving a dynamic pseudo Jahn-Teller effect. Spin-orbit coupling, lattice vibration, pseudo Jahn-Teller interaction, and the Zeeman term were treated on equal footing. Electron transfer from the observed Ti3+Nb center to lattice niobiums, resulting in Nb4+ trapped polarons, has been stimulated by illumination in the near UV region.
Yb3+ (4f13) The EPR lines of Yb3+ in congruent LN are very broad (Figure 22a,c) [241]. The axial center Yb1 with g ≈ 4.7–4.86 and g ≈ 2.7 was observed in cLN with 0.5–1.2 wt.% Yb2O3 in the melt [144,230,241]. The second Yb23+ center with g≈1.9 and g ≈ 2.8 was found in LN:Mg [241]. By comparison of these observations with EPR data for Cr3+, Er3+, Fe3+, and Ti3+ in LN and LN:Mg the Yb1 center was tentatively assigned to Yb3+Li and Yb2 center to Yb3+Nb. A variation of lattice parameters found in cLN:Yb supported Yb3+substitution for Li compensated by Li+ vacancy [242].
Complicated EPR spectra without 60 deg repetitions in xy plane were registered in cLN doped with 1wt.% Yb, and cLN doubly doped with 0.8 wt.% of Yb and 0.1 wt.% of Pr [243,244,245,246,247]. Some of the spectra were attributed to Yb3+ pairs with the parameter of isotropic exchange interaction J = −0.0283 cm1.
Our study of LNK crystals doped with 0.02 wt.% Yb2O3 has shown that the broad line observed in cLN belongs in reality to a family of at least 8 different centers (Figure 22b,d) [92,248,249]. Hyperfine structures from isotopes 171Yb (I = 1/2, natural abundance 14.4%) and 173 (I = 5/2, 16.6%) that are barely distinguished in cLN, were well resolved in LNK (see Figure 22 and Figure 23). The dominant Yb1 line that represents even isotopes with I = 0 (evenYb, 69%) was described with g = 4.46, g = 2.706. Intensities of the Yb3+ lines were proportional to natural abundances of isotopes and their spins: (even):(171):(173) = 0.69:0.144/2:0.166/6 = 0.69:0.072:0.028. It was found for Yb1 that 171A = 0.119 cm−1, and 171A = 0.0715 cm−1. Branches of angular dependencies of the Yb5 center (fuchsia lines on Figure 22) were described with spin-Hamiltonian for S = 1 and anisotropic SAJSB interaction (Jik ≈ 0.012–0.066 cm−1). They were assigned to low-symmetry Yb3+–Yb3+ pairs. The presence of additional lines of hyperfine structure with similar angular dependence (indicated by red arrows in Figure 23) supports the assignment, as their intensities are proportional to probabilities to meet two evenYb, or one evenYb and one 171Yb, or one evenYb and one 173Yb in such pairs. A self-compensated pair consisted of Me3+Li and Me3+Nb in the nearest sites (Nb shell 1 at a distance 0.3 nm on the crystal axis, Figure 5a) creates an axial center with rather strong exchange interaction (Jiso > 300 cm−1). Therefore, the observed low-symmetry pairs were attributed to the Yb3+–Yb3+ ions in next neighbor or next-next neighbor positions (shells 2 and 3 on Figure 5a).
One of the satellite centers (Yb6) has axial symmetry; all others are low-symmetry centers. ENDOR measurements has revealed that Yb3+ substitutes for Li: at the first, comparison of measured angular dependencies with calculated ones on the base of dipole-dipole interactions (Equation (3)) gave undisputable preference for Li site, and at the second, the strongest axial hyperfine interaction was found for 93Nb on the z-axis (the first shell on Figure 5a). The most reasonable explanation for the existence of the whole family of ytterbium centers is that Yb3+Li is compensated by one or two vLi in different configurations.

4.4. Tetra-, Penta- and Heptavalent Cations

The non-paramagnetic tetravalent impurities (C and Si) are always present in LN in rather high concentrations (about 50–500 ppm). Since determined concentrations of chlorine Cl (50–500 ppm) and manganese Mg (1–100 ppm) have the same order of magnitudes, no other charge compensators are necessary if C or Si substitutes for Nb creating C4+Nb – ClO2− or C4+Nb – Mg2+Li. The additional possibilities for the charge compensation supply H+ and Li+v ions. It is supposed that Ti4+ substitutes for Nb5+; however, at present a mechanism of its charge compensation is not well established.
Due to the lithium deficiency of congruent lithium niobate crystals, vLi have been considered as possible charge compensators for Nb5+Li+ or Ta5+Li+ antisites for a long time. Models with plane and space configurations of vLi for non-stoichiometric defects were proposed [96,97] and used for calculations of stability of intrinsic defects and defect clusters in LN [250,251,252,253] and LN:Mg [254]. The antisites become paramagnetic ions Nb4+Li+ or Ta4+Li+ after irradiation (see Section 4.5 below).
The Ta5+ substitution for Nb5+ in LN causes minor lattice distortions only. The heptavalent ions (Mo, W) probably substitute for Nb5+ having lithium vacancies as charge compensators.
U5+ (5f1). EPR spectra of U5+ were studied in LiNbO3 powders doped with natural U3O8 and 233U3O8. A hyperfine sextet of EPR line for 233U (I = 5/2) was described with A = 0.0145 and A = 0.0128 cm−1. g = 0.71, g = 0.724 were determined for the line of natural U5+ (even isotopes with I = 0 have total natural abundance about 99%). It was observed that U5+ takes part in photoinduced valence change which is the basic mechanism for photorefraction.

4.5. Radiation and Reduction Defects

A radiation usually recharges of regular lattice, interstitial and impurity ions or produces interstitial ions. Two kinds of recharged defects were observed in LN: electron traps like Nb4+ and hole traps like O ions [236,255,256].
Nb4+ (4d1). Hyperfine interaction of the unpaired 4d1 electron with the 93Nb nuclear spin I = 9/2 splits its EPR line into ten components. The ten-line EPR spectrum (g = 1.90 and g = 1.72) has been described for congruent LiNbO3 after ionizing radiation [257]. Later this spectrum has been reproduced in vacuum-reduced and UV bleached crystals [258,259,260,261] (Figure 24, 1) and ascribed to antisite Nb [255]). It is remarkable that at least part of the Nb4+ centers has C1 symmetry [262], although the main possible positions for Nb (regular Nb and Li site, voct) have C3 symmetry. It means that compensating defects for Nb4+, most probably lithium vacancies, are located in the nearest neighborhood (Figure 25a,b).
Similar spectra were observed in LiNbO3 doped with 6 mol.% Mg (Figure 24, 2) after X-irradiation or vacuum reduction treatments and were related to Nb4+ centers on niobium sites [104,113,114], obviously with nearby defects. The Nb4+ center in LiNbO3 doped with 10 mol.% Mg belongs to Nb in regular position, but with Mg2+Li in neighborhood (Figure 24, 3) [238,263]. The neighboring Mg2+ ion redistributes a cloud of Nb4+ electrons and changes the hyperfine splitting.
Ta4+ (5d1). The isotope 181Ta has I = 7/2 and 100% natural abundance. The eight-line axial EPR spectrum with g = 1.503 and g = 1.172, A = 0.0023, and A = 0.0234 cm−1 has been observed in LiTaO3 after reduction in argon and attributed to axial Ta4+Li [257]. Other ways to obtain Ta4+ are an irradiation of as-grown crystals with X-rays or optical bleaching of crystals that had been previously reduced [264]. A possible model for axial Ta4+ center is similar to the presented on Figure 25a.
Tb4+ (4f7). EPR study at 15 K revealed a signal of g ≈ 2.0 appearing after UV irradiation with a simultaneous decrease in the Fe3+ signal intensity in near-stoichiometric LiNbO3:Tb and LiNbO3:Tb:Fe [265]. This implies that the Fe3+ ions act as electron traps. Irradiation by UV light induced an absorption band extending from λ ≈ 650 nm to the absorption edge caused by the charge transfer from UV-sensitive absorption centers to Fe3+ ions via the conduction band.
Other electron and hole traps. A trapped-hole center with S = 1/2 was produced in LiNbO3 by ionizing radiation [266]. Its ESR spectrum contains at least 26 equally spaced lines with 1.54 mT separation at B||z. This hyperfine pattern was explained as one “hole” interacting equally with three 93Nb nuclei (I = 9/2 and 100% abundant). The hole is equally shared by three equivalent oxygen ions adjacent to a cation vacancy. A center with 25 lines of hyperfine interaction with two 7Li and two 93Nb nuclei was ascribed to O in regular O2− site with unclear stabilizing factor for the hole trap [236].
An OH2− ion was identified in undoped and weakly doped with Mg LN samples after γ-irradiation and subsequent partial UV bleaching [109]. Specific hyperfine structure with 93Nb was observed for a hole trap in LN doped with 6–8 mol.% Mg. The center was attributed to O near Mg2+ ion substituted for Nb5+ (Figure 25c) [263].

5. Impurity Identification

At an investigation of a sample grown from a melt with an addition of a paramagnetic spice in concentration 0.00X–0.X at.%, which warrants that EPR signal significantly exceeds noise, it would be reasonable to expect EPR signal from this spice. Often, studied samples (especially, commercial ones) contain so-called non-controlled or trace impurities like Cr, Mn, Fe, Cu etc. in a slightly smaller or comparable concentration. Fortunately, most paramagnetic impurities are already investigated by EPR/ENDOR techniques and their characteristics—electron and nuclear spins, zero-field splitting, hyperfine and quadrupole interactions, kinds of charge compensators and their locations, i.e., “passports” of the impurities—are known. Comparison of published and observed spectra (see, for instance, figures with EPR spectra and their angular dependencies above) allows to identify the impurities in films, epitaxial layers, and fibers, or to evaluate profile of impurity distribution in bulk samples. Spectra of LN/LT powders and ceramics can be simulated using determined spin-Hamiltonian parameters.

6. Conclusions

Very detailed information about structures of impurity defects (charge state, point symmetry, hyperfine interactions with neighbor nuclei, charge compensation mechanisms etc.) was obtained with the help of EPR and ENDOR.
The necessity of a charge compensation for non-isovalent substitution usually leads to the creation of families of electrically and magnetically non-equivalent impurity centers. The families of satellite centers exist due to the different relative locations of the impurity ion and its charge compensator. Two or more different centers were observed for Co2+, Cr3+, Cu2+, Er3+, Fe3+, Gd3+, Mn2+, Nd3+, Yb3+, and other ions. Since the relative concentrations of satellite centers are comparable with the concentration of the main center, both kinds of centers generally are equally responsible for many of the properties of LN/LT crystals, and they should both be taken into consideration, especially in non-stoichiometric crystals.
Several different mechanisms for a compensation of excessive charge of Me impurity were found:
  • the compensation by nonstoichiometric defects (vLi, vNb) for small concentrations of MeLi in crystals,
  • the partial self-compensation of charges of MeLi by MeNb mainly for the MeLi concentration that exceeds the concentration of vLi,
  • the partial compensation of MeNb by interstitial Li+ in voct,
  • the compensation by other impurities (H, co-dopants like Mg, Zn, etc.).
The presence of non-stoichiometric defects is one of the reasons why LN tolerates a strong incorporation of dopants non-isovalent to Li+ and Nb5+. As long as the impurity concentration [Me] is smaller than δxC = |50% − xC|, the number of intrinsic defects is large enough to compensate the corresponding charge excess. However, for stoichiometric or nearly stoichiometric samples with high impurity concentrations (when [Me] > δxC) and with the lack of charge compensators a decrease of the distribution coefficient of impurities is observed in comparison with congruent material. A further increase of the [Me]/δxC ratio up to [Me] >> δxC can result in a change of the charge compensation mechanism. This can reveal itself in the appearance of new impurity centers.
The charge compensation by vLi works well for most of the non-isovalent ions. Vacancies in the nearest neighborhood of MeLi decrease symmetry of centers from C3 to C1, whereas distant vacancies cause spectral line broadening. For Me3+Nb/Ta in stoichiometric LN/LT the charge compensation by interstitial H+ and Li+v ions was found. The interstitial Li+v should be considered as a concurrent charge compensation mechanism in VTE treated samples. The compensation of MeNb by MgLi, ZnLi and other impurities occurs when the co-dopant concentration exceeds some threshold that depends on δxC. Typically, the threshold is about 6–8% for congruent samples, but it is lower than 1% for nearly stoichiometric samples.
The use of stoichiometric or nearly stoichiometric crystals with δxC ≈ 0 presents many advantages for the investigation of impurity centers by spectroscopic techniques. The decreased concentration of intrinsic defects causes a tremendous narrowing of the spectral lines. This is accompanied with the increase of spectral resolution and sensitivity, facilitates the analysis of the spectra, and simplifies the interpretation of the data. However, together with the disappearance of intrinsic defects the satellite centers disappear also. For a detailed investigation of such additional centers, the crystals with high xC ≈ 49.5–49.85% are more suitable than others: they have more narrow spectral lines than congruent samples, but the satellite centers are still present. Further study of nearly stoichiometric and stoichiometric LN and LT samples should help to eliminate some disagreements in published data and to clarify intimate details of structures of impurity defects in materials, which are important for both physics and applications.
Derived structures and obtained by EPR/ENDOR characteristics of Zeeman and zero-field splitting, quadrupole and hyperfine interactions of impurity electrons with own and surrounding nuclei can be reliable corner stones for modelling of the structures.

Author Contributions

V.G.G.—theorist (yin), and G.I.M.—experimentalist (yang) made inseparable complementary contributions. All authors have read and agreed to the published version of the manuscript.

Funding

The publishing fee is covered by V.G.Grachev, SimuMag, Bozeman, MT, USA.

Institutional Review Board Statement

Not applicable.

Informed Consent Statement

Not applicable.

Data Availability Statement

The data presented in this study are available on request from the corresponding author.

Conflicts of Interest

The authors declare no conflict of interest.

References

  1. Räuber, A. Chemistry and Physics of Lithium Niobate. In Current Topics in Materials Science, 1st ed.; Kaldis, E., Ed.; North-Holland: Amsterdam, The Netherlands, 1978; Volume 1, pp. 481–601. [Google Scholar]
  2. Volk, T.; Wöhlecke, M. Point defects in LiNbO3. In Lithium Niobate. Defects, Photorefraction and Ferroelectric Switching, 1st ed.; Hull, R., Osgood, R.M., Jr., Parisi, J., Warlimont, H., Eds.; Springer Series in Materials Science; Springer: Berlin/Heidelberg, Germany, 2009; Volume 115, pp. 1–50. [Google Scholar]
  3. Ilyenkov, A.V.; Khiznyak, A.I.; Kreminskaya, L.V.; Soskin, M.S.; Vasnetsov, M.V. Birth and evolution of wave-front dislocations in a laser beam passed through a photorefractive LiNbO3: Fe crystal. Appl. Phys. B 1996, 62, 465–471. [Google Scholar] [CrossRef]
  4. Prokhorov, A.M.; Kuz’minov, Y.S. Physics and Chemistry of Crystalline Lithium Niobate; CRC Press: Boca Raton, FL, USA, 1990. [Google Scholar]
  5. Properties of Lithium Niobate; Wong, K.K. (Ed.) EMIS Data Review Series No. 5; The Institution of Electrical Engineers, INSPEC: London, UK, 2002. [Google Scholar]
  6. Toney, J.E. Lithium Niobate Photonics; Artech House Publishers: London, UK, 2015; pp. 1–265. [Google Scholar]
  7. Streque, J.; Aubert, T.; Kokanyan, N.; Bartoli, F.; Taguett, A.; Polewczyk, V.; Kokanyan, E.; Hage-Ali, S.; Boulet, P.; Elmazria, O. Stoichiometric Lithium Niobate Crystals: Towards Identifiable Wireless Surface Acoustic Wave Sensors Operable up to 600 °C. IEEE Sens. Lett. 2019, 3, 2501204. [Google Scholar] [CrossRef]
  8. Abrahams, S.C.; Reddy, J.M.; Bernstein, J.L. Ferroelectric lithium niobate. 3. Single crystal X-ray diffraction study at 24 °C. J. Phys. Chem. Solids 1966, 27, 997–1012. [Google Scholar] [CrossRef]
  9. Peterson, G.E.; Bridenbaugh, P.M.; Green, P. NMR Study of Ferroelectric LiNbO3 and LiTaO3. J. Chem. Phys. 1967, 46, 4009–4014. [Google Scholar] [CrossRef]
  10. Vianden, R. Hyperfine techniques for defects studies. In Insulating Materials for Optoelectronics. New Developments; Agulló-López, F., Ed.; World Scientific Publishing: Singapore; Hackensack, NJ, USA; London, UK; Hong Kong, China, 1995; pp. 125–146. [Google Scholar]
  11. Kling, A.; Soares, J.C.; da Silva, M.F. Channeling Investigation of Oxide materials for Optoelectronic Applications. In Insulating Materials for Optoelectronics. New Development; Agulló-López, F., Ed.; World Scientific Publishing: Singapore; Hackensack, NJ, USA; London, UK; Hong Kong, China, 1995; pp. 175–200. [Google Scholar]
  12. Gog, T.; Marerlik, G. X-ray Standing Wave Determination of Lattice Positions of Impurities in Lithium Niobate. In Insulating Materials for Optoelectronics. New Developments; Agulló-López, F., Ed.; World Scientific Publishing: Singapore; Hackensack, NJ, USA; London, UK; Hong Kong, China, 1995; pp. 201–220. [Google Scholar]
  13. Spaeth, J.-M.; Niklas, J.R.; Bartram, R.H. Structural Analysis of Point Defects in Solids: An Introduction to Multiple Magnetic Resonance Spectroscopy; Springer: Singapore, 1992; pp. 1–367. [Google Scholar]
  14. Prieto, C. Influence of lithium niobate stoichiometry on the lattice position of Nd3+ in Nd:LiNbO3. Opt. Mater. 1999, 12, 135–142. [Google Scholar] [CrossRef]
  15. Lorenzo, A.; Jaffrezic, H.; Roux, B.; Boulon, G.; Garcia-Sole, J. Lattice location of rare-earth ions in LiNbO3. Appl. Phys. Lett. 1995, 67, 3735–3737. [Google Scholar] [CrossRef]
  16. Lorenzo, A.; Loro, H.; Muñoz Santiuste, J.E.; Terrile, M.C.; Boulon, G.; Bausa, L.E.; Garcia Sole, J. RBS/channeling to locate active ions in laser materials: Application to rare earth activated LiNbO3. Opt. Mater. 1997, 8, 55–63. [Google Scholar] [CrossRef]
  17. Rebouta, L.; Smulders, P.J.M.; Boerma, D.O.; Agullo-Lopez, F.; da Silva, M.F.; Soares, J.C. Ion-beam channeling yields of host and impurity atoms in LiNbO3: Computer simulations. Phys. Rev. B 1993, 48, 3600–3610. [Google Scholar] [CrossRef]
  18. Rebouta, L.; da Silva, M.F.; Soares, J.C.; Santos, M.T.; Dieguez, E.; Agulló-López, F. Ion-beam/channeling characterization of LiNbO3: Interaction between impurity sites. Opt. Mater. 1995, 4, 174–178. [Google Scholar] [CrossRef]
  19. Garcia Sole, J.; Petith, T.; Jaffrez, H.; Boulon, G. Lattice Location of the Non-Equivalent Nd3+ Ions in LiNbO3: Nd and LiNbO3: MgO:Nd. Europhys. Lett. 1993, 24, 719–724. [Google Scholar] [CrossRef]
  20. Vila, M.; de Bernabe, A.; Prieto, C. EXAFS determination of the Nd lattice position in Nd:LiNbO3: Influence of lithium niobate stoichiometry and Mg and Zn co-doping. J. Alloys Compd. 2001, 323–324, 331–335. [Google Scholar] [CrossRef]
  21. Catlow, C.R.A.; Chadwick, A.V.; Cole, M.; Tomlinson, S.M. An EXAFS study of dopant substitution in LiNbO3 and LiTaO3. Radiat. Eff. Defects Solids 1991, 119–121, 565–570. [Google Scholar] [CrossRef]
  22. Bush, T.S.; Catlow, C.R.A.; Chadwick, A.V.; Cole, M.; Geatches, R.M.; Greaves, G.N.; Tomlinson, S.M. Studies of cation dopant sites in metal oxides by EXAFS and computer-simulation techniques. J. Mater. Chem. 1992, 2, 309–316. [Google Scholar] [CrossRef]
  23. Prieto, C.; Zaldo, C. Determination of the lattice site of Fe in photorefractive LiNbO3. Solid State Commun. 1992, 83, 819–821. [Google Scholar] [CrossRef]
  24. Zaldo, C.; Prieto, C. Lattice site of transition metal and rare-earth impurities in LiNbO3 single crystals: An exafs study. Ferroelectrics 1992, 134, 47–51. [Google Scholar] [CrossRef]
  25. Corradi, G.; Chadwick, A.V.; West, A.R.; Cruickshankand, K.; Paul, M. On the substitution site of Cr and Fe in LiNbO3: An exafs study. Radiat. Eff. Defects Solids 1995, 134, 219–222. [Google Scholar] [CrossRef]
  26. Sanson, A.; Zaltron, A.; Argiolas, N.; Sada, C.; Bazzan, M.; Schmidt, W.G.; Sanna, S. Polaronic deformation at the Fe2+/3+ impurity site in Fe:LiNbO3 crystals. Phys. Rev. B 2015, 91, 094109. [Google Scholar] [CrossRef]
  27. Rebouta, L.; da Silva, M.F.; Soares, J.C.; Hage-Ali, M.; Stoquert, J.P.; Siffert, P.; Sanz-García, J.A.; Diéguez, E.; Agulló-López, F. Lattice Site of Iron in LiNbO3(Fe3+) by the PIXE/Channelling Technique. Europhys. Lett. 1991, 14, 557–561. [Google Scholar] [CrossRef]
  28. Gog, T.; Schotters, P.; Falta, J.; Materlik, G.; Grodzicki, M. The lattice position of Fe in Fe-doped LiNbO3. J. Phys. Condens. Matter 1995, 7, 6971–6980. [Google Scholar] [CrossRef]
  29. Marques, J.G.; Kling, A.; Soares, J.C.; Rebouta, L.; da Silva, M.F.; Diéguez, E.; Agulló-López, F. Lattice site location of Hf in LiNbO3: Influence of dopant concentration and crystal stoichiometry. Nucl. Instrum. Methods Phys. Res. B 1998, 136–138, 431–435. [Google Scholar] [CrossRef]
  30. Mignotte, C. Determination of lattice site locations of erbium ions implanted into LiNbO3 single crystals after annealing at moderate and high temperature. Appl. Surf. Sci. 2001, 185, 11–26. [Google Scholar] [CrossRef]
  31. Kovacs, L.; Rebouta, L.; Soaresh, J.C.; da Silva, M.F.; Hage-Ali, M.; Stoquert, J.P.; Siffert, P.; Sanz-Garcia, J.A.; Corradi, G.; Szaller, Z. On the lattice site of trivalent dopants and the structure of Mg2+-OH--M3+ defects in LiNbO3:Mg crystals. J. Phys. Condens. Matter 1993, 5, 781–794. [Google Scholar] [CrossRef]
  32. Kling, A.; Soares, J.C.; da Silva, M.F.; Sanz-Garcia, J.A.; Dieguez, E.; Agullo-Lopez, F. Lattice site determination of Cr in low doped lithium niobate single crystals using PIXE/channeling. Nucl. Instrum. Methods Phys. Res. B 1998, 136–138, 426–430. [Google Scholar] [CrossRef]
  33. Engelmann, H.; Mouahid, F.; Dezsi, I.; Molnar, B.; Gonser, U.; Siebert, D.; Dahlem, J.; Tuczek, F. Mössbauer and ESR study of LiNbO3-Fe2O3 for low Fe2O3 concentrations. Appl. Phys. A 1989, 48, 211–217. [Google Scholar] [CrossRef]
  34. Tomov, T.; Engelmann, H.; Dezci, I.; Gonser, U. Investigation of the ferroelectric phase transition in LiNbO3: Fe by Mössbauer spectroscopy. Solid State Commun. 1989, 69, 41–44. [Google Scholar] [CrossRef]
  35. Mignoni, S.; Fontana, M.D.; Bazzan, M.; Ciampolillo, M.V.; Zaltron, A.M.; Argiolas, N.; Sada, C. Micro-Raman analysis of Fe-diffused lithium niobate waveguides. Appl. Phys. B 2010, 101, 541. [Google Scholar] [CrossRef]
  36. Kamińska, A.; Suchocki, A.; Kobyakov, S.; Arizmendi, L.; Potemski, M.; Teran, F.J. High-pressure and magneto-optical studies of Cr-related defects in the lithium-rich LiNbO3:Cr, Mg crystal. Phys. Rev. B 2007, 76, 144117. [Google Scholar] [CrossRef]
  37. Basun, S.; Kaplyanskii, A.; Kutsenko, A.; Dierolf, V.; Troester, T.; Kapphan, S.E.; Polgar, K. Optical characterization of Cr3+ centers in LiNbO3. Appl. Phys. B 2001, 73, 453–461. [Google Scholar] [CrossRef]
  38. Sothe, H.; Rowan, L.G.; Spaeth, J.-M. Sites of Fe3+ impurities in a congruent LiTaO3 crystal. J. Phys. Condens. Matter 1989, 1, 3591–3600. [Google Scholar] [CrossRef]
  39. Sothe, H.; Spaeth, J.-M. The site and local environment of Fe3+ in LiNbO3 investigated with ENDOR. J. Phys. Condens. Matter 1992, 4, 9901–9906. [Google Scholar] [CrossRef]
  40. Spaeth, J.-M. Determination of atomic positions of point defects in solids by ENDOR. Appl. Magn. Reson. 1992, 3, 257–281. [Google Scholar] [CrossRef] [Green Version]
  41. Lerner, P.; Legras, C.; Dumas, J.P. Stoechiometrie des monocristaux de metaniobate de lithium. J. Cryst. Growth 1968, 3, 231–235. [Google Scholar] [CrossRef]
  42. Byer, R.L.; Young, J.F.; Feigelson, R.S. Growth of High-Quality LiNbO3 Crystals from the Congruent Melt. J. Appl. Phys. 1970, 41, 2320–2325. [Google Scholar] [CrossRef]
  43. Malovichko, G.I.; Grachev, V.G.; Gabrielyan, V.T.; Kokanyan, E.P. Widths and intensities of ESR lines of iron-group impurities in nonstoichiometric lithium niobate crystals. Sov. Phys. Solid State 1986, 28, 1453–1458. [Google Scholar]
  44. Iyi, N.; Kitamura, K.; Izumi, F.; Yamamoto, J.; Hayashi, T.; Asano, H.; Kimura, S. Comparative of defect structures in lithium niobate with different compositions. J. Solid State Chem. 1992, 101, 340–352. [Google Scholar] [CrossRef]
  45. Holman, R.L. Processing of Crystalline Ceramics; Palmour, H., Davis, R.F., Eds.; Plenum: New York, NY, USA, 1978; p. 343. [Google Scholar]
  46. Jundt, D.H.; Fejer, M.M.; Byer, R.L. Optical properties of lithium-rich lithium niobate fabricated by vapor transport equilibration. IEEE J. Quantum Electron. 1990, 26, 135–138. [Google Scholar] [CrossRef]
  47. Bordui, P.F.; Norwood, R.G.; Bird, C.D.; Calvert, G.D. Compositional uniformity in growth and poling of large-diameter lithium niobate crystals. J. Cryst. Growth 1991, 113, 61–68. [Google Scholar] [CrossRef]
  48. Bordui, P.F.; Norwood, R.G.; Jundt, D.H.; Fejer, M.M. Preparation and characterization of off-congruent lithium niobate crystals. J. Appl. Phys. 1992, 71, 875–879. [Google Scholar] [CrossRef] [Green Version]
  49. Jundt, D.H.; Fejer, M.M.; Norwood, R.G.; Bordui, P.F. Composition dependence of lithium diffusivity in lithium niobate at high temperature. J. Appl. Phys. 1992, 72, 3468–3473. [Google Scholar] [CrossRef] [Green Version]
  50. Fischer, C.; Kapphan, S.; Feng, X.-Q.; Cheng, N. Sharp R-lines in absorption and emission of Cr3+ in stoichiometric (VTE) LiNbO3. Radiat. Eff. Defects Solids 1995, 135, 199–202. [Google Scholar] [CrossRef]
  51. Furukawa, Y.; Sato, M.; Kitamura, K.; Yajima, Y.; Minakata, M. Optical damage resistance and crystal quality of LiNbO3 single crystals with various [Li]/[Nb] ratios. J. Appl. Phys. 1992, 72, 3250–3254. [Google Scholar] [CrossRef]
  52. Kitamura, K.; Yamamoto, J.; Iyi, N.; Kirnura, S.; Hayashi, T. Stoichiometric LiNbO3 single crystal growth by double crucible Czochralski method using automatic powder supply system. J. Cryst. Growth 1992, 116, 327–332. [Google Scholar] [CrossRef]
  53. Kitamura, K.; Furukawa, Y.; Iyi, N. Progress in single crystal growth of LiNbO3 using double crucible Czochralski method. Ferroelectrics 1997, 202, 21–28. [Google Scholar] [CrossRef]
  54. Kitamura, K.; Furukawa, Y.; Ji, Y.; Zgonik, M.; Medrano, C.; Montemezzani, G.; Guenter, P. Photorefractive effect in LiNbO3 crystals enhanced by stoichiometry control. J. Appl. Phys. 1997, 82, 1006–1009. [Google Scholar] [CrossRef]
  55. Furukawa, Y.; Kitamura, K.; Suzuki, E.; Niwa, K. Stoichiometric LiTaO3 single crystal growth by double crucible Czochralski method using automatic powder supply system. J. Cryst. Growth 1999, 197, 889–895. [Google Scholar] [CrossRef]
  56. Malovichko, G.I.; Grachev, V.G.; Yurchenko, L.P.; Proshko, V.Y.; Kokanyan, E.P.; Gabrielyan, V.T. Improvement of LiNbO3 microstructure by crystal growth with potassium. Phys. Status Solidi (a) 1992, 133, K29–K33. [Google Scholar] [CrossRef]
  57. Malovichko, G.I.; Grachev, V.G.; Kokanyan, E.; Schirmer, O.F.; Betzler, K.; Gather, B.; Jermann, F.; Klauer, S.; Schlarb, U. Characterization of stoichiometric LiNbO3 grown from melts containing K2O. Appl. Phys. A 1993, 56, 103–108. [Google Scholar] [CrossRef]
  58. Bermudez, V.; Dutta, P.S.; Serrano, M.D.; Dieguez, E. The effect of native defects on the domain structures of Fe—A case study by means of the addition of MgO and K2O to the congruent melt. J. Phys. Condens. Matter 1997, 9, 6097–6101. [Google Scholar] [CrossRef]
  59. Polgar, K.; Peter, A.; Kovacs, L.; Corradi, G.; Szaller, Z. Growth of stoichiometric LiNbO3 single crystals by top seeded solution growth method. J. Cryst. Growth 1997, 177, 211–216. [Google Scholar] [CrossRef]
  60. Balasanyan, R.N.; Vartanyan, E.S.; Gabrielyan, V.T.; Kazaryan, L.M. Method for Growing Lithium Niobate Single Crystals. Patent SU 845506 A1, 29 March 1979. Available online: https://www.elibrary.ru/item.asp?id=41087794 (accessed on 27 February 2000).
  61. Serrano, M.D.; Bermudez, V.; Arizmendi, L.; Dieguez, E. Determination of the Li/Nb ratio in LiNbO3 crystals grown by Czochralski method with K2O added to the melt. J. Cryst. Growth 2000, 210, 670–675. [Google Scholar] [CrossRef]
  62. Kokanyan, E.; Dieguez, E. New perspectives of lithium niobate crystals. J. Optoelectron. Adv. Mater. 2000, 2, 205–214. [Google Scholar]
  63. Polgar, K.; Peter, A.; Foldvari, I.; Szaller, Z. Structural defects in flux-grown stoichiometric LiNbO3 single crystals. J. Cryst. Growth 2000, 218, 327–333. [Google Scholar] [CrossRef]
  64. Polgár, K.; Péter, Á.; Földvári, I. Crystal growth and stoichiometry of LiNbO3 prepared by the flux method. Opt. Mater. 2002, 19, 7–11. [Google Scholar] [CrossRef]
  65. Polgár, K.; Péter, Á.; Pöppl, L.; Ferriol, M.; Földvári, I. Chemical and thermal conditions for the formation of stoichiometric LiNbO3. J. Crystal Growth 2002, 237–239, 682–686. [Google Scholar] [CrossRef]
  66. Grunskij, O.S.; Denisov, A.V.; Badmaev, T.V. A Method for Growing Doped Crystals of Lithium Niobate with a Composition close to Stoichiometric, and a Device for Its Implementation. Patent RU 2367730 C2, 29 November 2007. Available online: https://www.elibrary.ru/item.asp?id=37690005 (accessed on 20 September 2009).
  67. Lengyel, K.; Péter, Á.; Kovács, L.; Corradi, G.; Pálfalvi, L.; Hebling, J.; Unferdorben, M.; Dravecz, G.; Hajdara, I.; Szaller, Z.; et al. Growth, defect structure, and THz application of stoichiometric lithium niobate. Appl. Phys. Rev. 2015, 2, 040601. [Google Scholar] [CrossRef] [Green Version]
  68. Malovichko, G.; Grachev, V.; Schirmer, O. Interrelation of intrinsic and extrinsic defects—Congruent, stoichiometric, and regularly ordered lithium niobate. Appl. Phys. B 1999, 68, 785–793. [Google Scholar] [CrossRef]
  69. Malovichko, G.I.; Grachev, V.G.; Schirmer, O.F.; Faust, B. New axial Fe3+ centers in stoichiometric lithium niobate crystals. J. Phys. Condens. Matter 1993, 5, 3971–3976. [Google Scholar] [CrossRef]
  70. de Bernabe, A.; Prieto, C.; de Andres, A. Effect of stoichiometry on the dynamic mechanical properties of LiNbO3. J. Appl. Phys. 1995, 79, 143–148. [Google Scholar] [CrossRef]
  71. Garret, M.H.; Mnushkina, I.; Furukawa, Y.; Kitamura, K.; Halliburton, L.E.; Giles, N.C.; Setzler, S.D. Photorefractive Properties of Iron-Doped Congruent Lithium Niobate, and Iron-Doped K2O Flux Grown Stoichiometric Lithium Niobate. Proceedings of 1997 Topical Meeting on Photorefractive Materials, Effects and Devices, Chiba, Japan, 11–13 June 1997. [Google Scholar]
  72. Abdi, F.; Aillerie, M.; Bourson, P.; Fontana, M.D.; Polgar, K. Electro-optic properties in pure LiNbO3 crystals from the congruent to the stoichiometric composition. J. Appl. Phys. 1998, 84, 2251–2254. [Google Scholar] [CrossRef]
  73. Choi, Y.N.; Choh, S.H.; Park, I.W.; Koh, E.K.; Kim, S.S. Characterization of Stoichiometry of LiNbO3 Crystals by EPR and Raman Scattering Measurements. J. Korean Phys. Soc. 1998, 32, S643. [Google Scholar]
  74. Malovichko, G. Nonstoichiometry as a powerful tool for photorefractive material optimization. Lithium Niobate Crystals. In Advances in Photorefractive Materials, Effects and Devices; Andersen, P.E., Johansen, P.M., Pedersen, H.C., Petersen, P.M., Saffman, M., Eds.; Trends in Optics and Photonics; Optical Society of America: Washington, DC, USA, 1999; Volume 27. [Google Scholar] [CrossRef]
  75. Malovichko, G.; Petersen, R.; Bäuman, C.; Grachev, V. Second axial Fe3+ center in stoichiometric lithium tantalate. J. Appl. Phys. 2006, 100, 023911. [Google Scholar] [CrossRef]
  76. Razdobarin, A.G.; Basun, S.A.; Bursian, V.É.; Sochava, L.S.; Evans, D.R. A Fe[Nb]-Li center in stoichiometric LiNbO3 crystals: Mechanism of formation. Phys. Solid State 2010, 52, 706–711. [Google Scholar] [CrossRef]
  77. Schlarb, U.; Klauer, S.; Wesselmann, M.; Betzler, K. Determination of the Li/Nb ratio in lithium niobate by means of birefringence and Raman measurements. Appl. Phys. A 1993, 56, 311–315. [Google Scholar] [CrossRef]
  78. Kling, A.; Marques, J.G.; Correia, J.G.; da Silva, M.F.; Dieguez, E.; Agullo-Lopez, F.; Soares, J.C. Study of structural differences between stoichiometric and congruent lithium niobate. Nucl. Instrum. Methods Phys. Res. B 1996, 113, 293–295. [Google Scholar] [CrossRef] [Green Version]
  79. Kovacs, L.; Ruschhaupt, G.; Polgar, K.; Corradi, G.; Woehlecke, M. Composition dependence of the ultraviolet absorption edge in lithium niobate. Appl. Phys. Lett. 1997, 70, 2801–2803. [Google Scholar] [CrossRef]
  80. Dravecz, G.; Kovács, L. Determination of the crystal composition from the OH- vibrational spectrum in lithium niobate. Appl. Phys. B 2007, 88, 305–307. [Google Scholar] [CrossRef]
  81. Grachev, V.G. Visual EPR, Visual ENDOR Packages, Version 20.11. Available online: www.visual-epr.com (accessed on 1 June 2013).
  82. CrystalMaker Program, Version 2.7.7; CrystalMaker Software Ltd.: Oxford, UK; Available online: www.crystalmaker.com (accessed on 31 December 2011).
  83. Boysen, H.; Altorfer, F. A neutron powder investigation of the high-temperature structure and phase transition in LiNbO3. Acta Crystallogr. B 1994, 50, 405–414. [Google Scholar] [CrossRef]
  84. Hsu, R.; Maslen, E.N.; du Boulay, D.; Ishizawa, N. Synchrotron X-ray Studies of LiNbO3 and LiTaO3. Acta Crystallogr. B 1997, 53, 420–428. [Google Scholar] [CrossRef] [Green Version]
  85. Malovichko, G.; Cerclier, O.; Estienne, J.; Grachev, V.; Kokanyan, E.; Boulesteix, C. Lattice constants of K- and Mg-doped LiNbO3. Comparison with nonstoichiometric lithium niobate. J. Phys. Chem. Sol. 1995, 56, 1285–1289. [Google Scholar] [CrossRef]
  86. Lehnen, H.; Boysen, H.; Frey, F.; Hewat, A.; Radaelli, P. A neutron powder investigation of the high-temperature structure and phase transition in stoichiometric LiNbO3. Zeitschrift für Kristallographie 1997, 212, 712–719. [Google Scholar] [CrossRef] [Green Version]
  87. Malovichko, G.; Grachev, V.; Kokanyan, E.; Schirmer, O. Axial and low-symmetry centers of trivalent impurities in lithium niobate. Chromium in congruent and stoichiometric crystals. Phys. Rev. B 1999, 59, 9113–9125. [Google Scholar] [CrossRef]
  88. Abrahams, S.C.; Hamilton, W.C.; Reddy, J.M. Ferroelectric lithium niobate. 4. Single crystal neutron diffraction study at 24 °C. J. Phys. Chem. Solids 1966, 27, 1013–1018. [Google Scholar] [CrossRef]
  89. Megaw, H.D. A note on the structure of lithium niobate, LiNbO3. Acta Crystallogr. A 1968, 24, 583–588. [Google Scholar] [CrossRef]
  90. Abrahams, S.C.; Levinstein, H.J.; Reddy, J.M. Ferroelectric lithium niobate. 5. Polycrystal X-ray diffraction study between 24° and 1200 °C. J. Phys. Chem. Solids 1966, 27, 1019–1026. [Google Scholar] [CrossRef]
  91. Malovichko, G.; Grachev, V.; Okulov, S.; Kokanyan, E.; Henecker, F.; Hofstaetter, A.; Schirmer, O. EPR of Nd3+ in congruent and nearly stoichiometric lithium niobate. Phys. Status Solidi (b) 2005, 243, 1–7. [Google Scholar] [CrossRef]
  92. Malovichko, G.; Bratus, V.; Munro, M.; Kokanyan, E.; Okulov, S.; Grachev, V. Multifrequency spectroscopy of laser active centers Nd3+ and Yb3+ in nearly stoichiometric LiNbO3. Phys. Status Solidi (c) 2007, 4, 1346–1351. [Google Scholar] [CrossRef]
  93. Grachev, V.; Munro, M.; Kokanyan, E.; Malovichko, G. Determination of g-tensors of low-symmetry Nd3+ centers in LiNbO3 by rectification of angular dependence of electron paramagnetic resonance spectra. J. Appl. Phys. 2015, 118, 044103. [Google Scholar] [CrossRef]
  94. Blümel, J.; Born, E.; Metzger, T. Solid state NMR study supporting the lithium vacancy defect model in congruent lithium niobate. J. Phys. Chem. Solids 1994, 55, 589–593. [Google Scholar] [CrossRef]
  95. Zotov, N.; Boysen, H.; Frey, F.; Metzger, T.; Born, E. Cation substitution models of congruent LiNbO3 investigated by X-ray and neutron powder diffraction. J. Phys. Chem. Solids 1994, 55, 145–152. [Google Scholar] [CrossRef]
  96. Leroux, C.; Nihoul, G.; Malovichko, G.; Grachev, V.; Boulesteix, C. High resolution electron microscopy investigation of correlated defects in non-stoichiometric lithium niobate. J. Phys. Chem. Solids 1998, 59, 311–319. [Google Scholar] [CrossRef]
  97. Kim, S.; Gopalan, V.; Kitamura, K.; Furukawa, Y. Domain reversal and nonstoichiometry in lithium tantalate. J. Appl. Phys. 2001, 90, 2949–2963. [Google Scholar] [CrossRef]
  98. Abrahams, S.C.; Marsh, P. Defect structure dependence on composition in lithium niobate. Acta Crystallogr. B 1986, 42, 61–68. [Google Scholar] [CrossRef]
  99. Peterson, G.E.; Carnevale, A. 93Nb NMR linewidths in nonstoichiometric lithium niobate. J. Chem. Phys. 1972, 56, 4648–4851. [Google Scholar] [CrossRef]
  100. Araujo, R.M.; dos Santos Mattos, E.F.; Valerio, M.E.G.; Jackson, R.A. Computer Simulation of the Incorporation of V2+, V3+, V4+, V5+ and Mo3+, Mo4+, Mo5+, Mo6+ Dopants in LiNbO3. Crystals 2020, 10, 457. [Google Scholar] [CrossRef]
  101. Kuzminov, Y.; Osiko, V.V. Disorder of stoichiometry in lithium niobate crystals. Cryst. Rep. 1994, 39, 471–476. [Google Scholar]
  102. Fay, H.; Alford, W.J.; Dess, H.M. Temperature in LiNbO3 Crystals on Melt Composition. Appl. Phys. Lett. 1968, 12, 89. [Google Scholar] [CrossRef]
  103. Suzuki, T. Oxygen partial pressure dependence of optical absorption in lithium niobate. J. Cryst. Growth 1996, 163, 403–410. [Google Scholar] [CrossRef]
  104. Sweeney, K.L.; Halliburton, L.E.; Bryan, D.A.; Rice, R.R.; Gerson, R.; Tomaschke, H.E. Point defects in Mg-doped lithium niobate. J. Appl. Phys. 1985, 57, 1036–1044. [Google Scholar] [CrossRef]
  105. Erdei, S.; Ainger, F.W. Trends in the growth of stoichiometric single crystals. J. Cryst. Growth 1997, 174, 293–300. [Google Scholar] [CrossRef]
  106. Kovács, L.; Wohlecke, M.; Jovanović, A.; Polgár, K.; Kapphan, S. Infrared absorption study of the OH vibrational band in LiNbO3 crystals. J. Phys. Chem. Solids 1991, 52, 797–803. [Google Scholar] [CrossRef]
  107. Engelsberg, M.; de Souza, R.E.; Pacobahyba, L.H.; do Nascimento, G.C. Structural determination of hydrogen site occupation in proton-exchanged LiNbO3 by nuclear magnetic resonance. Appl. Phys. Lett. 1995, 67, 359–361. [Google Scholar] [CrossRef]
  108. Yevdokimov, S.V.; Yatsenko, A.V. Investigation of the Localization of H+ Ions in Stoichiometric LiNbO3. Crystallogr. Rep. 2003, 48, 542–546. [Google Scholar] [CrossRef]
  109. Rakitina, L.G.; Zaritskii, I.M.; Polgar, K. New hydrogen associated paramagnetic centre in LiNbO3. Appl. Magn. Reson. 1990, 1, 149–154. [Google Scholar] [CrossRef]
  110. Rosa, J.; Polak, K.; Kubatova, J. ESR and optical studies of impurity centres in γ- and X-irradiated LiNbO3. Phys. Status Solidi (b) 1982, 111, K85–K87. [Google Scholar] [CrossRef]
  111. Corradi, G.; Polgar, K.; Bugai, A.A.; Grachev, V.G.; Deryugina, N.I.; Rakitina, L.M.; Zaritskii, I.M. Models of Ni+ and Cu2+ impurity centers in LiNbO3. Sov. Phys. Solid State 1986, 28, 739–748. [Google Scholar]
  112. Zhang, H.-M.; Xiao, W.-B. Investigations on the EPR parameters and defect structures due to Jahn-Teller effect for the Cu2+ and Ni+ centers in LiNbO3. J. Alloys Compd. 2018, 745, 586–591. [Google Scholar] [CrossRef]
  113. Zaritskii, I.M.; Rakitina, L.G.; Polgar, K. Annealing and gamma irradiation effects on the ESR in LiNbO3:Mg crystals. Sov. Phys. State Solid 1995, 37, 1073–1978. [Google Scholar]
  114. Faust, B.; Müller, H.; Schirmer, O.F. Free small polarons in LiNbO3. Ferroelectrics 1994, 153, 297–302. [Google Scholar] [CrossRef]
  115. Mirzakhanyan, A.A.; Petrosyan, A.K. EPR and optical absorption of Co2+ impurity ions in single crystal α-LiIO3 and LiNbO3. Sov. Phys. Solid State 1986, 904–906, 1593–1595. [Google Scholar]
  116. Donnerberg, H.J.; Shirmer, O.F. The paramagnetic properties of Co2+ in LiNbO3 and LiTaO3. Solid State Commun. 1987, 63, 29–32. [Google Scholar] [CrossRef]
  117. Choi, Y.N.; Park, I.-W.; Kim, S.S.; Park, S.S.; Choh, S.H. Electron paramagnetic resonance studies of Co2+ ions in congruent and nearly stoichiometric LiNbO3 single crystals. J. Phys. Condens. Matter 1999, 11, 4723–4730. [Google Scholar] [CrossRef]
  118. Grachev, V.G.; Hansen, K.; Meyer, M.; Kokanyan, E.P.; Malovichko, G.I. Substitution mechanisms and location of Co2+ ions in congruent and stoichiometric lithium niobate crystals derived from electron paramagnetic resonance data. Mater. Res. Express 2017, 4, 036204. [Google Scholar] [CrossRef]
  119. Paul, M.; Tabuchi, M.; Weast, A.R. Defect Structure of Ni, Co-doped LiNbO3 and LiTaO3. Chem. Mater. 1997, 9, 3206–3214. [Google Scholar] [CrossRef]
  120. Mei, Y.; Wu, X.-X.; Zheng, W.-C. EPR parameters and defect structures for the Co2+ ions in LiNbO3 and LiTaO3 crystals. Spectrochim. Acta Part A Mol. Biomol. Spectrosc. 2008, 71, 714–719. [Google Scholar] [CrossRef]
  121. Wu, S.-Y.; Lu, G.D.; Zhang, Z.H.; Wei, L.H.; Hu, Y.-X. Theoretical investigations of the local structures and spin Hamiltonian parameters for the trigonal Co2+ centers in LiNbO3 and LiTaO3. J. Alloys Compd. 2009, 1–2, 1–5. [Google Scholar] [CrossRef]
  122. Setser, G.G. An Investigation by Electron Paramagnetic Resonance of the Jahn-Teller Effect in LiNbO3:Ni3+ and LiNbO3:Cu2+. Ph.D. Thesis, Rice University, Houston, TX, USA, 1974; pp. 1–237. [Google Scholar]
  123. Palatnikov, M.N.; Sidorov, N.V.; Skiba, V.I.; Biryukova, I.V.; Serebryakov, Y.A.; Kravchenko, O.E.; Balabanov, Y.I.; Kalinnikov, V.T. Effects of nonstoichiometry and doping on the curie temperature and defect structure of lithium niobate. Inorg. Mater. 2000, 36, 489–493. [Google Scholar] [CrossRef]
  124. Pape, M.; Reyher, H.-J.; Schirmer, O.F. Optically detected magnetic resonance of Cu, Fe and Mn defects in LiNbO3. J. Phys. Condens. Matter 2005, 17, 6835–6847. [Google Scholar] [CrossRef]
  125. Mirzakhanyan, A.A. Zero-field splitting of energy levels of Ni2+ ground state in α-LiIO3 and LiNbO3. Sov. Phys. State Solid 1981, 23, 2452. [Google Scholar]
  126. Khalil, A.; Masaif, N.; Jennane, A.; Maaider, K. Substitution Mechanism of Ni:LiTaO3. J. Mater. Environ. Sci. 2011, 2, 196–200. [Google Scholar]
  127. Yang, Z.Y.; Rudowicz, C.; Yeung, Y.Y. Microscopic spin-Hamiltonian parameters and crystal field energy levels for the low C3 symmetry Ni2+ centre in LiNbO3 crystals. Physica B 2004, 348, 151–159. [Google Scholar] [CrossRef]
  128. Petrov, M.P. Spectrum of Electron Paramagnetic Resonance of Mn2+ in ferroelectric LiNbO3. Sov. Phys. Solid State 1968, 10, 2574. [Google Scholar]
  129. Takeda, T.; Watanabe, A.; Sugihara, K. Spacing of the hyperfine sextet in Mn2+ ESR in LiNbO3. Phys. Lett. A 1968, 27, 114–115. [Google Scholar] [CrossRef]
  130. Danner, J.C.; Ranon, U.; Stamires, D.N. ESR of Mn2+ in ferroelectric LiTaO3 and LiNbO3 single crystals. Chem. Phys. Lett. 1968, 2, 605–606. [Google Scholar] [CrossRef]
  131. Herrington, J.B.; Dischler, B.; Schneider, J. An EPR investigation of Fe3+ and Mn2+ in LiNbO3. Solid State Commun. 1972, 10, 509–511. [Google Scholar] [CrossRef]
  132. Rexford, D.J.; Kim, Y.M. Electron-Spin Resonance Studies of Crystal Field Parameters in Mn2+:LiNbO3. J. Chem. Phys. 1972, 57, 3094–3098. [Google Scholar] [CrossRef]
  133. Malovichko, G.I.; Grachev, V.G. Use of nuclear quadrupole splitting in determination of positions of iron group impurities in ferroelectric LiNbO3. Sov. Phys. Solid. State 1985, 27, 1678–1679. [Google Scholar]
  134. Malovichko, G.I.; Grachev, V.G.; Lukin, S.N. EPR of axial and low symmetry Cr3+, Fe3+, and Mn2+ centers in LiNbO3. Sov. Phys. Solid State 1986, 28, 553–557. [Google Scholar]
  135. Malovichko, G.I.; Karmazin, A.A.; Bykov, I.P.; Laguta, V.V.; Yarunichev, V.P. Electron spin resonance investigation of the temperature dependence of the axial crystal field parameters in Mn2+ and Cr3+ doped LiNbO3. Sov. Phys. Solid State 1983, 25, 2038–2041. [Google Scholar]
  136. Park, I.W.; Choh, S.H.; Song, K.J. The hyperfine structure of Mn2+ in LiNbO3 and the sign of the second-order axial zero-field splitting. J. Korean Phys. Soc. 1993, 26, 77–80. [Google Scholar]
  137. Park, I.-W. Three-fold Symmetry Effect on Mn2+ Centers in a LiNbO3 Crystal. J. Korean Magn. Res. Soc. 2008, 12, 103–110. [Google Scholar] [CrossRef] [Green Version]
  138. Yeom, T.H.; Lee, S.H. Temperature Dependence of Mn2+ Paramagnetic Ion in a Stoichiometric LiNbO3 Single Crystal. J. Magn. 2013, 18, 221–224. [Google Scholar] [CrossRef] [Green Version]
  139. Corradi, G.; Söthe, H.; Spaeth, J.-M.; Polgar, K. Mn2+ defects in LiNbO3: An electron nuclear double resonance (ENDOR) investigation of the Mn2+ site and the local disorder. J. Phys. Condens. Matter. 1990, 2, 6603–6618. [Google Scholar] [CrossRef]
  140. Malovichko, G.; Grachev, V.; Hofstaetter, A.; Kokanyan, E.; Scharmann, A.; Schirmer, O. ENDOR study of Cr3+ centers substituting for lithium in lithium niobate. Phys. Rev. B 2002, 65, 224116. [Google Scholar] [CrossRef]
  141. Grachev, V.; Malovichko, G. EPR, ENDOR, and optical-absorption study of Cr3+ centers substituting for niobium in Li-rich lithium niobate crystals. Phys. Rev. B 2000, 62, 7779–7790. [Google Scholar] [CrossRef]
  142. Grachev, V.; Malovichko, G.; Schirmer, O. Structures of point defects in lithium niobate. Ukr. J. Phys. 2004, 49, 438–448. [Google Scholar]
  143. Evlanova, N.F.; Kornienko, L.S.; Rashkovich, L.N.; Rybaltovskii, A.O. EPR of some rare-earth ions and Cr3+ in LiNbO3. Sov. JETP 1967, 53, 1920–1926. [Google Scholar]
  144. Burns, G.; O’Kane, D.F.; Title, R.S. Optical and Electron-Spin-Resonance Spectra of Yb3+, Nd3+, and Cr3+ in LiNbO3 and LiTaO3. Phys. Rev. 1968, 167, 314–318. [Google Scholar] [CrossRef]
  145. Rexford, D.J.; Kim, Y.M.; Story, H.S. Electron-Spin resonance studies of Cr3+ in LiNbO3. J. Chem. Phys. 1970, 52, 860–863. [Google Scholar] [CrossRef]
  146. Choh, S.H.; Kim, H.T.; Choh, H.K.; Han, C.S.; Choi, D.; Kim, J.N. Characterization of Stoichiometry of LiNbO3 Crystals by EPR and Raman Scattering Measurements. Bull. Magn. Res. 1989, 11, 371. [Google Scholar]
  147. Salley, G.M.; Basun, S.A.; Imbusch, G.F.; Kaplyanskii, A.A.; Kapphan, S.; Meltzer, R.S.; Happek, U. Chromium centers in LiNbO3 revisited. J. Luminescence 1999, 83–84, 423–427. [Google Scholar] [CrossRef]
  148. Grachev, V.; Malovichko, G.; Schirmer, O. Single, dimer and trimer chromium centers in lithium niobate. Ferroelectrics 1996, 185, 5–8. [Google Scholar] [CrossRef]
  149. Grachev, V.G.; Malovichko, G.I.; Troitskii, V.V. Investigation of the charge compensation mechanisms of Cr3+ ions in LiNbO3 by EPR and ENDOR methods. Sov. Phys. Solid State 1987, 29, 349–350. [Google Scholar]
  150. Siu, G.G.; Zhao, M.-G. Electron-spin-resonance studies of Cr-ion pairs in LiNbO3: Cr3+. Phys. Rev. B 1991, 43, 13575–13578. [Google Scholar] [CrossRef] [PubMed]
  151. Corradi, G.; Sothe, H.; Spaeth, J.-M.; Polgar, K. Electron spin resonance and electron-nuclear double-resonance investigation of a new Cr3+ defect on an Nb site in LiNbO3:Mg:Cr. J. Phys. Condens. Matter 1991, 3, 1901–1908. [Google Scholar] [CrossRef]
  152. Corradi, G.; Sothe, H.; Spaeth, J.-M.; Polgar, K. ENDOR for characterizing transition metal centres in LiNbO3. Radiat. Eff. Defects Solids 1991, 119–121, 583–587. [Google Scholar] [CrossRef]
  153. Corradi, G.; Söthe, H.; Spaeth, J.-M.; Polgar, K. Local environment of Mn2+ and Cr3+ centres in LiNbO3: Discussion of recent ENDOR results. Ferroelectrics 1992, 125, 295–299. [Google Scholar] [CrossRef]
  154. Diazcaro, J.; Garcia-Sole, J.; Bravo, D.; Han, T.P.J.; Jaque, F.; Henderson, B. EPR and infrared absorption study in MgO Co-Doped LiNbO3 crystals. Ferroelectr. Lett. Sect. 1997, 23, 27–35. [Google Scholar] [CrossRef]
  155. Thiemann, O.; Corradi, G.; Reyher, H.-J. ODMR-investigations of transition metals in LiNbO3. Ferroelectrics 1992, 125, 283–288. [Google Scholar] [CrossRef]
  156. Camarillo, E.; Garcia-Sole, J.; Cusso, F.; Agullo-Lopez, F.; Sanz-Garcia, J.A.; Han, T.P.J.; Jaque, F.H.; Henderson, B. Polarization spectroscopy of Cr3+ ions in LiNbO3 single crystals: Effect of Mg2+ ions. Chem. Phys. Lett. 1991, 185, 505–510. [Google Scholar] [CrossRef]
  157. Camarillo, E.; Tocho, J.; Vergara, I.; Dieguez, E.; Garcia-Sole, J.; Jaque, F. Optical bands of Cr3+ induced by Mg2+ ions in LiNbO3:Cr,Mg. Phys. Rev. B 1992, 45, 4600–4604. [Google Scholar] [CrossRef]
  158. Martin, A.; Lopez, F.J.; Agullo-Lopez, F. Cr3+ in pure and Mg-doped LiNbO3: Analysis of the EPR and optical spectra. J. Phys. Condens. Matter 1992, 4, 847–853. [Google Scholar] [CrossRef]
  159. Macfarlane, P.I.; Holliday, K.; Nicholls, J.F.H.; Henderson, B. Characterization of Cr3+ centres in LiNbO3 using fluorescence line narrowing. J. Phys. Condens. Matter. 1995, 7, 9643–9656. [Google Scholar] [CrossRef]
  160. Diaz-Caro, J.; Garcia-Sole, J.; Bravo, D.; Sanz-Garcia, J.A.; Lopez, F.J.; Jaque, F. MgO codoping-induced change in the site distribution of Cr3+ ions in LiNbO3. Phys. Rev. B 1996, 54, 13042–13046. [Google Scholar] [CrossRef] [PubMed]
  161. Diaz-Caro, J.; Garcia-Sole, J.; Martinez, J.L.; Henderson, B.; Jaque, F.; Han, T.P.J. Redistribution of Cr3+ defect centres in LiNbO3 crystals: The MgO effect. Opt. Mater. 1998, 10, 69–77. [Google Scholar] [CrossRef]
  162. Torchia, G.A.; Martinez Matos, O.; Vaveliuk, P.; Tocho, J.O. Influence of the electron-lattice coupling for Cr3+ ions in Nb5+ site into congruent co-doped LiNbO3: Cr3+: ZnO crystal. Solid State Commun. 2003, 127, 535–539. [Google Scholar] [CrossRef]
  163. Ahn, S.W.; Rudowicz, C.; Choh, S.H.; Han, S.Y. EPR study of two Cr3+defect centers in LiTaO3 single crystals. J. Korean Phys. Soc. 1997, 30, 99–102. [Google Scholar]
  164. Ahn, S.W.; Kim, J.S.; Choh, S.H.; Yeom, T.H. An Induced Cr3+ Center in gamma-Irradiated LiTaO3. J. Korean Phys. Soc. 1994, 27, 535–538. [Google Scholar]
  165. Loyo-Menoyo, M.; Keeble, D.J.; Furukawa, Y.; Kitamura, K. Electron paramagnetic resonance of Cr3+ in near-stoichiometric LiTaO3. J. Appl. Phys. 2005, 97, 123905. [Google Scholar] [CrossRef]
  166. Bourson, P.; Malovichko, G.; Ridah, A.; Kokanyan, E. Effect of chromium concentration on site selective luminescence in nearly stoichiometric lithium niobate crystals. Ferroelectrics 1996, 155, 273–276. [Google Scholar] [CrossRef]
  167. Lhomme, F.; Bourson, P.; Fontana, M.D.; Malovichko, G.; Aillerie, M.; Kokanyan, E. Luminescence of Cr3+ in lithium niobate: Influence of the chromium concentration and crystal composition. J. Phys. Condens. Matter 1998, 10, 1137–1146. [Google Scholar] [CrossRef]
  168. Lhomme, F.; Bourson, P.; Moncorge, R.; Burlot, R.; Fontana, M.D.; Aillerie, M.; Boulon, G.; Malovichko, G. New study of the 720–750 nm range in the emission spectra of LiNbO3:Cr3+ crystals with different compositions. Radiat. Eff. Defects Solids 1999, 150, 259–263. [Google Scholar] [CrossRef]
  169. Kaminska, A.; Suchocki, A.; Grinberg, M.; Garcia-Sole, J.; Jaque, F.; Arizmendi, L. High-pressure spectroscopy of LiNbO3:MgO, Cr3+ crystals. J. Lumin. 2000, 87–89, 571–573. [Google Scholar] [CrossRef]
  170. Salley, G.M.; Basun, S.A.; Kaplyanskii, A.A.; Meltzer, R.S.; Polgar, K.; Happek, U. Chromium centers in stoichiometric LiNbO3. J. Lumin 2000, 87–89, 1133–1135. [Google Scholar] [CrossRef]
  171. Dierolf, V.; Kaplyanskii, A.A.; Kapphan, S.; Kutsenko, A.B. The fine structure of spectral response of Cr3+ sites in LiNbO3. In Radiat. Eff. Defects Solids; 2001; Volume 155, pp. 241–246. [Google Scholar] [CrossRef]
  172. Basun, S.A.; Salley, G.M.; Kaplyanskii, A.A.; Gallagher, H.G.; Polgar, K.; Lu, L.; Happek, U. A novel luminescent center in LiNbO3:Cr:Mg crystals. J. Lumin. 1999, 83–84, 435–439. [Google Scholar] [CrossRef]
  173. Lhomme, F.; Bourson, P.; Boulon, G.; Guyot, Y.; Fontana, M.D. Comparative analysis of the Cr3+ centre spectroscopic properties in LiNbO3 crystals from congruent to nearly stoichiometric compositions. Eur. Phys. J. AP 2002, 20, 29–40. [Google Scholar] [CrossRef]
  174. Han, T.P.J.; Jaque, F.; Bermudez, V.; Dieguez, E. Luminescence of the Cr3+ R-lines in pure and MgO co-doped near stoichiometric LiNbO3:Cr crystals. Chem. Phys. Lett. 2003, 369, 519–524. [Google Scholar] [CrossRef]
  175. Han, T.P.J.; Jaque, F. Optical stability of the Cr3+ centres in codoped stoichiometric and congruent LiNbO3:Cr:Mg. Opt. Mater. 2007, 29, 1041–1043. [Google Scholar] [CrossRef]
  176. Kaczmarek, S.M.; Lukasiewicz, T.; Pracka, I.; Jablonski, R.; Boulon, G.; Kaczmarek, B.; Warchol, S. Radiation defects in Dy3+ doped LiNbO3 single crystals. J. Alloys Compd. 1998, 275–277, 105–108. [Google Scholar] [CrossRef]
  177. Jablonski, R.; Pracka, I.; Swirkowicz, M. Electron spin resonance spectra of Nd3+, Dy3+, Er3+ and Yb3+ in LiNbO3. In Solid State Crystals: Growth and Characterization, Proceedings of the XII Conference on Solid State Crystals: Materials Science and Applications, Zakopane, Poland, 7–11 October 1996; SPIE: Bellingham, WA, USA, 1997. [Google Scholar] [CrossRef]
  178. Milori, D.M.B.P.; Moraes, I.J.; Hernandes, A.C.; de Souza, R.R.; Li, M.S.; Terrile, M.C.; Barberis, G.E. Optical and ESR study of Er3+ in LiNbO3. Phys. Rev. B 1995, 51, 3206—3209. [Google Scholar] [CrossRef] [PubMed] [Green Version]
  179. Nolte, T.; Pawlik, T.; Spaeth, J.-M. EPR study of Er3+ in congruent LiNbO3. Solid State Commun. 1997, 104, 535–539. [Google Scholar] [CrossRef]
  180. Bodziony, T.; Kaczmarek, S.M. EPR study of low symmetry Er centers in congruent lithium niobate. Phys. Status Solidi (b) 2008, 245, 998–1002. [Google Scholar] [CrossRef]
  181. Kaczmarek, S.M.; Bodziony, T. Low symmetry centers in LiNbO3 doped with Yb and Er. J. Non-Cryst. Solids 2008, 354, 4202–4210. [Google Scholar] [CrossRef]
  182. Bodziony, T.; Kaczmarek, S.M. Temperature dependence of the EPR spectra and optical measurements of LiNbO3: Er, Tm single crystal. J. Alloys Compd. 2009, 468, 581–585. [Google Scholar] [CrossRef]
  183. Bodziony, T.; Kaczmarek, S.M.; Kruk, R. Low temperature magnetic measurements of LiNbO3 single crystal weakly doped with Er and codoped with Tm ions. J. Spectrosc. Dyn. 2011, 1, 1–8. [Google Scholar]
  184. Vrable, I.; Malovichko, G.; Grachev, V.; Meyer, M. EPR/ENDOR Studies of Erbium Centers in Stoichiometric Lithium Niobate Crystals. In Proceedings of the 49th Rocky Mountain Conference on Analytical Chemistry, Breckenridge, CO, USA, 22–26 July 2007; Abstract C 143. p. 71. Available online: http://rockychem.com/links/past-conferences.html (accessed on 1 March 2007).
  185. Malovichko, G.; Grachev, V.; Jorgensen, J.; Meyer, M.; Munro, M.; Todt, B.; Vrable, I.; Kokanyan, E.; Bratus, V.; Okulov, S. Magnetic resonance study of non-equivalent centers created by 4f-ions in congruent and stoichiometric lithium niobate. MRS Online Proc. Libr. 2008, 1111, 103. [Google Scholar] [CrossRef]
  186. Mackova, A.; Groetzschel, R.; Eichhorn, F.; Nekvindova, P.; Spirkova, J. Characterization of Er:LiNbO3 and APE:Er:LiNbO3 by RBS–channeling and XRD techniques. Surf. Interface Anal. 2004, 36, 949–951. [Google Scholar] [CrossRef]
  187. Gog, T.; Griebenow, M.; Materlik, G. X-ray standing wave determination of the lattice location of Er diffused into LiNbO3. Phys. Lett. A 1993, 181, 417–420. [Google Scholar] [CrossRef]
  188. Rebouta, L.; da Silva, M.F.; Soares, J.C.; Serrano, D.; Diéguez, E.; Agulló-López, F.; Tornero, J. Nonaxial sites for Er in LiNbO3. J. Appl. Phys. Lett. 1997, 70, 1070–1072. [Google Scholar] [CrossRef]
  189. Malovichko, G.; Vrable, I.; Meyer, M.; Kokanyan, E.; Grachev, V. Ordering magnetic moments of Er3+ in ferroelectric lithium niobate. In Proceedings of the International Conference “Oxide Materials for Electronic Engineering—Fabrication, Properties and applica$tion” (OMEE-2014), Lviv, Ukraine, 26–30 May 2014; pp. 35–36. [Google Scholar]
  190. Gill, D.M.; Wright, J.C.; McCaughan, L. Site characterization of rare-earth-doped LiNbO3 using total site selective spectroscopy. J. Appl. Phys. Lett. 1994, 64, 2483–2485. [Google Scholar] [CrossRef] [Green Version]
  191. Gill, D.M.; McCaughan, L.; Wright, J.C. Spectroscopic site determinations in erbium-doped lithium niobate. Phys. Rev. B 1996, 53, 2334–2344. [Google Scholar] [CrossRef] [PubMed]
  192. Muntoz, J.A.; Cantelar, E.; Sanz-garcia, J.A.; Duchowicz, R.; Serrano, D.; Dieguez, E.; Lifante, G.; Cusso, F. Site-selective spectroscopy of Er3+ and Er3+ Yb3+ doped stoichiometric and congruent lithium niobate. Radiat. Eff. Defects Solids 1999, 150, 221–225. [Google Scholar] [CrossRef]
  193. Dierolf, V.; Koerdt, M. Combined excitation-emission spectroscopy of Er3+ ions in stoichiometric LiNbO3: The site selectivity of direct and up conversion excitation processes. Phys. Rev. B 2000, 61, 8043–8048. [Google Scholar] [CrossRef]
  194. Dierolf, V.; Kutsenko, A.B.; Ostendorf, A.; von der Osten, W.; Sohler, W.; Suche, H. Site-selective spectroscopy of Er3+:Ti:LiNbO3 waveguides. Appl. Phys. B 2001, 72, 803–810. [Google Scholar] [CrossRef]
  195. Dierolf, V.; Kutsenko, A.B.; Sandmann, C.; Troester, T.; Corradi, G. High-resolution site selective optical spectroscopy of rare earth and transition metal defects in insulators. J. Lumin. 2000, 87–89, 989–991. [Google Scholar] [CrossRef]
  196. Dierolf, V.; Sandmann, C. Combined excitation emission spectroscopy of defects for site-selective probing of ferroelectric domain inversion in lithium niobate. J. Lumin. 2007, 125, 67–79. [Google Scholar] [CrossRef]
  197. Bravo, D.; Martin, A.; Lopez, F.J. A new centre of Er3+ in MgO or ZnO co-doped LiNbO3 single crystals. Solid State Commun. 1999, 112, 541–544. [Google Scholar] [CrossRef]
  198. Mehran, F.; Scott, B.A. Electron paramagnetic resonance of LiNbO3: Fe3+. Solid State Commun. 1972, 11, 15–19. [Google Scholar] [CrossRef]
  199. Towner, H.H.; Kim, Y.M.; Story, H.S. EPR studies of crystal field parameters in Fe3+: LiNbO3. J. Chem. Phys. 1972, 56, 3676–3679. [Google Scholar] [CrossRef]
  200. Dikantova, Z. EPR study of impurities centers in LiNbO3. Acta Phys. Slov. 1973, 23, 245–250. [Google Scholar]
  201. Keune, W.; Date, S.K.; Gonser, U.; Bunzel, H. Mossbauer effect study of Fe57 doped LiNbO3 and LiTaO3. Ferroelectrics 1976, 13, 443–445. [Google Scholar] [CrossRef]
  202. Kurz, H.; Krätzig, E.; Keune, W.; Engelmann, H.; Gonser, U.; Dischler, B.; Räuber, A. Photorefractive centers in LiNbO3, studied by optical-, Mössbauer- and EPR-methods. Appl. Phys. 1977, 12, 355–368. [Google Scholar] [CrossRef]
  203. Grachev, V.G.; Malovichko, G.I. Determination of the point symmetry of defects in crystals exhibiting structural phase transitions, using the temperature dependencies of the EPR spectra. Impurities in LiNbO3. Sov. Phys. Solid State 1985, 27, 686–689. [Google Scholar]
  204. Pfannes, H.D.; Putzka, A.; Sampaio, J.F. Electronic structure and spin relaxation of Fe(III) in LiNbO3. Hyperfine Interact. 1986, 28, 785–788. [Google Scholar] [CrossRef]
  205. Jablonski, R.; Kaczmarek, S.M.; Praska, I.; Surma, B.; Swirkowicz, M.; Lukasiewicz, T. ESR and optical measurements of LiNbO3 and LiTaO3 single crystals doped with ions of the first transition series. Spectrochim. Acta A 1998, 54, 1701–1709. [Google Scholar] [CrossRef]
  206. Yeom, T.H.; Choh, S.H. Magnetic Resonance Investigations of LiNbO3 and LiTaO3 Single Crystals. J. Korea Phys. Soc. 1998, 32, S672–S674. [Google Scholar]
  207. Santana, R.C.; Terrile, M.C.; Hernandes, A.C.; Andreeta, M.R.B.; Barberis, G.E. Electron spin resonance study of Fe3+ in LiNbO3 single crystals: Bulk and fibres. Solid State Commun. 1997, 103, 61–64. [Google Scholar] [CrossRef]
  208. Keeble, D.J.; Loyo-Menoyo, M.; Furukawa, Y.; Kitamura, K. Electron paramagnetic resonance of Fe3+ in LiNbO3. Phys. Rev. B 2005, 71, 224111. [Google Scholar] [CrossRef]
  209. Agullò-López, F.; Müller, K.A. Superposition Model Calculations for Fe3+ in LiNbO3. Cryst. Latt. Def. Amorph. Mater. 1987, 15, 89. [Google Scholar]
  210. Zhao, M.G.; Chiu, M. Substitution site of the Fe3+ impurity in crystalline LiNbO3. Phys. Rev. B 1994, 49, 12556–12558. [Google Scholar] [CrossRef]
  211. Wang, H.; Kuang, X.Y.; Die, D.; Tan, X.-M.; Yang, X. EPR spectra and local lattice structure of Fe3+ impurity ions in ferroelectric LiNbO3. Chem. Phys. 2006, 330, 212–215. [Google Scholar] [CrossRef]
  212. Wang, H.; Kuang, X.Y.; Die, D.; Yang, X.; Zhou, K.-W. EPR investigation of substitution position for Fe3+ in LiNbO3:Fe3+ system. Physica B 2005, 367, 53–60. [Google Scholar] [CrossRef]
  213. Yeom, T.H.; Chang, Y.M.; Choh, S.H.; Rudowicz, C. Experimental and Theoretical Investigation of Spin-Hamiltonian Parameters for the Low Symmetry Fe3+ Centre in LiNbO3. Phys. Status Solidi (b) 1994, 185, 409–415. [Google Scholar] [CrossRef]
  214. Xue, D.; He, X. Dopant occupancy and structural stability of doped lithium niobate crystals. Phys. Rev. B 2006, 73, 064113. [Google Scholar] [CrossRef]
  215. Zhang, Z.; Xue, D. Local Lattice Structure and Dopant Occupancy Of Doped Lithium Niobate Crystals. Mod. Phys. Lett. B 2009, 23, 3687–3694. [Google Scholar] [CrossRef]
  216. Basun, S.A.; Bursian, V.E.; Evans, D.R.; Kaplyanskii, A.A.; Razdobarin, A.G.; Sochava, L.S. Ferroelectric-Specific Stark Effect in Stoichiometric LiNbO3:Fe at Room Temperature. Phys. Rev. Lett. 2008, 100, 057602. [Google Scholar] [CrossRef]
  217. Grachev, V.G.; Petersen, R.T.; Kokanyan, E.P.; Schirmer, O.F.; Malovichko, G.I. Structural analysis of the dominant axial Fe3+ center in LiNbO3 crystal by electron nuclear double resonance. J. Appl. Phys. 2016, 120, 193901. [Google Scholar] [CrossRef]
  218. Boker, A.; Donnerberg, H.; Schirmer, O.F.; Feng, X. Two sites of Fe3+ in highly Mg-doped LiNBO3. J. Phys. Condens. Matter 1990, 2, 6865–6868. [Google Scholar] [CrossRef]
  219. Volk, T.R.; Rubinina, N.M.; Pryalkin, V.I.; Krasnikov, V.V.; Volkov, V.V. Optical and non-linear optical investigations in LiNbO3:Mg and LiNbO3:Zn. Ferroelectrics 1990, 109, 345–350. [Google Scholar] [CrossRef]
  220. Yeom, T.H.; Lee, S.H.; Choh, S.H.; Choi, D. Electron paramagnetic resonance study of Fe3+ in LiNbO3:Mg:Fe crystal. J. Korean Phys. Soc. 1998, 32, S647. [Google Scholar]
  221. Malovichko, G.I.; Grachov, V.G.; Kokanyan, E.P. Low-symmetry Fe-Mg complexes in LiNbO3:Mg. Ferroelectrics 1992, 125, 289–294. [Google Scholar] [CrossRef]
  222. Grachev, V.; Malovichko, G.; Kokanyan, E. Optimization of lithium niobate for advanced applications by variation of extrinsic and intrinsic defect subsystems. Ferroelectrics 2001, 258, 131–140. [Google Scholar] [CrossRef]
  223. Volk, T.; Wöhlecke, M.; Rubinina, N.; Razumovskii, N.V.; Jermann, F.; Fischer, C.; Böwer, R. LiNbO3 with the damage-resistant impurity indium. Appl. Phys. A 1995, 60, 217–225. [Google Scholar] [CrossRef]
  224. Volk, T.R.; Rubinina, N.M. Non photorefractive impurities in lithium niobate: Magnesium and zinc. Sov. Phys. Solid State 1991, 33, 674–680. [Google Scholar]
  225. Vazhenin, V.A.; Guseva, V.B.; Artyomov, M.Y.; Route, R.K.; Fejer, M.M.; Byer, R.L. Fine structure of the electron paramagnetic resonance spectrum of Fe3+ centres in LiTaO3. J. Phys. Condens. Matter 2003, 15, 275–280. [Google Scholar] [CrossRef]
  226. Loyo-Menoyo, M.; Keeble, D.J.; Furukawa, Y.; Kitamura, K. Electron paramagnetic resonance of Fe3+ in near-stoichiometric LiTaO3. J. Phys. Condens. Matter 2004, 16, 9047–9057. [Google Scholar] [CrossRef]
  227. McDonald, P.F.; Tam, C.P.; Mok, Y.W. EPR Gd3+ in LiNbO3. J. Chem. Phys. 1972, 56, 1007–1008. [Google Scholar] [CrossRef]
  228. Dischler, B.; Herrington, J.R.; Räuber, A.; Schneider, J.; Urban, W. An EPR study of different Gd3+ centers in LiNbO3. Solid State Communs. 1973, 12, 737–740. [Google Scholar] [CrossRef]
  229. Park, I.-W.; Kim, M.; Choh, S.H.; Kim, J.N. EPR study of Gd3+ Paramagnetic Centers in Congruent LiNbO3 Single Crystal. New Phys. (Korean Phys. Soc.) 1994, 34, 464–469. [Google Scholar]
  230. Bonardi, C.; Carvalho, R.A.; Basso, H.C.; Terrile, M.C.; Cruz, G.K.; Bausa, L.E.; Sole, J.G. Magnetic circular dichroism of Nd3+ and Yb3+ ions in LiNbO3 crystals. J. Chem. Phys. 1999, 111, 6042–6046. [Google Scholar] [CrossRef]
  231. Camarillo, E.; Hernandez, J.; Garcia Sole, J.; Caldino, U.; Munoz Santiuste, J.E.; Loro, H.; Voda, M.; Jaque, F.; Murrieta, H. Nd3+ centres induced by ZnO or MgO codoping LiNbO3. J. Phys. Condens. Matter 1995, 7, 96359641. [Google Scholar] [CrossRef]
  232. Ziling, K.K.; Nadolinnii, V.A.; Shashkin, V.V. Sov.: Reports of AS of USSR. Inorg. Mater. 1980, 16, 701. [Google Scholar]
  233. Juppe, S.; Schirmer, O.F. EPR Ti3+ in LiNbO3. Phys. Lett. A 1986, 117, 150–155. [Google Scholar] [CrossRef]
  234. Rakitina, L.G.; Zaritskii, I.M.; Corradi, G.; Polgar, K. Mechanisms of broadening of ESR lines of polaron centers in LiNbO3: Ti subjected to irradiation and heat treatments. Sov. Phys. Solid State 1990, 32, 654–660. [Google Scholar]
  235. Thiemann, O.; Donnerberg, G.H.; Wöhlecke, M.; Schirmer, O. Vibronic structure, energy level, and incorporation mechanism of Ti3+ in LiNbO3 and LiTaO3. Phys. Rev. B 1994, 49, 5845–5851. [Google Scholar] [CrossRef]
  236. Corradi, G.; Polgar, K.; Zaritskii, I.M.; Rakitina, L.G.; Deryugina, N.I. Defect formation under γ-irradiation and heat treatment in pure and doped LiNbO3 monocrystals. Sov. Phys. State Solid 1989, 31, 115–122. [Google Scholar]
  237. Corradi, G.; Zaritskii, I.M.; Hofstaetter, A.; Polgar, K.; Rakitina, L.G. Ti3+ on Nb site: A paramagnetic Jahn-Teller center in vacuum-reduced LiNbO3:Mg:Ti single crystals. Phys. Rev. B 1998, 58, 8329–8337. [Google Scholar] [CrossRef]
  238. Corradi, G. Nb4+ Polaron and Ti3+ Shallow Donor Jahn-Teller Centers in LiNbO3 Systems. In Defects and Surface-Induced Effects in Advanced Perovskites; Borstel, G., Krumins, A., Millers, D., Eds.; NATO Science Series (Series 3. High Technology); Springer: Dordrecht, The Netherlands; Boston, MA, USA; London, UK, 2000; Volume 77, pp. 89–100. [Google Scholar] [CrossRef]
  239. Corradi, G.; Meyer, M.; Kovács, L.; Polgar, K. Gap levels of Ti3+ on Nb or Li sites in LiNbO3:(Mg):Ti crystals and their effect on charge transfer processes. Appl. Phys. B 2004, 78, 607–614. [Google Scholar] [CrossRef]
  240. Corradi, G.; Meyer, M.; Polgár, K. Bipolarons localised by Ti dopants in reduced LiNbO3 crystals double-doped by Ti and Mg. Phys. Status Solidi (c) 2005, 2, 132–135. [Google Scholar] [CrossRef]
  241. Bonardi, C.; Magon, C.J.; Vidoto, E.A.; Terrile, M.C.; Bausa, L.E.; Montoya, E.; Bravo, D.; Martin, A.; Lopez, F.J. EPR spectroscopy of Yb3+ in LiNbO3 and Mg:LiNbO3. J. Alloys Compd. 2001, 323, 340–343. [Google Scholar] [CrossRef]
  242. Dohnke, I.; Trusch, B.; Klimm, D.; Hulliger, J. A study of influence of ytterbium and impurities on lattice parameters and phase transition temperature of Czochralski grown LiNbO3. J. Phys. Chem. Solids 2004, 65, 1297–1305. [Google Scholar] [CrossRef]
  243. Bodziony, T.; Kaczmarek, S.M. New low symmetry centres of Yb3+ impurities in lithium niobate single crystal. Opt. Mater. 2007, 29, 1440–1446. [Google Scholar] [CrossRef]
  244. Bodziony, T.; Kaczmarek, S.M. EPR and optical study of coupled Yb3+ ion pairs in weakly doped LiNbO3:Yb single crystal. Res. Chem. Intermed. 2007, 33, 885–899. [Google Scholar] [CrossRef]
  245. Bodziony, T.; Kaczmarek, S.M.; Rudowicz, C. Temperature dependence of the EPR lines in weakly doped LiNbO3:Yb—Possible evidence of Yb3+ ion pairs formation. Physica B 2008, 403, 207–218. [Google Scholar] [CrossRef]
  246. Bodziony, T.; Kaczmarek, S.M.; Hanuza, J. EPR and optical studies of LiNbO3:Yb and LiNbO3:Yb, Pr single crystals. J. Alloys Compd. 2008, 451, 240–247. [Google Scholar] [CrossRef]
  247. Bodziony, T.; Kaczmarek, S.M.; Kruk, R. Magnetic properties of LiNbO3 single crystals weakly doped by Yb and/or codoped by Pr. Rev. Adv. Mater. Sci. 2010, 23, 1–7. [Google Scholar]
  248. Malovichko, G.; Grachev, V.; Kokanyan, E.; Schirmer, O. EPR, NMR and ENDOR study of intrinsic and extrinsic defects in disordered and regularly ordered lithium niobate crystals. Ferroelectrics 2000, 239, 357–366. [Google Scholar] [CrossRef]
  249. Malovichko, G.; Bratus, V.; Grachev, V.; Kokanyan, E. Electron paramagnetic resonance and electron-nuclear double resonance study of nonequivalent Yb3+ centers in congruent and nearly stoichiometric lithium niobate. Phys. Status Solidi (b) 2009, 246, 215–225. [Google Scholar] [CrossRef]
  250. Xu, H.; Lee, D.; He, J.; Sinnott, S.B.; Gopalan, V.; Dierolf, V.; Phillpot, S.R. Stability of intrinsic defects and defect clusters in LiNbO3 from density functional theory calculations. Phys. Rev. B 2008, 78, 174103. [Google Scholar] [CrossRef] [Green Version]
  251. Xu, H.; Chernatynskiy, A.; Lee, D.; Sinnott, S.B.; Gopalan, V.; Dierolf, V.; Phillpot, S.R. Stability and charge transfer levels of extrinsic defects in LiNbO3. Phys. Rev. B 2010, 82, 184109. [Google Scholar] [CrossRef] [Green Version]
  252. Xu, H.; Lee, D.; Sinnott, S.B.; Dierolf, V.; Gopalan, V.; Phillpot, S.R. Structure and diffusion of intrinsic defect complexes in LiNbO3 from density functional theory calculations. J. Phys. Condens. Matter 2010, 22, 135002. [Google Scholar] [CrossRef] [Green Version]
  253. Vyalikh, A.; Zschornak, M.; Köhler, T.; Nentwich, M.; Weigel, T.; Hanzing, J.; Zaripov, R.; Vavilova, E.; Gemming, S.; Brendler, E.; et al. Analysis of the defect clusters in congruent lithium tantalate. Phys. Rev. Mater. 2018, 2, 013804. [Google Scholar] [CrossRef] [Green Version]
  254. Zhang, Q.-R.; Feng, X.-Q. Defect structures and the MgO-doping-level-threshold effect on the optical absorption of reduced MgO-doped lithium niobate. Phys. Rev. B 1991, 43, 12019–12024. [Google Scholar] [CrossRef] [PubMed]
  255. Schirmer, O.F.; Thiemann, O.; Wohlecke, M. Defects in LiNbO3—I. experimental aspects. J. Phys. Chem. Solids 1991, 52, 185–200. [Google Scholar] [CrossRef]
  256. Schirmer, O.F.; Imlau, M.; Merschjann, C.; Schoke, B. Electron small polarons and bipolarons in LiNbO3. J. Phys. Condens. Matter 2009, 21, 123201. [Google Scholar] [CrossRef] [PubMed]
  257. Schirmer, O.F.; von der Linde, D. Two photon and x-ray induced Nb4+ and O small polarons in LiNbO3. Appl. Phys. Lett. 1978, 33, 35–38. [Google Scholar] [CrossRef]
  258. Ketchum, J.L.; Sweeney, K.L.; Halliburton, L.E.; Armington, A.F. Vacuum annealing effects in lithium niobate. Phys. Lett. A 1983, 94, 450–453. [Google Scholar] [CrossRef]
  259. Sweeney, K.L.; Halliburton, L.E. Oxygen vacancies in lithium niobate. Appl. Phys. Lett. 1983, 43, 336–338. [Google Scholar] [CrossRef]
  260. Halliburton, L.E.; Sweeney, K.L.; Chen, C.Y. Electron spin resonance and optical studies of point defects in lithium niobate. Nucl. Instrum. Methods Phys. Res. B 1984, 1, 344–347. [Google Scholar] [CrossRef]
  261. Dutt, D.A.; Feigl, F.J.; DeLeo, G.G. Optical absorption and electron paramagnetic resonance studies of chemically reduced congruent lithium niobate. J. Phys. Chem. Solids 1990, 51, 407–415. [Google Scholar] [CrossRef]
  262. Müller, H.; Schirmer, O.F. Microscopic structure of NbLi related defects in reduced undoped LiNbO3. Ferroelectrics 1992, 125, 319–324. [Google Scholar] [CrossRef]
  263. Zaritskii, I.M.; Rakitina, L.G.; Corradi, G.; Polgar, K.; Bugai, A.A. A new trapped-hole radiation defect in heavily Mg-doped LiNbO3. J. Phys. Condens. Matter 1991, 3, 8457–8465. [Google Scholar] [CrossRef]
  264. Halliburton, L.E.; Sweeney, K.L.; Kappers, L.A. Self-trapped electrons in lithium tantalate. Phys. Lett. A 1986, 116, 81–84. [Google Scholar] [CrossRef]
  265. Lee, M.; Gyoo Kim, I.; Takekawa, S.; Furukawa, Y.; Uchida, Y.; Kitamura, K.; Hatano, H. Electron paramagnetic resonance investigation of the photochromic effect in near-stoichiometric LiNbO3 with applications to holographic storage. J. Appl. Phys. 2001, 89, 5311. [Google Scholar] [CrossRef]
  266. Miki, T.; Hantehzadeh, M.R.; Halliburton, L.E. A new trapped-hole center in irradiated LiNbO3. J. Phys. Chem. Solids 1989, 50, 1003–1007. [Google Scholar] [CrossRef]
Figure 1. (a) Ideal lattice of lithium tantalite (LT). To simplify the representation of the lattice and defect structures in it, the sizes of “balls” imitating ions were made intentionally different. The L (Left) and R (Right) positions are distinguished by their different oxygen surroundings. (b) An illustration of local C3 symmetry for the nearest surroundings of cation sites and glide mirror zy plane that transforms the L center to the R partner; a projection of one Li, Ta layer between two oxygen layers on the xy plane is shown.
Crystals 11 00339 g001
Figure 2. Fragments of electron paramagnetic resonance (EPR) spectra of Nd3+ impurity ions in nearly stoichiometric lithium niobate (LN) for microwave frequency ν = 34.445 GHz, T = 19 K. The numbers 1–4 correspond to four different electrically non-equivalent defects. Lines of magnetically nonequivalent partners have the same number.
Crystals 11 00339 g002
Figure 3. (a) Projection of ideal lithium niobate lattice with Nd3+ impurity ion on xy plane (artificial sizes of balls are used). (b) Circular diagram of measured angular dependence of electron paramagnetic resonance (EPR) lines of Nd3+ ions in Figure 3. Magnetic field was rotated in xy plane from 0 to 360 deg. ν = 34.445 GHz, T = 19 K. Symbol sizes reflect line intensities.
Crystals 11 00339 g003
Figure 4. (a) The road map rotation corresponds to the following changes of the θ, ϕ angles: θ = 0–90° at ϕ = 0°; θ = 90°, ϕ = 0−90°; θ = 0−90° at ϕ = 90°. (b) Angular dependence of the EPR spectra in xy plane for nearly stoichiometric LN:Nd3+. Rhombs represent experimental line positions for Q-band measurements (ν = 34.445 GHz), their sizes reflect line intensities. Horizontal whiskers near rhombs represent line widths. Cyan, lime, fuchsia, and blue curves represent simulated dependencies for axial Nd1, and low-symmetry Nd2, Nd3, and Nd4 centers, respectively. Curves for isotopes with nuclear spin I ≠ 0 are not shown.
Crystals 11 00339 g004
Figure 5. Surroundings of impurity ions substituted for Li (a) and Nb (b) in LN crystal lattice with corresponding shell numbers. Large blue balls represent Li+ ions, medium green balls—Nb5+ ions, small red balls—O2− ions, and the largest magenta ball—the impurity ion.
Crystals 11 00339 g005
Figure 6. Angular dependence of electron nuclear double resistance (ENDOR) frequencies of Li nuclei in xy plane for the Nd13+ center in LiNbO3. The green, red and blue curves—calculated frequencies for Li nuclei of the 1st, 2nd and 3rd shells based on dipole-dipole interaction for Nd3+Li (a,b), and Nd3+Nb (c). ENDOR frequencies represented on the part (b) were measured at magnetic fields corresponding to the position of dominant EPR line #1 on Figure 2 (B = 820 mT for ν = 34.445 GHz, rhombs, and B = 228 mT for ν = 9.500 GHz, triangles). νLarmor is Larmor frequency of 7Li nuclei.
Crystals 11 00339 g006
Figure 7. A projection of lithium niobate crystal lattice on xy plane (a) and 3D model (b) with shell numbers for an impurity substituted for Li+ ion (sizes of all ions were artificially changed in order to make clear positions of cation ions). Hatched circles represent two vacancies of Li+ ions for Nd4 center.
Crystals 11 00339 g007
Figure 8. Divacancy models for an impurity substituted for Li+ ion in LN crystal lattice. Hatched circles represent two vLi. (a) Axial center, (b) nearly axial center, (c) low-symmetry center.
Crystals 11 00339 g008
Figure 9. (a) X-band EPR spectra of Ni+ in LiNbO3 at θ = 25 deg in zy plane at various temperatures T: 1–40 K, 2–90 K, 3–151 K, 4–206 K, 5–244 K, 6–300 K. The spectrum 7 was measured at θ = 0 deg, T = 300 K. (b) Distortion of oxygen octahedron due to the Jahn-Teller effect.
Crystals 11 00339 g009
Figure 10. (a) Measured EPR spectra of Co2+, X-band, T = 5 K. 1—sLN, B||z; 2—sLN, B||x; 3—cLN, B||x. The red arrow indicates an additional line assigned to clusters of Co2+ ions. (b) Possible model for a cluster of four Co2+ ions substituted for one Nb5+ and three Li+ ions.
Crystals 11 00339 g010
Figure 11. (a) Measured EPR spectrum of Cu2+ in LN, X-band, T = 7 K. (b) Distortion of oxygen octahedron due to Jahn-Teller effect.
Crystals 11 00339 g011
Figure 12. (a) Measured EPR spectrum of Mn2+ in LNK, ν = 34.45 GHz. (b) Model of axial Mn2+Li center with vLi.
Crystals 11 00339 g012
Figure 13. Measured EPR spectrum of Cr3+ in LN grown from the melt with xm ≈ 60% and 0.1 wt.% of Cr (room temperature, ν = 9.84 GHz). Black braces indicate lines of dominant Cr3+ center, red arrows—lines of satellite centers.
Crystals 11 00339 g013
Figure 14. The ENDOR spectra of Cr3+Li (high-field EPR transition) and Cr3+Nb (central EPR transition) at B||x, T = 5 K. To facilitate a comparison of the spectra, they were shifted to the 93Nb Larmor frequencies.
Crystals 11 00339 g014
Figure 15. The angular dependencies of EPR spectra in the xy plane for LN:Cr3+ grown from the melt with xm ≈ 60%, ν = 9.26 GHz. Rhombs represent line positions; their sizes are proportional to line intensities. Horizontal whiskers near rhombs represent line widths. Cyan, lime, fuchsia, and blue curves represent simulated dependencies for axial Cr1, and low-symmetry Cr2, Cr3, and Cr4 centers, respectively.
Crystals 11 00339 g015
Figure 16. (a) Measured EPR spectra of Cr3+ in LN grown from the melt with addition of K2O and 1 wt.% of Cr; room temperature, ν = 9.445 GHz. (b) Model of Cr3+Nb center.
Crystals 11 00339 g016
Figure 17. (a) EPR spectra of Er3+ in congruent and stoichiometric LN at B||z, X-band. (b) Calculated angular dependence of EPR spectra in xy plane for the Er13+ (green lines) and Er23+ (fuchsia lines) centers in sLN. Symbols with horizontal whiskers represent line position and widths.
Crystals 11 00339 g017
Figure 18. Normalized spectra of Fe3+ in LN (a) and LT (b), X-band. (a) Congruent (1), grown with xm = 0.545 (2), undoped sample grown from congruent the melt with 6 wt% of K2O (3), B||z. (b) Congruent (1), vapor transport equilibrium (VTE) treated sample (2), B||x.
Crystals 11 00339 g018
Figure 19. Possible structures of Me3+Nb5+ (large magenta ball) centers in LN. Structure with one (a) and two (b) additional Li ions in voct (marked with red crosses). Axial (c) and low-symmetry (d) structures with two Mg2+Li+ ions.
Crystals 11 00339 g019
Figure 20. Angular dependence of ENDOR frequencies of Li nuclei in xy plane for the Fe23+ center in LiTaO3. The green, magenta, blue and lime curves—calculated frequencies for Li nuclei of the 1st, 2nd, 3rd and 4th shells based on dipole-dipole interaction for Fe3+Li (a), and Fe3+Nb (b). Fuchsia lines on (b)—calculated frequencies for the additional Li nucleus in the nearest voct on the axis of Fe3+Nb center. ENDOR frequencies represented by rhombs were measured on the EPR line at B = 1162 mT (ν ≈ 34.5 GHz).
Crystals 11 00339 g020
Figure 21. The angular dependencies of EPR spectra in xy plane for Li-rich LN:Gd3+, ν = 9.26 GHz. Rhombs represent line positions; horizontal whiskers—line widths. Cyan, lime, fuchsia, and blue curves are simulated dependencies for axial Gd1, and low-symmetry Gd2, Gd3, and Gd4 centers, respectively.
Crystals 11 00339 g021
Figure 22. EPR spectra of Yb3+ in congruent (a, c) and stoichiometric (b, d) LN.
Crystals 11 00339 g022
Figure 23. Angular dependence of EPR spectra of Yb3+ in stoichiometric LN, xy plane, ν = 9.86 GHz. Red arrows—lines of hyperfine structure for Yb5 centers.
Crystals 11 00339 g023
Figure 24. (a) EPR spectra of Nb4+ centers in cLN (1) and cLN doped with 6 mol.% Mg (2) and 10 mol.% Mg (3), X band. (b) Model for axial Nb4+Nb – Mg2+Li center.
Crystals 11 00339 g024
Figure 25. Models for Nb4+Li (large green ball) centers with three vLi in LN. Hatched circles represent lithium vacancies. (a) Axial center. (b) Low-symmetry center. (c) The center with O near Mg2+ substituted for Nb5+.
Crystals 11 00339 g025
Table 1. Sites for lithium vacancies, vLi in the surroundings of Me3+Li centers in LiNbO3.
Center
vLi Site
Me1Me2Me3Me4Me5Me6Me7Me8
First5a/5b1a/1b2a/2b1a1b1a/1b2a/2b5a
Seconddistant5a/5b5b/5b2a2b3a/3b3a/3b5b
Publisher’s Note: MDPI stays neutral with regard to jurisdictional claims in published maps and institutional affiliations.

