Abstract
For this study, 21 samples of colorless octahedral diamonds (weighing 5.4–55.0 mg) from the Mir pipe (Yakutia) were investigated with photoluminescence (PL), infrared (IR), and electron paramagnetic resonance (EPR) spectroscopies. Based on the IR data, three groups of diamonds belonging to types IIa, IaAB, and IaB were selected and their spectroscopic features were analyzed in detail. The three categories of stones exhibited different characteristic PL systems. The type IaB diamonds demonstrated dominating nitrogen–nickel complexes S2, S3, and 523 nm, while they were less intensive or even absent in the type IaAB crystals. The type IIa diamonds showed a double peak at 417.4 + 418.7 nm (the 418 center in this study), which is assumed to be a nickel–boron defect. In the crystals analyzed, no matter which type, 490.7, 563.5, 613, and 676.3 nm systems of various intensity could be detected; moreover, N3, H3, and H4 centers were very common. The step-by-step annealing experiments were performed in the temperature range of 600–1700 °C. The treatment at 600 °C resulted in the 563.5 nm system’s disappearance; the interstitial carbon vacancy annihilation could be considered as a reason. The 676.5 nm and 613 nm defects annealed out at 1500 °C and 1700 °C, respectively. Furthermore, as a result of annealing at 1500 °C, the 558.5 and 576 nm centers characteristic of superdeep diamonds from São Luis (Brazil) appeared. These transformations could be explained by nitrogen diffusion or interaction with the dislocations and/or vacancies produced.
1. Introduction
The Mir pipe (Yakutia), discovered in 1955, was the second kimberlite pipe found in Russia. It is characterized by a high diamond content and a high number of gem-quality diamonds. Another interesting feature of this deposit is the abundance of low-nitrogen diamonds of type IIa, which are relatively rare in nature. Diamonds from the Mir pipe have been thoroughly studied throughout the years. Most crystals have octahedral or transient octahedral-to-rhombododecahedral morphology with a small number of rounded-shaped crystals [1,2,3,4]. The colorless crystals with pink and brown hues of different intensities prevail [2,3,4]. Among the diamonds of the deposit, traces of heavy natural etching or dissolution are uncommon [3,4]. The mineral inclusions in diamonds from the Mir pipe correspond mostly to peridotite paragenesis of their host rocks [1,2,3,5].
As is known, nitrogen is a common impurity in natural diamonds. According to nitrogen content, diamonds are classified into nitrogen-containing type I and nitrogen-free type II. In practice, the nitrogen concentration for type II diamonds ranges from less than 1 ppm to an order of 10 ppm in different works [6,7]. Type II diamonds are further subdivided into type IIa and type IIb. The type IIb diamonds contain boron impurities and exhibit semiconducting properties. Depending on the form of nitrogen aggregation, type I diamonds are subdivided into type Ib (C center, single substitutional nitrogen atom) and type Ia. Additional labeling of type Ia diamonds with letters A (A center, two nitrogen atoms in adjacent carbon positions) and/or B (B center, four nitrogen atoms in carbon positions around a vacancy) is used to indicate the dominating form of nitrogen defects. It is generally accepted that nitrogen is incorporated in a dispersed state during diamond formation and forms various types of nitrogen aggregates at mantle conditions [7,8].
An interesting feature of the Mir pipe is the high degree of low-nitrogen diamonds. It was found that the nitrogen content mostly depended on the size of the crystal. For example, for diamonds of 1–2 mm sieve size, the fraction of low-nitrogen diamonds (Ntot < 300 ppm) reaches a value of 50%, whereas for diamonds of 2–4 mm sieve size, the fraction of low-nitrogen diamonds is much lower [1]. For 30 selected diamond crystals of 1–2 mm sieve size, a thorough investigation was performed, with infrared (IR) spectroscopy giving a total nitrogen content of Ntot = 413 ppm and aggregation of %B = 35% [1]. In a previous study [2], 81 crystals were studied from a batch of diamonds from the Mir pipe. Most crystals were characterized as having a moderate nitrogen concentration (400 < Ntot < 1500 ppm) with a low degree of aggregation (10 < %B < 40) [2]. Such crystals experienced annealing at 1050–1100 °C, according to the Taylor diagram. Overall, the average values of Ntot = 562 ppm and %B = 31% [2] correlate with those from [1]. The average intensity of the hydrogen-related peak at 3107 cm−1 was 0.9 cm−1 and the average intensity of the platelet-related peak around 1365 cm−1 was 3 cm−1 [2].
Thus, diamond crystals from the Mir pipe demonstrate various morphologies, defect distributions, internal structures, and compositions of inclusions. Some works have been devoted to the investigation of interesting mixed-habit diamond crystals with octahedral following cuboid growth [9,10,11,12]. It was found that the nitrogen content and aggregation tended to decrease from the core regions toward the rim zones. While the first fact can be explained by the change in medium composition or different growth kinetics for different sectors, the latter can be explained by the octahedral growth following the formation of the core region. For some crystals, the nickel–nitrogen centers NE1/S3, NE2/S2, and NE3/523 nm were observed in the photoluminescence spectra, with a higher concentration in the cuboid core with respect to the outer rim zone [9,12].
Interestingly, in low-nitrogen diamond crystals from the Mir pipe, the paramagnetic center NIRIM5/NOL1 was detected, which was ascribed to the photoluminescence system 418 nm (double peak at 417.4 + 418.7 nm) [13]. The NIRIM5/NOL1 has electron spin equal to 1 and, by assumption, consists of nickel and boron atoms in adjacent carbon positions. This defect was also found in synthetic high pressure high temperature (HPHT) diamond crystals grown in a nickel-containing solvent catalyst with Ti as a nitrogen getter [14].
The present work is devoted to the investigation of octahedral diamonds without traces of severe resorption of 5.4–55.0 mg from the Mir kimberlite pipe (Yakutia). The mechanisms of the formation of impurities and intrinsic defects in octahedral diamonds during their growth history have not yet been fully described. Here, the data on 21 colorless diamond crystals of distinct types IIa, IaAB, and IaB are given. For four samples that differed by nitrogen concentration and aggregation, the results of step-by-step annealing at temperatures of 600–1700 °C are discussed. The behavior of defects in natural diamonds during annealing experiments provides information about diamond growth and post-growth history.
2. Materials and Methods
The IR spectra were measured point by point (with a beam diameter of 30 μm) with a Bruker VERTEX 80 (Bruker Optics Inc., Billerica, MA, USA) spectrometer in the range of 700–4000 cm−1 at room temperature with a resolution of 0.5 cm−1. Photoluminescence spectra were measured for bulk crystals at 80 K using a DFS-24 spectrometer (LOMO, Saint Petersburg, USSR); for excitation, we used the 313 nm line (filtered by a UFS-2 glass, bandpass region ~285–365 nm) of a mercury DRT-230 lamp (LOMO, Saint Petersburg, USSR) and diode-pumped solid-state (DPSS) lasers emitting at 405 and 532 nm. Electron paramagnetic resonance (EPR) spectra were measured for bulk crystals with a Varian E-109 EPR spectrometer (Varian Associates, Palo Alto, CA, USA) (continuous-wave mode) in the X and Q frequency bands at temperatures of 80 and 300 K. Experiments on annealing at 600 and 1000 °C were performed in a graphite crucible at ambient pressure for 2 hours [15]. Experiments on annealing at 1500 and 1700 °C were performed under a stabilizing pressure of 6 GPa for 1.5 h via the split-sphere multi-anvil apparatus (BARS) [16].
The selected diamonds from the Mir pipe (collection of Nikolaev Institute of Inorganic Chemistry SB RAS, Novosibirsk, Russia) were colorless, octahedral crystals with step-plate development of octahedral faces (Figure S1, Supplementary Materials). Some crystals have a sufficiently distorted stepped form. The weight of the studied samples varied from 5.4 to 55.0 mg. Although the diamond crystals discussed did not show dodecahedral or tetrahexahedral faces and consequently were not subjected to essential resorption, traces of etching were visible. Negatively oriented, terraced and flat-bottomed trigons could be readily found on the surfaces of the crystals, but positively oriented trigons were also observed. Parallel rows of resorption trigons were visible, indicating the deformation lines on the octahedral crystal faces. To investigate the transformation of centers during annealing, the four diamond crystals (AO1666, AO1680, AO1858, and AO1894) with different amounts of nitrogen content and aggregation were selected. For each crystal, two opposite octahedral faces were polished, with a weight loss of 0.5 mg (Figure 1).
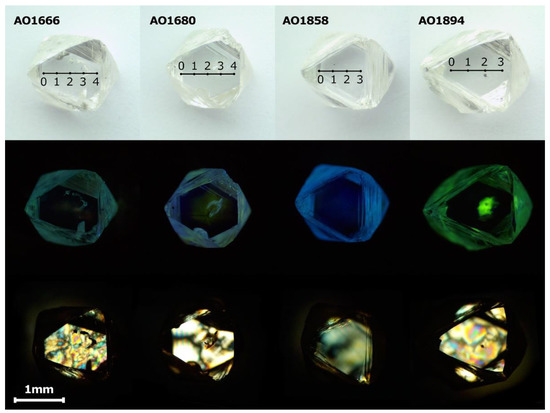
Figure 1.
Optical microscopic photographs, photoluminescence images, and birefringence images of AO1666, AO1680, AO1858, and AO1894 samples after polishing. The photoluminescence (PL) images were made with excitation at λ = 405 nm using a 450 nm filter. The AO1666 shows birefringence known as a “tatami” type, typical of type IIa diamonds. The bright birefringence of the AO1666 and AO1894 crystals demonstrates the vulnerability of low-nitrogen diamonds to plastic deformation. The birefringence pattern of the AO1680 crystal reflects the zonal structure and correlates with the photoluminescence image. The AO1858 crystal demonstrates birefringence typical of type I diamonds with a number of dislocations.
3. Results and Discussion
3.1. IR Investigation
Diamonds from the selection belonged to the types Ia and IIa. In crystals, either the A or B form of nitrogen dominated; the C center (with a sharp peak at 1344 cm−1) was not detected. For the diamond crystals under study, the aggregation (%B) fell within the wide range of values ~10–90%. The total nitrogen concentration varied from several ppm to approximately 1900 ppm. Hydrogen-related peaks at 1405, 2786, 3107, 3235, and 4498 cm−1 were observed. These are thought to be combinations and overtones of stretch and bend vibration modes of VN3H and/or VN4H defects [17,18]. For several crystals, the 2850 and 2920 cm−1 peaks were visible. The nature of these peaks remains unclear; however, these can be reasonably considered as the manifestation of CH vibrations [19,20,21]. The absorption coefficient of the most prominent peak at 3107 cm−1 is given in Table S1. An unambiguous linear correlation between the intensity of the peak at 3107 cm−1 and the total nitrogen concentration was not found (see Figure S2). However, the points do not fit the linear trend only for three crystals of the twenty-one, which can be explained by the complex growth history of these crystals with zonal structures. As proposed, a linear correlation indicates that nitrogen and hydrogen constitute some compounds present in the growth medium, which are thought to be NH3, NH4 gases [19], or organic compounds [1].
The absorption coefficient of the platelet-related peak at 1360–1370 cm−1 reached a value of up to 7.2 cm−1 (Figure 2). Platelets were detected in diamonds with a rather high content of nitrogen, proposing the important role of nitrogen in platelet formation. The mechanism of the platelets’ formation is still unknown. It is generally accepted that while the interstitial atoms form platelets, the released vacancies take part in the formation of B centers [22,23,24]. The platelets’ behavior was investigated for four diamond crystals where the platelets’ peaks were sufficiently intensive (Figure S3). The procedure of platelet peak fitting is given in [24,25]. The AO1239, AO1680, and AO1992 diamonds can be assigned to subregular types according to platelet behavior, while the AO1406 diamond can be assigned to a regular one. The model temperature for subregular diamonds is 1090–1120 °C and 1120–1220 °C for regular ones. These data correlate with the Taylor diagram [26] drawn for these crystals (see Figure S4). The subregular diamonds were characterized by smaller-sized platelets as compared with regular ones; the growth features of cuboid sectors were proposed to be the reason. It is interesting that in our work, platelets with subregular behavior were found in the octahedral growth sectors.
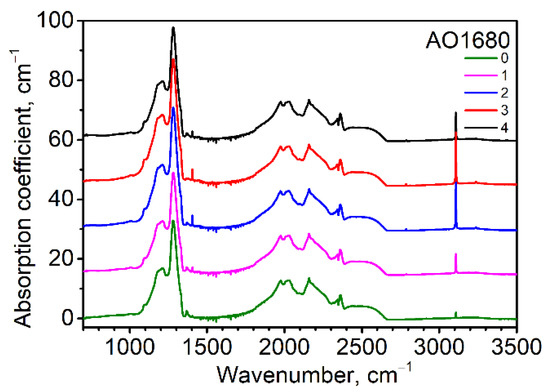
Figure 2.
Infrared (IR) spectra corresponding to point positions given in Figure 1 for the AO1680 diamond sample (plate) from the Mir deposit. The spectra were shifted for clarity. The 2340–2360 cm−1 feature is a CO2 artifact.
The Taylor diagram for all of the diamond crystals is shown in Figure 3. The scattering of the points can be partially explained by the fact that some diamond samples have a zonal structure. The samples fall into three distinct groups according to types IIa, IaAB, and IaB, respectively. The distribution of for the samples is shown in Figure S5 [8].
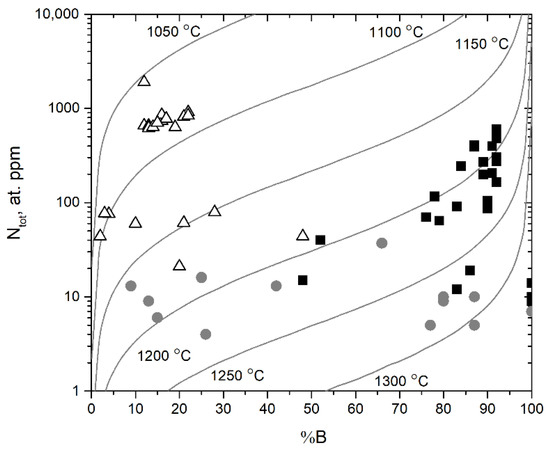
Figure 3.
Nitrogen aggregation state (% B) vs. total nitrogen content (Ntotal) for our collection of Mir diamonds. Isotherms for 1050–1300 °C and diamond mantle residence time of 3 Ga are based on Taylor et al. [26]. The triangles, squares, and circles reflect the division of diamonds into type IaAB, type IaB, and type IIa, respectively. Each point corresponds to the measured IR spectrum.
3.2. EPR Investigation
For the diamond crystals under study, EPR demonstrated rather weak spectra. For the three samples AO1239, AO1680, and AO1992, the nitrogen-related centers P1 (single substitutional nitrogen) and P2 (N3V complex with three substitutional nitrogen atoms around vacancy) were observed. These crystals are rich in nitrogen, according to Table S1. For the sample with the highest nitrogen content (AO1992), the concentrations of nitrogen-related paramagnetic centers were evaluated. The concentrations were ~0.02 ppm and ~0.2 ppm for P1 and P2, respectively; thus, the absence of C centers in the IR spectra was unsurprising.
The common spectrum in the selected diamonds was a single line of slightly distorted shape with a peak-to-peak width that varied in the range of 0.32–0.36 mT and a g-factor equal to 2.0032 (Figure 4). This spectrum was reported to manifest itself mostly in plastically deformed IaA diamonds. It was correlated with the 490.7 system in photoluminescence (PL) and assigned to dangling bonds in the dislocation cores [27]. A correlation of the EPR spectrum with the 490.7 system in PL was observed in our case except for one crystal, AO1680.
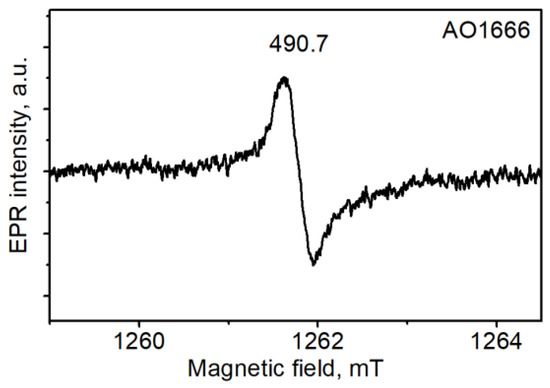
Figure 4.
Electron paramagnetic resonance (EPR) spectrum of the AO1666 plate measured at room temperature.
3.3. Photoluminescence
The photoluminescence images of the samples obtained with excitation at 405 nm are shown in Figure S1; they reflect the zonal structure of some of the crystals. According to the obtained PL spectra, three groups of crystals demonstrated different systems. The type IIa diamonds had a characteristic PL center at 417.4 + 418.7 nm; the type IaB diamonds had characteristic nickel–nitrogen centers (S2, S3, and 523 nm); and the mixed IaAB-type diamonds demonstrated no specific systems but common N3 (415 nm), H3 (503 nm), and H4 (496 nm). The centers 490.7, H3, H4, N3, 563.5, 613, and 676.5 nm were present in many crystals, regardless of the nitrogen content and aggregation. Note that the 490.7 nm center was widely observed, although the diamonds studied were colorless by sight. The H3 center was the most common optical feature observed for natural diamonds that were radiation-damaged and thermally annealed. However, the presence of the H3 center in unirradiated natural diamonds can be considered as an indication of plastic deformation. An interesting feature that should be discussed is the low intensity or even absence of nickel-related centers in the photoluminescence spectra of type IaAB diamonds. The lack of nickel-related centers, as well as the data on nitrogen content and aggregation, suggest a considerably lower temperature of diamond growth [9]. Thus, several episodes of diamond formation can be considered, resulting in such a diverse set of diamonds [9,10,11,12].
A vibronic system at 418 nm (417.4 + 418.7) was observed in the PL spectra of the type IIa diamonds from the selection. Previously, this was detected in some synthetic [28] and natural diamonds [13,29] with low nitrogen content. For this system, the temperature dependence of the PL lifetime was investigated [29]; it was found that the long lifetime in luminescence was due to electron tunneling between the triplet- and singlet-excited states, i.e., nonradiative processes [29]. The structure of the defect in the form of a Ni-B pair in adjacent carbon positions was proposed [13].
The center with a zero-phonon line (ZPL) at 490.7 nm widely observed in diamonds from the Mir pipe is usually detected in natural plastically deformed type Ia diamond crystals. The nature of this center has not been established, despite its abundance and known properties [30,31,32]. It is assumed that the defects responsible are formed during the plastic deformation of diamond crystals. The center correlates with the EPR signal, presumably attributed to dangling bonds in the dislocation core [27]. It is also possible that the 490.7 nm center is related to a complex involving several nitrogen atoms and vacancies [33,34].
The spectrum with a zero-phonon line (ZPL) at 563.5 nm is characteristic of diamonds from the Mir pipe. Previously, the 563.5 nm center was described for diamond crystals from the Aikhal pipe (Yakutia), where it was highly intensive [25]. The structure of the observed defect remains unknown; the spectrum disappeared as a result of annealing at 600 °C, indicating the interstitial vacancy annihilation mechanism [25].
The 613 nm center is observed in diamonds of different types and has been described in many works [6,34,35,36]. The ZPL at 612.4 nm was accompanied by phonon replicas with phonon energies of 17, 43 (longwave acoustic modes), and 77 meV (acoustic diamond lattice vibration) [6]. The PL lifetime equal to 10−8 sec indicated an allowed transition [6]. The 613 nm center was noted to be more intensive in the cubic core than in the cubo-octahedral, peripheral zone of diamond crystals from the Mir deposit [9].
The system with a ZPL at 676.5 nm accompanied by a phonon replica with phonon energy of 61 meV was observed in most of our crystals. Information about the 676.5 nm center is scarce; it is observed in the absorption and PL spectra of natural, untreated diamonds [37,38].
A low-intensity GR1 center (V0) with a ZPL at 741 nm was noted in half of the crystals. The small concentration of GR1 centers in the untreated samples is believed to be a result of the plastic deformation of the diamonds or of radiation in the post-growth period [6].
3.4. Annealing Experiments
To study the transformation of defects, four diamond crystals with different amounts of nitrogen content and aggregation were selected and their step-by-step annealing was performed (Figure 5 and Figure 6). Interesting results were obtained, although the characteristic systems of 563.5, 613, and 676.5 nm behaved regardless of the type of diamond.
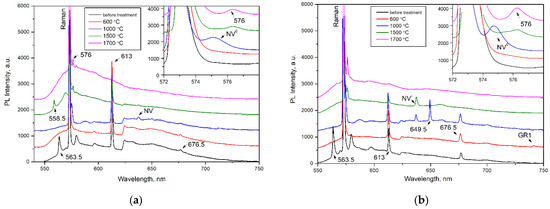
Figure 5.
PL spectra (λex = 532 nm) of the (a) AO1666 and (b) AO1894 diamonds. Insets show the changes in the 575 and 576 nm PL systems. The spectra were shifted for clarity.
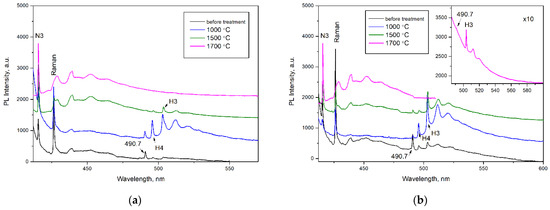
Figure 6.
PL spectra (λex = 405 nm) of the (a) AO1666 and (b) AO1894 diamonds. Inset in (b) shows the weak 490.7 nm and H3 (503.2 nm) systems in the PL spectrum of the AO1894 diamond annealed at 1700 °C. Treatment at 600 °C produces no changes in the PL spectra when excited at λex = 405 nm. The spectra were shifted for clarity.
After treatment at 600 °C for 2 hours (in a graphite crucible at ambient pressure), the 563.5 nm defect was completely annealed, as expected from previous work [25]. An increase in annealing temperature up to 1000 °C (annealing for 2 hours by the same procedure) led to an increase in H3 (A center + vacancy) and H4 (B center + vacancy) centers and the appearance of the NV−, NV0, and 649.5 nm centers. The GR1 center annealed out, reflecting the mobility of vacancies. As expected, the formation of H3 and H4 centers involved the migration of vacancies and trapping by A and B centers [39]. The formed 649.5 nm defect was accompanied by a phonon replica with an energy of 30 meV. This defect was most intensive in the AO1894 crystal of type IaB. The formation temperature of this center allowed us to propose the vacancy in its structure. Moreover, the AO1894 crystal had the GR1 system with the highest intensity among all four crystals, in addition to the 490.7 system.
The following treatment performed at 1500 °C and a pressure of 6.0 GPa for 1.5 h (with the BARS apparatus) led to an increase in the N3 system simultaneously with the decrease in the H3 and H4 systems. As is known, the N3 is very stable and anneals out at only 2500 °C [7]. This treatment led to the disappearance of the 676.5 nm and 649.5 nm centers but the appearance of a 576 nm center, which is characteristic of plastically deformed, brown diamond crystals [6,40,41,42]. The 576 nm center dominated the PL spectra of plastically deformed superdeep diamonds from São Luis (Brazil) [6]. Previously, the formation of this defect was also detected in type IaB natural diamonds as a result of annealing at 2200 °C for 30 min; a model of the NV(NVN)VN defect in the (110) plane has been proposed [43]. The 558.5 nm center was formed in the AO1666 type IIa crystal after annealing at 1500 °C. This center was described in [6] as a characteristic feature of diamond crystals from the São Luis deposit. The broken carbon bonds in the dislocation core were presumably involved in the structure of this defect. The vibronic sideband of the 558.5 nm center was determined by the interaction between the electronic transition and quasi-local vibration of 40 meV, which, in general, indicates the presence of a vacancy in the center [6]. The appearance of 558.5 and 576 nm centers in Yakutian samples indicates that diamonds from the São Luis (Brazil) deposit have been exposed to higher effective temperatures [44].
Annealing at 1700 °C and a pressure of 6.0 GPa for 1.5 hours (performed with the BARS apparatus) resulted in a further increase in the intensity of the 576 nm system. At the same time, the H3 system decreased and the H4 system, along with the 613 nm system, disappeared. The annealing temperature of the 613 nm system accorded with the published works [41,45,46]. The 490.7 nm center fell drastically as a result of annealing at 1500 °C and annealed out completely as a result of annealing at 1700 °C; this reflects the thermally activated diffusion of dislocations (Figure 6). The decrease in the intensity of the 490.7 nm system was accompanied by the growth of the N3 system (manifestation of N3V defect), which is consistent with the data presented by previous authors [27,47]. The plastic deformations decomposed the B defects, producing the N3V and C defects. The disappearance of the 613 and 676.5 nm centers characteristic of diamonds from the Mir pipe took place in all four diamond crystals, regardless of the nitrogen concentration and aggregation. Thus, their interaction with dislocations can be proposed, although an interaction with mobile nitrogen cannot be excluded. The PL data are in accordance with the IR spectra. While the heat treatments at 600–1000 °C did not change the IR spectra, the HPHT treatments produced a visible decrease in the peak at 3107 cm−1 (Figure S6). It was established in [48] that, as a result of HPHT treatments, the 3107 cm−1 interacted with dislocations and/or vacancies to produce defects inactive in IR absorption. As expected, after the HPHT treatments in EPR, the 490.7 signal fell and a slight increase in P1 and P2 centers was observed. However, the 490.7 EPR signal did not disappear completely as a result of annealing at 1700 °C. This fact contradicts the PL measurements and will be the subject of further investigation.
4. Conclusions
A series of 21 octahedral diamonds weighing 5.4–55.0 mg from the Mir pipe (Yakutia) were investigated with a combination of spectroscopic methods, namely IR, PL, and EPR. These crystals are colorless octahedra with step-plate development of octahedral faces and slight traces of resorption and etching. The diamond crystals were selected to represent three distinct sets of temperature and mantle storage duration conditions. The type IIa diamonds were characterized by a 417.4 + 418.7 nm PL center, while type IaB diamonds demonstrated nickel-related centers (S2, S3, and 523 nm). The type IaAB crystals were usually free of nickel-related centers and displayed the common centers N3, H3 (503 nm), and H4 (496 nm). It should be noted that the lack of nickel-related defects in type IaAB diamonds (and their absence after HPHT treatment) distinguishes this group of diamonds. This fact, in association with the IR data, proposes several stages of diamond growth. The 490.7 nm system correlating with the corresponding EPR spectrum was detected, as well as the N3 (415 nm), H3 (503 nm), H4 (496 nm), 563.5, 613, and 676.5 nm systems. To investigate the properties of defects characteristic of diamonds from the Mir pipe, step-by-step annealing experiments were performed in the temperature range of 600–1700 °C. After treatment at 600 °C, the 563.5 nm defect was completely annealed, assuming that interstitial carbon vacancy annihilation was involved. The 676.5 and 613 nm defects annealed out at 1500 °C and 1700 °C, respectively; thus, thermally activated mobility of dislocation or nitrogen can be considered a reason. It should be noted that the 558.5 and 576 nm centers eventually appeared in Yakutian samples as a result of annealing at 1500 °C. These defects are characteristic of superdeep diamonds from São Luis, Brazil, with higher effective storage temperatures.
Supplementary Materials
The following are available online at https://www.mdpi.com/article/10.3390/cryst11040366/s1, Table S1: Characteristics of the Mir diamond crystals selected. The IR spectra were measured rim-center-rim (for diamond plates, the point positions are given in Figure 1), Figure S1: Optical microscopic photographs and photoluminescence images of diamonds under study. The latter ones were made with a 450 nm filter and excitation at λ = 405 nm, Figure S2: The 3107 cm−1 peak area vs. the total nitrogen concentration Ntotal for the diamonds under study. In the fitting procedure, the Lorentzian line shape function with a linear baseline was applied. The triangles, circles, and diamonds correspond to the AO1747, AO1680, and AO1992 crystals, respectively, Figure S3: (a) Platelet peak area (I(B’)) vs. the content of B defects, (b) Platelet peak area (I(B’)) vs. the position of the peak maximum (x), (c) Platelet peak width (full-width at half maximum, FWHM) vs. the position of the peak maximum (x) in diamond crystals AO1239, AO1406, AO1680, and AO1992. The red dashed lines are “regular” trends taken from [24], Figure S4: Nitrogen aggregation state (% B) vs. total nitrogen content (Ntotal) for diamond crystals AO1239, AO1406, AO1680, and AO1992. Isotherms for 1050–1300 °C and diamond mantle residence time of 3 Ga are based on Taylor et al. [26]. Each point corresponds to the measured IR spectrum, Figure S5: The distribution of obtained from IR spectra measured on Mir diamond crystals. Aggregation of A centers to B centers obeys second-order kinetics with formulas and , where K is a rate constant, A is a pre-exponential factor, E is an activation energy for the reaction, k is a Boltzmann constant, C and C0 are A center concentrations before and after heating at temperature T for time t [8], Figure S6: IR spectra of the AO1680 diamond sample (plate) from the Mir deposit. The spectra were shifted for clarity. The 2340–2360 cm−1 band is a CO2 artifact.
Author Contributions
Conceptualization, M.I.R.; methodology, Y.N.P., O.P.Y., and V.A.N.; investigation, M.I.R., A.Y.K., and A.A.K.; writing—original draft preparation, M.I.R. and A.Y.K.; writing—review and editing, Y.N.P., O.P.Y., and V.A.N.; visualization, M.I.R. and A.Y.K.; supervision, O.P.Y. and V.A.N. All authors have read and agreed to the published version of the manuscript.
Funding
This research was supported by the Russian Science Foundation under grant no. 20-77-00039. Experiments on HPHT annealing were supported by state assignment of IGM SB RAS.
Institutional Review Board Statement
Not applicable.
Informed Consent Statement
Not applicable.
Data Availability Statement
The data presented in this study are available on request from the corresponding author.
Conflicts of Interest
The authors declare no conflict of interest. The funders had no role in the design of the study; in the collection, analyses, or interpretation of the data; in the writing of the manuscript, or in the decision to publish the results.
References
- Khachatryan, G.K. Nitrogen and Hydrogen in Diamonds of the World as Indicators of Their Genesis and Criteria for Predicting and Searching for Primary Diamond Deposits. Ph.D. Thesis, Central Research Institute of Geological Prospecting for Base and Precious Metals, Moscow, Russia, 2016. (In Russian). [Google Scholar]
- Kriulina, G.Y. Constitutional Characteristics of Diamond Fields of the Arkhangelsk and Yakutian Diamondiferous Provinces. Ph.D. Thesis, M.V. Lomonosov Moscow State University, Moscow, Russia, 2012. (In Russian). [Google Scholar]
- Zinchuk, N.N.; Koptil, V.I. Specific features of diamonds from promising areas of Sibirian platform. Bull. Perm Univ. Geol. 2015, 2, 41–54. (In Russian) [Google Scholar] [CrossRef]
- Orlov, Y.L.; Afanasyeva, E.A. The origin of types I, II diamonds and reasons for their different physical properties. New Data Miner. 1966, 17, 105–118. (In Russian) [Google Scholar]
- Yuryeva, O.P.; Rakhmanova, M.I.; Zedgenizov, D.A. Nature of Type IaB Diamonds from the Mir Kimberlite Pipe (Yakutia): Evidence from Spectroscopic Observation. Phys. Chem. Miner. 2017, 44, 655–667. [Google Scholar] [CrossRef]
- Yuryeva, O.P.; Rakhmanova, M.I.; Nadolinny, V.A.; Zedgenizov, D.A.; Shatsky, V.S.; Kagi, H.; Komarovskikh, A.Y. The Characteristic Photoluminescence and EPR Features of Superdeep Diamonds (São-Luis, Brazil). Phys. Chem. Miner. 2015, 42, 707–722. [Google Scholar] [CrossRef]
- Dobrinets, I.A.; Vins, V.G.; Zaitsev, A.M. HPHT-Treated Diamonds; Springer Series in Materials Science; Springer: Berlin/Heidelberg, Germany, 2013; Volume 181, ISBN 978-3-642-37489-0. [Google Scholar]
- Evans, T.; Qi, Z. The Kinetics of the Aggregation of Nitrogen Atoms in Diamond. Proc. R. Soc. Lond. A 1982, 381, 159–178. [Google Scholar] [CrossRef]
- Skuzovatov, S.Y.; Zedgenizov, D.A.; Rakevich, A.L.; Shatsky, V.S.; Martynovich, E.F. Multiple Growth Events in Diamonds with Cloudy Microinclusions from the Mir Kimberlite Pipe: Evidence from the Systematics of Optically Active Defects. Russ. Geol. Geophys. 2015, 56, 330–343. [Google Scholar] [CrossRef]
- Zedgenizov, D.A.; Harte, B.; Edinburgh Ion Microprobe Facility (EIMF); Shatsky, V.S.; Politov, A.A.; Rylov, G.M.; Sobolev, N.V. Directional Chemical Variations in Diamonds Showing Octahedral Following Cuboid Growth. Contrib. Mineral. Petrol. 2006, 151, 45–57. [Google Scholar] [CrossRef]
- Bulanova, G.P.; Pearson, D.G.; Hauri, E.H.; Griffin, B.J. Carbon and Nitrogen Isotope Systematics within a Sector-Growth Diamond from the Mir Kimberlite, Yakutia. Chem. Geol. 2002, 188, 105–123. [Google Scholar] [CrossRef]
- Lang, A.R.; Bulanova, G.P.; Fisher, D.; Furkert, S.; Sarua, A. Defects in a Mixed-Habit Yakutian Diamond: Studies by Optical and Cathodoluminescence Microscopy, Infrared Absorption, Raman Scattering and Photoluminescence Spectroscopy. J. Cryst. Growth 2007, 309, 170–180. [Google Scholar] [CrossRef]
- Rakhmanova, M.I.; Nadolinny, V.A.; Yuryeva, O.P. Impurity Centers in Synthetic and Natural Diamonds with a System of Electron-Vibronic Lines at 418 Nm in Luminescence Spectra. Phys. Solid State 2013, 55, 127–130. [Google Scholar] [CrossRef]
- Nadolinny, V.A.; Baker, J.M.; Newton, M.E.; Kanda, H. EPR Studies of a Nickel–Boron Centre in Synthetic Diamond. Diam. Relat. Mater. 2002, 11, 627–630. [Google Scholar] [CrossRef]
- Nechaev, D.V.; Khokhryakov, A.F. Formation of Epigenetic Graphite Inclusions in Diamond Crystals: Experimental Data. Russ. Geol. Geophys. 2013, 54, 399–405. [Google Scholar] [CrossRef]
- Palyanov, Y.N.; Kupriyanov, I.N.; Khokhryakov, A.F.; Ralchenko, V.G. Crystal Growth of Diamond. In Handbook of Crystal Growth; Elsevier: Amsterdam, The Netherlands, 2015; pp. 671–713. ISBN 978-0-444-63303-3. [Google Scholar]
- Goss, J.P.; Briddon, P.R.; Hill, V.; Jones, R.; Rayson, M.J. Identification of the Structure of the 3107 cm−1 H-Related Defect in Diamond. J. Phys. Condens. Matter 2014, 26, 145801. [Google Scholar] [CrossRef]
- Gu, T.; Ritterbex, S.; Tsuchiya, T.; Wang, W. Novel Configurations of VN4 and VN4H Defects in Diamond Platelets: Structure, Energetics and Vibrational Properties. Diam. Relat. Mater. 2020, 108, 107957. [Google Scholar] [CrossRef]
- Iakoubovskii, K.; Adriaenssens, G.J. Optical Characterization of Natural Argyle Diamonds. Diam. Relat. Mater. 2002, 11, 125–131. [Google Scholar] [CrossRef]
- McNamara, K.M.; Williams, B.E.; Gleason, K.K.; Scruggs, B.E. Identification of Defects and Impurities in Chemical-vapor-deposited Diamond through Infrared Spectroscopy. J. Appl. Phys. 1994, 76, 2466–2472. [Google Scholar] [CrossRef]
- Fang, C.; Jia, X.; Sun, S.; Yan, B.; Li, Y.; Chen, N.; Li, Y.; Ma, H. Studying the Effect of Hydrogen on Diamond Growth by Adding C 10 H 10 Fe under High Pressures and High Temperatures. High Press. Res. 2016, 36, 42–54. [Google Scholar] [CrossRef]
- Woods, G.S. Platelets and the Infrared Absorption of Type Ia Diamonds. Proc. R. Soc. Lond. A 1986, 407, 219–238. [Google Scholar] [CrossRef]
- Goss, J.P.; Coomer, B.J.; Jones, R.; Fall, C.J.; Briddon, P.R.; Öberg, S. Extended Defects in Diamond: The Interstitial Platelet. Phys. Rev. B 2003, 67, 165208. [Google Scholar] [CrossRef]
- Speich, L.; Kohn, S.C.; Bulanova, G.P.; Smith, C.B. The Behaviour of Platelets in Natural Diamonds and the Development of a New Mantle Thermometer. Contrib. Mineral. Petrol. 2018, 173, 39. [Google Scholar] [CrossRef]
- Komarovskikh, A.; Rakhmanova, M.; Yuryeva, O.; Nadolinny, V. Infrared, Photoluminescence, and Electron Paramagnetic Resonance Characteristic Features of Diamonds from the Aikhal Pipe (Yakutia). Diam. Relat. Mater. 2020, 109, 108045. [Google Scholar] [CrossRef]
- Taylor, W.R.; Canil, D.; Judith Milledge, H. Kinetics of Ib to IaA Nitrogen Aggregation in Diamond. Geochim. Cosmochim. Acta 1996, 60, 4725–4733. [Google Scholar] [CrossRef]
- Nadolinny, V.A.; Yurjeva, O.P.; Pokhilenko, N.P. EPR and Luminescence Data on the Nitrogen Aggregation in Diamonds from Snap Lake Dyke System. Lithos 2009, 112, 865–869. [Google Scholar] [CrossRef]
- Kanda, H.; Watanabe, K. Distribution of Nickel Related Luminescence Centers in HPHT Diamond. Diam. Relat. Mater. 1999, 8, 1463–1469. [Google Scholar] [CrossRef]
- Pereira, E.; Santos, L. The 2.96 eV centre in diamond. In Wide-Band-Gap Semiconductors; Elsevier: Amsterdam, The Netherlands, 1993; pp. 222–227. ISBN 978-0-444-81573-6. [Google Scholar]
- Collins, A.T.; Woods, G.S. Cathodoluminescence from ‘Giant’ Platelets, and of the 2·526 EV Vibronic System, in Type Ia Diamonds. Philos. Mag. B 1982, 45, 385–397. [Google Scholar] [CrossRef]
- Nazaré, M.H.; Woods, G.S.; Assunção, M.C. The 2.526 EV Luminescence Band in Diamond. Mater. Sci. Eng. B 1992, 11, 341–345. [Google Scholar] [CrossRef]
- Graham, R.J.; Buseck, P.R. Cathodoluminescence of Brown Diamonds as Observed by Transmission Electron Microscopy. Philos. Mag. B 1994, 70, 1177–1185. [Google Scholar] [CrossRef]
- Gu, T.; Wang, W. Optical Defects in Milky Type IaB Diamonds. Diam. Relat. Mater. 2018, 89, 322–329. [Google Scholar] [CrossRef]
- Yuryeva, O.P.; Rakhmanova, M.I.; Zedgenizov, D.A.; Kalinina, V.V. Spectroscopic Evidence of the Origin of Brown and Pink Diamonds Family from Internatsionalnaya Kimberlite Pipe (Siberian Craton). Phys. Chem. Miner. 2020, 47, 20. [Google Scholar] [CrossRef]
- Smith, C.P.; Bosshart, G.; Ponahlo, J.; Hammer, V.M.F.; Klapper, H.; Schmetzer, K. GE POL Diamonds: Before and After. Gems Gemol. 2000, 36, 192–215. [Google Scholar] [CrossRef]
- Significant Spectroscopic Methods for the Identification of Defects in Diamond. In International Kimberlite Conference Extended Abstracts; University of Alberta: Edmonton, AB, Canada, 2008.
- Gaillou, E.; Post, J.E.; Bassim, N.D.; Zaitsev, A.M.; Rose, T.; Fries, M.D.; Stroud, R.M.; Steele, A.; Butler, J.E. Spectroscopic and Microscopic Characterizations of Color Lamellae in Natural Pink Diamonds. Diam. Relat. Mater. 2010, 19, 1207–1220. [Google Scholar] [CrossRef]
- Hainschwang, T.; Notari, F.; Fritsch, E.; Massi, L. Natural, Untreated Diamonds Showing the A, B and C Infrared Absorptions (“ABC Diamonds”), and the H2 Absorption. Diam. Relat. Mater. 2006, 15, 1555–1564. [Google Scholar] [CrossRef]
- Davies, G.; Lawson, S.C.; Collins, A.T.; Mainwood, A.; Sharp, S.J. Vacancy-Related Centers in Diamond. Phys. Rev. B 1992, 46, 13157–13170. [Google Scholar] [CrossRef]
- Collins, A.T.; Ly, C.-H. Misidentification of Nitrogen Vacancy Absorption in Diamond. J. Phys. Condens. Matter 2002, 14, L467–L471. [Google Scholar] [CrossRef]
- Tretiakova, L. Spectroscopic Methods for the Identification of Natural Yellow Gem-Quality Diamonds. EJM 2009, 21, 43–50. [Google Scholar] [CrossRef]
- Epelboym, M.; DelRe, N.; Widemann, A.; Zaitsev, A.; Dobrinets, I. Characterization of some natural and treated colorless and colored diamonds. Gems Gemol. 2011, 47, 133. [Google Scholar]
- Nadolinny, V.A.; Shatsky, V.S.; Yuryeva, O.P.; Rakhmanova, M.I.; Komarovskikh, A.Y.; Kalinin, A.A.; Palyanov, Y.N. Formation Features of N3V Centers in Diamonds from the Kholomolokh Placer in the Northeast Siberian Craton. Phys. Chem. Miner. 2020, 47, 4. [Google Scholar] [CrossRef]
- Zedgenizov, D.A.; Kagi, H.; Shatsky, V.S.; Ragozin, A.L. Local Variations of Carbon Isotope Composition in Diamonds from São-Luis (Brazil): Evidence for Heterogenous Carbon Reservoir in Sublithospheric Mantle. Chem. Geol. 2014, 363, 114–124. [Google Scholar] [CrossRef]
- Hainschwang, T.; Katrusha, A.; Vollstaedt, H. HPHT Treatment of Different Classes of Type I Brown Diamonds. J. Gemmol. 2005, 29, 261–273. [Google Scholar] [CrossRef]
- Hainschwang, T.; Notari, F.; Pamies, G. A Defect Study and Classification of Brown Diamonds with Deformation-Related Color. Minerals 2020, 10, 903. [Google Scholar] [CrossRef]
- Collins, A.T.; Connor, A.; Ly, C.-H.; Shareef, A.; Spear, P.M. High-Temperature Annealing of Optical Centers in Type-I Diamond. J. Appl. Phys. 2005, 97, 083517. [Google Scholar] [CrossRef]
- Kupriyanov, I.N.; Pal’yanov, Y.N.; Shatsky, V.S.; Kalinin, A.A.; Nadolinnyi, V.A.; Yur’eva, O.P. Study of the Transformation of Hydrogen-Containing Centers in Diamond at High PT Parameters. Dokl. Earth Sci. 2006, 406, 69–73. [Google Scholar] [CrossRef]


Publisher’s Note: MDPI stays neutral with regard to jurisdictional claims in published maps and institutional affiliations. |
© 2021 by the authors. Licensee MDPI, Basel, Switzerland. This article is an open access article distributed under the terms and conditions of the Creative Commons Attribution (CC BY) license (https://creativecommons.org/licenses/by/4.0/).