Article

Analysis of In Situ Optical Signals during Laser Metal Deposition of Aluminum Alloys

State Key Laboratory of Advanced Welding and Joining, Harbin Institute of Technology, No. 92 West Dazhi Street, Harbin 150001, China
*
Author to whom correspondence should be addressed.
Crystals 2021, 11(6), 589; https://doi.org/10.3390/cryst11060589
Submission received: 29 March 2021 / Revised: 13 May 2021 / Accepted: 18 May 2021 / Published: 24 May 2021

Abstract

:
During laser metal deposition (LMD) of thin-walled aluminum alloy structures, the deposition height and width is hard to keep stable because of the special properties of aluminum alloys, such as high reflectivity to laser beams, low viscosity, and high thermal conductivity. Monitoring the LMD process allows for a better comprehension and control of this process. To investigate the characteristics of the aluminum alloy LMD process, three real-time coaxial optical sensors sensitive to visible light, infrared light, and back-reflected lasers ere used to monitor the aluminum alloy LMD process. Thin-walled parts were deposited with different laser power, and the characteristics of the three in situ signals are analyzed. The results show that there exists high linear correlation between reflected laser and accumulated deposition height. A laser reflection model was built to explain the correlation. Besides, the infrared light is linearly correlated with deposition width. Overall, the results of this study show that the optical signals are able to reflect the deposition height and width simultaneously. Infrared light signals and reflected laser signals have the potential to serve as the input of online feedback geometry control systems and real-time defect alarm systems of the LMD process.

1. Introduction

Laser metal deposition (LMD) is one of the metal additive manufacturing methods. The technology was originally developed at Sandia National Laboratories in collaboration with Pratt and Whitney [1]. During the LMD process, metallic powders carried by inert gas are injected from a delivery nozzle into the molten pool melted by coaxial laser beam. Deposition layers are formed after the solidification of the molten pool. The LMD process is highly sensitive to many processing parameters, including but not limited to laser power, laser scan speed and powder flow rate [2,3,4]. Aluminum alloys are of great interest in additive manufacturing due to their high specific strength and low density [5]. However, the high reflectivity to laser beams (91%), high thermal conductivity (146 W·m−1K−1), and low melting point (600 °C) make the Al alloy LMD process challenging to keep stable [6,7].
For the sake of forming a quality guarantee, monitoring the LMD process is a necessary procedure. The deposition width and deposition layer height are most important when monitoring the process. In order to monitor the deposition layer height, noncontact measuring systems are preferred due to the high temperature of the samples. Therefore, optical monitoring equipment is preferred.
To monitor the deposition width, IR pyrometers and IR cameras [8,9,10,11] are used most widely. Bi et al. [8] mounted a coaxial IR sensor on the laser head to monitor the LMD process and found IR signals can be disturbed by surface oxidation. With IR cameras, the temperature of molten pools and the molten pool geometry can be measured [12,13,14]. Ocylok S. et al. [14] investigated the correlation between the molten pool geometry and the process parameters during the LMD process. Ding XP et al. [9] obtained the cladding layer width and detected defects such as lack of fusion with coaxial infrared thermography in laser metal-wire additive manufacturing.
To monitor the deposition layer height, CCD, and CMOS cameras, laser spot and laser line and structured light 3D imaging devices are utilized. When using CCD and CMOS cameras, the cameras are mounted off-axis [15,16,17,18] so that the deposition height can be measured. Biegler et al. [17] conducted in situ monitoring of distortion directly on the built part with two cameras. However, off-axis installation of cameras makes the monitoring system lose direction independence. As a result, this system is only suitable for simple geometries like thin-wall parts [18]. Ravani-Tabrizipour et al. [15] installed three CCD cameras at different angles around the laser head to minimize direction-independence. Some researchers have used laser spot or laser line scanners to monitor the stand-off distance (SOD) between the nozzle tip and the top surface of the deposited part [19,20,21,22]. This monitoring system includes a tilted probe laser and image sensors. SOD is calculated based on the triangulation principle. The devices provide very accurate measurements with a resolution of several micrometers [23]. However, like cameras, the probe laser is mounted off-axis, which will give rise to blind zones or shadowing effects. Moreover, to avoid the influence of harsh operation conditions, the scanning has to be performed when one or more layers are finished and the laser has stopped. In order to eliminate the direction dependency, Garmendia et al. [24] installed a structured light scanner in a fixed position above the deposition area. Though the scanning was performed after the deposition of a group of layers, pyramidal parts were built with the deposition height monitored and controlled. To monitor the deposition height during the process, Donadello et al. [23,25] integrated a probe laser in the process laser coaxially. The SOD was monitored successfully during the process of depositing a stainless-steel cylinder.
Overall, to improve the efficiency of monitoring in the LMD process, in situ monitoring devices are preferred and the deposition layer height and deposition width are better to be monitored simultaneously. Moreover, the monitoring system should be coaxial with the laser head to eliminate direction dependence.
In this paper, a direction-independent in situ monitoring system was used to monitor the LMD process of aluminum alloys. This system contained a visible light sensor, infrared light sensor, and back-reflected laser sensor. The characteristics of the signals collected with different laser powers were analyzed. The possibility of monitoring the deposition width and deposition height at the same time is discussed. The features of reflected lasers between deposited parts with and without geometrical defects were investigated.

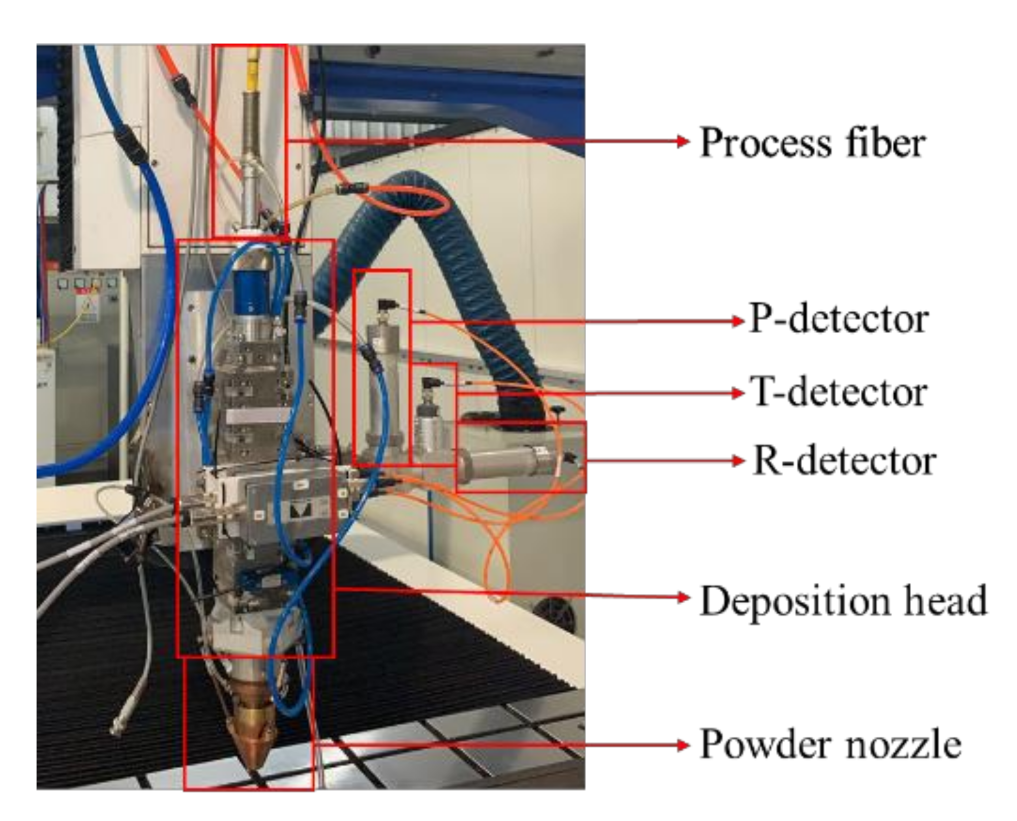
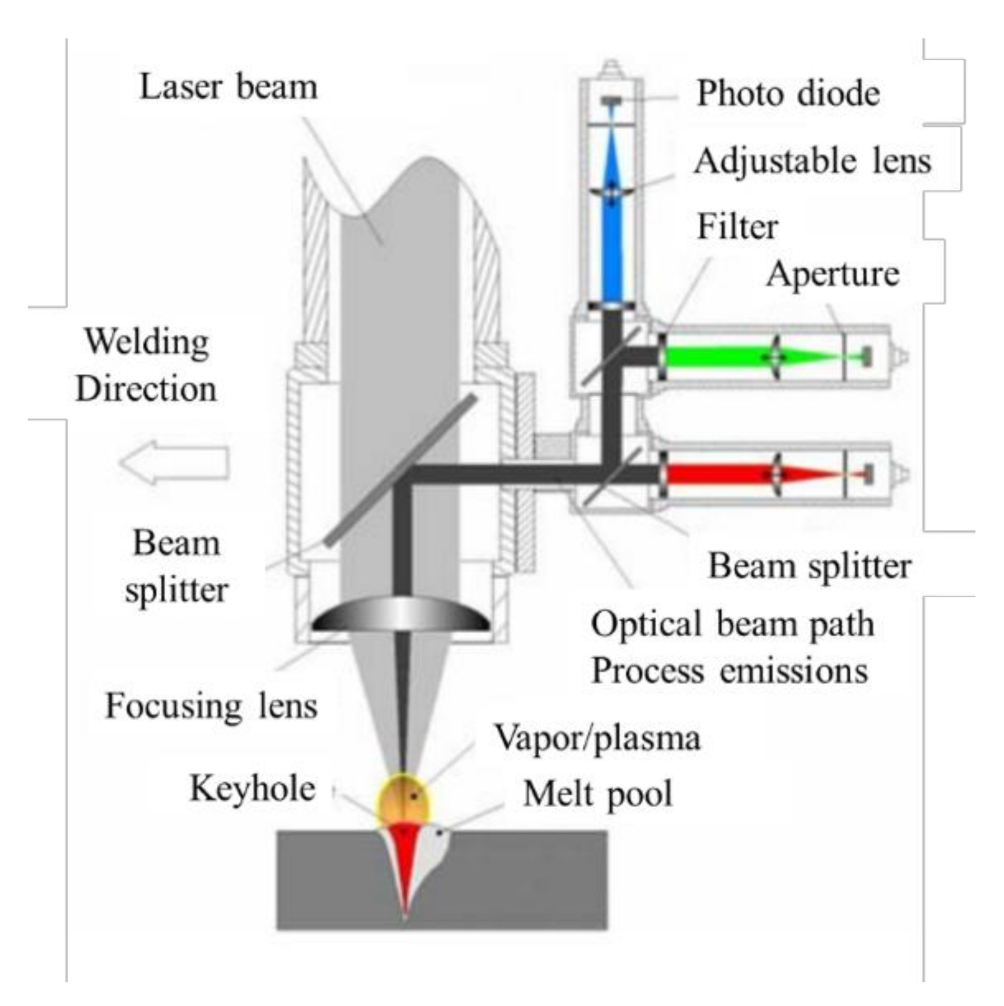
2. Experimental Procedure

The LMD process was implemented with one laser metal deposition system, which consisted of one IPG fiber laser (IPG Laser GmbH, Burbach, Germany) (maximum power was 4 kW with 1070 nm wavelength), one 3-axis CNC to carry the optic head, one GTV powder feeder, one Precitec YW52 laser welding head (Precitec GmbH & Co. KG, Gaggenau, Germany), and one coaxial powder nozzle.
During the LMD process, argon gas was used as the shielding gas and the powder delivery gas. The material of deposition powder was AlSi10Mg. The chemical composition of AlSi10Mg powder is illustrated in Table 1. The diameter of the powder ranged between 45 and 105 μm. A 200 mm × 200 mm × 10 mm AlSi10Mg alloy plate was used as the substrate.
The monitoring process for aluminum alloys laser metal deposition was carried out with the Laser Welding Monitoring (LWM) system from Precitec Company (Precitec GmbH & Co. KG, Gaggenau, Germany) (Figure 1 and Figure 2). The system is based on three photodetectors called P-detector, T-detector, and R-detector, which are sensitive in different ranges of wavelengths. The photodetectors are made by Precitec Company and integrated in LWM system. P-detector is sensitive to the 400–600 nm spectral interval and is used to measure the intensity of plasma. T-detector is sensitive to the 1100–1800 nm infrared spectrum, and it is suitable to monitor the temperature of molten pool surface. R-detector is sensitive to the 1060–1070 nm spectral range in order to detect the back-reflected laser radiation. The three photodetectors were connected with an amplifying module to amplify each of the optical signals. The range of the signals collected by the three sensors was set to 0–10 V according to the light intensity. Considering the high laser reflectivity of aluminum alloys, the magnification of R-detector was 100 times less than the other detectors. All the signals were collected with the sampling rate of 1 kHz. Then, the collected data were processed with low-pass filtering to denoise.

3. Results and Discussion

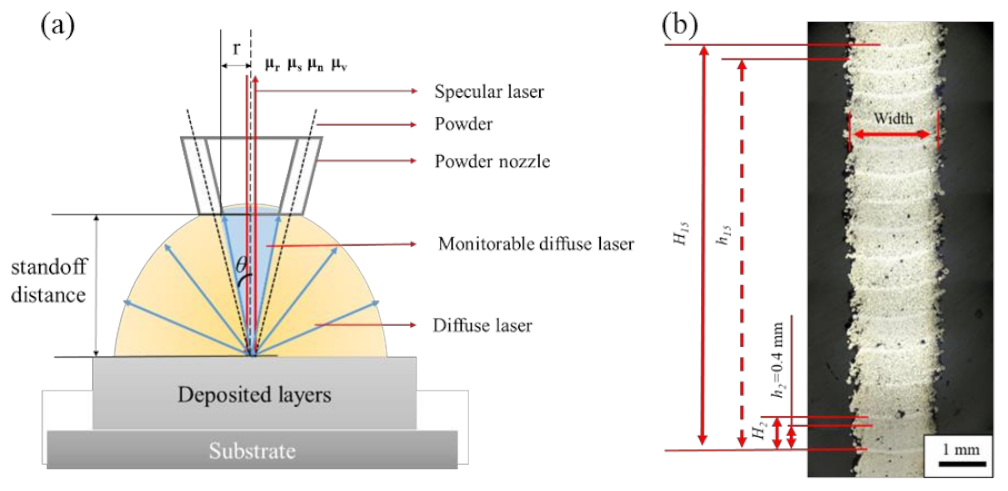
3.1. Characteristics of Aluminum LMD

By optimizing process parameters, thin-walled parts can be deposited steadily with laser power, 900 W; laser spot diameter, 1.0 mm; scanning speed, 1000 mm/min; powder feeding rate, 3.5 g/min; shielding gas, 15 L/min; initial stand-off distance, 16 mm; and preset z-axis increment of each layer (ΔZ), 0.4 mm. One of the deposited samples is shown in Figure 3a. To obtain thin-walled parts with variable width, one of the most efficient ways is to change the laser power. For example, with laser power 500 W or 1200 W, the width of deposited parts becomes smaller or larger, respectively. However, with a change of laser power, geometrical defects appear sometimes during the LMD process, illustrated in Figure 3b. Such geometrical defects always begin to happen before 30 deposition layers.
The stability of the geometry of thin-walled samples is related to the thermal stability of the molten pool. Therefore, the temperature of the molten pool and the geometry of the thin-walled samples, especially the deposition height and deposition width, are key markers to reflect the stability of LMD process.

3.2. Original Signal Processing

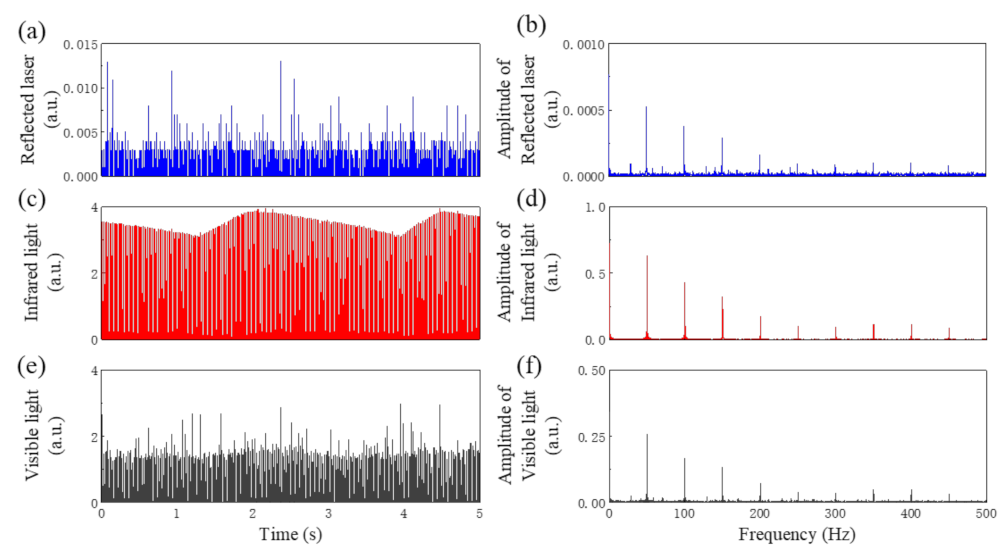
3.2.1. Sampling Range

For the purpose of analyzing the characteristics of optical signals and detecting the defects during the LMD process, 40-layer thin-walled samples with the length of 60 mm were deposited with 900 W, 500 W, and 1200 W laser power. Figure 4 shows the front view and analyzed region of 40-layer thin-walled sample deposited with 900 W laser power. In this study, only signals in the middle part of deposition tracks were taken into consideration to analyze the characteristics of LMD process, because the emission and stop of laser drives the signals and layer thickness to instability [27], the signals in laser start and stop regions are complicated and the characteristics are different. In addition, the first deposited layer contacts with the substrate directly. The characteristics of the first layer cannot reflect the reality of LMD process. For this reason, the signals from the first layer were discarded.

3.2.2. Data Denoising

In order to investigate the influence of noise in the environment, the original signals were collected when the laser was not emitted. Figure 5 illustrates the original signals of noise in the time domain. The value of maximum noise in visible and infrared light in the time domain was too high to ignore. It needed to be eliminated. On the contrary, the maximum noise in reflected laser was only 0.014, which was more than 200 times lower than the other two signals. The noise was also transformed into frequency domain with Fourier transform and is shown in Figure 5. It is obvious that the noise of all the three signals mostly focused on 50 × n Hz (where n = 1, 2, … 10). To remove the noise, Butterworth low-pass filter was used to denoise. The threshold of low-pass filter was set as 30 Hz.
One single layer was deposited and the optical signals were monitored to detect the efficiency of denoising. The raw signals and filtered signals are shown in Figure 6. Though the noise in visible and infrared light was loud, low-pass filter showed a good effect of noise reduction. Besides, the features in raw signals were maintained in filtered signals.
Frequency domain characteristics of original signals of one single deposited layer when the laser power was 900 W, laser scanning speed was 1000 mm/min, and shielding gas was 15 L/min were measured. All of the three signals were mainly in the low frequency band below 30 Hz.

3.2.3. Processing Method of Signals

Filtered online signals from three different layers of the thin-walled sample are demonstrated in Figure 7. Among the signals, spike signals appeared in the visible light and infrared light signals. The visible light spike signals coincided with infrared light spike signals.
This phenominom can be explained by the generation of plasma. As is shown in Figure 8, when laser power is 900 W, some powders illuminated by laser beam exploded randomly and induced lots of plasma instantaneously. The light of plasma in the visible light band was collected by the P-detector and the light in the infrared band was received by the T-detector.
When analyzing the mean intensity of the signals, the data processing method of the three signals should be different, considering the influence of plasma. The signals of infrared light collected by T-detector are supposed to reflect the temperature of the molten pool. However, the spike signals in infrared light signals are caused by the plasma and cannot describe the temperature of the molten pool accurately. Consequently, the spike signals in infrared light should be treated as pseudo signals and be discarded. By contrast, the P-detector is supposed to measure the intensity of the visible light of plasma. The spike signals in visible light signals should be retained. The R-detector is used to measure the back-reflected laser from the molten pool surface, the plasma has little impact on reflected laser signals. Therefore, no spike signals should be removed.

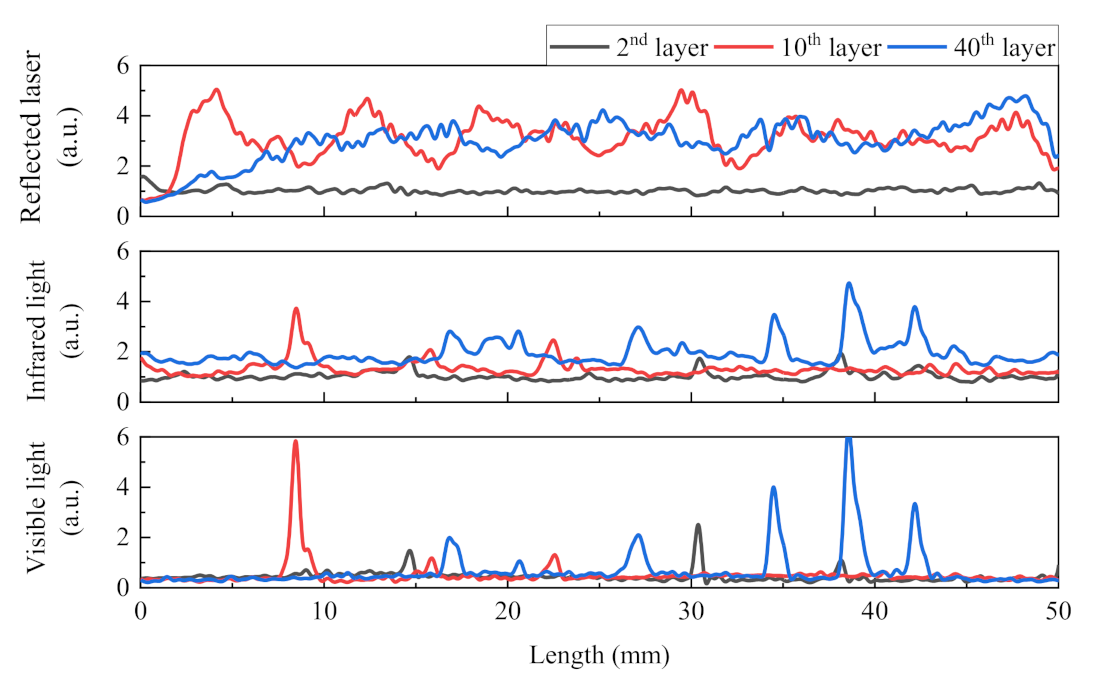
3.3. Variation of the Signals during the LMD Process

Mean intensity with layers is used to describe the variation of the online signals received by the three optical sensors during the LMD process. As is seen in Figure 9, the reflected laser signals from the R-detector exhibited significant change. A trend of progressive increase existed through the first ten layers. This phenomenon is associated with the instability of standoff distance and will be elaborated later.
The visible light signals from P-detector almost stayed constant with the increase of the layer, which means that the amount of induced plasma in each layer stayed stable.
The infrared light signals from the T-detector were in a continual process of climbing, but the climbing speed declined slowly. The molten pool temperature increased with layers because of the heat accumulation in the LMD process.

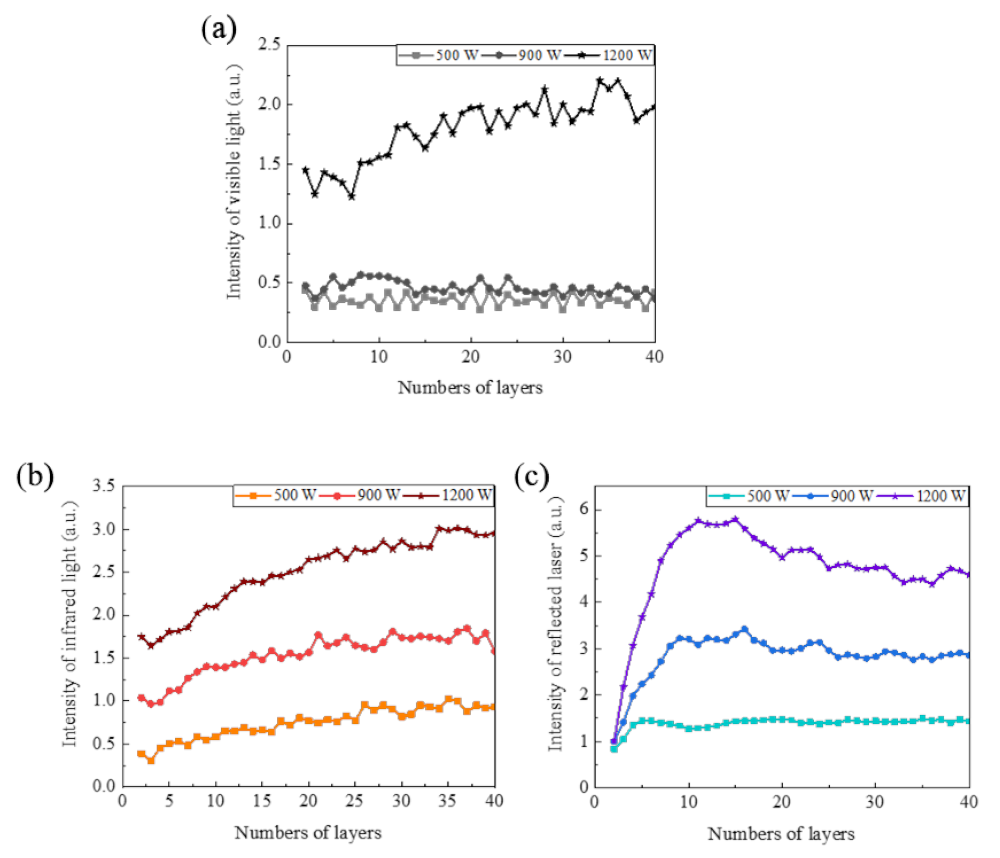
3.4. Effects of Laser Power on Process Stability

To analyze the relation between laser power and the characteristics of optical signals in the LMD process, aluminum alloy samples were deposited with 500 W laser power and 1200 W as well. Figure 10 shows the characteristics of monitoring signals during LMD process.
As is seen in Figure 10, the mean intensity of visible light almost stayed constant below 0.5 with layers when the laser power was 500 and 900 W. However, when laser power rose to 1200 W, the mean intensity was more than 1.0 and increased with layers and showed irregular fluctuation. As a result, we can conclude that visible light is not suitable to monitor the LMD process in real time.
With regard to infrared light. The increasing trend remained unchanged with the change of laser power. Therefore, infrared light signals are fit for monitoring the temperature of a molten pool.
As for the reflected laser, the intensity was stronger as the laser power increased. Progressively increasing stages existed in all of the three signals. The trend of reflected laser coincided with the standoff distance. The reason is explained in following chapter.

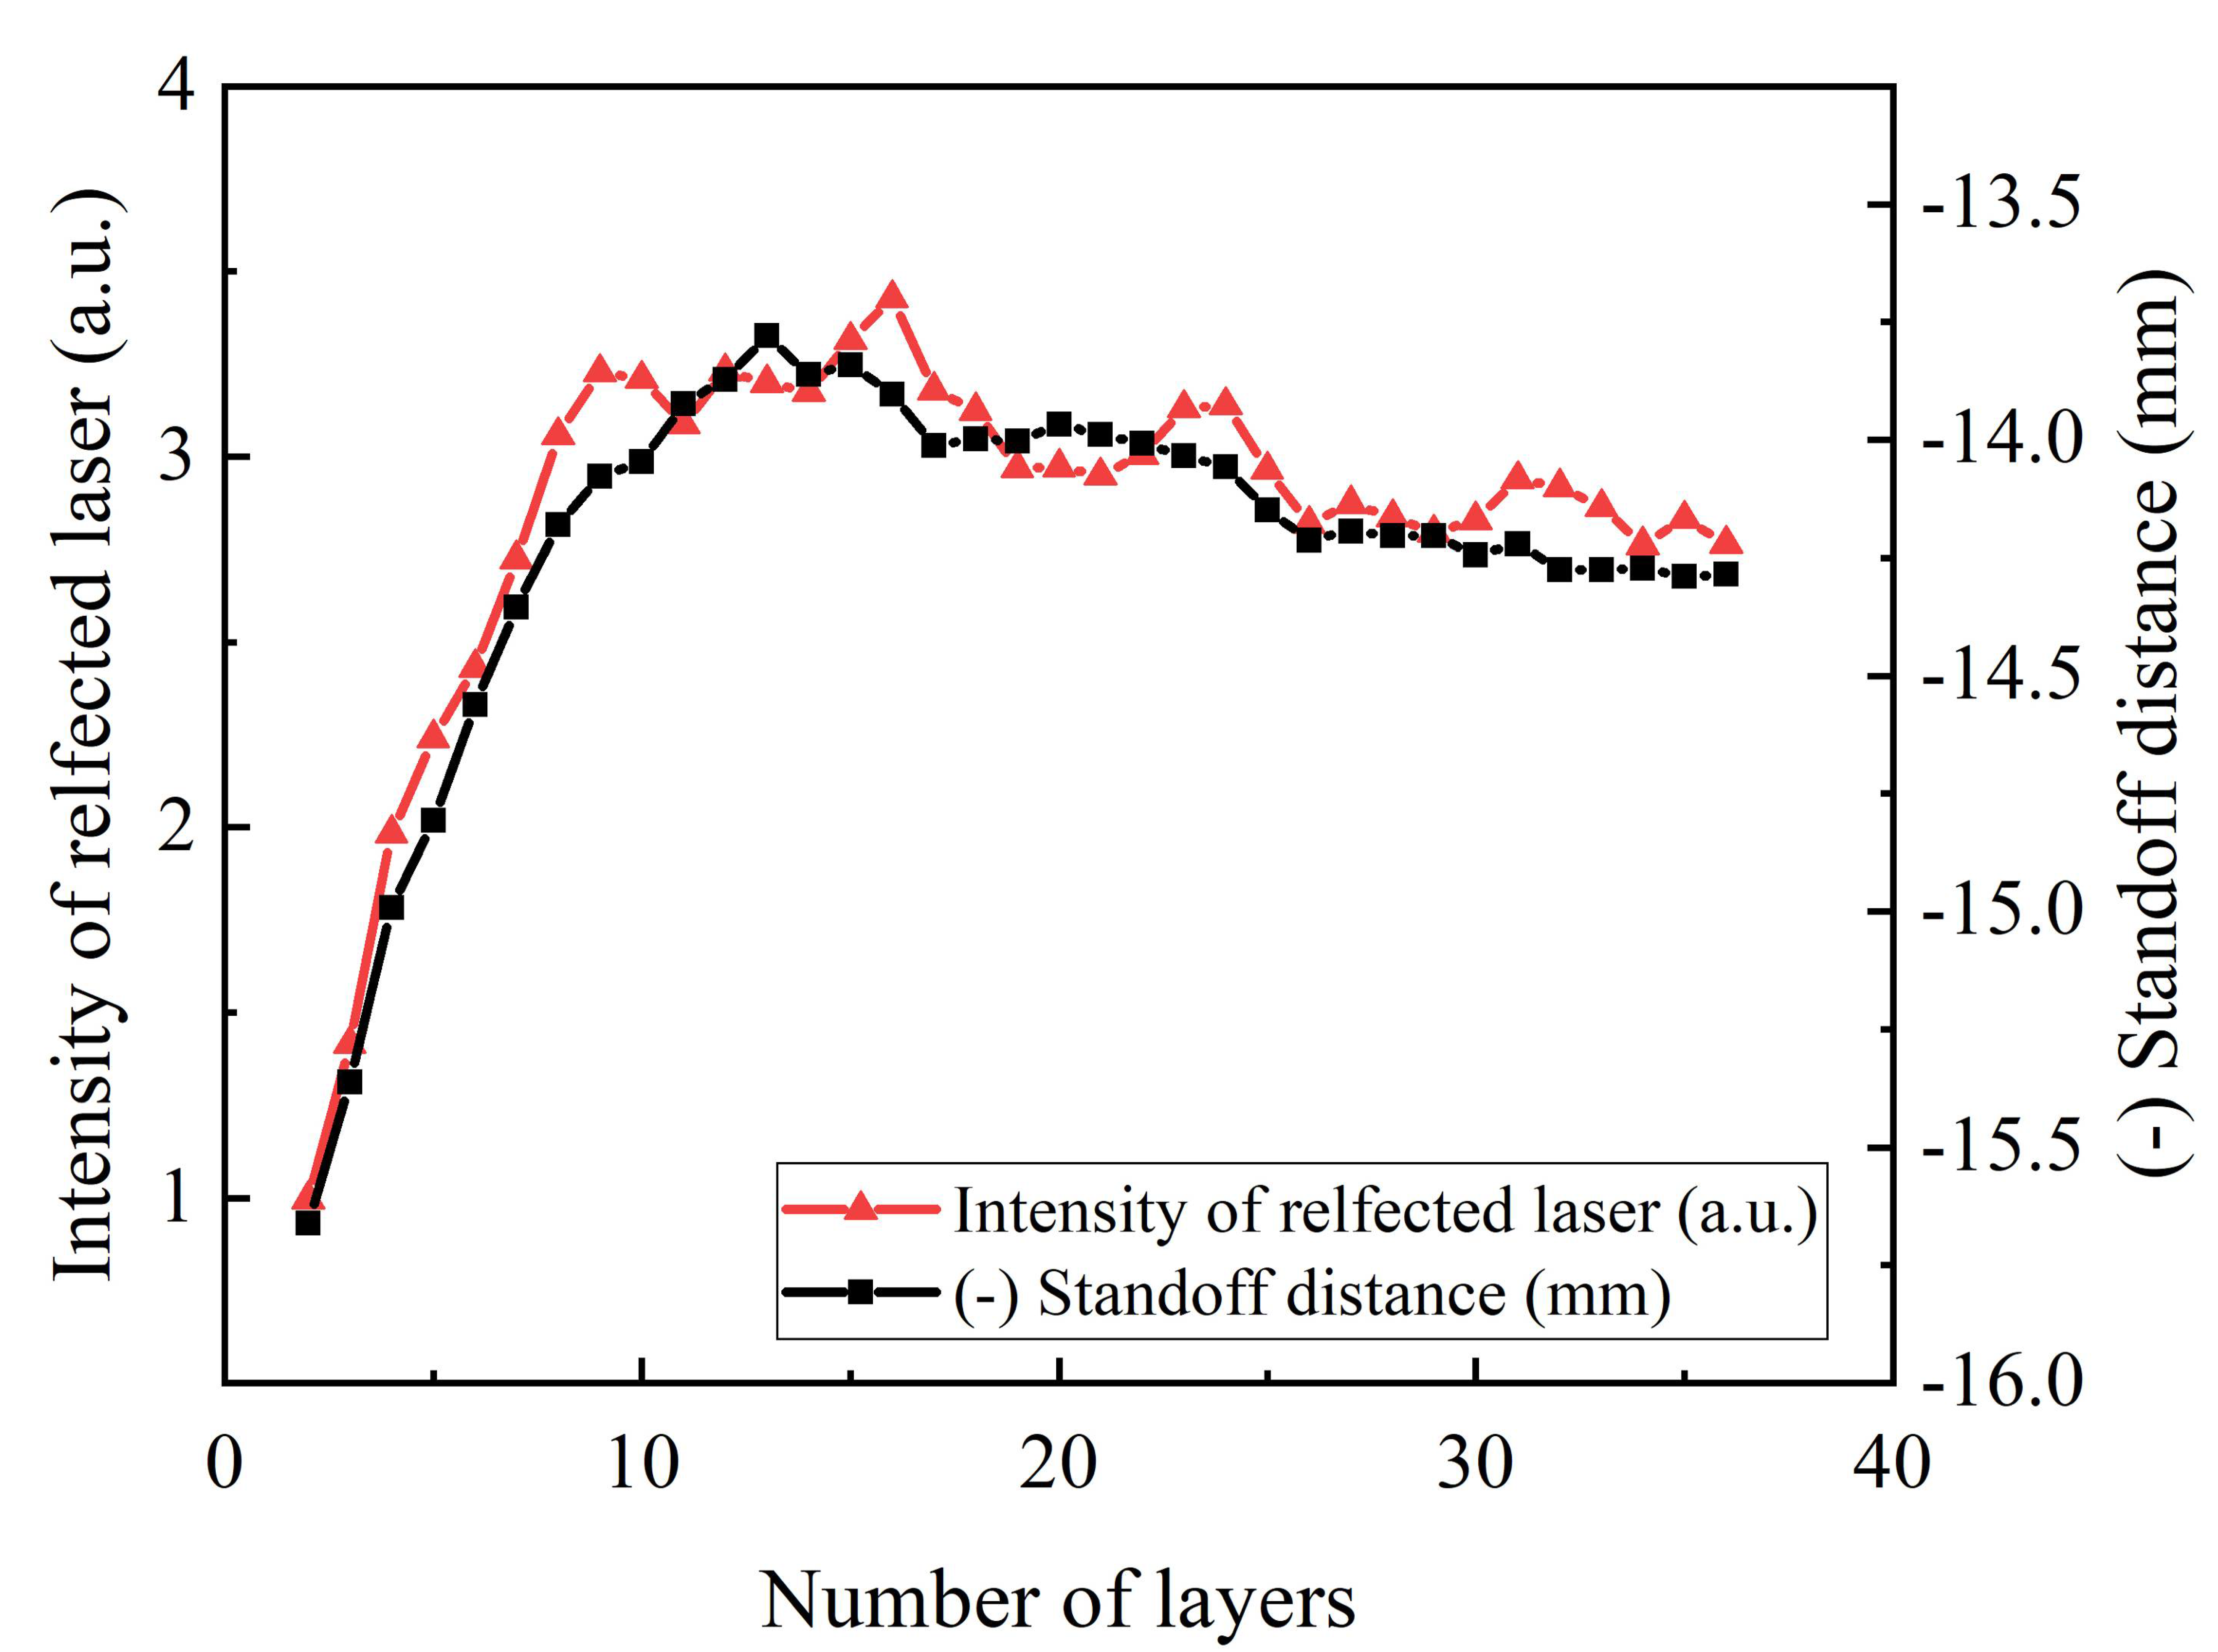
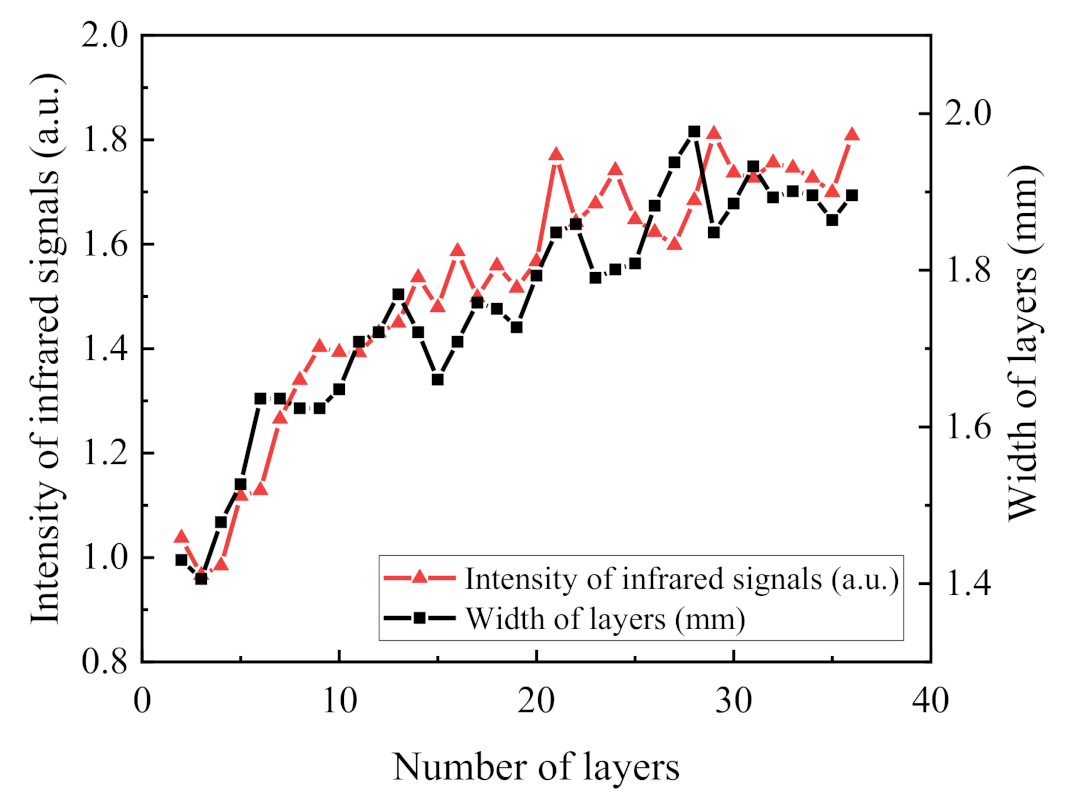
3.5. Online Monitoring of Deposition Height and Width

Boisselier et al. [28] found some of the same patterns in reflected laser signals and the track geometry. The signals have the potential to monitor the deposition height. However, quantitative research has not been conducted. In order to investigate the relationship between the reflected laser and the accumulated deposition height of the sample, the moment of linear intercorrelation coefficient (Bravais–Pearson product, calculated by Equation (1)) [29] between the deposition height and the intensity of reflected laser is used.
ρ X , Y = cov X , Y σ X σ Y = E X μ X Y μ Y E X 2 E 2 X E Y 2 E 2 Y
where σ X ,   σ Y are, respectively, the standard deviations of variables X and Y, and μ X , μ Y are, respectively, the mean values of variables X and Y.
To make the result more obvious, the opposite number of standoff distance (-s) is calculated instead of the deposition height. Standoff distance is the distance from nozzle tip to deposited sample surface, illustrated in Figure 11a. When the layer height of a new deposited layer is higher or lower than the preset layer height, the standoff distance will change with the accumulated deposited height. So, standoff distance is directly associated to accumulated layer height. The relationship between opposite number of standoff distance and accumulated layer height is expressed as Equation (2). H n is defined as the accumulated height of the deposited structure after n layers, which is extracted from the metallographic images illustrated in Figure 11b. h n presents the preset height after n layers. h is the preset height of each layer (z-axis increment). The correlation coefficient is measured from the second layer. So, h n = h × n 1 . s0 is the initial standoff distance. Under the experimental condition, the initial standoff distance (s0) was 16 mm and the preset height of each layer was 0.4 mm.
s = H n h n s 0
Figure 12 illustrates the relation between standoff distance and mean intensity of the reflected laser deposited with 900 W laser power. The standoff distance increased very fast in the first several layers, because the real layer thickness was higher than the preset z-axis increment (0.4 mm). Then, due to the self-regulation effect [30], the layer thickness was in a rising process from the state of reality to that which it ought to be. Finally, the standoff distance attained stabilization. The correlation coefficient between the mean intensity of the reflected laser and the opposite number of standoff distance was 0.955, which shows high correlation. As a result, and the intensity of the reflected laser was able to evaluate the deposition height and monitor the stability of the process on the scale of layers.
Furthermore, to investigate whether the reflected laser is able to be used to monitor the deposited height in real time. The height profile of the top surface was extracted by image processing techniques (Figure 13). The mean intensity of the reflected laser per 100 ms from the top layer (40th layer) and the mean height of the corresponding position on the surface of the deposited sample are given in Figure 13.
The correlation coefficient between the reflected laser and the height profile was 0.851. Compared with the value calculated on the scale of layers, the coefficient dropped 0.1. However, it was still high enough to monitor the real height of deposition structure. The drop of the coefficient might be caused by the random errors of the signals and the measurement errors of the height profile.
On the other hand, to find out whether the deposition width was linear with the intensity of infrared light in LMD process, the deposition width of each layer was measured by OM images (Figure 11b) and the results are shown with mean intensities of infrared signals in Figure 14.
The correlation coefficient between the intensity of infrared light and the deposition width reached 0.854. In the laser welding process, Xiao et al. [31] found a clear linear relationship between welding width and infrared temperature. The coefficient reached 0.94 to 0.99. The nature was quite excepted. Consequently, the deposition width can be monitored by infrared light during LMD process.
Combining the linear relationship between reflected laser signals and accumulated deposition height, infrared light signals, and deposition width together, the infrared light signals and reflected laser signals are suitable to serve as input of feedback to the geometry control system of the LMD process. The preset height of each layer (z-axis increment) can be adjusted online after each layer based on the mean intensity of reflected laser. The deposition width is also adjustable online by changing process parameters based on the mean intensity of infrared light. Additionally, reflected laser signals also have the potential to play an important role in real-time defect alarm systems, because the reflected laser is able to monitor the deposition height on the scale of 100 ms. The potential application of infrared light and reflected laser is summarized in Table 2.
In order to explain the correlation coefficient between the reflected laser and standoff distance, the Phong reflection model [32,33] was chosen to provide a simplified description of how reflected light interacts with a surface. The reflected light that can be detected I r is composed of diffuse light I d , specular light I s , and ambient light I a . The Phong equation for the I r is
I d = I p K d μ s · μ n
I s = I p K s μ r · μ v n
I r = I p K d μ s · μ n + I p K s μ r · μ v n + I a K a
where μ s , μ n , μ r , and μ v are the light source, surface normal, reflected, and viewing vectors, respectively, depicted in Figure 15. I p is the intensity of the light source. I a is the intensity of ambient light. K d is a diffuse reflection constant, K s is a specular reflection constant, K a is an ambient reflection constant, n is shininess constant of the surface, and n is larger than 1. K d , K s , K a , and n are related to materials.
Figure 11a represents a 2D schematic diagram of a reflected laser during the LMD process. Under the experimental condition, the values of μ s · μ n and μ r · μ v equaled 1. There existed no ambient light, I a was 0. Considering that the viewpoint is not at infinity, the reflected light should be expressed as the light entering the powder nozzle. Assuming that all of the reflected laser entering the powder nozzle can be detected by the sensor, the Equation (5) becomes
I r = 2 θ I p K d + 2 0 θ I p K s cos n θ d θ
In this experiment, θ ranged from 0.124 to 0.165 rad during the LMD process. Given the high reflectivity of aluminum alloys, the shininess constant of the surface n is enormous. The specular laser attenuates rapidly with θ , so that the increment of specular laser with the increasing of θ is far less than the increment of diffuse laser when θ is larger than 0.124. The specular laser that does not enter the powder nozzle can be ignored. Specular light I s is approximately equal to a constant and relative to shininess constant of the surface n. The Equation (6) becomes
I r = 2 θ I p K d + I s
Under the experimental condition, the standoff distance s ranged from 12 to 16 mm, and r equaled 2 mm. The relation between standoff distance s and θ is illustrated in Figure 16. It is obvious that θ is linearly correlative to standoff distance s. The correlation coefficient reached −0.995. With the linear fitting method, θ can be expressed in terms of s
θ = 0.010 s + 0.285
The reflected laser detected by the sensor is not only from the top surface of deposited parts, but it is also from the powder. The monitorable reflected laser I can be described as
I = I r + I p o w d e r
Assuming that the reflected laser from powder I p o w d e r is constant and independent of standoff distance, combining Equations (7)–(9), the monitorable reflected laser I is simplified to
I = 0.020 I p K d · s + C
where C = 0.570 I p K d + I s + I p o w d e r .
According to Equation (10), there should exist a linear correlation between the intensity of reflected laser and standoff distance, which is consistent with the experimental results. The reflected laser is suitable to monitor the accumulated deposition height.

4. Conclusions

To investigate the characteristics of LMD of aluminum alloys without direction dependency, optical signals were collected by three coaxial sensors sensitive to visible light, infrared light, and reflected laser wavelength. The trend of the three signals along with the deposition layers is illustrated. The possibility of monitoring the accumulated deposition height and deposition width were discussed. The conclusions can be summarized as follows:
(1)
The visible light is not suitable for monitoring the process stability of the aluminum alloy LMD process.
(2)
There exists a trend of progressive increase through the first several layers in reflected laser signals, which coincides with accumulated deposition height. Reflected laser is linearly correlated with accumulated deposition height.
(3)
The infrared light signals are in a continual process of climbing because of the heat accumulation during the LMD process. A linear correlation is exhibited between infrared light and deposition width.
(4)
Accumulated deposition height and deposition width during the LMD process of aluminum alloys can be monitored with reflected laser and infrared light simultaneously. Reflected laser signals and infrared light signals have the potential to serve as the input of online feedback geometry control systems and real-time defect alarm systems of the LMD process.

Author Contributions

X.W., experimental planning, device processing, analysis, and writing—original; L.L., concept, experimental planning, analysis, supervision, and writing—review and editing; Y.H., device processing. All authors have read and agreed to the published version of the manuscript.

Funding

This research received no external funding.

Institutional Review Board Statement

Not applicable.

Informed Consent Statement

Not applicable.

Data Availability Statement

The raw/processed data required to reproduce these findings cannot be shared at this time as the data also forms part of an ongoing study.

Conflicts of Interest

The authors declare no conflict of interest.

References

  1. Huang, S.H.; Liu, P.; Mokasdar, A.; Hou, L. Additive manufacturing and its societal impact: A literature review. Int. J. Adv. Manuf. Technol. 2013, 67, 1191–1203. [Google Scholar] [CrossRef]
  2. Campanelli, S.L.; Angelastro, A.; Signorile, C.G.; Casalino, G. Investigation on direct laser powder deposition of 18 Ni (300) marage steel using mathematical model and experimental characterisation. Int. J. Adv. Manuf. Technol. 2016, 89, 885–895. [Google Scholar] [CrossRef]
  3. Sun, J.; Zhao, Y.; Yang, L.; Zhao, X.; Qu, W.; Yu, T. Effect of shielding gas flow rate on cladding quality of direct laser fabrication AISI 316L stainless steel. J. Manuf. Process. 2019, 48, 51–65. [Google Scholar] [CrossRef]
  4. Zhao, Y.; Wang, Z.; Zhao, J.; He, Z.; Zhang, H. Comparison of Substrate Preheating on Mechanical and Microstructural Properties of Hybrid Specimens Fabricated by Laser Metal Deposition 316 L with Different Wrought Steel Substrate. Crystals 2020, 10, 891. [Google Scholar] [CrossRef]
  5. Wei, P.; Wei, Z.; Chen, Z.; Du, J.; He, Y.; Li, J.; Zhou, Y. The AlSi10Mg samples produced by selective laser melting: Single track, densification, microstructure and mechanical behavior. Appl. Surf. Sci. 2017, 408, 38–50. [Google Scholar] [CrossRef]
  6. Kempen, K.; Thijs, L.; Van Humbeeck, J.; Kruth, J.-P. Mechanical Properties of AlSi10Mg Produced by Selective Laser Melting. Phys. Procedia 2012, 39, 439–446. [Google Scholar] [CrossRef] [Green Version]
  7. Kiani, P.; Dupuy, A.D.; Ma, K.; Schoenung, J.M. Directed energy deposition of AlSi10Mg: Single track nonscalability and bulk properties. Mater. Des. 2020, 194, 108847. [Google Scholar] [CrossRef]
  8. Bi, G.; Sun, C.; Gasser, A. Study on influential factors for process monitoring and control in laser aided additive manufacturing. J. Mater. Process. Technol. 2013, 213, 463–468. [Google Scholar] [CrossRef]
  9. Ding, X.; Li, H.; Zhu, J.; Wang, G.; Cao, H.; Zhang, Q.; Ma, H. Application of infrared thermography for laser metal-wire additive manufacturing in vacuum. Infrared Phys. Technol. 2017, 81, 166–169. [Google Scholar] [CrossRef]
  10. Zheng, L.; Zhang, Q.; Cao, H.; Wu, W.; Ma, H.; Ding, X.; Yang, J.; Duan, X.; Fan, S. Melt pool boundary extraction and its width prediction from infrared images in selective laser melting. Mater. Des. 2019, 183, 108110. [Google Scholar] [CrossRef]
  11. Bi, G.; Schürmann, B.; Gasser, A.; Wissenbach, K.; Poprawe, R. Development and qualification of a novel laser-cladding head with integrated sensors. Int. J. Mach. Tools Manuf. 2007, 47, 555–561. [Google Scholar] [CrossRef]
  12. Everton, S.K.; Hirsch, M.; Stravroulakis, P.; Leach, R.K.; Clare, A.T. Review of in-situ process monitoring and in-situ metrology for metal additive manufacturing. Mater. Des. 2016, 95, 431–445. [Google Scholar] [CrossRef]
  13. Garmendia, I.; Leunda, J.; Pujana, J.; Lamikiz, A. In-process height control during laser metal deposition based on structured light 3D scanning. Procedia CIRP 2018, 68, 375–380. [Google Scholar] [CrossRef]
  14. Ocylok, S.; Alexeev, E.; Mann, S.; Weisheit, A.; Wissenbach, K.; Kelbassa, I. Correlations of Melt Pool Geometry and Process Parameters During Laser Metal Deposition by Coaxial Process Monitoring. Phys. Procedia 2014, 56, 228–238. [Google Scholar] [CrossRef]
  15. Iravani-Tabrizipour, M.; Toyserkani, E. An image-based feature tracking algorithm for real-time measurement of clad height. Mach. Vis. Appl. 2007, 18, 343–354. [Google Scholar] [CrossRef]
  16. Song, L.; Bagavath-Singh, V.; Dutta, B.; Mazumder, J. Control of melt pool temperature and deposition height during direct metal deposition process. Int. J. Adv. Manuf. Technol. 2011, 58, 247–256. [Google Scholar] [CrossRef]
  17. Biegler, M.; Graf, B.; Rethmeier, M. In-situ distortions in LMD additive manufacturing walls can be measured with digital image correlation and predicted using numerical simulations. Addit. Manuf. 2018, 20, 101–110. [Google Scholar] [CrossRef]
  18. He, W.; Shi, W.; Li, J.; Xie, H. In-situ monitoring and deformation characterization by optical techniques; Part I: Laser-aided direct metal deposition for additive manufacturing. Opt. Lasers Eng. 2019, 122, 74–88. [Google Scholar] [CrossRef]
  19. Heralić, A.; Christiansson, A.-K.; Ottosson, M.; Lennartson, B. Increased stability in laser metal wire deposition through feedback from optical measurements. Opt. Lasers Eng. 2010, 48, 478–485. [Google Scholar] [CrossRef]
  20. Tang, L.; Ruan, J.; Sparks, T.E.; Landers, R.G.; Liou, F. Layer-to-layer height control of Laser Metal Deposition processes. Am. Control. Conf. 2009, 133, 5582–5587. [Google Scholar] [CrossRef]
  21. Heigel, J.; Michaleris, P.; Palmer, T. In situ monitoring and characterization of distortion during laser cladding of Inconel 625. J. Mater. Process. Technol. 2015, 220, 135–145. [Google Scholar] [CrossRef]
  22. Segerstark, A.; Andersson, J.; Svensson, L.-E. Investigation of laser metal deposited Alloy 718 onto an EN 1.4401 stainless steel substrate. Opt. Laser Technol. 2017, 97, 144–153. [Google Scholar] [CrossRef]
  23. Donadello, S.; Motta, M.; Demir, A.G.; Previtali, B. Monitoring of laser metal deposition height by means of coaxial laser triangulation. Opt. Lasers Eng. 2019, 112, 136–144. [Google Scholar] [CrossRef] [Green Version]
  24. Garmendia, I.; Pujana, J.; Lamikiz, A.; Madarieta, M.; Leunda, J. Structured light-based height control for laser metal deposition. J. Manuf. Process. 2019, 42, 20–27. [Google Scholar] [CrossRef]
  25. Donadello, S.; Motta, M.; Demir, A.G.; Previtali, B. Coaxial laser triangulation for height monitoring in laser metal deposition. Procedia CIRP 2018, 74, 144–148. [Google Scholar] [CrossRef]
  26. George, N. Process Monitoring and Control for Laser Welding. Available online: https://assets.lia.org/s3fs-public/pdf/conferences/Najah%20George%20-%20Process%20Monitoring%20and%20Control%20for%20Laser%20Welding.pdf (accessed on 21 May 2021).
  27. Zhao, Y.; Yu, T.; Li, B.; Wang, Z.; Chen, H. Calculation and verification of Start/Stop optimum overlapping rate on metal DLF technology. Int. J. Adv. Manuf. Technol. 2018, 99, 437–452. [Google Scholar] [CrossRef]
  28. Boisselier, D.; Sankaré, S.; Engel, T. Improvement of the Laser Direct Metal Deposition Process in 5-axis Configuration. Phys. Procedia 2014, 56, 239–249. [Google Scholar] [CrossRef] [Green Version]
  29. Rodgers, J.L.; Nicewander, W.A. Thirteen Ways to Look at the Correlation Coefficient. Am. Stat. 1988, 42, 59–66. [Google Scholar] [CrossRef]
  30. Zhu, G.; Li, D.; Zhang, A.; Pi, G.; Tang, Y. The influence of standoff variations on the forming accuracy in laser direct metal deposition. Rapid Prototyp. J. 2011, 17, 98–106. [Google Scholar] [CrossRef]
  31. Xiao, X.; Liu, X.; Cheng, M.; Song, L. Towards monitoring laser welding process via a coaxial pyrometer. J. Mater. Process. Technol. 2020, 277, 116409. [Google Scholar] [CrossRef]
  32. Novotny, P.; Ferrier, N. Using infrared sensors and the Phong illumination model to measure distances. In Proceedings of the IEEE International Conference on Robotics & Automation, Detroit, MI, USA, 10–15 May 1999; pp. 1644–1649. [Google Scholar] [CrossRef]
  33. Ryu, D.; Um, D.; Tanofsky, P.; Koh, D.H.; Ryu, Y.S.; Kang, S. T-less: A novel touchless human-machine interface based on infrared proximity sensing. In Proceedings of the 2010 IEEE/RSJ International Conference on Intelligent Robots and Systems, Taipei, Taiwan, 18–22 October 2010. [Google Scholar] [CrossRef]
Figure 1. Sensors and laser head of the LWM system.
Crystals 11 00589 g001
Figure 2. Principle diagram of the LWM system [26].
Crystals 11 00589 g002
Figure 3. Thin-walled samples deposited by LMD. (a) A thin-walled sample deposited during stable process; (b) a thin-walled sample deposited during unstable process.
Crystals 11 00589 g003
Figure 4. Front view of the thin-walled sample and analyzed region.
Crystals 11 00589 g004
Figure 5. Noise signals of visible light, infrared light, and reflected laser in time domain and frequency domain. (a) noise signals of reflected laser in time domain, (b) noise signals of reflected laser in frequency domain, (c) noise signals of infrared light in time domain, (d) noise signals of infrared light in frequency domain, (e) noise signals of visible light in time domain, (f) noise signals of visible light in frequency domain.
Crystals 11 00589 g005
Figure 6. Raw and filtered signals of visible light, infrared light, and reflected laser: (a) raw signals of reflected laser, (b) filtered signals of reflected laser, (c) raw signals of infrared light, (d) filtered signals of infrared laser, (e) raw signals of visible light, (f) filtered signals of visible light.
Crystals 11 00589 g006
Figure 7. Filtered signals from different layers during LMD process with laser power 900 W.
Crystals 11 00589 g007
Figure 8. State of powders and plasma under laser irradiation with laser power 900 W captured by high-speed camera: (a) nearly no plasma was induced, (b) some powders exploded randomly and induced plasma.
Crystals 11 00589 g008
Figure 9. Variation of visible light, infrared light, and reflected lasers with layers during the LMD process of aluminum alloy thin-walled sample.
Crystals 11 00589 g009
Figure 10. Characteristics of monitoring signals during the LMD process with different laser powers: (a) visible light signals, (b) infared light signals, (c) reflected laser signals.
Crystals 11 00589 g010
Figure 11. Schematic diagram of reflected laser: (a) the positions of standoff distance, light source, surface normal, reflected, and viewing vectors; (b) OM image of the 2nd to 15th layers of the aluminum alloy sample in cross-section, in which location the layer thickness changes most violently.
Crystals 11 00589 g011
Figure 12. Relationship between standoff distance and mean intensity of reflected laser.
Crystals 11 00589 g012
Figure 13. Relationship between mean intensity of the reflected laser and the height profile of the top layer.
Crystals 11 00589 g013
Figure 14. Relation between mean intensity of infrared light and deposition width.
Crystals 11 00589 g014
Figure 15. Diagram of Phong model, μ s , μ n , μ r , and μ v are the light source, surface normal, reflected, and viewing vectors, respectively.
Crystals 11 00589 g015
Figure 16. Behaviors of θ as a function of s.
Crystals 11 00589 g016
Table 1. Composition of AlSi10Mg powder (wt%).
SiMgZnMnNiFeOAl
10.110.350.0430.20.00460.0850.01Bal.
Table 2. Potential application of infrared light and reflected laser.
SignalsDeposition HeightDeposition WidthGeometry Control of Each LayerReal-Time Defect Alarm
Infrared light
Reflected laser
Publisher’s Note: MDPI stays neutral with regard to jurisdictional claims in published maps and institutional affiliations.

