Article

Analysis of Te Inclusion Striations in (Cd,Zn)Te Crystals Grown by Traveling Heater Method

1
Freiburg Materials Research Center FMF, 79104 Freiburg, Germany
2
Research and Development Institute for Launch Complexes NIISK, 119526 Moscow, Russia
3
Institute of Solid State Physics of Russian Academy of Sciences, 142432 Chernogolovka, Russia
*
Authors to whom correspondence should be addressed.
Crystals 2021, 11(6), 649; https://doi.org/10.3390/cryst11060649
Submission received: 30 April 2021 / Revised: 30 May 2021 / Accepted: 3 June 2021 / Published: 8 June 2021

Abstract

:
The growth of (Cd,Zn)Te (CZT) crystals and the improvement of the crystal quality are part of a research project towards experiments under microgravity using the Traveling Heater Method (THM). In order to determine the experimental parameters, we performed a detailed ground-based program. Three CZT crystals with a nominal Zn content of 10% were grown using THM from a Te-rich solution. The size and distribution of the Te inclusions were evaluated by transmission infrared microscopy (IR). From the three-dimensional mapping of the inclusions, we observed striation-like patterns in all of the crystals. The correlation between the growth parameters and the formation of these striations was explored and discussed. We found that the inclusion striations are related to periodic temperature variations.

1. Introduction

The application of (Cd,Zn)Te (CZT) in radiation detectors demands high-quality CZT crystals with a larger volume and high resistivity. Because of the low growth temperature, the use of a seed crystal and the higher solubility of most impurities in the Te-rich zone, the Traveling Heater Method (THM) has received much attention due to a successful production of a large volume of detector-grade CdTe and CZT crystals with excellent electrical properties [1,2,3,4,5]. Nevertheless, the growth of high-quality CZT crystals with a low number of defects and high compositional homogeneity remains a challenge. In recent decades, it has become apparent that convection has a strong influence on the heat and mass transport, interface stability and, thus, the compositional uniformity of the grown crystal [6,7,8]. Forced convection—such as the application of a static magnetic field [9,10], rotating magnetic field (RMF) [11,12,13,14] and accelerated crucible rotation technique [15,16,17,18]—is therefore induced to suppress natural convection and consequently improve homogeneity in the solution zone. Microgravity conditions have been reported to dramatically reduce the buoyancy convection, and thus, heat and mass transport become dominated by diffusion [19]. Therefore, microgravity offers a unique opportunity to improve the technique for growing homogeneous crystals. Moreover, microgravity can be used as a tool to improve the understanding of the growth mechanisms and fundamentals of the THM growth processes [20]. Establishing the effects of microgravity conditions involving convection on the morphology, impurities incorporation, structural defects, induced strain and compositional uniformity is of great scientific significance for the improvement of crystal growth on Earth [21,22,23,24,25,26]. Crystal growth under microgravity yields important results, which will be used to improve growth in the laboratory and in industrial processes.
Long-term CdTe and CZT growth experiments have been carried out in a close collaboration between European and Russian scientists using the FOTON and FOTON-M satellites with the Zona-4 and Polizon-2 facilities [13,27,28,29,30,31,32,33,34]. These FOTON missions have aimed to grow high-quality crystals and investigate the origin of compositional inhomogeneities and defects in the grown crystals. Recently, two space experiments on the growth of CZT by THM under microgravity, dubbed “VAMPIR-F”, were scheduled and will be carried out in the Russian Multifunctional Laboratory Module (MLM). The module will be launched in summer 2021 and will be a part of the International Space Station (ISS) for the next decade. Three ground experiments by THM combined with an RMF have been performed to determine the technological parameters for the space experiments and for comparison reasons. More specifically, the initial composition and the absolute length of the zone need to be determined to ensure a good fit with the temperature profile, further aiming at reaching 10 mol% of ZnTe in the grown crystals. In addition, to ensure proper operation, the setup—including the furnace, the ampoule design, temperature control and RMF—must be assessed before running the space experiments. The final motivation is to establish the contributions of the growth parameters to the formation of crystal defects. In this study, we have focused on investigating the relation between the growth process and the formation of secondary phase Te inclusions.
Material defects such as grain boundaries, twins, dislocations and Te inclusions have been proved to hamper the performance and to limit the size of CdTe and CZT detectors. Te inclusions are of particular interest in general due to the fact that they can trap the charge from electron clouds, thereby resulting in significant fluctuations in the collected charge signal in the detector device [35]. Te inclusions are preferably concentrated at the re-entrant angles of the grain boundaries and twins crossing the growth interface. It has been demonstrated that the formation of Te inclusions in a grown crystal is strongly dependent on the microscopic morphology of the growth interface [36], which, in turn, can be influenced by growth parameters such as growth rate, growth temperature, temperature gradient and temperature stability of the furnace. The diameter of typical Te inclusions is 1 to 30 μm. Te inclusions with a diameter larger than 10 µm can dramatically affect the performance and efficiency of the detector, while the detector’s spectral resolution is better when the inclusions’ size is smaller [37,38]. It has been reported that the peak width (%FWHM) of the response function of detectors narrows from 3.7% to 0.3% when the concentration of large Te inclusions (>10 µm) is reduced by two orders of magnitude [37].
Another common defect in crystal growth is striations. Striations are usually observed in silicon crystals grown using the Czochralski method [39]. Striations can vary in nature. For instance, resistivity striations in Ge [40] and InSb [41], and carrier lifetime striations in silicon solar cells [42] were reported. Most of these striations are created by rotation of the growing crystal, or time-dependent flow phenomena in the melt, such as a fluctuating growth rate. Te inclusion striations in CdTe were first observed by Bolke et al. [35] in 2017, and he concluded that these patterns might be influenced by the selected growth parameters. However, the question of which specific parameters these patterns are correlated to has not yet been studied. In this work, we also observed axial inclusion striations in our terrestrial CZT samples grown using THM. The correlation between the growth parameters—specifically the periodic temperature variations—and the inclusion striations was analyzed.

2. Materials and Methods

Three CZT ingots were grown using THM from a Te-rich solution under terrestrial conditions. The setup and growth process of THM growth of CdTe and CZT crystals has been discussed in detail in earlier studies [3,27,43]. The feeds were polycrystalline and had a composition of Cd0.9Zn0.1Te with a purity of 99.9999%. The polycrystalline seeds with a composition of Cd0.9Zn0.1Te were grown using the Bridgman method [44]. The length of the feeds and seeds used for the experiments was ~30–32 and ~68–70 mm, respectively. The Te-rich zone contained 5 ppm indium as a dopant, and the lengths were ~22 mm when molten. The translation speed was 0.15 mm/h. The cooling rate was 50 °C/h. A rotating magnetic field of 2 mT at a frequency of 100 Hz was induced during translation for two crystals, while one was grown without applying a magnetic field (Table 1). The heater temperature during translation was set to increase gradually from 1080 to 1100 °C for F1-01, and from 1100 to 1110 °C for F1-02. For F1-03, we lowered the heater temperature from 1110 to 1100 °C in the first 50 h of translation and then slowly enhanced it back to 1110 °C. During the growth, thermocouples (type N) with a resolution of 0.1 °C were fixed at different positions on the ampoules for temperature recording. The CdTe composition in the zone and the heater starting position were adjusted, as shown in Table 1.
The grown crystals were 24 mm in diameter and ~36–37 mm in length. Several slices with a thickness of around 3 mm were cut along the growth axis from the crystal ingots (Figure 1). The samples were then mechanically polished using 3 μm Al2O3. Immediately afterwards, they were chemically etched with 1–2% Br-MeOH solution on both sides to a mirror finish. Transmission infrared microscopy (IR) was used to evaluate the concentration and size distribution of the Te inclusions in the crystals.

3. Results and Discussion

3.1. Comparison of the Inclusions in the Seed and the Grown Crystal

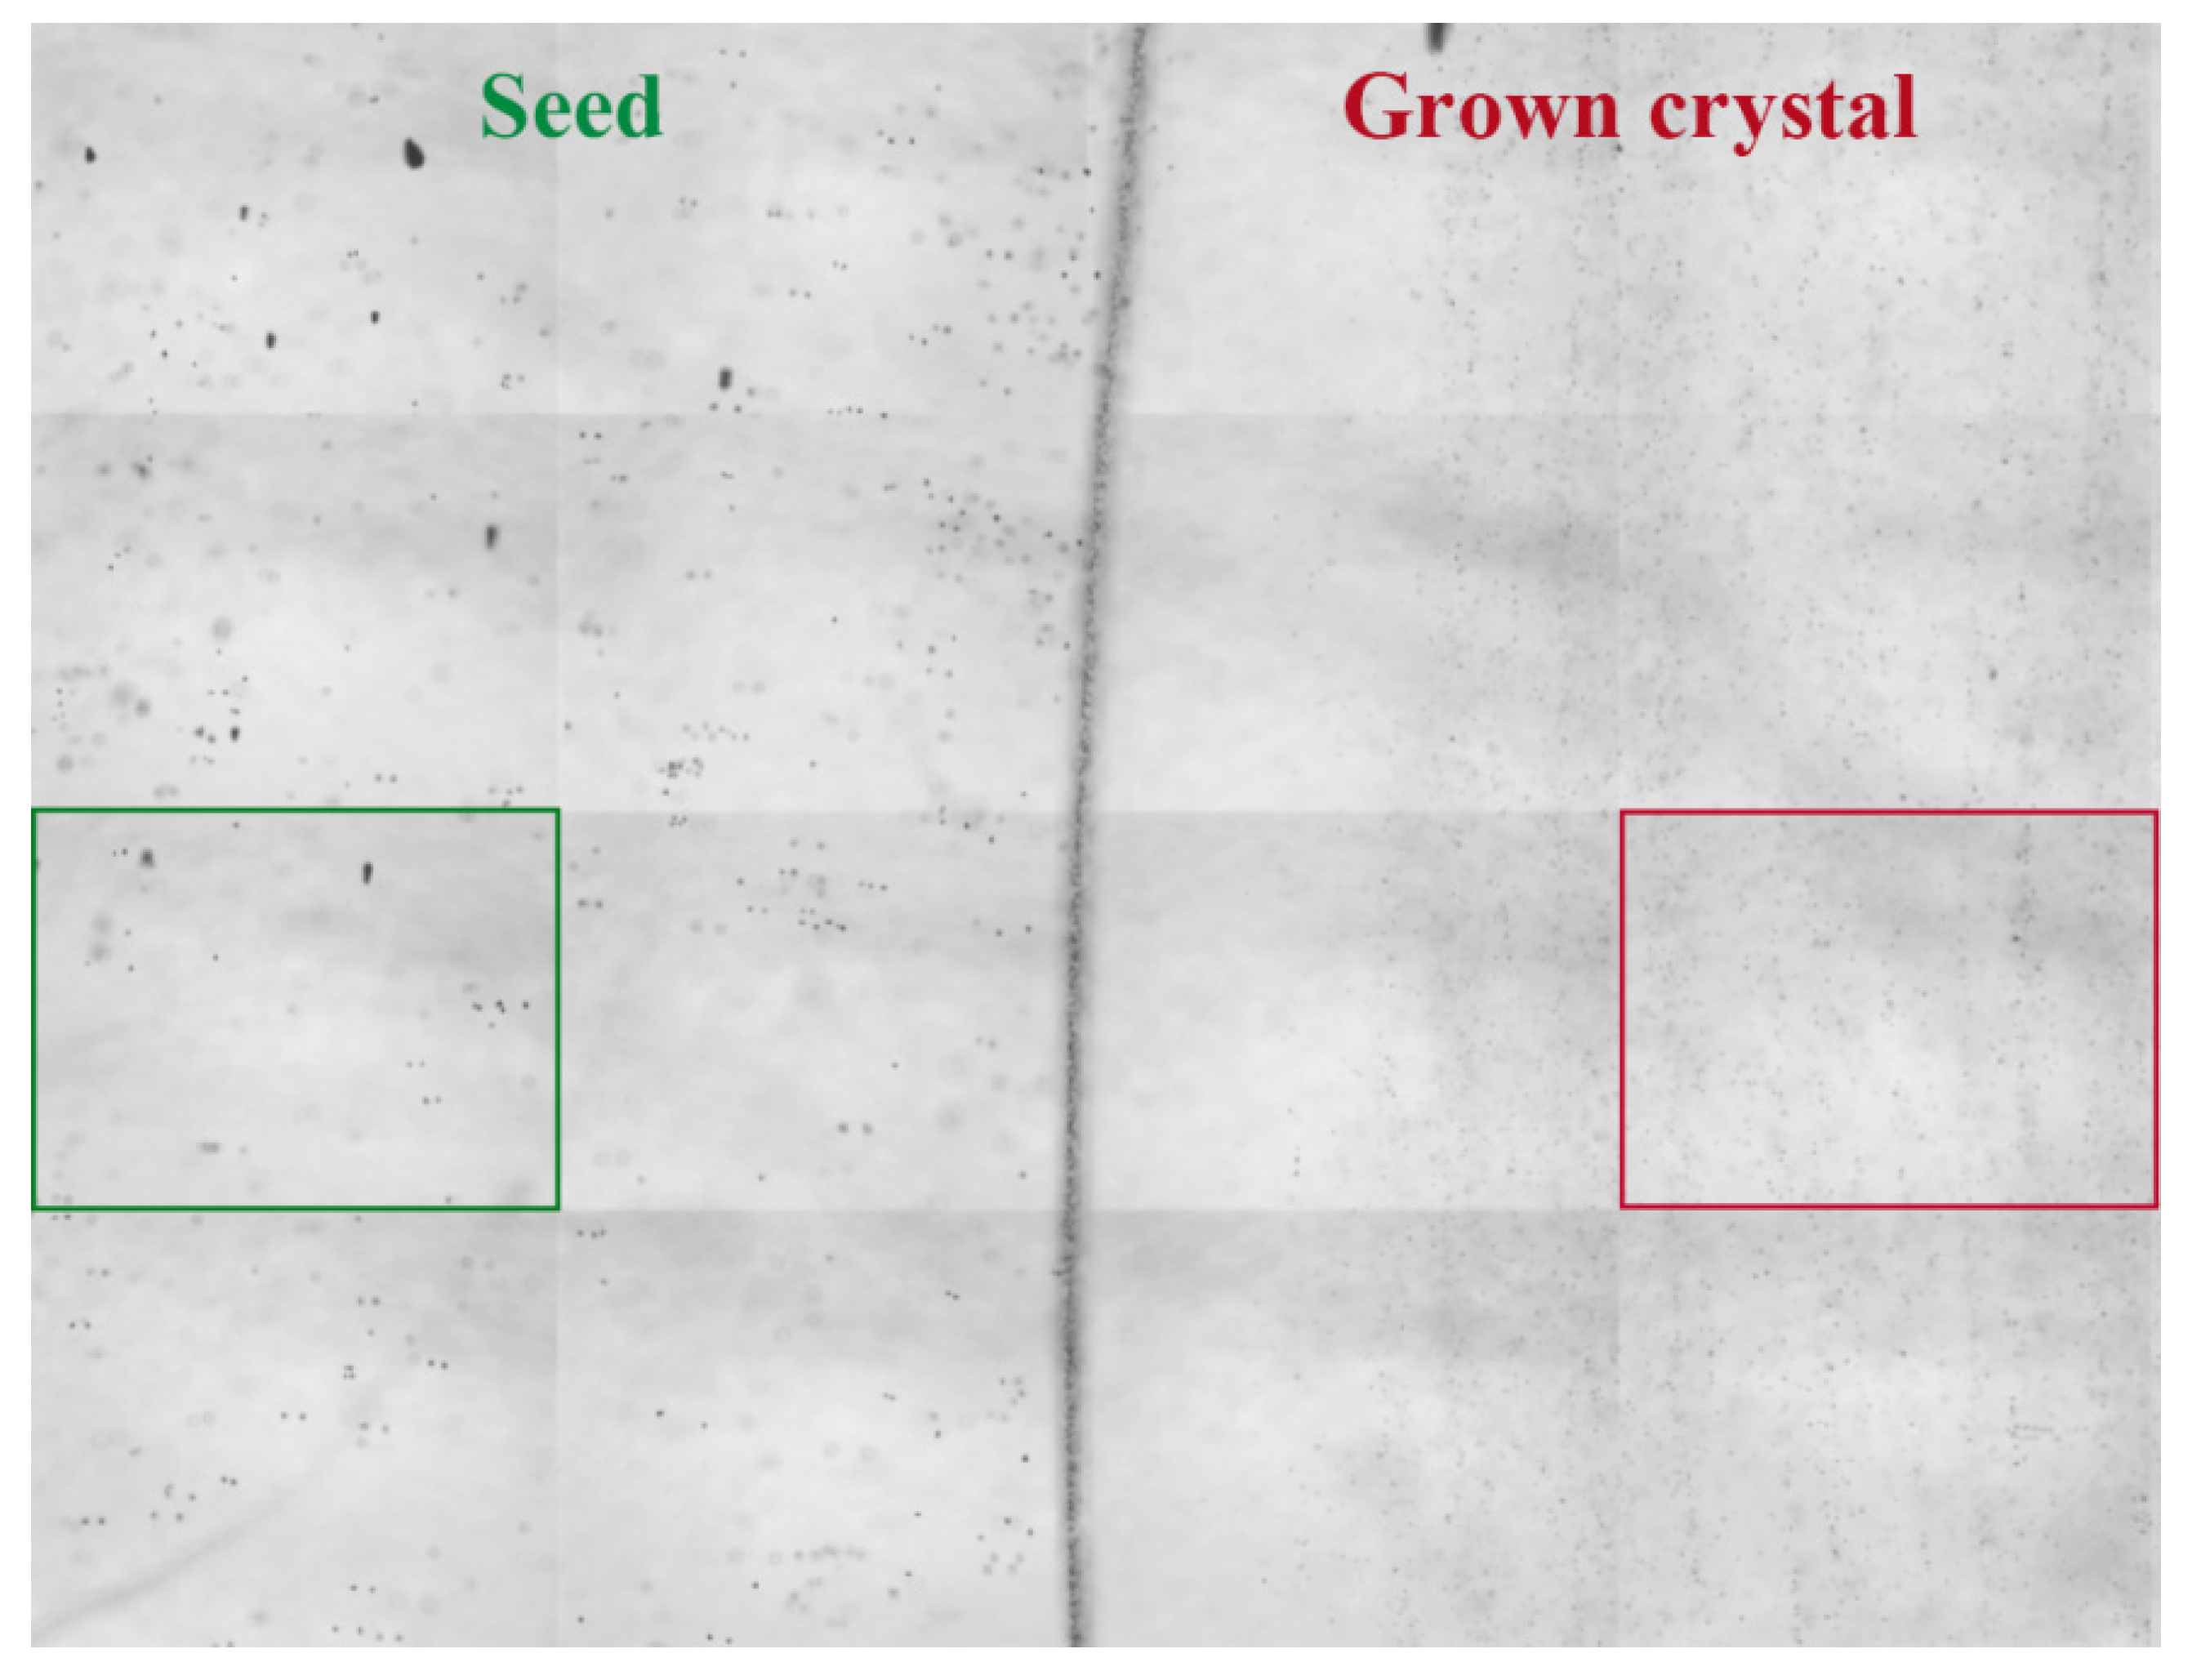
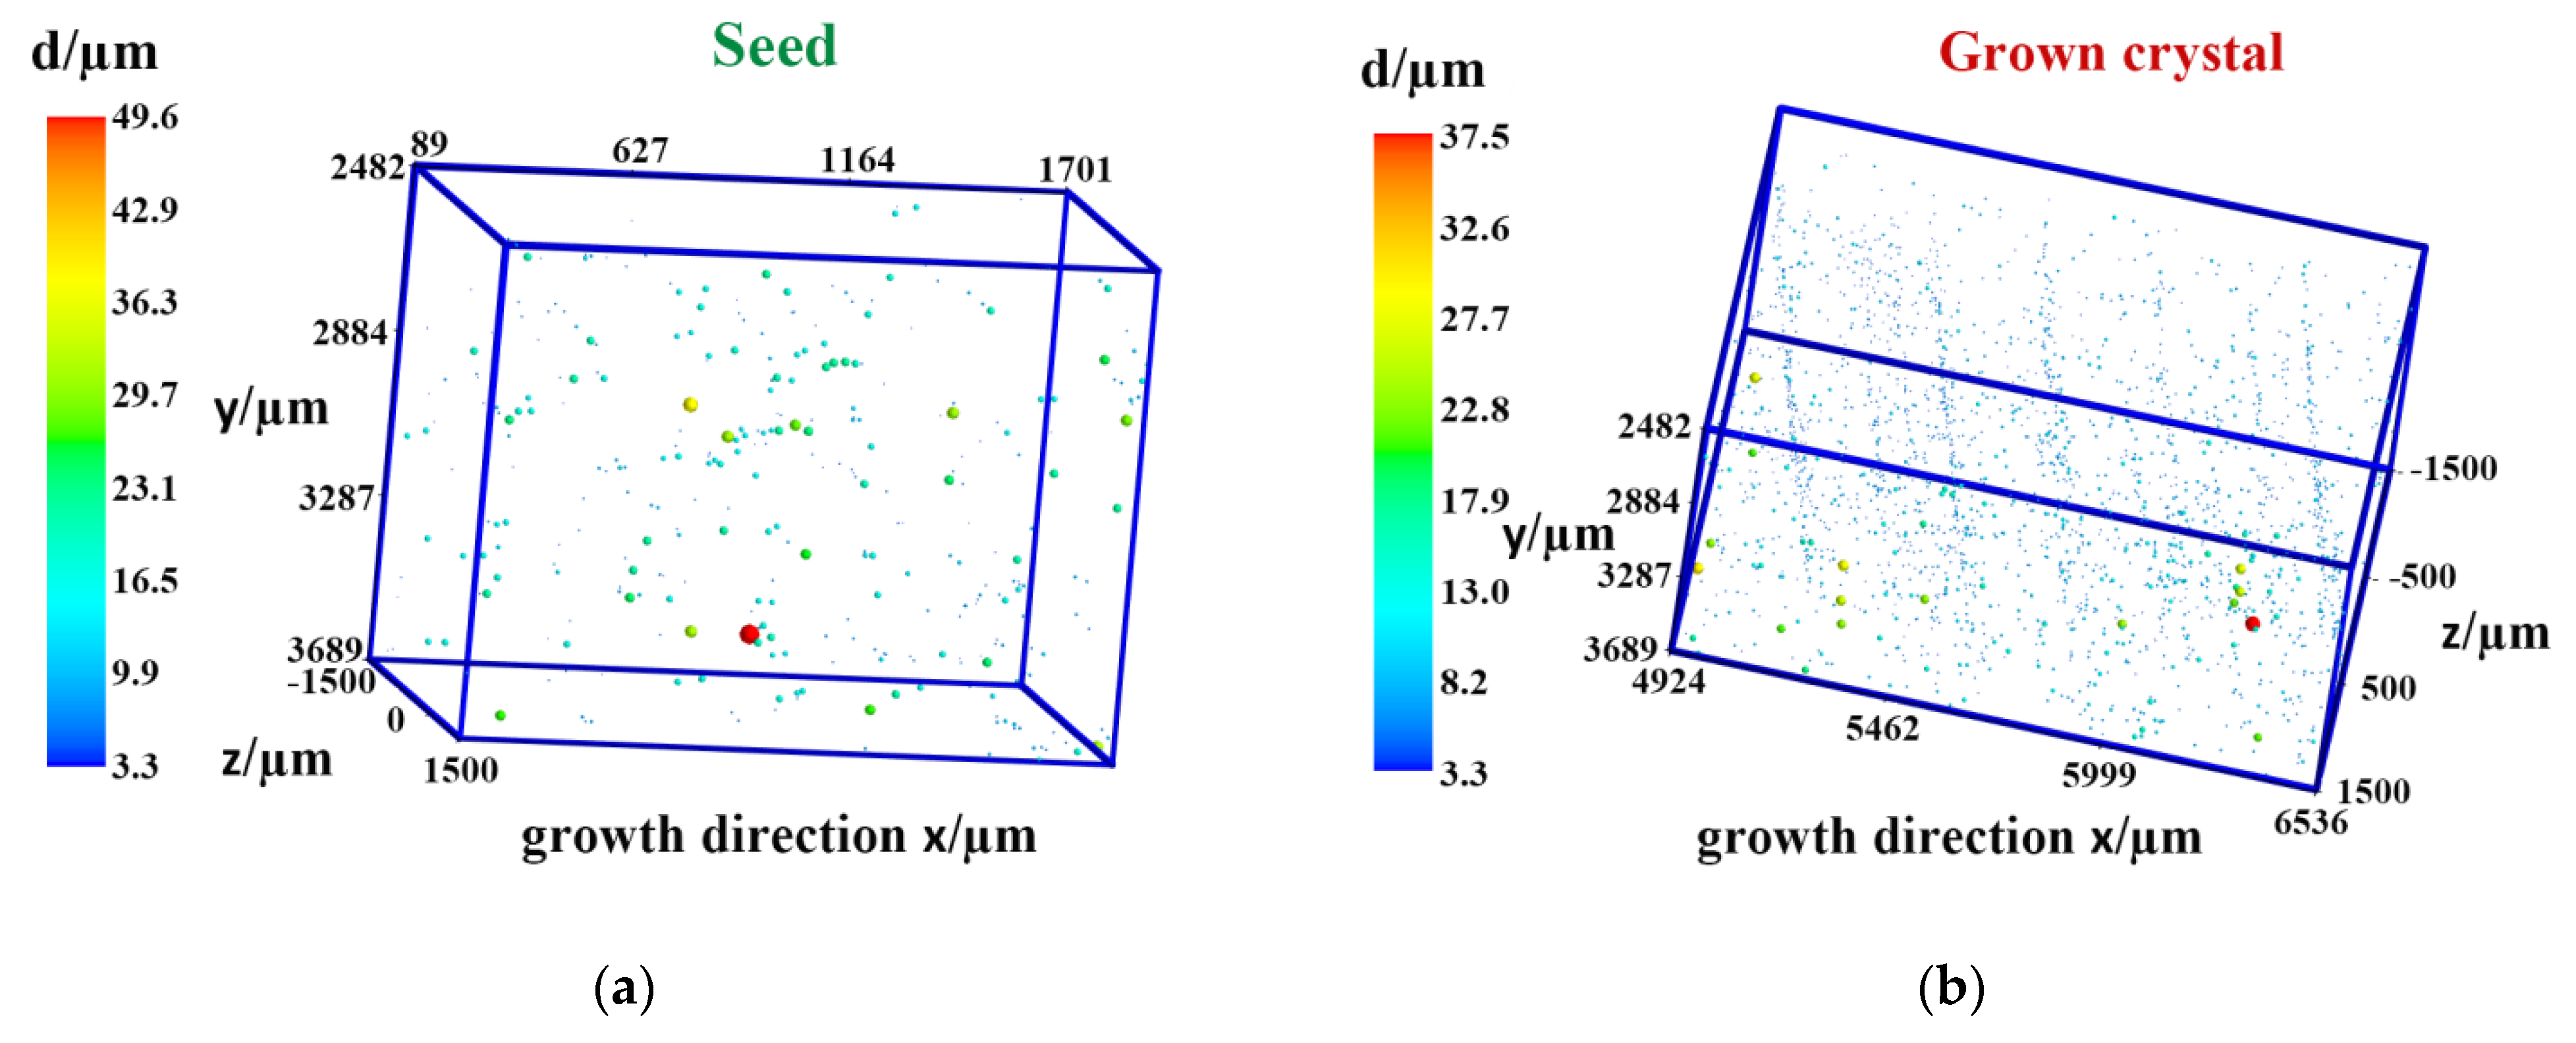
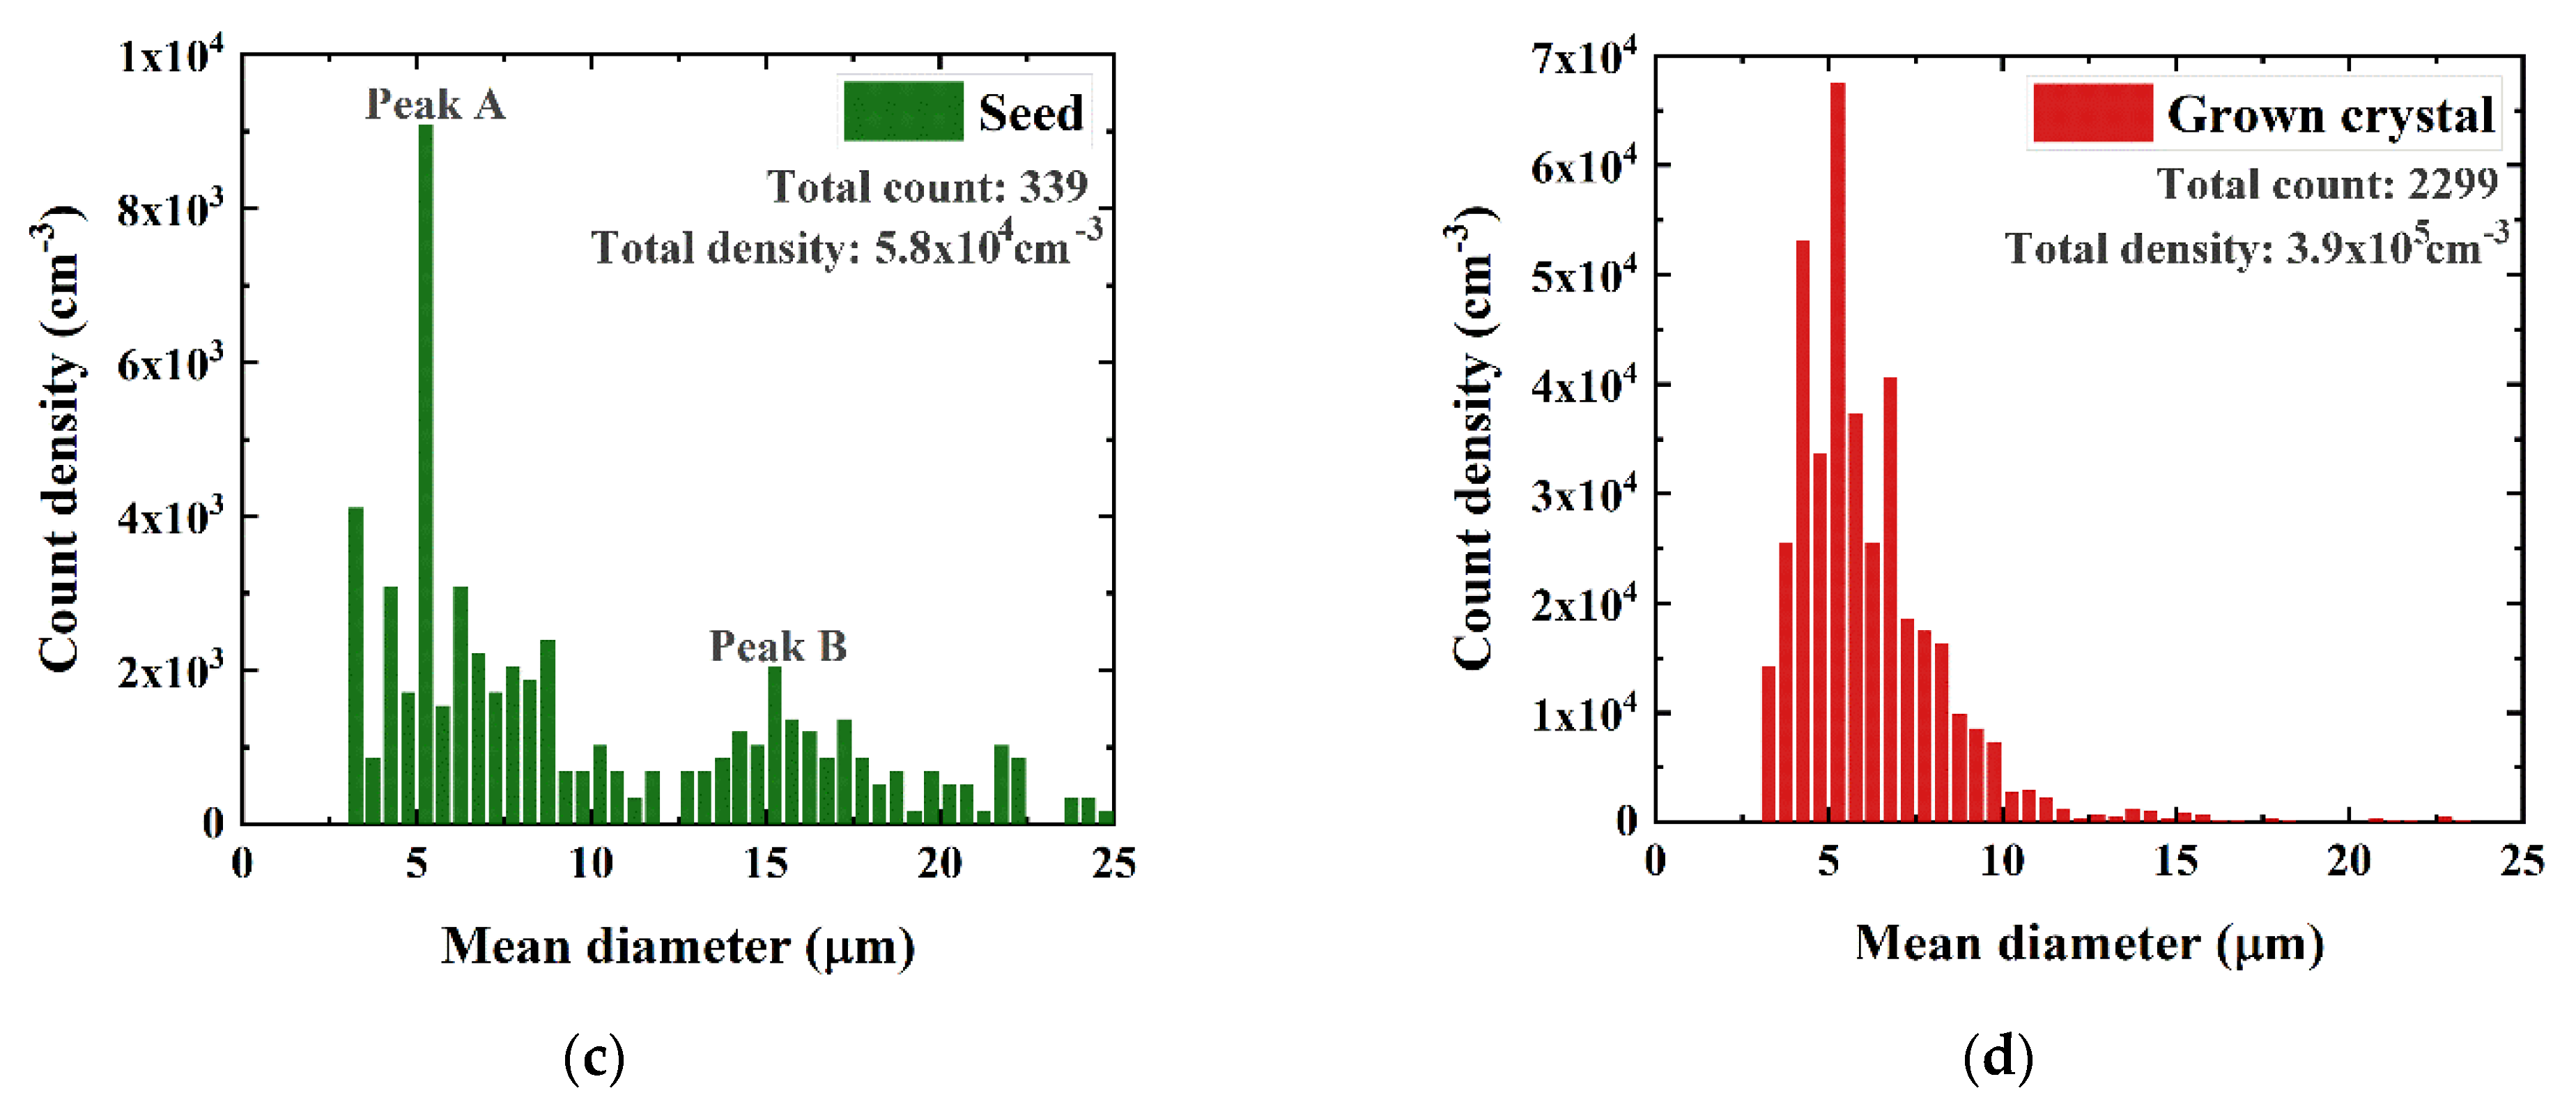
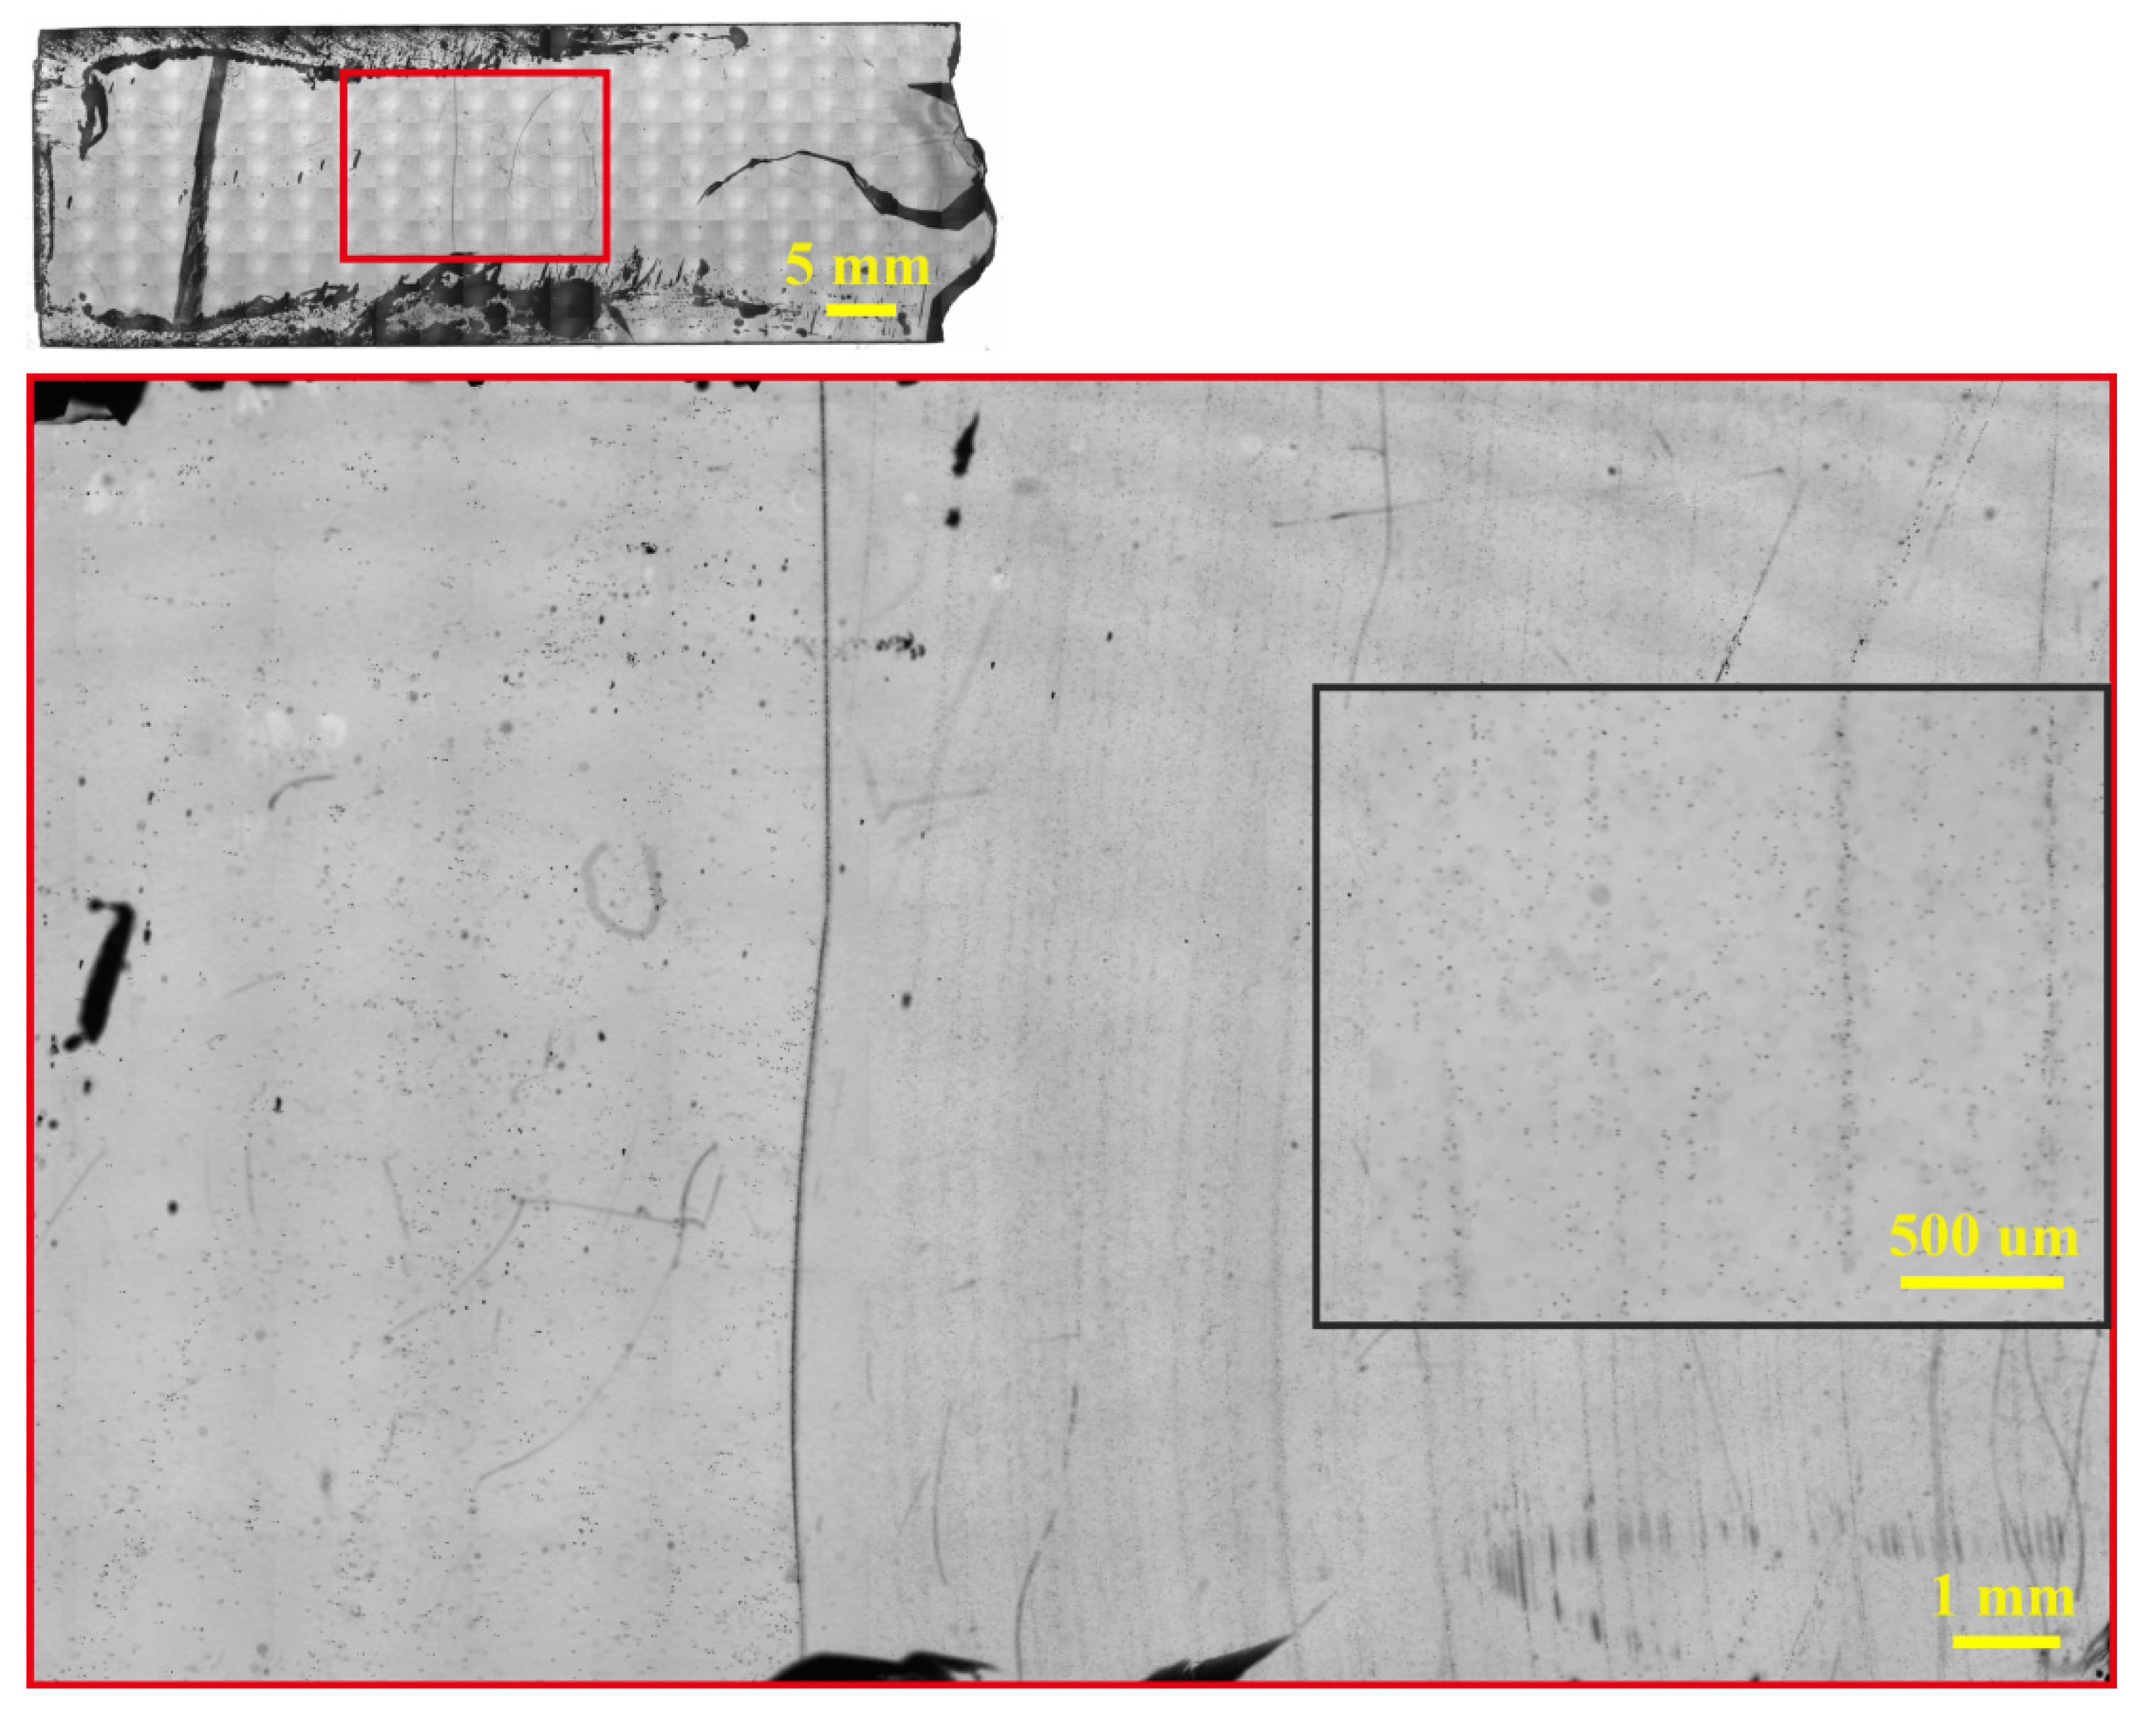
To compare the seed and the grown crystal, an area near the interface in F1-03, as shown in the red frame in Figure 1b, was evaluated, and quantification of Te inclusion density was performed. Figure 2 shows that some larger inclusions are homogeneously distributed in the seed, while there are more inclusions in the grown crystal with considerably smaller sizes. For comparison, two areas with the same size from the seed and the grown crystal, shown in Figure 3a,b, respectively, were quantitatively analyzed and the results are shown in Figure 3c,d. It is worth noting that the inclusion distribution in the seed (Figure 3a, Supplementary File 1) is random, while distinct striation-like patterns are displayed in the grown crystal (Figure 3b, Supplementary File 1). Furthermore, in Figure 3c, two peaks, labeled as “Peak A” and “Peak B”, appear in the inclusion distribution in the seed area. Even though the count concentration of Peak A is higher than that of Peak B, Peak B with large sizes contributes the majority of the inclusion volume. Hanager et al. [45] and McCoy et al. [46] observed this typical bimodal or multimodal distribution in CZT/CdTe from melt growth. However, this distribution was not found in the grown crystal region in Figure 3d. Instead, only one peak with a smaller size, similar to Peak A in the seed region, was observed. In total, 339 inclusions were found in the seed (Figure 3c) and their mean diameter was 10.57 μm, while in the grown crystal (Figure 3d), there were 2299 inclusions, with a mean diameter of 6.17 μm. That is, the number of inclusions in the grown crystal showed a sevenfold increase and their mean size reduced by almost half. The total concentrations of Te inclusions in the seed region and the grown crystal region were 5.8 × 104 cm−3 and 3.9 × 105 cm−3, respectively. It has been reported that smaller-size Te inclusions will not dramatically affect the performance and efficiency of the detector as the larger inclusions do (>10 µm) [37,38]. Therefore, regarding applications as radiation detectors, efforts to increase efficiency have focused on reducing the inclusion size, and we achieved a reduction of almost half by using THM growth. The inclusions in the seed showed a lower density but larger size when compared to those of the grown crystal.

3.2. Axial Inclusion Distribution

The size and concentration of the inclusions were evaluated along the axial direction. Taking into account both the size and concentration of Te inclusions, the volume density or the atomic density can be used for evaluation. With the simplification that Te inclusions have near-spherical geometry, the atomic density of the excess Te can be calculated using the following equation [47]:
C a , T e = 4 π ρ T e N A 3 M T e i = 1 n r i 3 ρ i
where ρTe is the density of the Te, NA is the Avogadro constant, MTe is the relative atomic mass of Te, ri is the radius and ρi is the density of the inclusions with a class of particle diameter i.
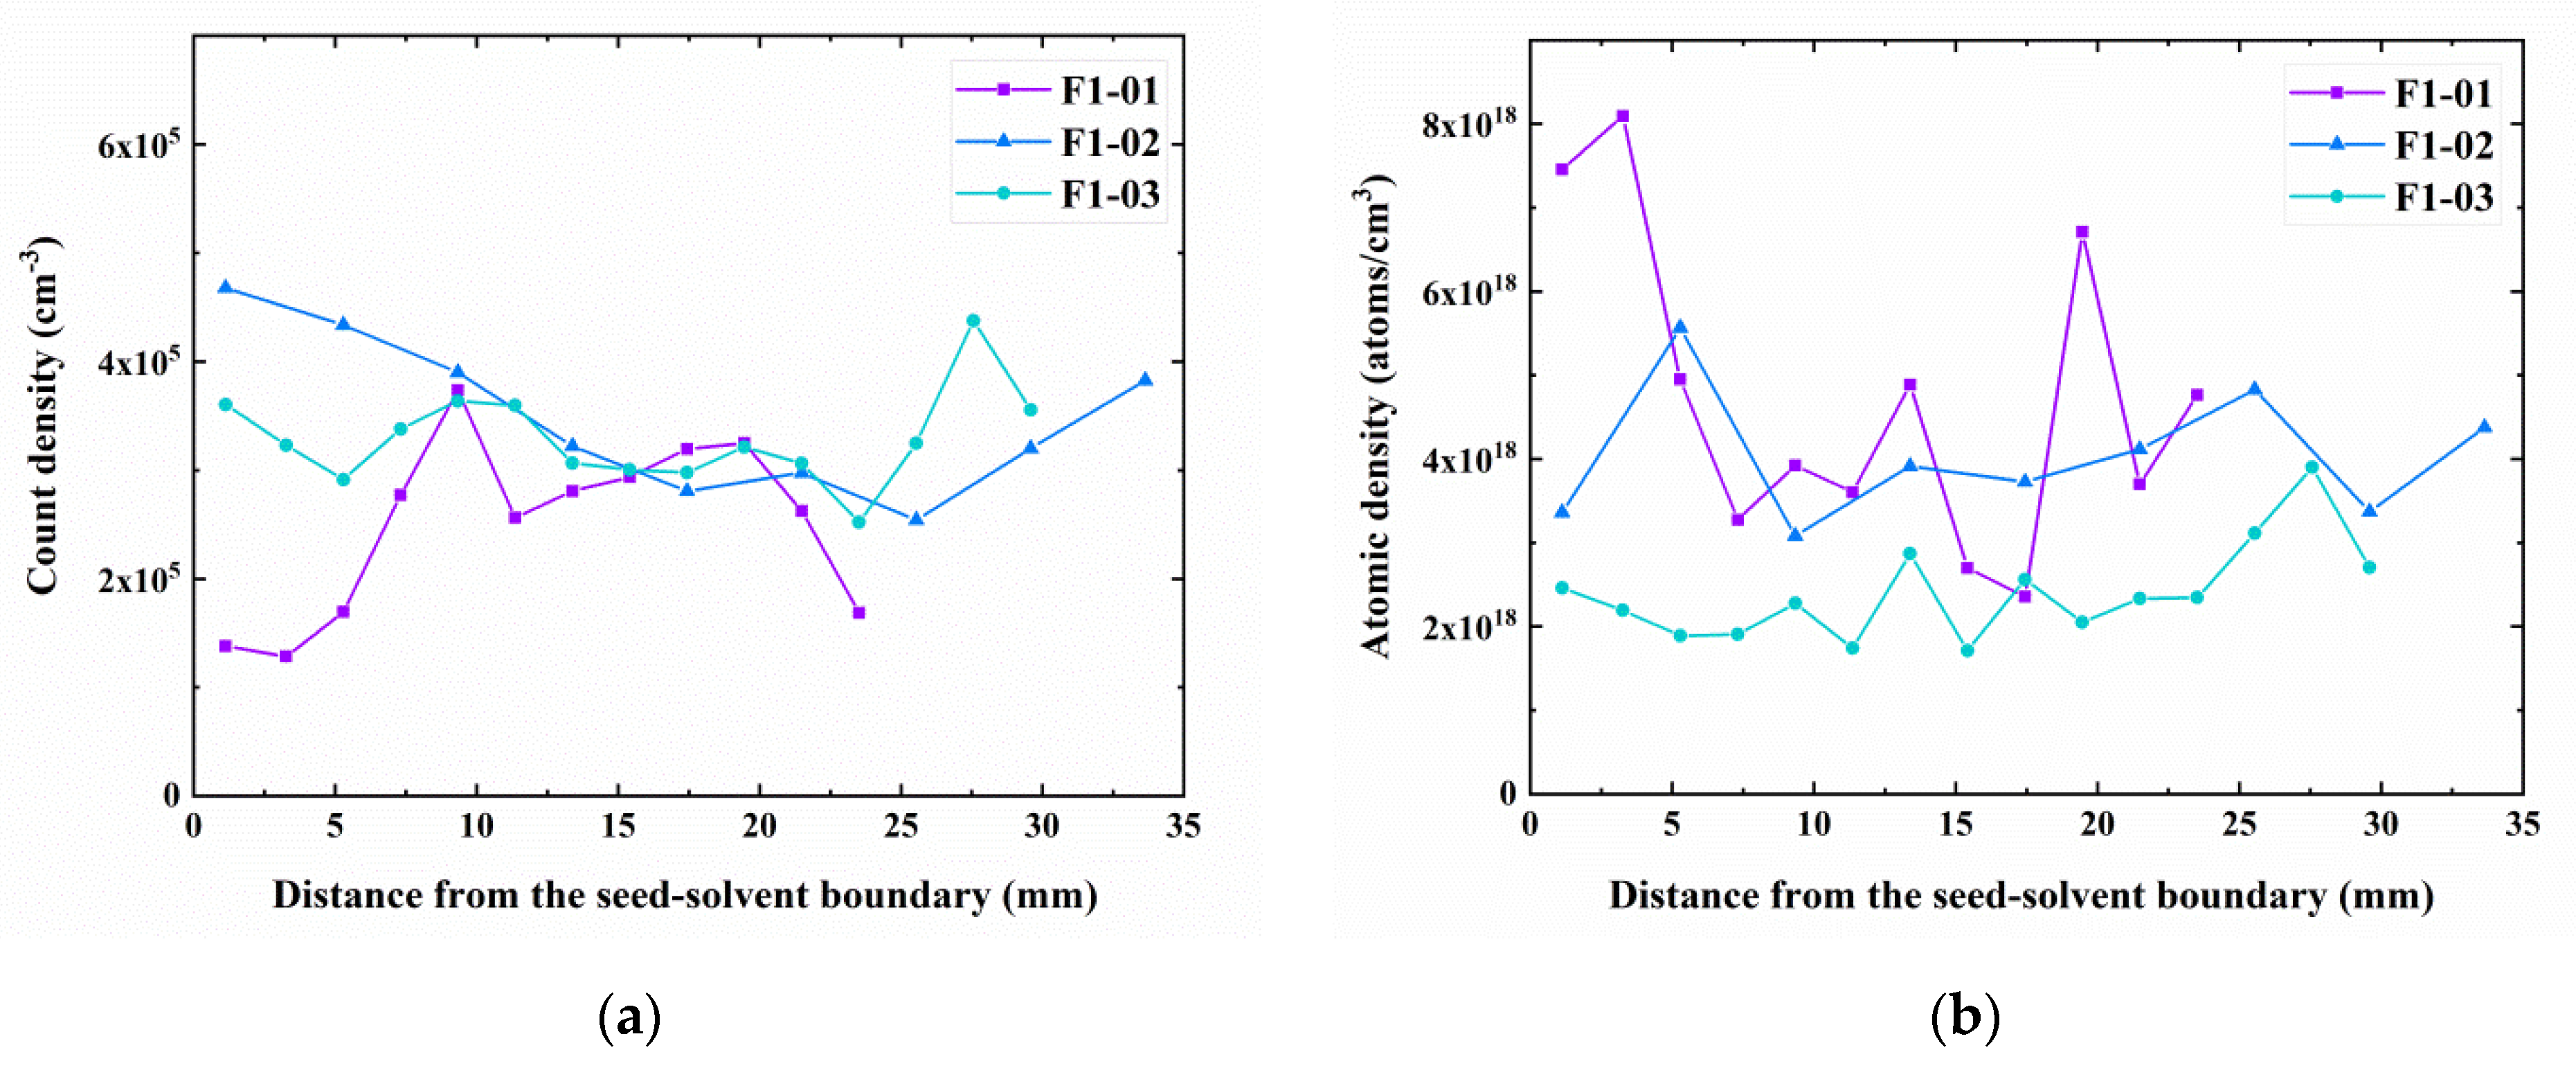
Figure 4 plots the total atomic density as well as the count density of the Te inclusions averaged over the diameter along the growth axis (data in Supplementary File 2). Figure 4a shows that the count density of the three samples is at the same level except at the starting position. In Figure 4b, the value of their atomic density varies from 2 × 10¹⁸ to 8 × 10¹⁸ atoms/cm3. The ingot F1-01 shows a rather different distribution with a considerably high Te atomic density at the beginning and at a position 19 mm from the boundary. The former is due to the fact that the heater position was slightly above the Te zone center, and thus, the seed was not dissolved. This resulted in the high accumulation of Te inclusions from the zone to the boundary. The latter enrichment of the inclusions at the position of 19 mm is considered to be the result of an unexpected power shutdown. The atomic density of the other two ingots is comparably stable. F1-03 demonstrates a slight increase at the ends of the ingots. Rudolph [29] also reported a similar increase in the axial distribution of Te inclusions, and he explained that this might have resulted from the increasing morphological instability rather than a segregation effect. This increase in Te inclusions captured at the growth interface reflects the enrichment of the melt with Te during growth [47]. Additionally, the atomic concentration of the ingot F1-03 was lower when compared to the other two ingots. The most likely explanation is that the experimental parameters for F1-03 provide the most suitable growth conditions for CZT growth by THM in this furnace.

3.3. Striation-Like Patterns

The aforementioned conspicuous striation-like patterns were observed in all of the three crystals. Figure 5 illustrates these patterns in F1-02. Similarly, in the seed region, the inclusions are distributed randomly, while in the grown crystal, they tend to form striations. The periodicity of these striations was observed to be from 150 to 750 μm, which was about 1–5 h of growth.
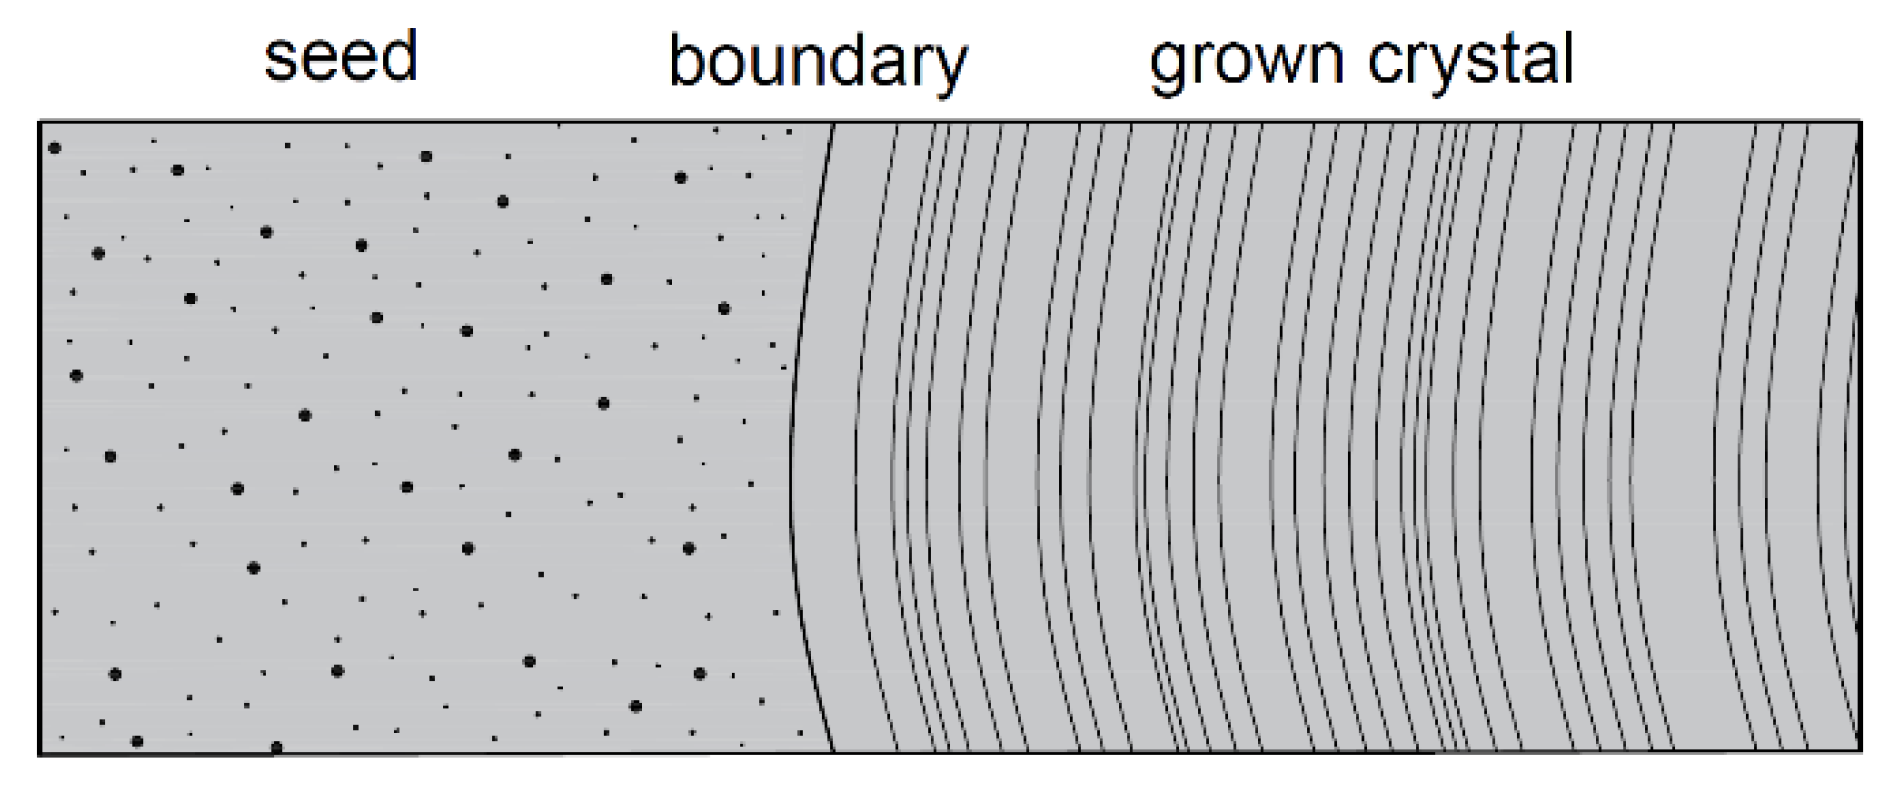
This phenomenon observed in all crystals in this work is sketched and represented in Figure 6. Bolke et al. [35] reported similar inclusion striations in CdTe with periodicity in the range of several centimeter. During the growth process, the excess Te is rejected and fails to diffuse away from the growth interface. Hence, the inclusions are formed by capturing melt-solution droplets from the diffusion layer and enveloped at the growth interface [48]. The distribution of Te inclusions is therefore correlated to the composition of the diffusion boundary layer adjacent to the growing interface. The shape of these striations in F1-02 reveals the concave shape of the growth interface, while the interface of F1-03 (in Section 3.1) is flatter. In addition, these striations contribute to revealing the effects of experimental parameters on the compositional fluctuation of the growth interface. Variations of the inclusion distribution would influence the uniformity of charge transport. More uniform distributed inclusions would be beneficial for the application as a radiation detector. Consequently, in order to enhance inclusion uniformity and to reduce inclusion density, it is of great importance to investigate and understand with which specific parameters these patterns are correlated.
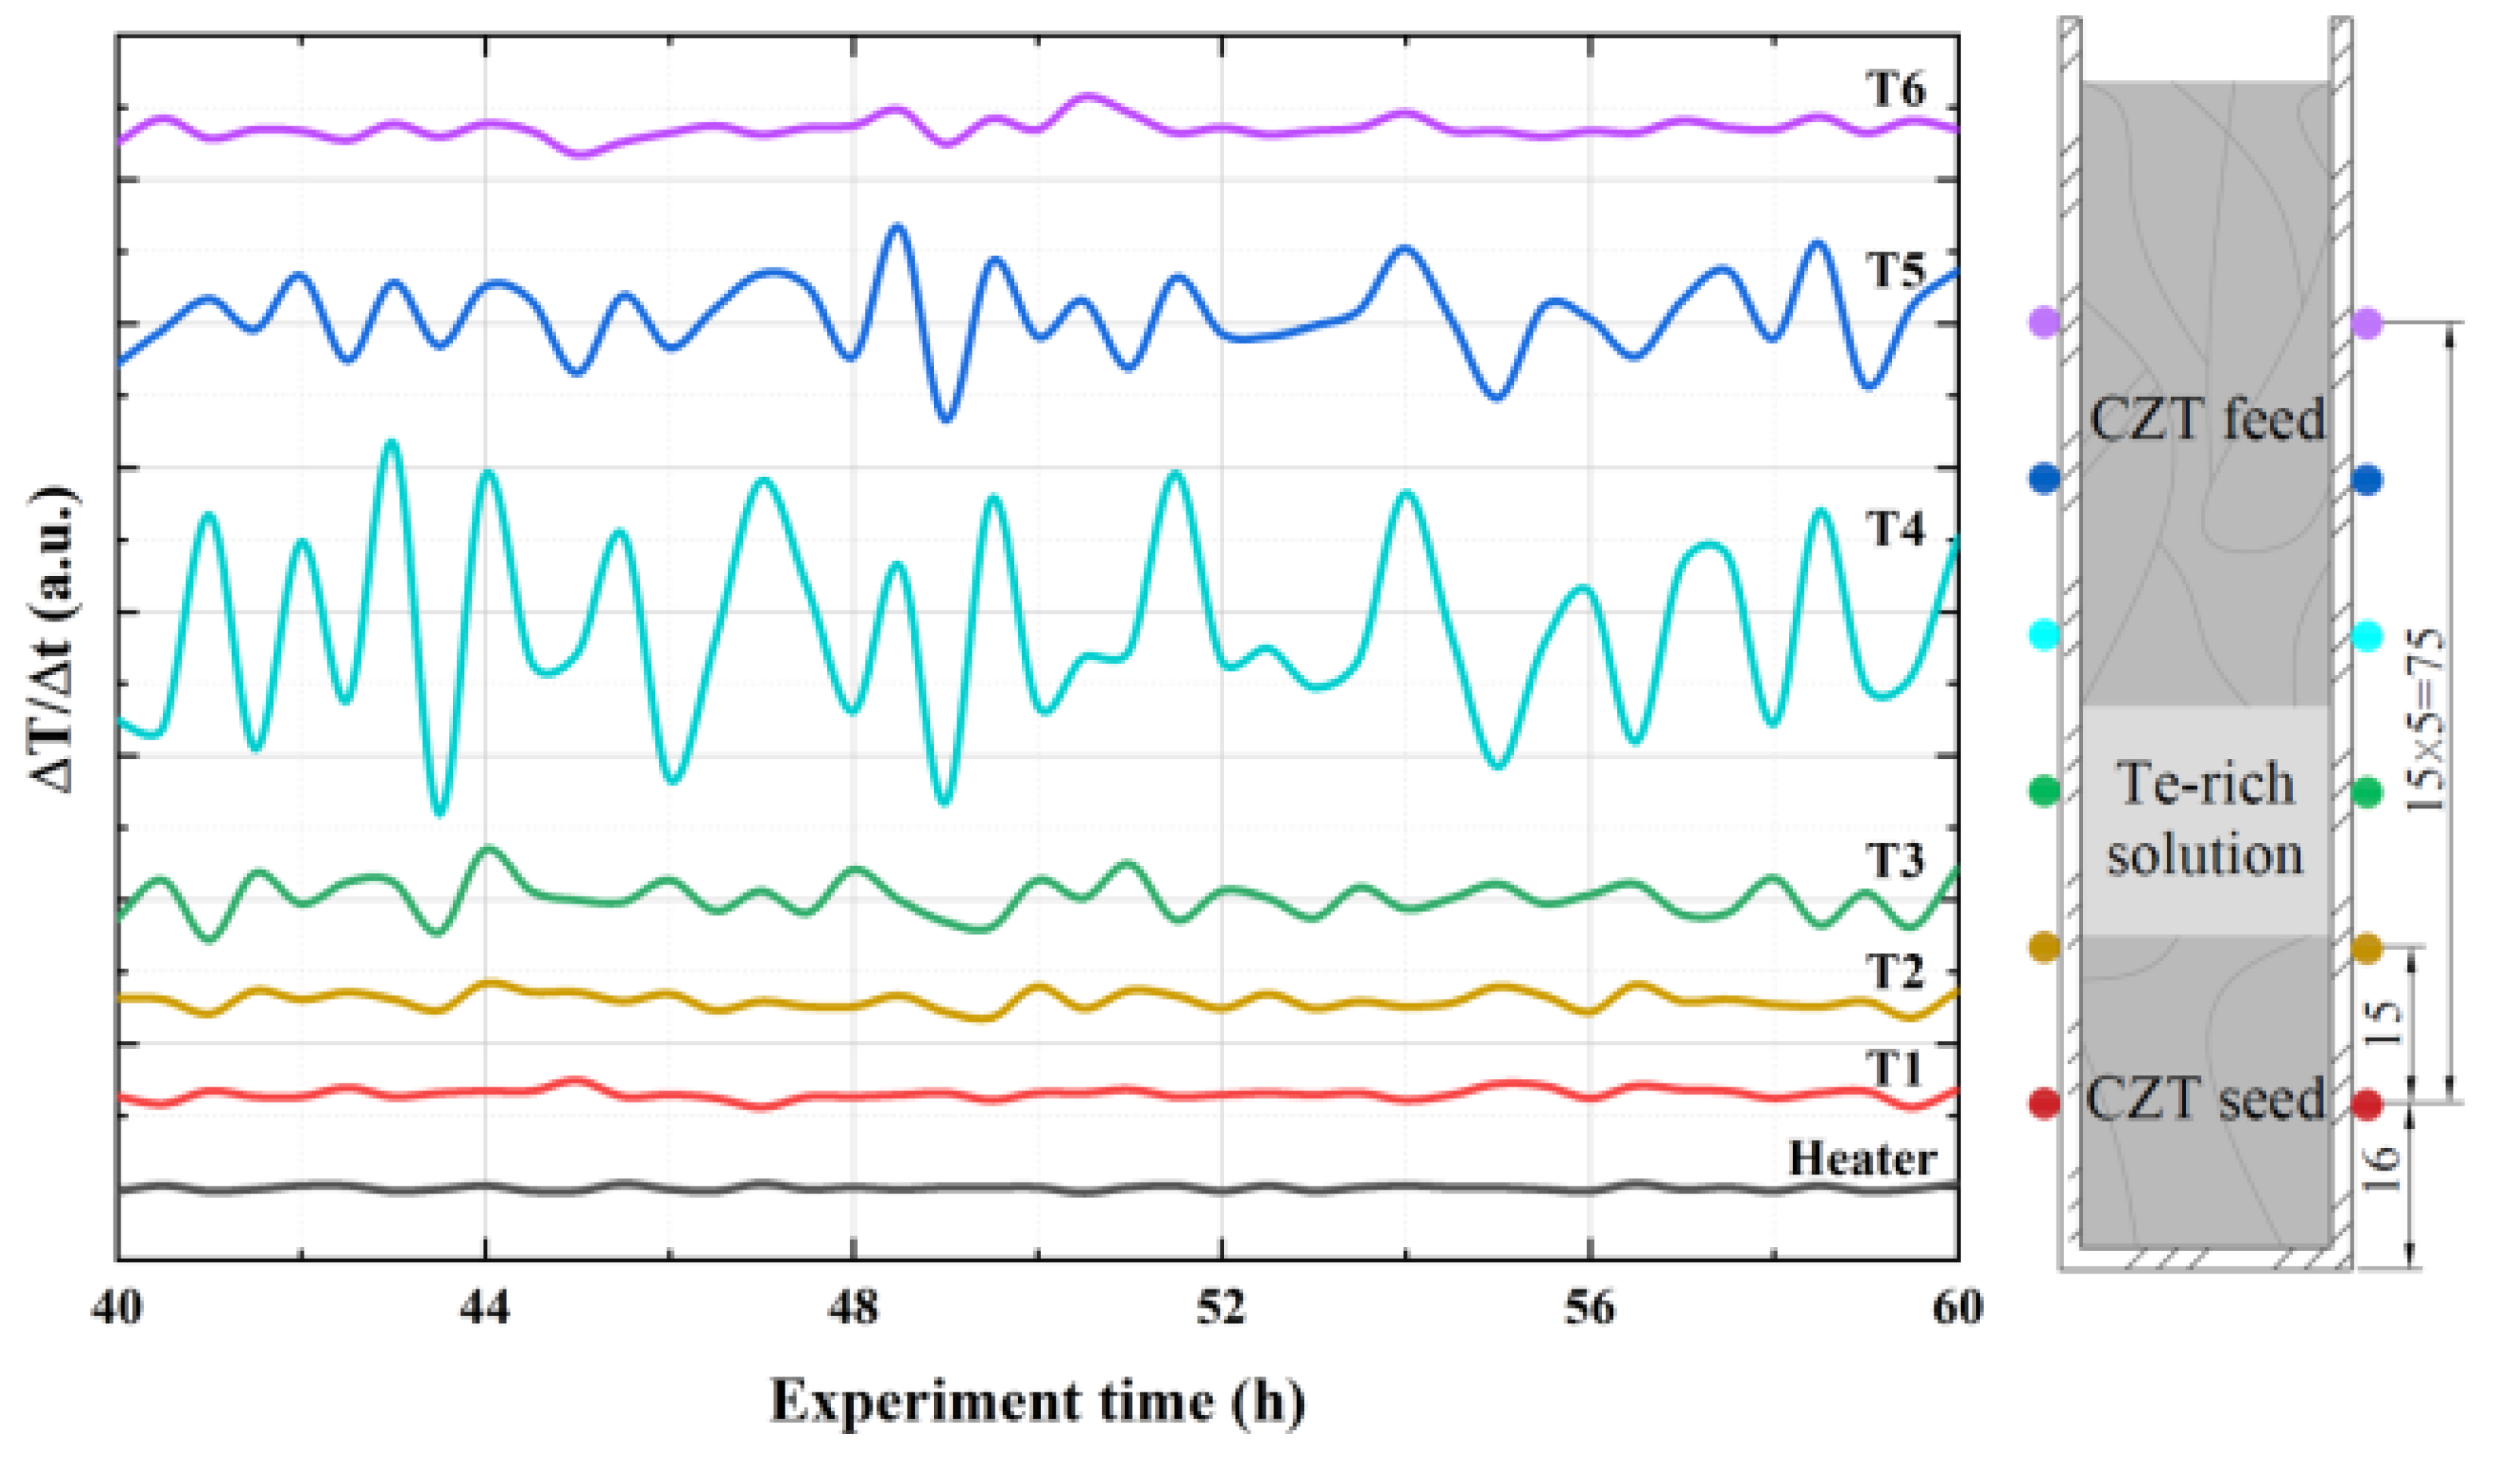
The inclusion striations could most likely result from forced vibration such as the rotating magnetic field or temperature variations. Because the rotating magnetic field was applied for only two crystals, but all three crystals manifested these inclusion striations, it is not responsible for this distribution. Indeed, periodic temperature variations were observed in all three experiments in this work and, hence, are possibly correlated to the striation formation. Figure 7 (data in Supplementary File 3) demonstrates that the temporal change in ampoule temperature in F1-02 (marked as T1 to T6), which was recorded by the thermocouples every 30 min at different positions, undulated to varying degrees. The value ranged from 0.1 to 8 °C/min at different positions of the ampoules. The temporal change in the heater temperature ∆T/∆t showed slight fluctuations, while a high degree of fluctuation was observed in that in the ampoule temperature, especially in ∆T4/∆t and ∆T5/∆t, where T3, T4 and T5 had a higher temperature during this specific experiment. The temporal change in the ampoule temperature could be due to ambient conditions.
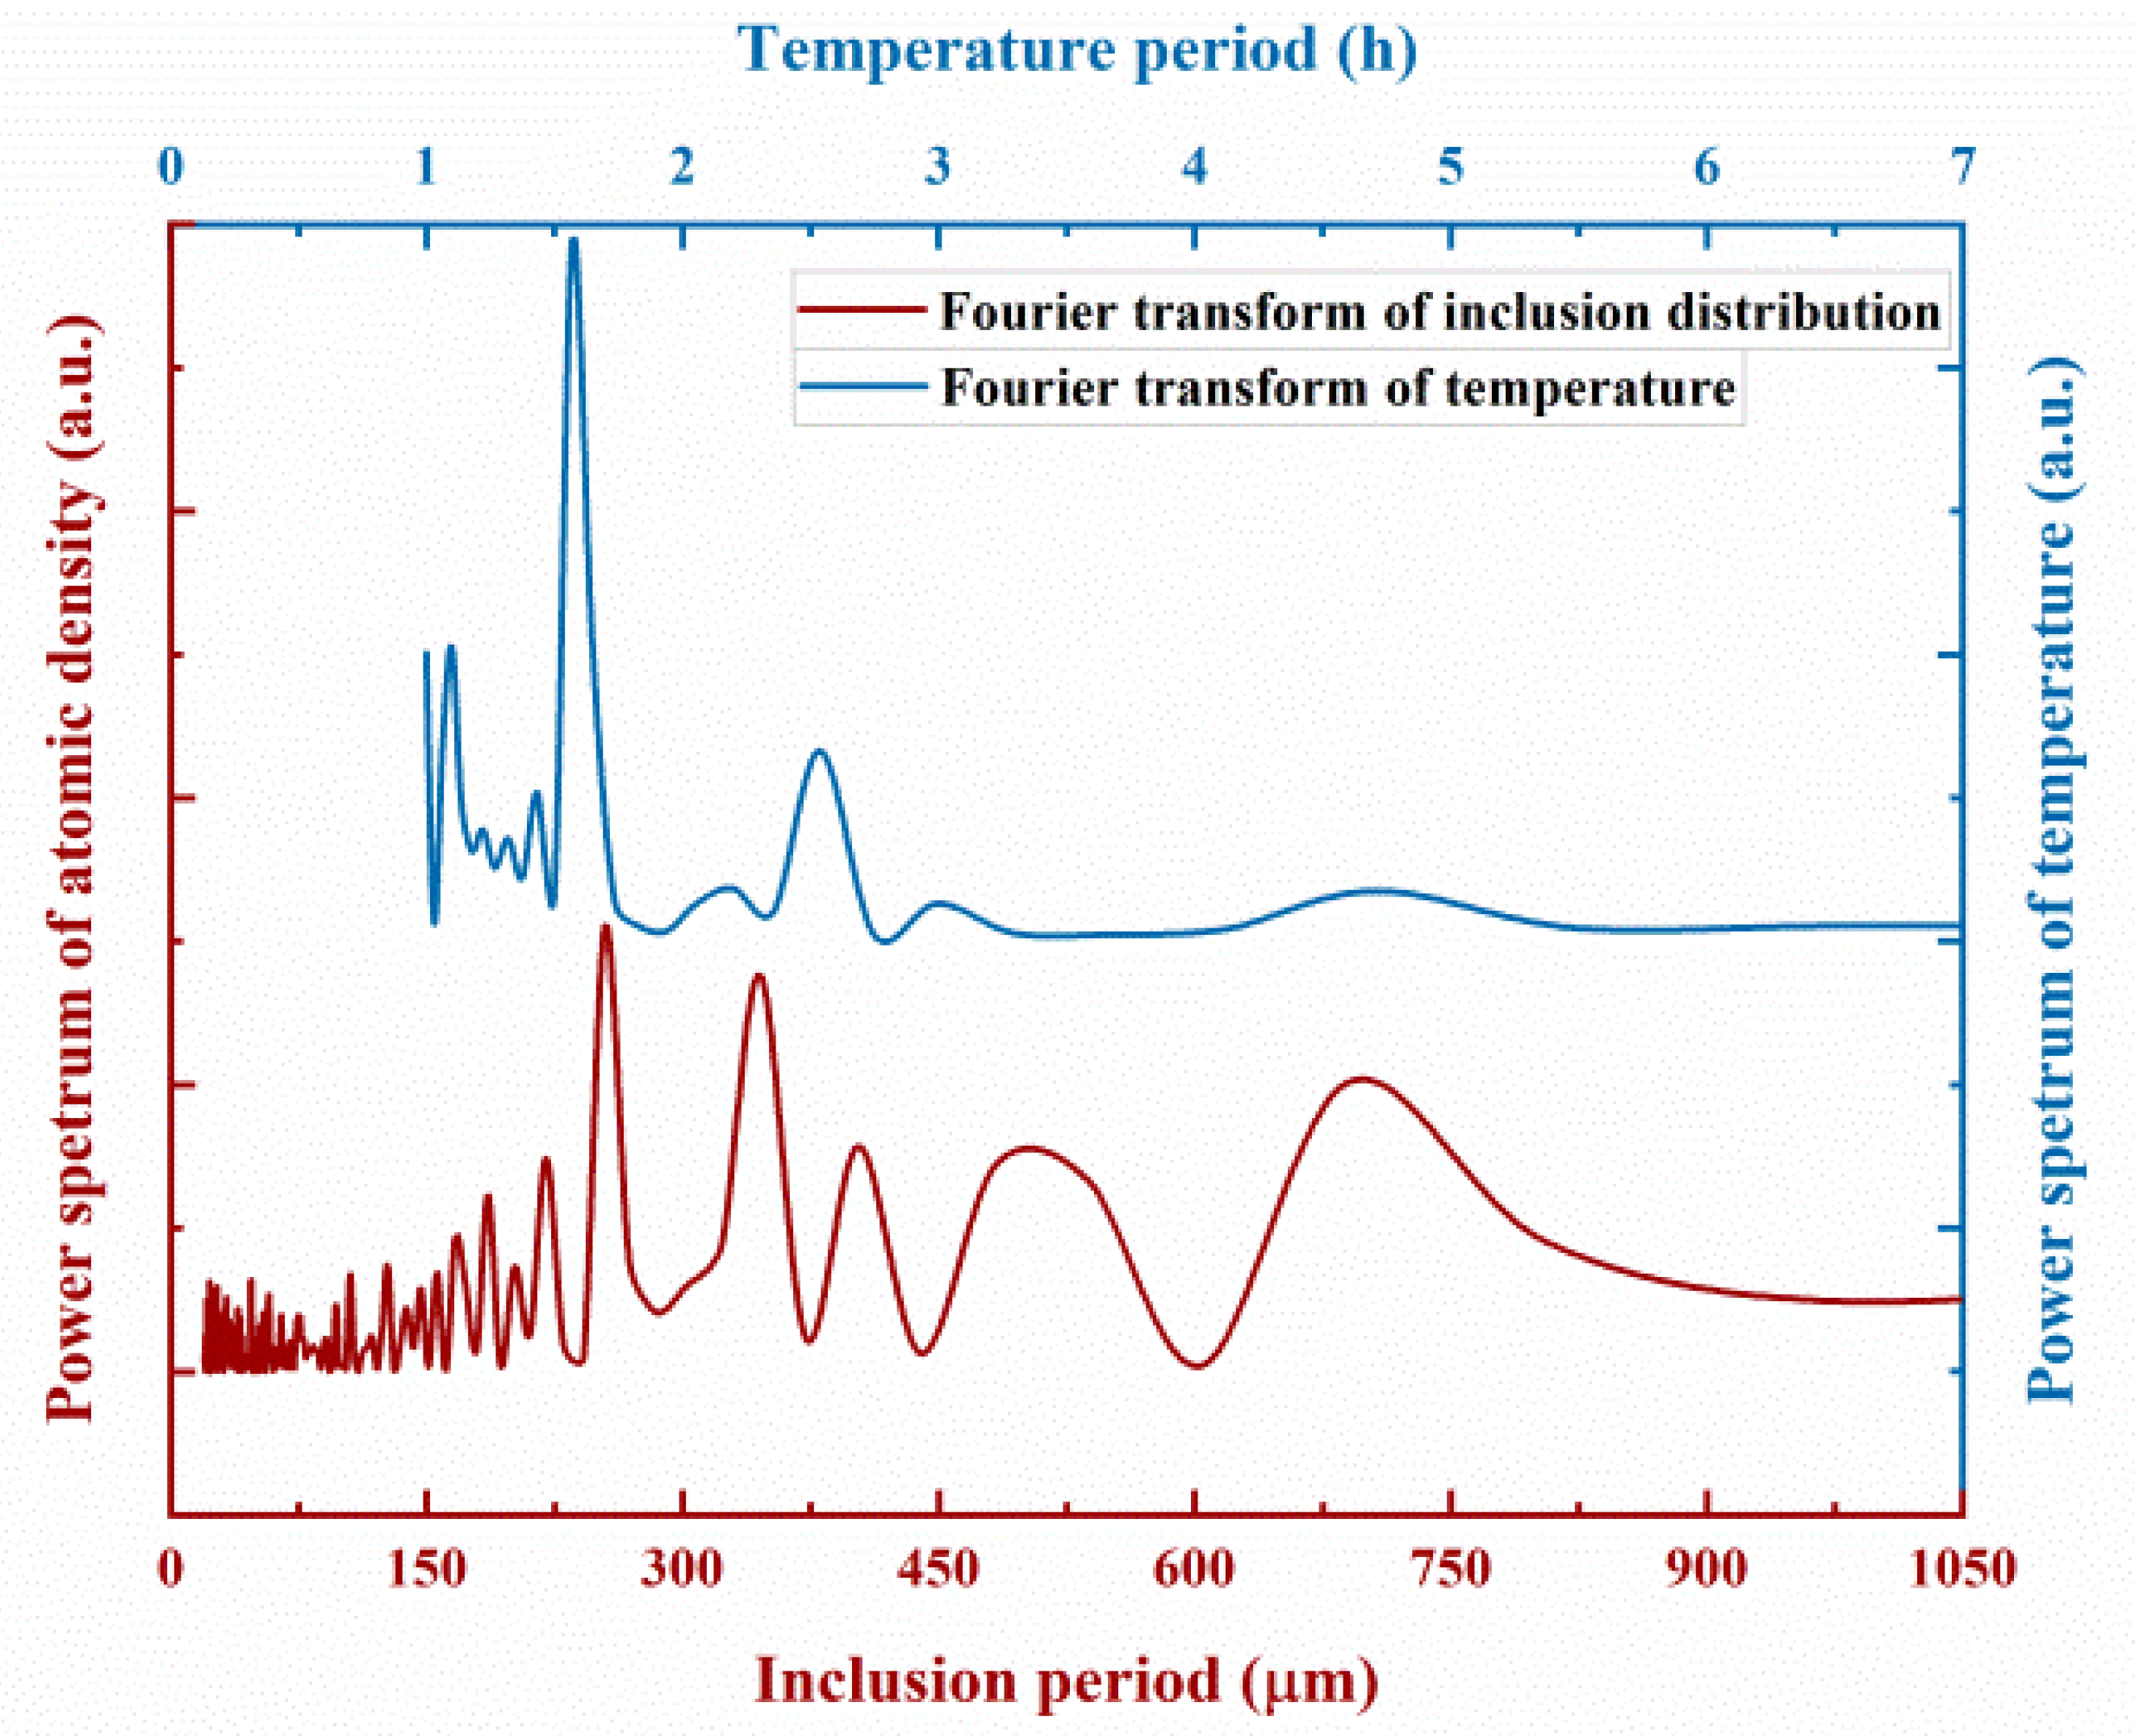
In order to study the relationship between the temperature variations and the inclusion striations in the growth direction, their period (1/frequency) was computed by Fourier transform and the results are shown in Figure 8 (data in Supplementary File 4). This analysis was carried out by first collecting data of the inclusions with the same axial (x) position range (at every μm) along the growth direction in a specific area and the corresponding ampoule temperature during this period of growth. Following that, we applied Fourier transform to analyze the frequency, period and power spectrum of the inclusion distribution and the temporal change in the ampoule temperature. These two curves are plotted in Figure 8 with the assumption that the growth rate is equal to the translation rate of 0.15 mm/h. It should be noted that during actual growth, due to the heat loss through the changes in seed and feed lengths as growth continues, the local growth rate is usually not the same as the translation speed. In addition, the concave shape of the inclusion striations indicates that the x positions of the inclusions in a stripe would vary, even though we chose an area with a flatter distribution for investigation. Despite the aforementioned limitations, we found that these two curves coincide with each other. The most prevalent period of the temperature variations was 1.57 h, which matches well with the most salient period for inclusion distribution of 254 μm. This leads to a small difference of 19 μm. This suggests that the inclusion striation-like patterns are caused by the periodic temperature variations during growth.
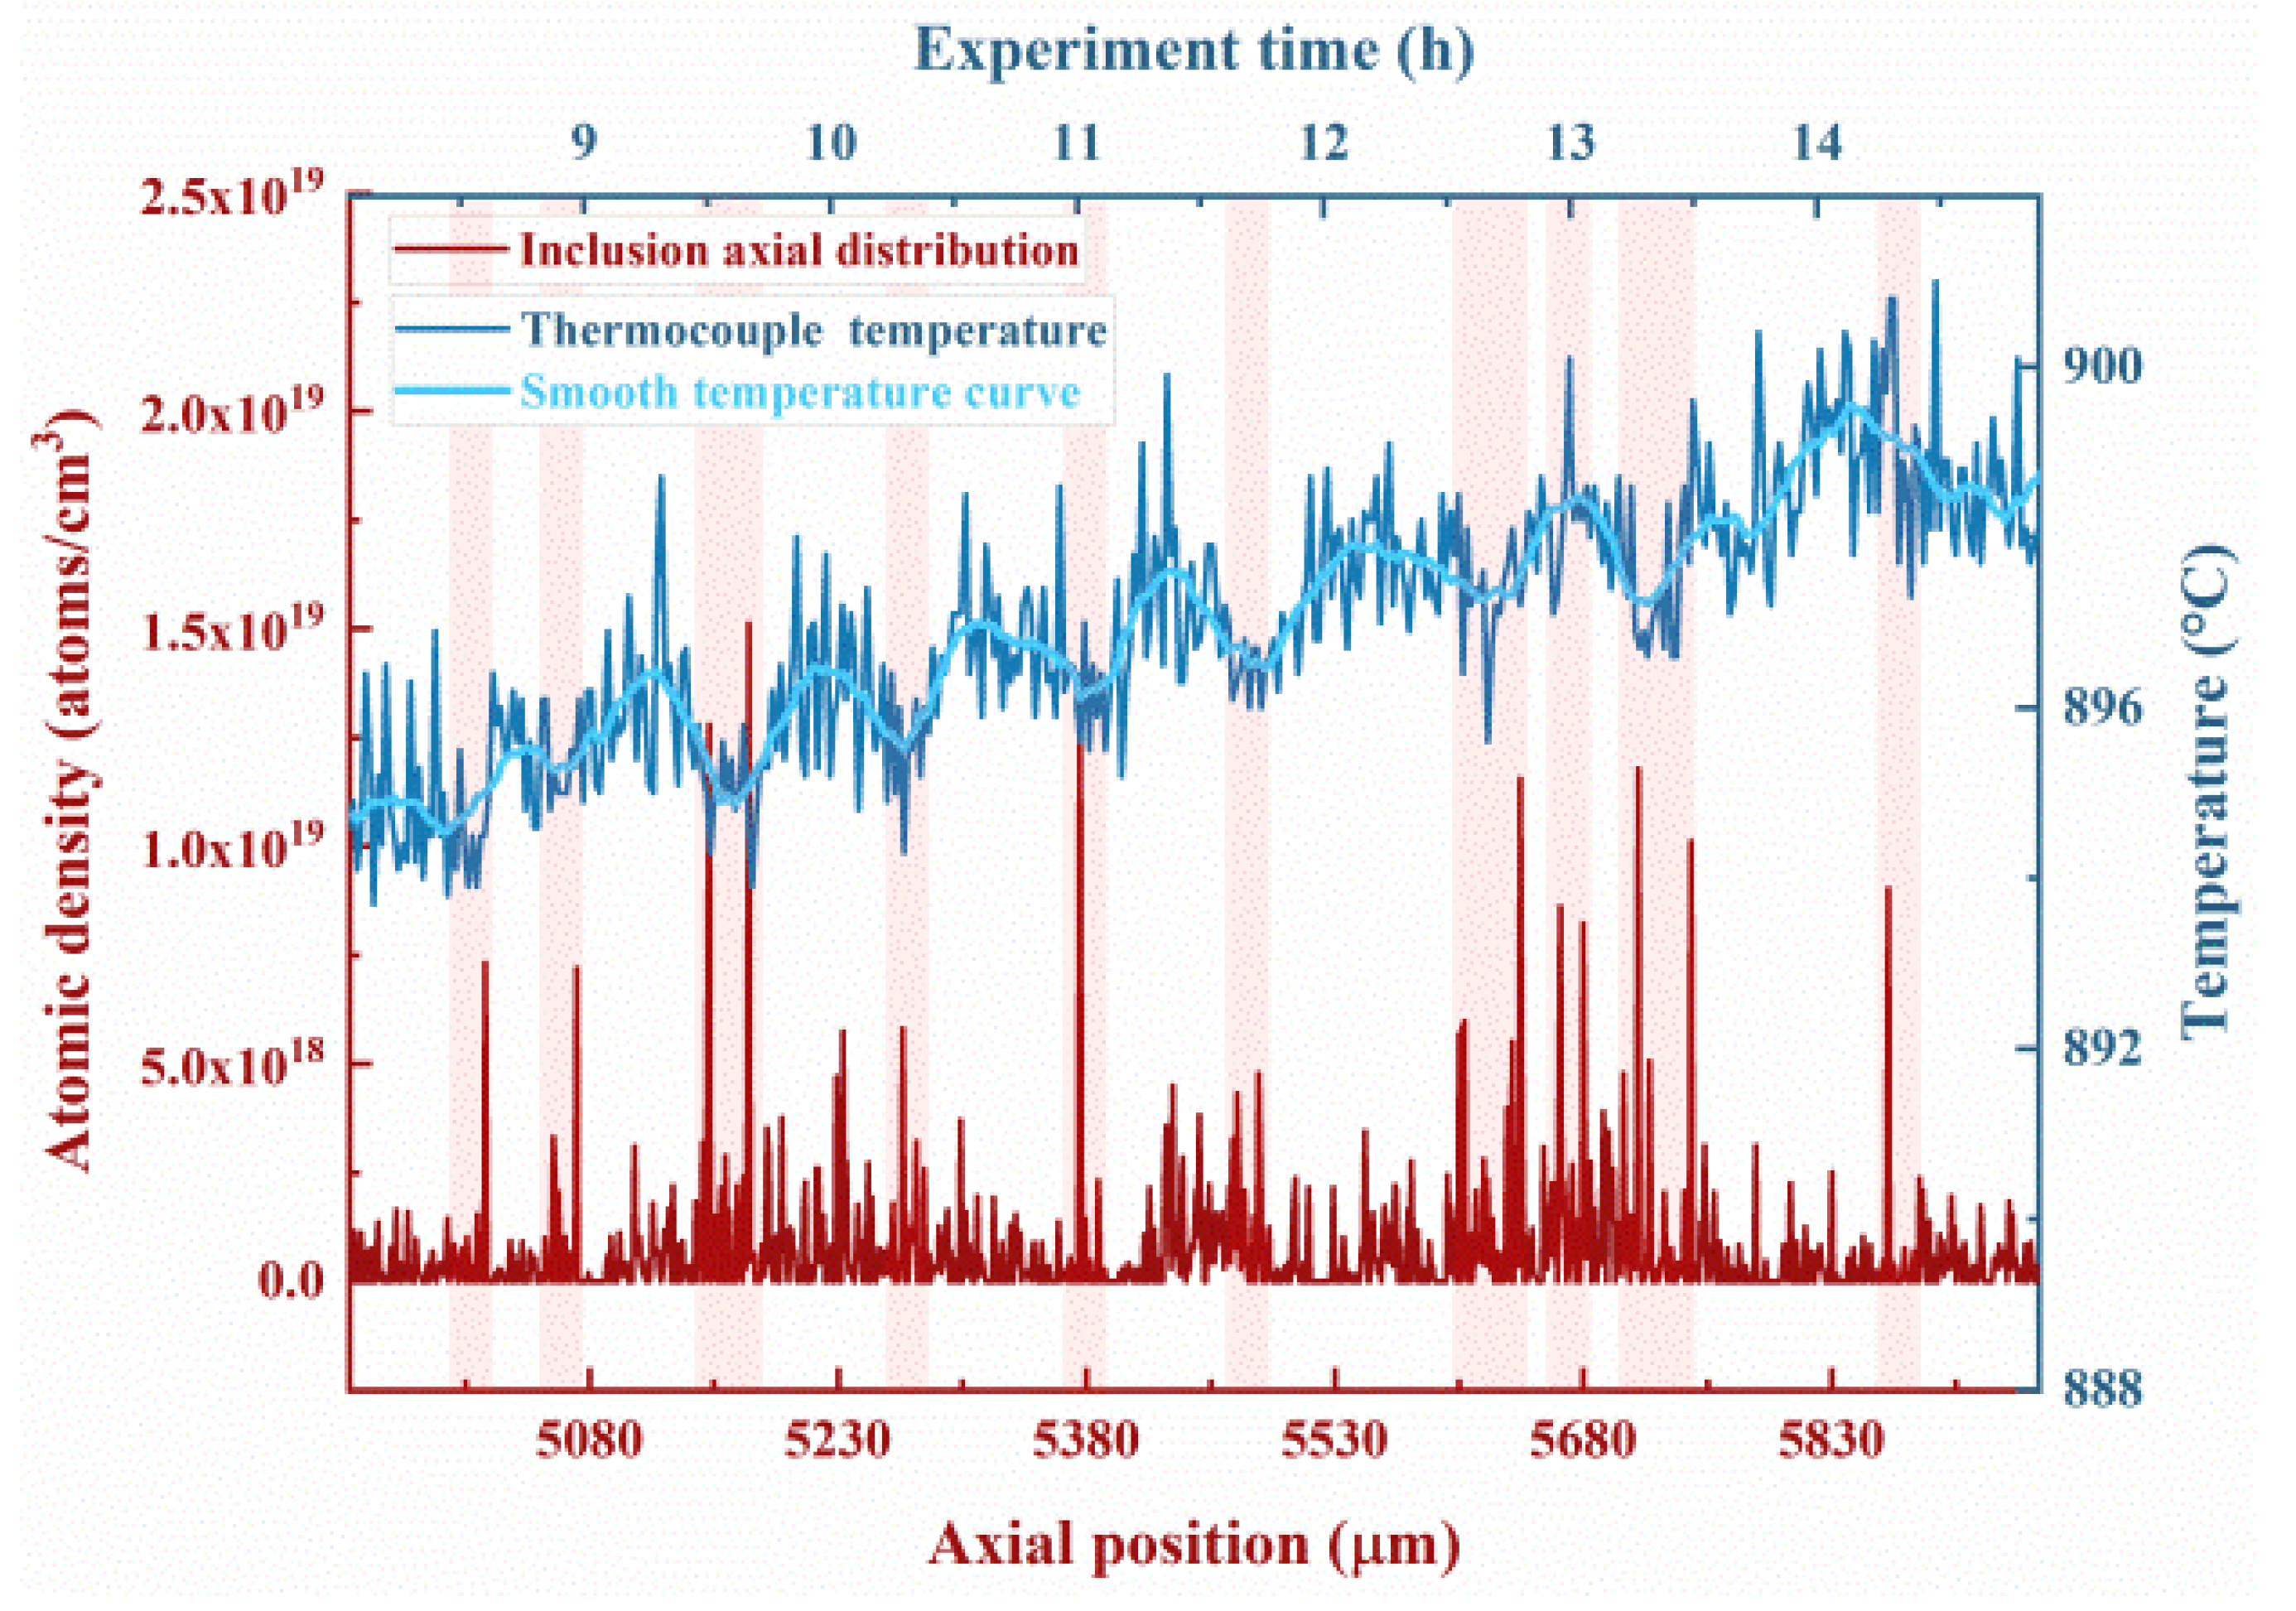
It should be emphasized that it is not the entirety of the temperature fluctuations that contribute to the inclusion “striation”-like patterns, but rather the low-frequency periodic components of the temperature variations. As shown in Figure 9 (data in Supplementary File 5), it is clear that the temperature in experiment F1-03, which was recorded every minute, actually fluctuated even more frequently, in several minutes instead of hours. However, the temperature manifested a periodic change, as shown in the smooth curve. High densities of Te inclusions tend to accumulate as the temperature changes periodically, as indicated with the pale red color. Therefore, we can conclude that the axial distribution of Te inclusions in this crystal tends to synchronize with the corresponding periodic temperature variations. The periodic temperature variations, in turn, lead to the fluctuations in the instantaneous growth rate. Chernov and Temkin [49] studied the capture of inclusions in crystal growth in detail. In their capture theory, the particles or droplets of a secondary phase will be captured by the solid/melt interface when the growth rate V is above a critical growth rate Vc. Conversely, the particles will be repelled and pushed ahead by the interface if Vc is not reached. According to this theory, the fluctuations in the growth rate will cause variations in the distribution and size of the formed inclusions.

4. Conclusions

In this work, three CZT crystals were grown using THM from ground experiments, and the size and distribution of the Te inclusions were investigated using IR microscopy. The axial distribution of the Te inclusions was also studied. The grown crystal showed a higher concentration of inclusions, but the size of the inclusions was smaller compared to that of the seed crystal, which was grown using the Bridgman method. In addition, the inclusions were distributed randomly in the seed, while striation-like patterns along the growth direction with a periodicity of 150–750 μm were observed in all of the grown crystals. The shape of these striations revealed the concave shape of the growth interface. It was also found that the axial distribution of Te inclusions tends to synchronize with temperature variations. The authors would like to emphasize the finding that instead of all temperature fluctuations, it is the low-frequency periodic temperature variations that are more likely to contribute to the inclusions.

Supplementary Materials

The following are available online at https://www.mdpi.com/article/10.3390/cryst11060649/s1, File 1: Inclusion information in the seed and the grown crystal region, File 2: Axial distribution of inclusions (count density and atomic density); File 3: Temporal change of temperature, File 4: FFT data and File 5: Axial distribution of inclusions and temperature curve.

Author Contributions

Conceptualization, M.F. and A.S.S.; methodology, J.Z., A.F. and A.S.S.; software, A.S.S.; validation, A.F., A.S.S. and M.F.; formal analysis, J.Z.; investigation, J.Z.; resources, M.F. and A.S.S.; data curation, J.Z.; writing—original draft preparation, J.Z.; writing—review and editing, A.F., A.S.S., N.N.K. and M.F.; visualization, J.Z., A.S.S. and M.F.; supervision, M.F.; project administration, M.F.; funding acquisition, M.F. All authors have read and agreed to the published version of the manuscript.

Funding

This research was supported and funded by the German Aerospace Center (DLR) under Nr. 2100117701.

Data Availability Statement

The data presented in this study are available in the supplementary materials.

Acknowledgments

The authors would like to thank Manfred Kranz-Probst from the Crystallography Institute of Freiburg for the preparation of the ampoules. We thank Yun Wang from University of Freiburg and three reviewers for helpful comments on the manuscript.

Conflicts of Interest

The authors declare no conflict of interest.

References

  1. Roy, U.N.; Camarda, G.S.; Cui, Y.; Gul, R.; Hossain, A.; Yang, G.; Zazvorka, J.; Dedic, V.; Franc, J.; James, R.B. Role of Selenium Addition to CdZnTe Matrix for Room-Temperature Radiation Detector Applications. Sci. Rep. 2019, 9, 1620. [Google Scholar] [CrossRef] [Green Version]
  2. Zhou, B.; Jie, W.; Wang, T.; Yin, L.; Yang, F.; Zhang, B.; Xi, S.; Dong, J. Modification of Growth Interface of CdZnTe Crystals in THM Process by ACRT. J. Cryst. Growth 2018, 483, 281–284. [Google Scholar] [CrossRef]
  3. Roy, U.N.; Burger, A.; James, R.B. Growth of CdZnTe Crystals by the Traveling Heater Method. J. Cryst. Growth 2013, 379, 57–62. [Google Scholar] [CrossRef]
  4. Chen, H.; Awadalla, S.A.; Iniewski, K.; Lu, P.H.; Harris, F.; Mackenzie, J.; Hasanen, T.; Chen, W.; Redden, R.; Bindley, G.; et al. Characterization of Large Cadmium Zinc Telluride Crystals Grown by Traveling Heater Method. J. Appl. Phys. 2008, 103, 014903. [Google Scholar] [CrossRef] [Green Version]
  5. Shiraki, H.; Funaki, M.; Ando, Y.; Tachibana, A.; Kominami, S.; Ohno, R. THM Growth and Characterization of 100 mm Diameter CdTe Single Crystals. IEEE Trans. Nucl. Sci. 2009, 56, 1717–1723. [Google Scholar] [CrossRef]
  6. Wald, F.V.; Bell, R.O. Natural and Forced Convection during Solution Growth of CdTe by the Traveling Heater Method (THM). J. Cryst. Growth 1975, 30, 29–36. [Google Scholar] [CrossRef]
  7. Schwenkenbecher, K.; Rudolph, P. Investigation of Convection in the Solution Zone at the Growth of CdTe by THM. Cryst. Res. Technol. 1985, 20, 1609–1613. [Google Scholar] [CrossRef]
  8. Cherepanova, T.A. Influence of Gravitation on the Processes of Heat and Mass Transfer in Solution Crystal Growth by the Travelling Heater Method (THM) (I). Cryst. Res. Technol. 1982, 17, 735–741. [Google Scholar] [CrossRef]
  9. Wang, Y.; Kudo, K.; Inatomi, Y.; Ji, R.; Motegi, T. Growth Interface of CdZnTe Grown from Te Solution with THM Technique under Static Magnetic Field. J. Cryst. Growth 2005, 284, 406–411. [Google Scholar] [CrossRef]
  10. Kumar, V.; Dost, S.; Durst, F. Numerical Modeling of Crystal Growth under Strong Magnetic Fields: An Application to the Travelling Heater Method. Appl. Math. Model. 2007, 31, 589–605. [Google Scholar] [CrossRef]
  11. Li, Z.; Peterson, J.H.; Yeckel, A.; Derby, J.J. Analysis of the Effects of a Rotating Magnetic Field on the Growth of Cadmium Zinc Telluride by the Traveling Heater Method under Microgravity Conditions. J. Cryst. Growth 2016, 452, 17–21. [Google Scholar] [CrossRef] [Green Version]
  12. Ghaddar, C.K.; Lee, C.K.; Motakef, S.; Gillies, D.C. Numerical Simulation of THM Growth of CdTe in Presence of Rotating Magnetic Fields (RMF). J. Cryst. Growth 1999, 205, 97–111. [Google Scholar] [CrossRef]
  13. Salk, M.; Fiederle, M.; Benz, K.W.; Senchenkov, A.S.; Egorov, A.V.; Matioukhin, D.G. CdTe and CdTe0.9Se0.1 Crystals Grown by the Travelling Heater Method Using a Rotating Magnetic Field. J. Cryst. Growth 1994, 138, 161–167. [Google Scholar] [CrossRef]
  14. Stelian, C.; Duffar, T. Influence of Rotating Magnetic Fields on THM Growth of CdZnTe Crystals under Microgravity and Ground Conditions. J. Cryst. Growth 2015, 429, 19–26. [Google Scholar] [CrossRef]
  15. Divecha, M.S.; Derby, J.J. Analysis of the Accelerated Crucible Rotation Technique Applied to the Gradient Freeze Growth of Cadmium Zinc Telluride. J. Cryst. Growth 2017, 468, 630–634. [Google Scholar] [CrossRef]
  16. Swain, S.; McCoy, J.; Lynn, K. Influence of Accelerated Crucible Rotation on Defect Distribution and Detector Characteristics of Melt Grown CdZnTe (Conference Presentation). In Proceedings of the Hard X-Ray, Gamma-Ray, and Neutron Detector Physics XVIII, San Diego, CA, USA, 29–31 August 2016; Volume 9968, p. 996806. [Google Scholar]
  17. Liu, J. Optimization of Control Parameters of CdZnTe ACRT-Bridgman Single Crystal Growth. Sci. China Ser. E Technol. Sci. 2004, 47, 725–740. [Google Scholar] [CrossRef]
  18. Capper, P.; Harris, J.E.; O’Keefe, E.; Jones, C.L.; Ard, C.K.; Mackett, P.; Dutton, D. Bridgman Growth and Assessment of CdTe and CdZnTe Using the Accelerated Crucible Rotation Technique. Mater. Sci. Eng. B 1993, 16, 29–39. [Google Scholar] [CrossRef]
  19. Benz, K.-W.; Fiederle, M. (Eds.) Chapter IC—Crystal growth of CdTe/CdZnTe in microgravity. In CdTe and Related Compounds; Physics, Defects, Hetero- and Nano-Structures, Crystal Growth, Surfaces and Applications; European Materials Research Society Series; Elsevier: Amsterdam, The Netherlands, 2010; pp. 1–144. ISBN 978-0-08-096513-0. [Google Scholar]
  20. Benz, K.W.; Dold, P. Crystal Growth under Microgravity: Present Results and Future Prospects towards the International Space Station. J. Cryst. Growth 2002, 237–239, 1638–1645. [Google Scholar] [CrossRef]
  21. Griffin, P.; Motakef, S. Influence of Non Steady Gravity on Natural Convection during Micro-Gravity Solidification of Semiconductors. I—Time Scale Analysis. II—Implications for Crystal Growth Experiments. Appl. Micrograv. Technol. 1989, 2. [Google Scholar]
  22. Littke, W.; John, C. Materials: Protein Single Crystal Growth Under Microgravity. Science 1984, 225, 203–204. [Google Scholar] [CrossRef]
  23. McPherson, A.; Greenwood, A.; Day, J. The Effect of Microgravity on Protein Crystal Growth. Adv. Space Res. 1991, 11, 343–356. [Google Scholar] [CrossRef]
  24. Su, C.-H.; George, M.A.; Palosz, W.; Feth, S.; Lehoczky, S.L. Contactless Growth of ZnSe Single Crystals by Physical Vapor Transport. J. Cryst. Growth 2000, 213, 267–275. [Google Scholar] [CrossRef] [Green Version]
  25. Kundrot, C.E.; Judge, R.A.; Pusey, M.L.; Snell, E.H. Microgravity and Macromolecular Crystallography. Cryst. Growth Des. 2001, 1, 87–99. [Google Scholar] [CrossRef]
  26. Duffar, T.; Paret-Harter, I.; Dusserre, P. Crucible De-Wetting during Bridgman Growth of Semiconductors in Microgravity. J. Cryst. Growth 1990, 100, 171–184. [Google Scholar] [CrossRef]
  27. Peterson, J.H.; Fiederle, M.; Derby, J.J. Analysis of the Traveling Heater Method for the Growth of Cadmium Telluride. J. Cryst. Growth 2016, 454, 45–58. [Google Scholar] [CrossRef] [Green Version]
  28. Fiederle, M.; Eiche, C.; Joerger, W.; Salk, M.; Senchenkov, A.S.; Egorov, A.V.; Ebling, D.G.; Benz, K.W. Radiation Detector Properties of CdTe0.9Se0.1:Cl Crystals Grown under Microgravity in a Rotating Magnetic Field. J. Cryst. Growth 1996, 166, 256–260. [Google Scholar] [CrossRef]
  29. Borisenko, E.B.; Kolesnikov, N.N.; Senchenkov, A.S.; Fiederle, M. Crystal Growth of Cd1−xZnxTe by the Traveling Heater Method in Microgravity on Board of Foton-M4 Spacecraft. J. Cryst. Growth 2017, 457, 262–264. [Google Scholar] [CrossRef]
  30. Eiche, C.; Joerger, W.; Fiederle, M.; Ebling, D.; Salk, M.; Schwarz, R.; Benz, K.W. Characterization of CdTe:Cl Crystals Grown under Microgravity Conditions by Time Dependent Charge Measurements (TDCM). J. Cryst. Growth 1996, 166, 245–250. [Google Scholar] [CrossRef]
  31. Fiederle, M.; Duffar, T.; Babentsov, V.; Benz, K.W.; Dusserre, P.; Corregidor, V.; Dieguez, E.; Delaye, P.; Roosen, G.; Chevrier, V.; et al. Dewetted Growth of CdTe in Microgravity (STS-95). Cryst. Res. Technol. 2004, 39, 481–490. [Google Scholar] [CrossRef]
  32. Rudolph, P.; Engel, A.; Schentke, I.; Grochocki, A. Distribution and Genesis of Inclusions in CdTe and (Cd,Zn)Te Single Crystals Grown by the Bridgman Method and by the Travelling Heater Method. J. Cryst. Growth 1995, 147, 297–304. [Google Scholar] [CrossRef]
  33. Senchenkov, A.S.; Barmin, I.V.; Tomson, A.S.; Krapukhin, V.V. Seedless THM Growth of CdxHg1−xTe (X≈0.2) Single Crystals within Rotating Magnetic Field. J. Cryst. Growth 1999, 197, 552–556. [Google Scholar] [CrossRef]
  34. Senchenkov, A.S.; Fiederle, M.; Kolesnikov, N.N. CZT Crystal Growth by THM in Microgravity—Preparation of Experiments for FOTON-M4 Mission. In Proceedings of the IAC Proceedings 2014, IAC-14-A2.4.7, Toronto, ON, Canada, 29 September–3 October 2014. [Google Scholar]
  35. Bolke, J.; O’Brien, K.; Wall, P.; Spicer, M.; Gélinas, G.; Beaudry, J.-N.; Alexander, W.B. Measuring Te Inclusion Uniformity over Large Areas for CdTe/CZT Imaging and Spectrometry Sensors. In Proceedings of the Sensors, Systems, and Next-Generation Satellites XXI, Warsaw, Poland, 11–14 September 2017; Volume 10423, p. 104231M. [Google Scholar]
  36. Roy, U.N.; Weiler, S.; Stein, J. Growth and Interface Study of 2in Diameter CdZnTe by THM Technique. J. Cryst. Growth 2010, 312, 2840–2845. [Google Scholar] [CrossRef]
  37. Bolotnikov, A.E.; Babalola, S.; Camarda, G.S.; Cui, Y.; Egarievwe, S.U.; Hawrami, R.; Hossain, A.; Yang, G.; James, R.B. Te Inclusions in CZT Detectors: New Method for Correcting Their Adverse Effects. IEEE Trans. Nucl. Sci. 2010, 57, 910–919. [Google Scholar] [CrossRef] [Green Version]
  38. Carini, G.A.; Bolotnikov, A.E.; Camarda, G.S.; Cui, Y.; Jackson, H.; Burger, A.; Kohman, K.T.; Li, L.; James, R.B. Te Inclusions and Their Relationship to the Performance of CdZnTe Detectors. Hard X-ray and Garnma Ray Detect. Phys. VIII 2006, 6319, 631906. [Google Scholar] [CrossRef] [Green Version]
  39. Tilli, M. Chapter 4 —Silicon Wafers: Preparation and Properties. In Handbook of Silicon Based MEMS Materials and Technologies, 2nd ed.; Tilli, M., Motooka, T., Airaksinen, V.-M., Franssila, S., Paulasto-Kröckel, M., Lindroos, V., Eds.; Micro and Nano Technologies; William Andrew Publishing: Boston, MA, USA, 2015; pp. 86–103. ISBN 978-0-323-29965-7. [Google Scholar]
  40. Camp, P.R. Resistivity Striations in Germanium Crystals. J. Appl. Phys. 1954, 25, 459–463. [Google Scholar] [CrossRef]
  41. Merrell, J.L.; Gray, N.W.; Bolke, J.G.; Merrell, A.N.; Prax, A.G.; Demke, J.M.; Gossett, N.W. Enabling On-Axis InSb Crystal Growth for High-Volume Wafer Production: Characterizing and Eliminating Variation in Electrical Performance for IR Focal Plane Array Applications. In Proceedings of the Infrared Technology and Applications XLII, Baltimore, MD, USA, 18–21 April 2016; Volume 9819, p. 981915. [Google Scholar]
  42. Le Donne, A.; Binetti, S.; Folegatti, V.; Coletti, G. On the Nature of Striations in N-Type Silicon Solar Cells. Appl. Phys. Lett. 2016, 109, 033907. [Google Scholar] [CrossRef]
  43. Triboulet, R.; Siffert, P. (Eds.) Chapter I—Crystal Growth and Surfaces. In CdTe and Related Compounds; Physics, Defects, Hetero- and Nano-Structures, Crystal Growth, Surfaces and Applications; European Materials Research Society Series; Elsevier: Amsterdam, The Netherlands, 2010; pp. 1–144. ISBN 978-0-08-096513-0. [Google Scholar]
  44. Fiederle, M.; Fauler, A.; Zwerger, A. Crystal Growth and Characterization of Detector Grade (Cd,Zn)Te Crystals. IEEE Trans. Nucl. Sci. 2007, 54, 769–772. [Google Scholar] [CrossRef]
  45. Henager, C.H.; Alvine, K.J.; Bliss, M.; Riley, B.J.; Stave, J.A. The Influence of Constitutional Supercooling on the Distribution of Te-Particles in Melt-Grown CZT. J. Electron. Mater. 2015, 44, 4604–4621. [Google Scholar] [CrossRef]
  46. McCoy, J.J.; Kakkireni, S.; Gélinas, G.; Garaffa, J.F.; Swain, S.K.; Lynn, K.G. Effects of Excess Te on Flux Inclusion Formation in the Growth of Cadmium Zinc Telluride When Forced Melt Convection Is Applied. J. Cryst. Growth 2020, 535, 125542. [Google Scholar] [CrossRef]
  47. Rudolph, P. Fundamental Studies on Bridgman Growth of CdTe. Prog. Cryst. Growth Charact. Mater. 1994, 29, 275–381. [Google Scholar] [CrossRef]
  48. Rudolph, P. Non-Stoichiometry Related Defects at the Melt Growth of Semiconductor Compound Crystals—A Review. Cryst. Res. Technol. 2003, 38, 542–554. [Google Scholar] [CrossRef]
  49. Chernov, A.A.; Temkin, D.E. Capture of Inclusions in Crystal Growth. In Current Topics of Materials Science: Crystal Growth and Materials; Current Topics of Materials Science: Amsterdam, The Netherlands, 1977; Volume 2, pp. 3–77. [Google Scholar]
Figure 1. (a) The as-grown ingot of F1-03 grown using the THM technique and (b) a slice cut from the ingot with a thickness of about 3 mm.
Crystals 11 00649 g001
Figure 2. The inclusion distribution around the interface area. The boundary can be clearly seen and is decorated with some inclusions. The inclusions in the seed show lower density but larger size when compared to those of the grown crystal.
Crystals 11 00649 g002
Figure 3. Magnified 3D illustrations of the two regions: (a) seed and (b) the grown crystal. The inclusions randomly decorate the seed, while distinct striations are formed in the grown crystal. Histogram of the inclusion size distribution in the seed (c) and the grown crystal (d). Almost 7 times more inclusions are found in the grown crystal (from 339 to 2299). However, the average size of the inclusions is reduced to half (from 10.57 to 6.17 μm) of that in the seed.
Crystals 11 00649 g003aCrystals 11 00649 g003b
Figure 4. Axial distribution of the inclusions in three ingots: (a) count density distribution; (b) atomic density distribution.
Crystals 11 00649 g004
Figure 5. Randomly distributed inclusions in the seed and striation-like patterns in the grown crystal. The periodicity of these striations is about 150–750 μm.
Crystals 11 00649 g005
Figure 6. Schematic striation-like patterns of the Te inclusions in our grown crystals with a concave interface.
Crystals 11 00649 g006
Figure 7. Temporal changes in the temperature recorded by the thermocouples (T1 to T6) in F1-02. The data were collected every 30 min. The temporal change in the heater and ampoule temperature shows synchronized but varying degrees of fluctuations.
Crystals 11 00649 g007
Figure 8. Fourier transform results of the axial distribution of Te inclusions and the temporal change in the temperature.
Crystals 11 00649 g008
Figure 9. Correlation between the axial distribution of Te inclusions and the temperature (collected every minute). The inclusions tend to accumulate as the temperature changes periodically, instead of fluctuating. The delay between the two functions can be explained by the thermal conductivity of the material.
Crystals 11 00649 g009
Table 1. Experimental parameters of the three ground experiments.
Sample No.DopantCdTe % in ZoneHeater TemperatureRMFHeater Starting Position
F1-01In (5 ppm)5%1080–1100 °CNoZone center
F1-02In (5 ppm)5%1100–1110 °C2 mT, 100 HzZone center −2 mm
F1-03In (5 ppm)10%1110–1100–1110 °C2 mT, 100 HzZone center −5 mm
Publisher’s Note: MDPI stays neutral with regard to jurisdictional claims in published maps and institutional affiliations.