Abstract
Inexpensive strategies for efficient decontamination of hazardous chemicals are required. In this study, the effect of visible light (λ > 400 nm) on the decomposition of 2-chloroethyl ethyl sulfide (2-CEES, a sulfur mustard (HD) simulant) on Au/TiO2 photocatalyst under anaerobic and aerobic conditions has been investigated in situ by diffuse reflectance infrared Fourier –transformed spectroscopy (DRIFTS). Under anaerobic conditions, 2-CEES partially desorbs from the Au/TiO2 surface likely due to the photothermal effect, induced by photo-excited plasmonic Au nanoparticles. In the aerobic experiment, no visible light effect is observed. We attribute this behavior to 2-CEES consumption by hydrolysis to 2-ethylthio ethanol in the dark, prior to visible light excitation. Oxygen activates water molecules in the dark, resulting in accelerated 2-CEES hydrolysis.
1. Introduction
In this study, we investigate the effect of visible light on the activity of the Au/TiO2 photocatalyst toward the decomposition of a hazardous chemical 2-chloroethyl ethyl sulfide (CEES) under anaerobic and aerobic conditions. Utilizing the energy of sunlight and oxygen from air as an oxidizing agent for photooxidation of hazardous chemicals to innocuous reaction products would be the first step toward the realization of the concept of an environmentally sustainable process.
Au nanoparticles (NPs) exhibit a localized surface plasmon resonance (LSPR) in the visible region (ca. 520 nm), which can be utilized for driving photochemical reactions at the plasmonic nanoparticle/ semiconductor interface [1,2,3,4,5,6,7,8,9]. Much of the energy in the plasmon resonance is dissipated as heat, which also serves as a driving force of the photochemical reaction [10,11,12,13,14,15]. Plasmon-induced photocatalysis has been successfully demonstrated for photooxidation of organic and inorganic molecules, including thiols [16,17], alcohols [18,19,20,21], benzene [22,23], phenolic compounds [24], water [2], etc. Neatu et al. [4] reported complete photooxidation of sarin, sulfur mustard, and VX to innocuous products by Au/TiO2 photocatalyst under visible excitation. The reaction was carried out in an open, naturally aerated reactor. Although the necessity of molecular oxygen for the successful realization of oxidation reactions is intuitively clear, the role of molecular oxygen can vary in heterogeneous catalysis. For instance, analysis of oxidation of small molecules at the Au/TiO2 catalyst revealed that O2 activation at the interface plays a key role in the enhancement of the reaction rate [25,26,27]. The mechanisms of oxygen activation may include the generation of active species, such as O2− [28], or activation of water molecules [29].
In our previous paper [30], 50 nm Au nanoparticles supported on P25 TiO2 were successfully used to promote TiO2 activity toward photoelectrochemical methanol oxidation under visible light excitation. The incident photon-to-electron conversion efficiency for CH3OH photooxidation was found to be correlated to Au LSPR, which suggested the presence of an effect of high energetic (hot) electrons generated during Au plasmon decay on the CH3OH photocurrent.
Herein, we use the same Au/TiO2 photocatalyst to promote 2-CEES photooxidation under visible excitation at the photocatalyst/gas interface. To elucidate the effect of oxygen on the reaction mechanism, we compare 2-CEES reactivity in anaerobic (under He purge) and aerobic conditions. In situ DRIFTS is utilized to follow the dynamics of 2-CEES interaction with Au/TiO2 photocatalyst under visible light excitation. Prior to visible light excitation, we probe 2-CEES reactivity in the dark. In agreement with our previous report [31], we find that 2-CEES undergoes hydrolysis to 2-ethylthio ethanol in the dark, prior to visible light excitation both in anaerobic and aerobic conditions. However, in the aerobic experiment, oxygen activates water molecules and accelerates hydrolysis in the dark. Visible light excitation in an inert environment causes 2-CEES to desorb partially from the Au/TiO2 surface likely due to the photothermal effect induced by photo-excited plasmonic Au nanoparticles.
2. Materials and Methods
P25 TiO2 was purchased from Sigma Aldrich (Aeroxide® P25, 21 nm primary particle size, 80% anatase/20% rutile, ~50 m2/g surface area; #718467). Then, 1 wt% Au/TiO2 powder was synthesized in house, as described in our previous publication [30]. Briefly, 5 mL of 50 nm citrate-capped Au nanoparticles (HQ-Nano) were added to a 517 mg of a pre-sonicated suspension of TiO2 in 40 mL of H2O-ethanol (50:50 v/v) mixture. After agitation of the mixture in the ultrasonic bath overnight, two drops of concentrated HNO3 were added to detach the citrate and allow the solids to flocculate and settle out. Next, the Au/TiO2 deposit was separated by centrifugation and dried in a vacuum oven at 40 °C overnight. To ensure that the surface composition of the TiO2 that was used as a reference in this study is identical to that of TiO2 in Au-TiO2 composite, it was pretreated in H2O-ethanol (50:50 v/v) mixture in the same manner as Au/TiO2.
UV–Vis spectroscopy. Visible light spectra of Au/TiO2 powder were collected at room temperature in diffuse reflectance mode using an integrated sphere accessory of a PerkinElmer UV/VIS/NIR λ 1050 spectrometer. The powder was diluted to 3 wt% with KBr and sandwiched between two UV–Visible transparent quartz slides prior to mounting to the integrated sphere. BaSO4 was used as s standard for total reflection.
Transmission electron microscopy (TEM). Samples for TEM imaging were prepared by drop-casting a suspension of Au/TiO2 powder in isopropanol onto a lacey carbon-film- coated-copper mesh TEM grid. The TEM (model JEOL JEM2200FS) was operated at 200 kV.
Electromagnetic modeling. For the dielectric function of the 50 nm Au NPs, we employed the experimental data presented in Ref. [32]. Regarding the TiO2+KBr matrix, it has a composite structure. The Au NPs are surrounded by TiO2 NPs, and these aggregates are diluted with KBr. Since the matrix is granular, there are essential voids between the granules filled with air. Therefore, considering its optical properties, the matrix should be regarded as a mixture of three materials: TiO2, KBr, and air. The refractive indices of the above materials are nTiO2 = 2.4, nKBr = 1.56, and nair = 1. Mathematically, such a composite can be described as a medium with an effective refractive index neff. This parameter should be found empirically from the position of the experimental plasmon peak of Au NPs. From the fitting of the theoretical peak position to the experimental one (547 nm, Figure 1a), we determined that neff = 1.5. This number is physically reasonable, considering the matrix composition and the refractive indices of the matrix components. For the TiO2 NPs, we used the bulk dielectric function from Ref. [33], and the average particle size indicated by the manufacturer (21 nm). The extinctions were computed using the electromagnetic module of COMSOL.

Figure 1.
(a) UV–Vis spectra of 1 wt% Au/TiO2 and TiO2 powders in the KBr matrix; (b) extinctions of the components of the powder calculated by COMSOL. The Au NP extinction is presented for the effective media; (c) the structure of the extinction cross section of the 50 nm Au NP, including scattering and absorption.
X-Ray Photoelectron Spectroscopy (XPS). XPS was carried out on K-Alfa (Thermo Scientific) equipped with a monochromated Al Kα source. A flood gun was used to avoid surface charging. Survey and high-resolution core-level Au4f, Ti2p, O1s, and C1s spectra were collected. All peaks were referenced to the C1s peak at 285 eV. Peak fitting was performed by CASA software, after background correction by Shirley method. For Au 4f spectrum, 5/2 to 7/2 peak area ratio was kept at 0.75 and a full width at half maximum (FWHM) was kept identical for both peaks. The sample was prepared by pressing Au/TiO2 powder into In foil (1mm thick, Sigma Aldrich)
DRIFTS. Prior to DRIFTS experiments, approximately 5 mg of the TiO2 or Au/TiO2 powders were placed in a porous ceramic cup, and the sample was calcined at 425 °C in the air for 4 h. The sample cup was then placed in the Pike Technologies DiffuseIR reactor cell and purged with a flow of 1 mL/min of ultra-zero grade air (ZA, Airgas, ~20% O2 with a balance of N2 and trace impurities) or 1.45 mL/min of helium (Airgas, 99.999% purity) for aerobic and anaerobic conditions, respectively, for approximately 18 h. The DRIFTS cell was thermostatted at 25 °C. CEES was delivered to the sample via diverting the feed gas through a glass saturator (Glassblowers) that was thermostatted by a water bath set to 20 °C.
Visible light illumination was performed using a 200 W mercury–xenon broad spectrum lamp (Newport Model 67005) equipped with a long pass filter to exclude all transmission <480 nm (Newport 20-CGA-495). The light was directed to the sample cup via a custom bundled fiber optic with the light-emitting end being ~6 mm above the sample. Light intensity at the sample was estimated to be ~40 mW cm−2, as measured by a Newport m1918R power meter coupled with a 918D-ST-UV probe. DRIFTS IR spectra were recorded with a Thermo Fisher Scientific 6700 FTIR by collecting 125 spectra averaged over 58.85 s with a 2 cm−1 resolution at a gain of 2.
3. Results and Discussion
3.1. Characterization
Figure 1a shows UV–Vis spectra of Au/TiO2 and TiO2 powders. The spectrum of Au/TiO2 exhibits a sharp maximum in the visible region at 547 nm due to LSPR. At λ < 400 nm, the TiO2 absorption band is observed. In Figure 1b, the optical calculations of the TiO2 and Au NPs incorporated into the TiO2+KBr matrix are presented. The TiO2 extinction is mostly due to absorption since the scattering from a small semiconductor NP is typically weak. Simultaneously, the extinction of the Au NPs includes both scattering and absorption components, as shown in Figure 1c. Although absorption dominates for 50 nm Au NPs, the contribution of scattering is not negligible. The calculated position of the LSPR peak in Figure 1b depends on the NP size and matrix dielectric constant.
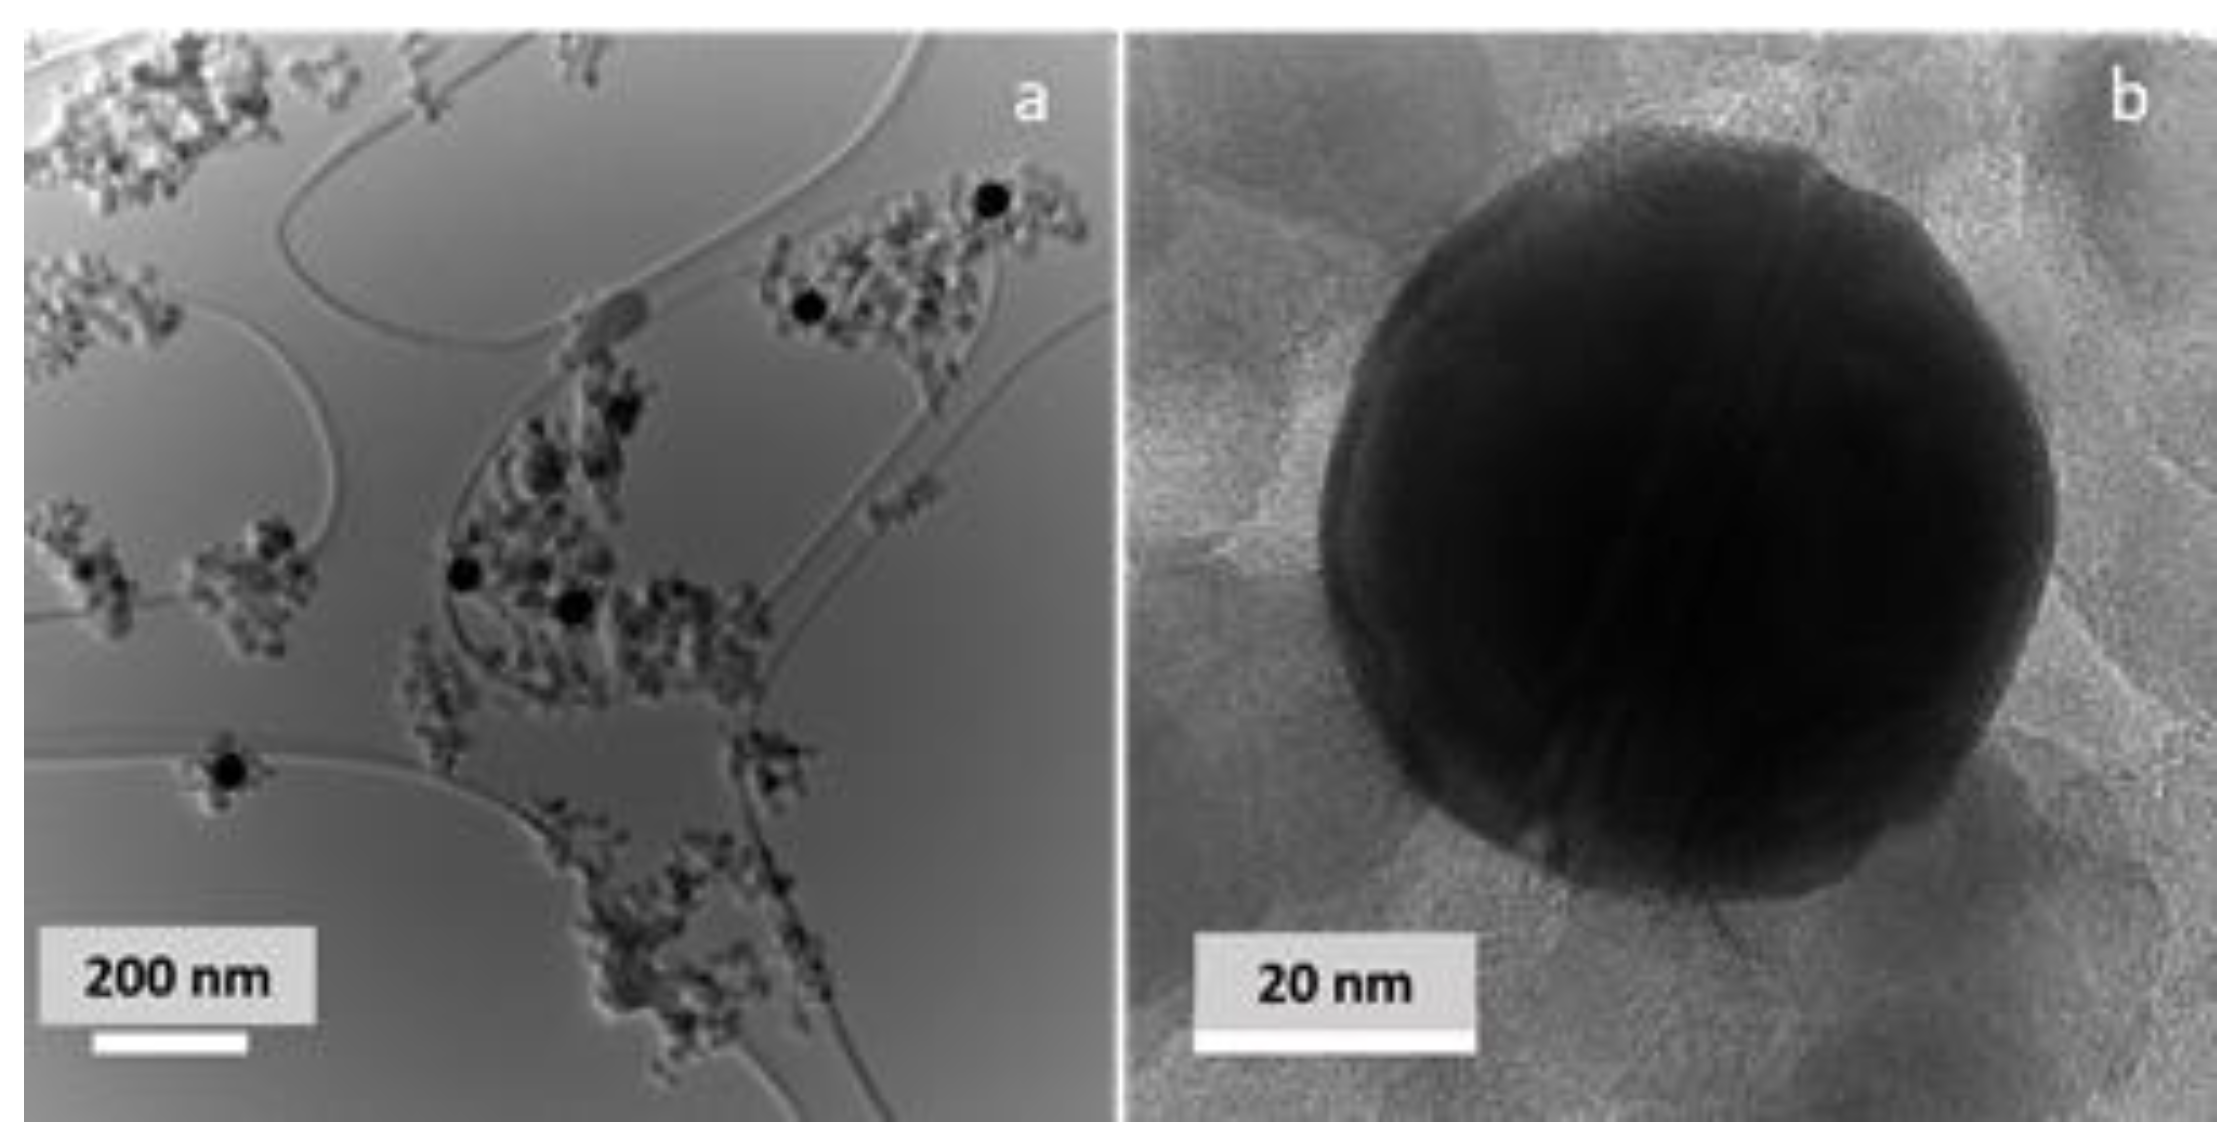
The morphology of the Au/TiO2 photocatalyst was examined by TEM, as shown in Figure 2. The photocatalyst consists of spherical monodisperse 50 nm Au nanoparticles and 10–25 nm crystalline TiO2 NPs of mostly spherical shapes that enclose Au NPs. Au NPs are evenly distributed in the TiO2 matrix. A close inspection of the Au-TiO2 interface reveals close contact between the plasmonic NP and semiconducting support, which is important for successful injection of photogenerated hot electrons from the plasmonic NPs into a semiconducting support, as well as for the rapid heat transfer from the photoexcited Au NPs. To confirm that the Au NP surface is not oxidized, the Au surface speciation was examined by XPS. Figure S1 shows Au 4f photoelectron lines, centered at 83.7 and 87.3 eV. These lines can be fitted by a doublet (4f7/2 and 4f5/2, respectively, FWHM = 1.36), corresponding to metallic Au [34].
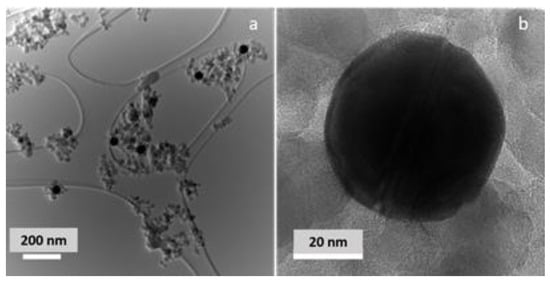
Figure 2.
(a) Low- and (b) high-resolution images of 1 wt% Au/TiO2 photocatalyst.
3.2. The 2-CEES Reactivity under Anaerobic Conditions
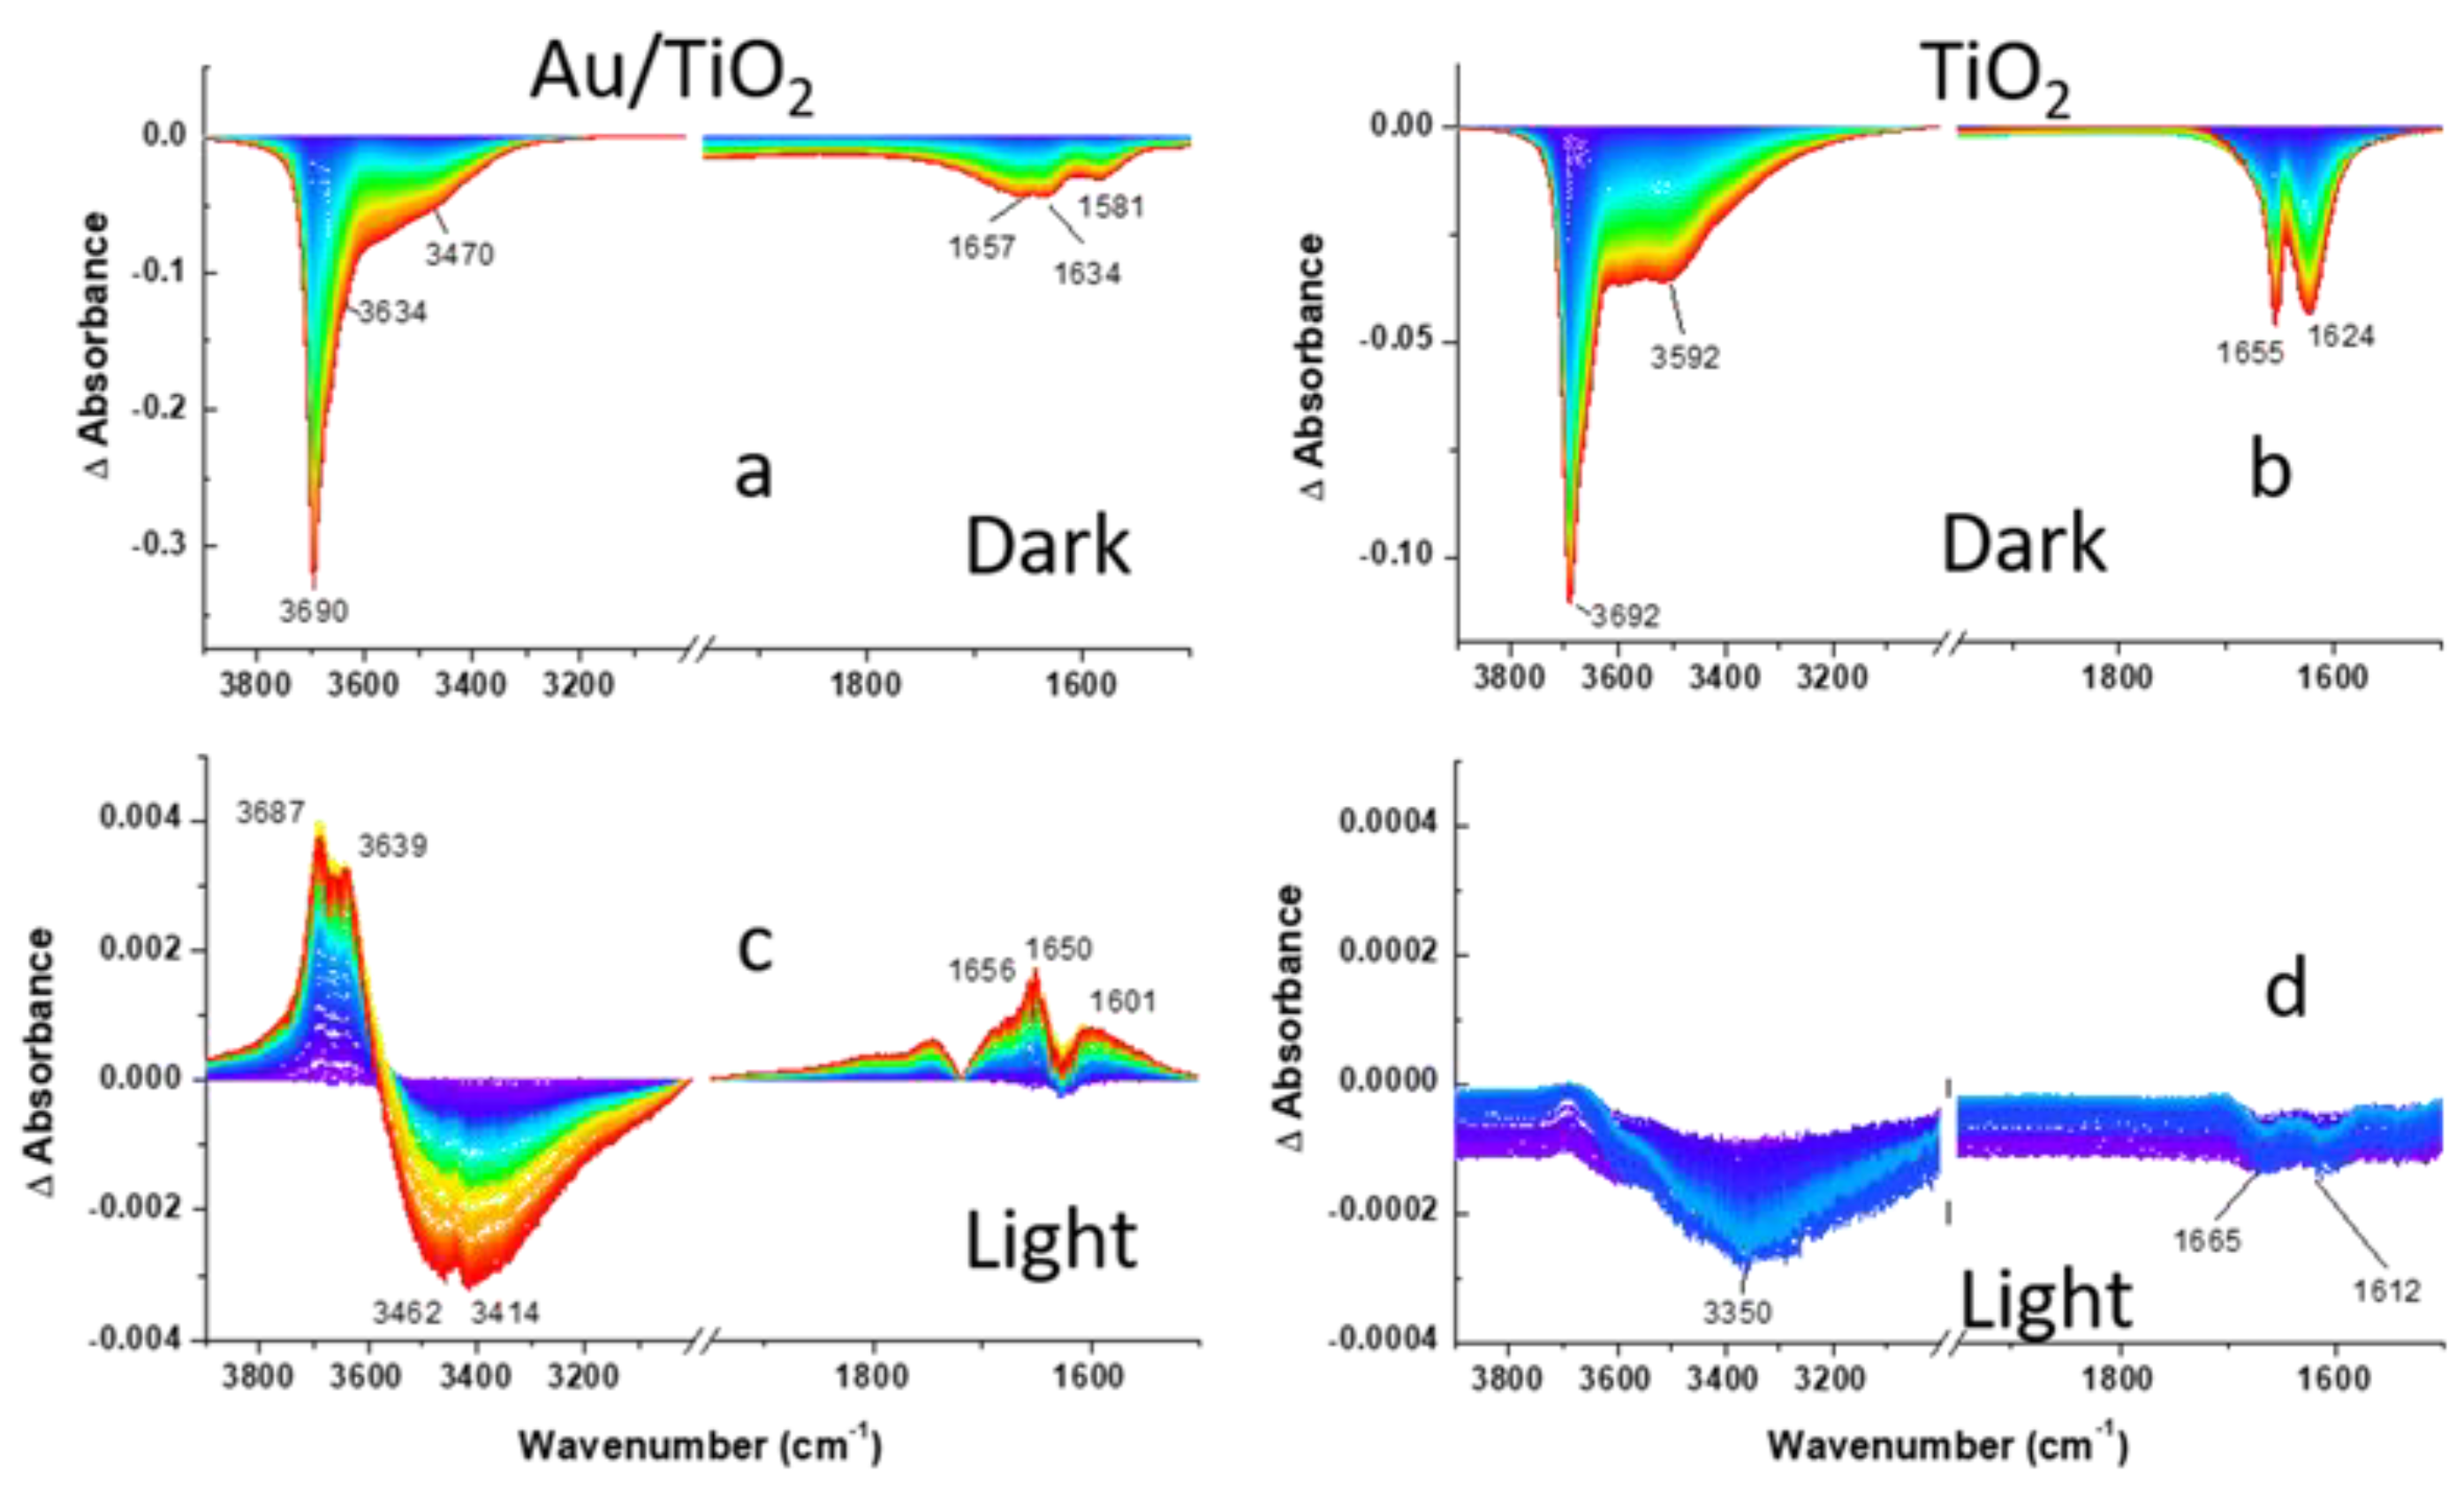
Prior to the assessment of the photocatalytic activity of the Au/TiO2 photocatalyst towards 2-CEES decomposition under visible excitation, the activity of the photocatalyst was evaluated in the dark. For this, 2-CEES vapor was introduced in the DiffusIR environmental cell filled with He for 2 h, and the series of consecutive DRIFTS spectra were recorded (125 spectra total, 58.85 sec/spectrum). Figure 3, Figure 4 and Figure 5 (top panels) compare spectral development during CEES dosing for Au/TiO2 and TiO2 photocatalysts in the three different regions. Difference spectra were presented to facilitate comparison with the background measured on a clean surface prior to the 2-CEES introduction. In the first region, we focus on the surface specific stretching vibrations of OH groups in isolated Ti-OH (~3700 cm−1) moieties, as well as binding (1620–1660 cm−1) and stretching OH vibrations (3592 cm−1) in Ti-H2O species, while in the second and the third regions fingerprint and aliphatic vibrational modes of the 2-CEES molecules are presented. Loss of OH vibration during 2-CEES dosing in the first region displayed in Figure 3a,b is attributed to 2-CEES adsorption on the Au/TiO2 and TiO2 surfaces. The OH absorbance decreases with time as more 2-CEES molecules diffuse through the photocatalyst pores and adsorb on the surface. Previous reports indicate that 2-CEES adsorbs on Ti-OH by forming hydrogen bonding via both the chlorine and sulfur moieties [35]. The region at λ < 1750 cm−1 in Figure 3a,b looks somewhat different for Au/TiO2 versus TiO2. While two clearly distinguishable bands at 1624 and 1655 cm−1 are observed for TiO2, three broad bands (at 1581, 1634, and 1657 cm−1) are displayed for Au/TiO2. This may be due to bond energies at the Au/TiO2 surface being affected by the presence of Au at the interface with TiO2.
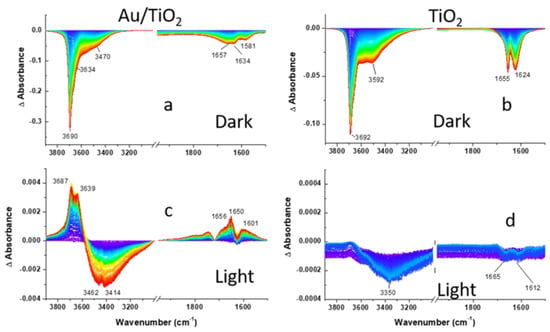
Figure 3.
DRIFTS difference spectra of (a,c) Au/TiO2 and (b,d) TiO2 photocatalysts recorded during 2-CEES dosing in anaerobic conditions: (a,b)-dark; (c,d)-under visible light excitation following He purge. OH region is shown. Spectra in the dark are calculated by subtraction of the background spectrum recorded on a clean surface. The last spectrum measured in the dark under He purge was used as a background for the spectra measured under visible light excitation.
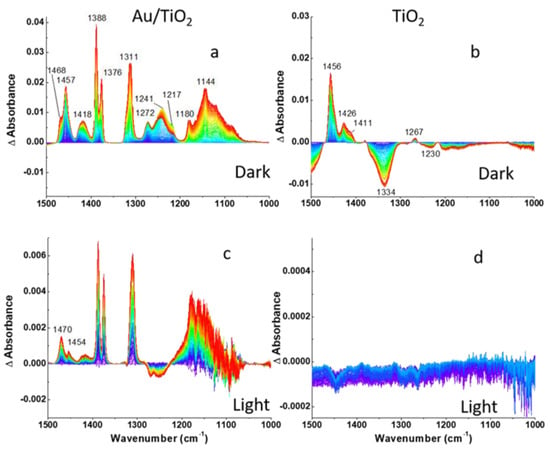
Figure 4.
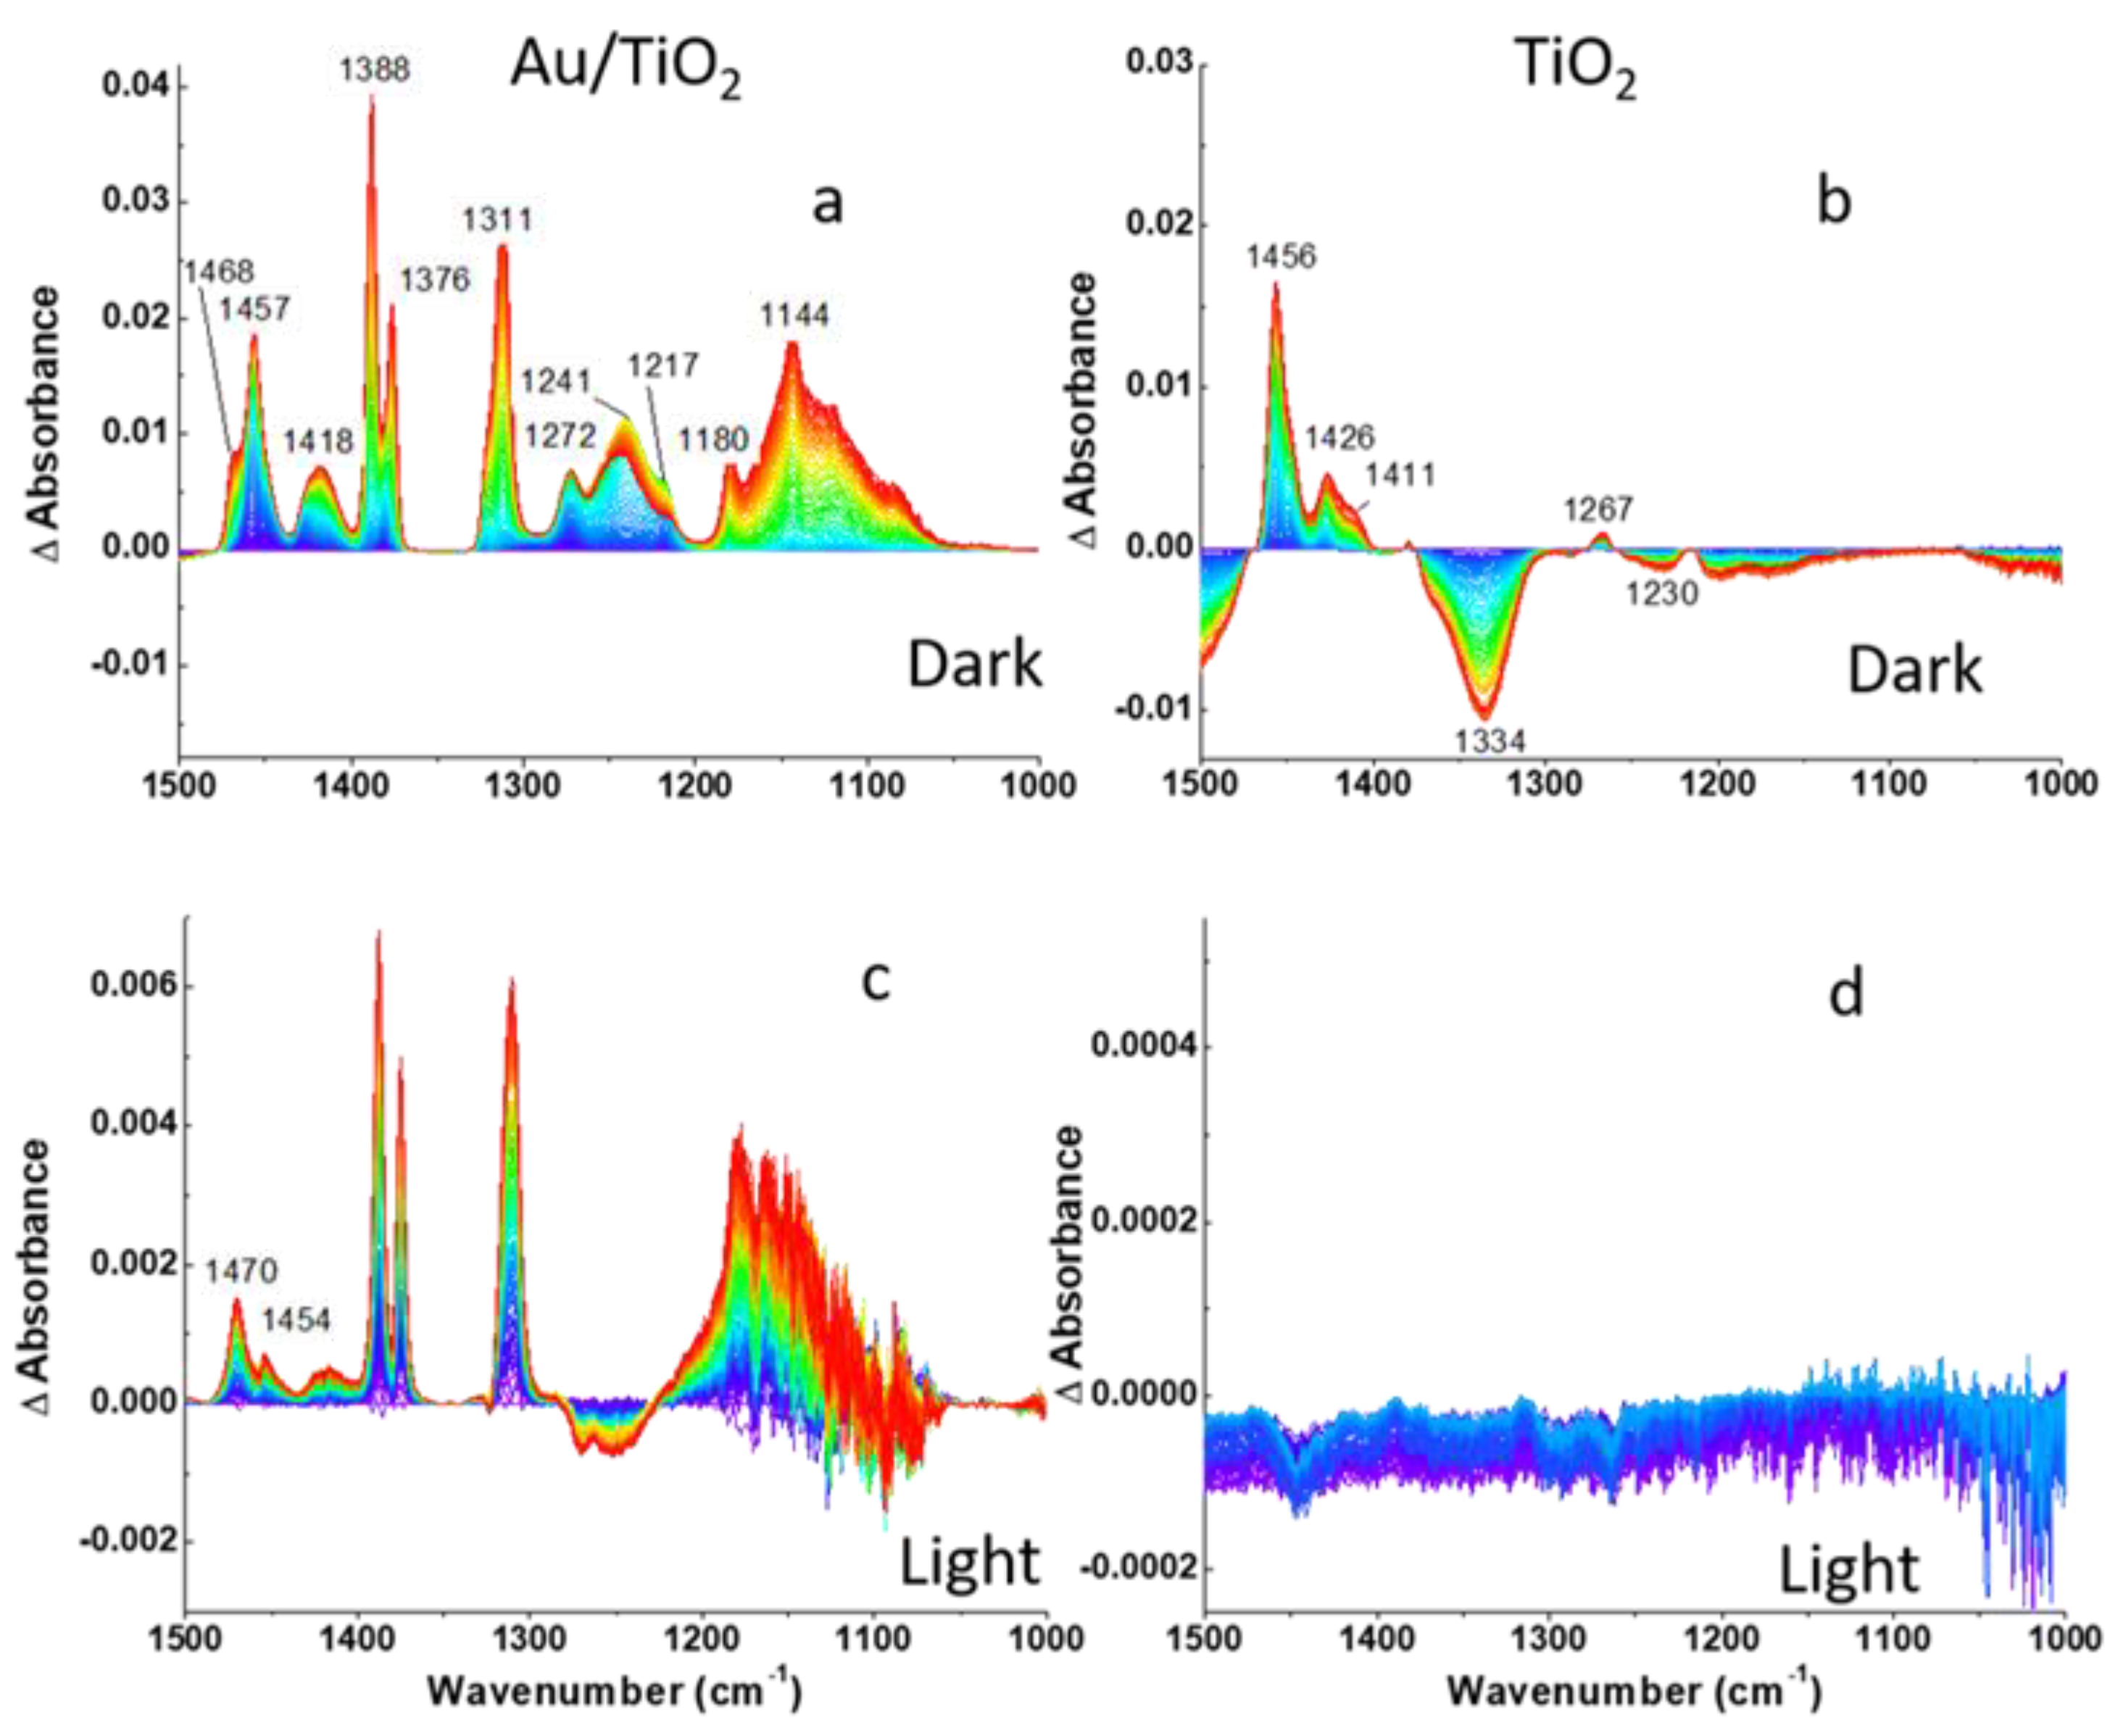
DRIFTS difference spectra of (a,c) Au/TiO2 and (b,d) TiO2 photocatalysts recorded during 2-CEES dosing in anaerobic conditions: (a,b)-dark, (c,d)-under visible light excitation following He purge. Fingerprint region is shown.
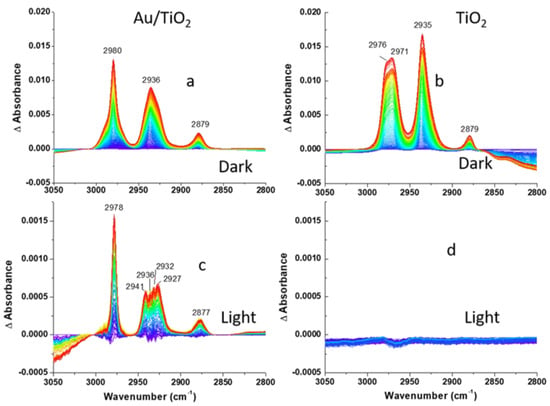
Figure 5.
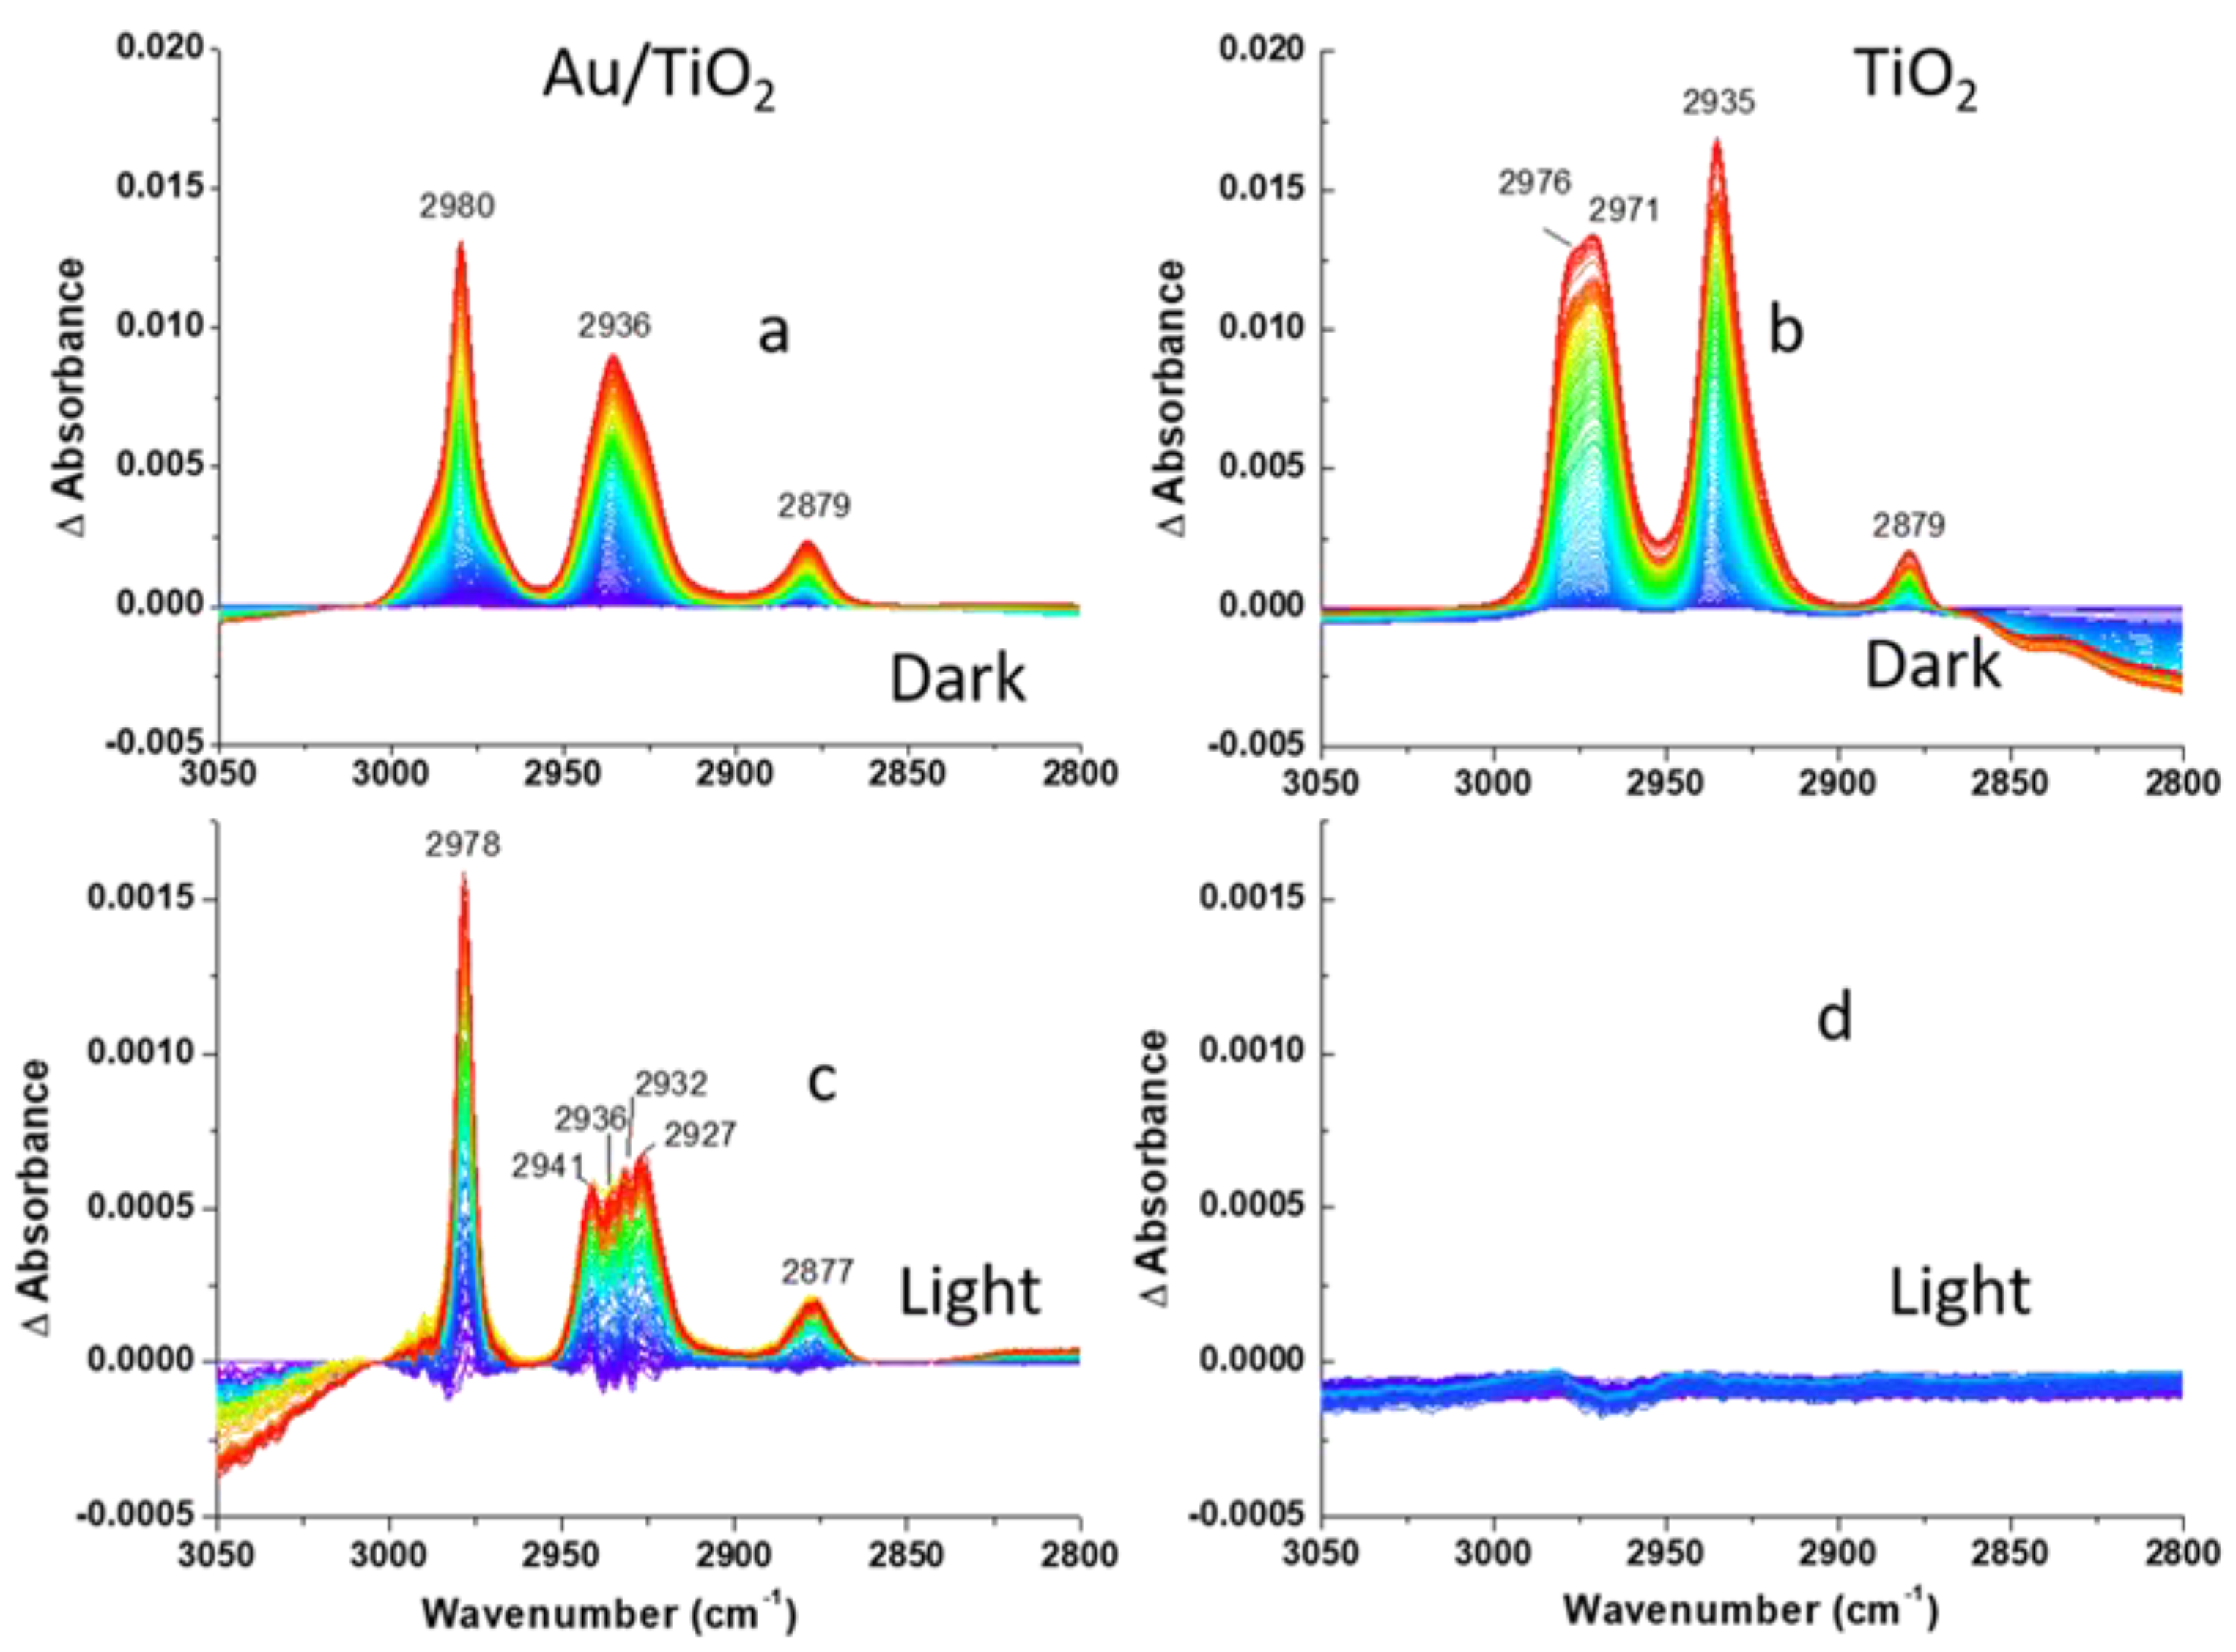
DRIFTS difference spectra of (a,c) Au/TiO2 and (b,d) TiO2 photocatalysts recorded during 2-CEES dosing in anaerobic conditions: (a,b)-dark, (c,d)-under visible light excitation following He purge. Aliphatic region is shown.
The absorption of 2-CEES on the surface is confirmed by the increases in intensities of CH2, CH3, S(CH2), and C-C band as 2-CEES dosing progresses, as shown in Figure 4 and Figure 5a,b. Band assignments in the aliphatic and fingerprint regions are provided in Table 1.

Table 1.
IR band and mode assignment for 2-CEES adsorbed on Au/TiO2 and TiO2 photocatalysts.
The bands at 1311, 1180, and 1144 cm−1 in Figure 4a, which are not included in Table 1, may be assigned to the formation of C-O bonds due to 2-CEES hydrolysis, as C-O moieties exhibit stretching frequencies in the region between 1100 and 1200 cm−1 [37]. Formation of 2-ethylthio ethanol by replacement of Cl species in 2-CEES molecules by OH groups in the dark on P25 TiO2 in the air has been demonstrated by GC–MS in our previous work [31]. We attribute the peak at 1311 cm−1 to C-O bond formation as well because of the similar pattern of spectral development. The dynamics of the development of the bands at the three frequencies suggests the time lag between 2-CEES adsorption and hydrolysis. Note that the blue region is located at the bottom of the three bands assigned to C-O moieties, contrary to other peaks. The fastest saturation is observed for the bands centered at 1272, 1241 ((CH2)wag), and 1217 cm−1 (S(CH2)wag). Interestingly, the peaks at 1241 cm−1 and 1217 cm−1 decrease in magnitude after fast saturation. This may be related to the formation of hydrogen bonds between sulfur atoms and the surface OH groups. In addition, 2-CEES is expected to physisorb on the surface of Au NPs via the sulfur atom [38] In spite of Au strong affinity for sulfur, alkylsulfides (such as diethylsulfide), and Cl-substituted alkylsulfides (such as 2-CEES) adsorb reversibly on Au. A comparison of the spectral features of the Au/TiO2 and TiO2 surfaces shows similarity in the aliphatic region and distinction in the fingerprint region (Figure 4a,b and Figure 5a,b, respectively). The most significant difference in the fingerprint region is the absence of vibrational modes below 1267 cm−1 and the decrease in the magnitude of the vibrational mode at 1334 cm−1 as 2-CEES dosing progresses. The absence of bands below 1267 cm−1 implies that the TiO2 surface is less reactive, in comparison to Au/TiO2, while the band at 1334 cm−1 may be related to the desorption of impurities from the TiO2 surface as 2-CEES adsorbs on the surface.
Visible light exposure leads to partial 2-CEES desorption, evident by the increase in the intensity of the bands assigned to the isolated Ti-OH (3687 and 3639 cm−1) and binding OH vibrational modes of water (1656, 1650, and 1601 cm−1) in Figure 3c. Surprisingly, this is accompanied by the partial loss of the H2O stretching vibrations (3462 and 3414 cm−1). It should be noted that the effect is small, as peak intensities in Figure 3c are an order of magnitude lower in comparison to Figure 3a.
Moreover, the 2-CEES partial desorption from the surface is consistent with a decrease in the magnitude of (CH2)wag (1272 and 1241 cm−1) and S(CH2)wag (1217 cm−1) vibrational modes in Figure 4c. The remaining vibrations grow in magnitude likely due to continuous 2-CEES diffusion into the catalyst pores.
Figure 5c shows the same trend of growth in magnitude for the three bands displayed in Figure 5a. However, a much narrower ν(CH2)as band (2978 cm−1) is observed as a result of visible light excitation. Furthermore, instead of a broad ν(CHs)as band at 2936 cm−1, four bands (2941, 2936, 2932, 2927 cm−1) appear, as can be seen in Figure 5c. Comparison of visible light effect at the two interfaces (see Figure 3d and Figure 5d) shows more significant changes at the Au/TiO2 interface. The only noticeable effect at the TiO2 surface is related to a loss of OH stretching vibrational modes at 3350 cm−1, as can be seen in Figure 3d. Therefore, plasmonic Au NPs promote 2-CEES partial desorption from the surface. As we mentioned earlier, Au NPs excited with visible light can create photochemistry in two ways. Absorption in an NP leads to the generation of heat and creates phototemperature [8], and we believe that this photothermal mechanism is the likely reason for the desorption of 2-CEES in our experiments. Another mechanism involves the generation of hot electrons, which can be injected into the TiO2 particles. Since our Au NPs are relatively large (50 nm), the photothermal mechanism is expected to dominate. The estimated internal efficiency for the over-barrier hot-electron generation in our Au NPs is ~4% [39], whereas the photothermal conversion efficiency for our NPs at the plasmon peak (the ratio between the absorption and extinction in Figure 1c) is high at ~77%. Therefore, the photothermal heating effect likely prevails. Although both mechanisms are expected to lead to an increase in the photochemical reaction rate on the TiO2 surface, it is important to observe some photocatalytic activity of neat TiO2 as a control prior to incorporating Au NPs. However, for just TiO2 we do not observe noticeable photochemistry. Therefore, we surmise that the heat generated by photo-excited Au NPs promotes 2-CEES desorption instead of promoting reaction rate. Overall, the observed photothermal effect is small, likely due to a low loading of Au nanoparticles. The question arises whether the photocurrent enhancement for CH3OH oxidation by 50 nm Au NPs observed in Ref. [30] was due to the photothermal effect or injection of hot electrons into the TiO2 support. Although the heat contribution cannot be ignored, we presume that the over-barrier hot-electron injection in the setting of Ref. [30] played a main role in promoting reaction rate because of a faster heat transfer rate at the photocatalyst/solution vs. photocatalyst/gas interface.
3.3. The 2-CEES Reactivity under Aerobic Conditions
Figure S2 displays the evolution of the DRIFTS difference spectra recorded on the Au/TiO2 and TiO2 surfaces during 2-CEES dosing under aerobic conditions in the dark. In the hydroxyl region (Figure S2a,b), loss of isolated OH (3690 and 3614 cm−1) and H2O vibrations (3470 and 1624 cm−1) for both photocatalysts is observed. This behavior is qualitatively similar to what is observed under anaerobic conditions (Figure 3a,b). However, the OH band at 3690 cm−1 is much sharper in Figure S2a, in comparison to Figure 3a, suggesting a higher reactivity in the presence of O2. The H2O loss, compared to that of OH isolated groups at the Au/TiO2 interface, is also more pronounced under aerobic conditions. The ratio of peak intensities for maximal H2O loss at ca. 1650 cm−1 to OH loss at 3690 cm−1 is 0.25 vs. 0.12 for anaerobic vs. aerobic conditions. This implies that H2O molecules are also more actively consumed in the presence of O2. The spectra on the TiO2 interface in Figure S1b appear somewhat different from those of the Au/TiO2 interface, although the ratio of maximal H2O loss to OH loss is close for the two interfaces. However, the contribution of ν(H2O) at 3470 cm−1 into the (OH + H2O) band at 3690 cm−1 is more pronounced for the TiO2 photocatalyst.
Difference spectra in the fingerprint and aliphatic regions in Figure S2c–f show more dynamics in the presence of O2. For instance, the band at 1380 cm−1 (δ(CH3)s in Figure S2c saturates quickly, while steady growth is observed for a band centered at 1457 cm−1 (δ(CH2)as bent). Both bands are assigned to 2-CEES adsorption on the Au/TiO2 surface. The processes at the Au/TiO2 surface are quite different from those on TiO2 (Figure S2c,d). In the aliphatic region (Figure S2e,f), there is a clear difference in the dynamics of the band at 2977 cm−1 (ν(CH2)as) and at 2897 cm−1. These dynamics suggest higher reactivity under aerobic conditions. We assign the higher reactivity of both Au/TiO2 and TiO2 photocatalyst under aerobic conditions to activation of water molecules by molecular oxygen, although the mechanism of activation remains elusive. Additionally, we do not observe a significant difference in the OH region between the Au/TiO2 and TiO2 interfaces under aerobic conditions, which rules out the catalytic effect of 50 nm Au NPs.
No effect of visible light was observed under aerobic conditions (see Figure S3), likely due to a higher rate of 2-CEES hydrolysis in the dark in the presence of oxygen.
4. Conclusions
Under anaerobic conditions, 2-CEES partially desorbs from the Au/TiO2 surface most likely due to the photothermal effect induced by the photo-excited plasmonic Au nanoparticles. Simultaneously, we do not observe a noticeable photochemical activity. Therefore, we conclude that the photothermal mechanism prevails over the over-barrier hot electron injection for 50 nm Au NPs.
In the aerobic experiment, no visible light effect is observed. We attribute this behavior to 2-CEES consumption by hydrolysis to 2-ethylthio ethanol in the dark, prior to visible light excitation. Oxygen likely activates water molecules in the dark, resulting in accelerated 2-CEES hydrolysis.
Supplementary Materials
The following are available online at https://www.mdpi.com/article/10.3390/cryst11060659/s1, Figure S1: Au4f high-resolution spectrum collected from 1 wt% Au/TiO2 photocatalyst and fitted as a 4f7/2 and 4f5/2 doublet, Figure S2: DRIFTS difference spectra of Au/TiO2 and TiO2 photocatalysts during 2-CEES dosing under aerobic conditions in the dark, Figure S3: DRIFTS difference spectra of Au/TiO2 photocatalyst collected in aerobic conditions under visible excitation.
Author Contributions
Conceptualization, O.B.; methodology, A.B. and W.G.; validation, A.B. and W.G.; formal analysis, A.B., W.G., S.G., O.Á.-O., and A.G.; investigation, S.G.; resources, A.E. and M.M.; writing—original draft preparation, O.B.; writing—review and editing, M.M., A.G., A.B., W.G., S.G., and A.E.; visualization, S.G. and W.G.; supervision, O.B. and M.M.; project administration, O.B.; funding acquisition, O.B., M.M., and A.G. All authors have read and agreed to the published version of the manuscript.
Funding
O.B., S.G., and A.E. were funded by the Office of Naval Research. M.M., A.B., and W.G. were funded by the Defense Threat Reduction Agency (DTRA). A.G. was funded by the Army Research Office (contract W911NF1920081).
Acknowledgments
We are thankful to Todd Brintlinger (Naval Research Laboratory) and Nabraj Bhattarai (former NRC Postdoctoral Research Associate, current employee of Intel Corporation, Santa Clara, California, USA) for providing TEM images of Au/TiO2 powder.
Conflicts of Interest
The authors declare no conflict of interest.
References
- Naldoni, A.; Riboni, F.; Guler, U.; Boltasseva, A.; Shalaev, V.M.; Kildishev, A.V. Solar-Powered Plasmon-Enhanced Heterogeneous Catalysis. Nanophotonics 2016, 5, 112–133. [Google Scholar] [CrossRef]
- Naldoni, A.; Guler, U.; Wang, Z.X.; Marelli, M.; Malara, F.; Meng, X.G.; Besteiro, L.V.; Govorov, A.O.; Kildishev, A.V.; Boltasseva, A.; et al. Broadband Hot-Electron Collection for Solar Water Splitting with Plasmonic Titanium Nitride. Adv. Opt. Mater. 2017, 5. [Google Scholar] [CrossRef]
- Alvaro, M.; Cojocaru, B.; Ismail, A.A.; Petrea, N.; Ferrer, B.; Harraz, F.A.; Parvulescu, V.I.; Garcia, H. Visible-light photocatalytic activity of gold nanoparticles supported on template-synthesized mesoporous titania for the decontamination of the chemical warfare agent Soman. Appl. Catal. B Environ. 2010, 99, 191–197. [Google Scholar] [CrossRef]
- Neatu, S.; Cojocaru, B.; Parvulescu, V.I.; Somoghi, V.; Alvaro, M.; Garcia, H. Visible-light C-heteroatom bond cleavage and detoxification of chemical warfare agents using titania-supported gold nanoparticles as photocatalyst. J. Mater. Chem. 2010, 20, 4050–4054. [Google Scholar] [CrossRef]
- Valenti, M.; Jonsson, M.P.; Biskos, G.; Schmidt-Ott, A.; Smith, W.A. Plasmonic nanoparticle-semiconductor composites for efficient solar water splitting. J. Mater. Chem. A 2016, 4, 17891–17912. [Google Scholar] [CrossRef]
- Zheng, X.Z.; Zhang, L.W. Photonic nanostructures for solar energy conversion. Energy Environ. Sci. 2016, 9, 2511–2532. [Google Scholar] [CrossRef]
- Bumajdad, A.; Madkour, M.; Abdel-Moneam, Y.; El-Kemary, M. Nanostructured mesoporous Au/TiO2 for photocatalytic degradation of a textile dye: The effect of size similarity of the deposited Au with that of TiO2 pores. J. Mater. Sci. 2014, 49, 1743–1754. [Google Scholar] [CrossRef]
- Dodekatos, G.; Schunemann, S.; Tuysuz, H. Surface Plasmon-Assisted Solar Energy Conversion. In Solar Energy for Fuels; Tuysuz, H., Chan, C.K., Eds.; Topics in Current Chemistry-Series; Springer: Berlin/Heidelberg, Germany, 2016; Volume 371, pp. 215–252. [Google Scholar]
- Lu, Y.; Yu, H.T.; Chen, S.; Quan, X.; Zhao, H.M. Integrating Plasmonic Nanoparticles with TiO2 Photonic Crystal for Enhancement of Visible-Light-Driven Photocatalysis. Environ. Sci. Technol. 2012, 46, 1724–1730. [Google Scholar] [CrossRef]
- Hung, W.H.; Aykol, M.; Valley, D.; Hou, W.B.; Cronin, S.B. Plasmon Resonant Enhancement of Carbon Monoxide Catalysis. Nano Lett. 2010, 10, 1314–1318. [Google Scholar] [CrossRef] [PubMed]
- Rej, S.; Mascaretti, L.; Santiago, E.Y.; Tomanec, O.; Kment, S.; Wang, Z.M.; Zboril, R.; Fornasiero, P.; Govorov, A.O.; Naldoni, A. Determining Plasmonic Hot Electrons and Photothermal Effects during H-2 Evolution with TiN-Pt Nanohybrids. ACS Catal. 2020, 10, 5261–5271. [Google Scholar] [CrossRef]
- Richardson, H.H.; Carlson, M.T.; Tandler, P.J.; Hernandez, P.; Govorov, A.O. Experimental and Theoretical Studies of Light-to-Heat Conversion and Collective Heating Effects in Metal Nanoparticle Solutions. Nano Lett. 2009, 9, 1139–1146. [Google Scholar] [CrossRef]
- Govorov, A.O.; Richardson, H.H. Generating heat with metal nanoparticles. Nano Today 2007, 2, 30–38. [Google Scholar] [CrossRef]
- Cortes, E.; Besteiro, L.V.; Alabastri, A.; Baldi, A.; Tagliabue, G.; Demetriadou, A.; Narang, P. Challenges in Plasmonic Catalysis. ACS Nano 2020, 14, 16202–16219. [Google Scholar] [CrossRef] [PubMed]
- Jauffred, L.; Samadi, A.; Klingberg, H.; Bendix, P.M.; Oddershede, L.B. Plasmonic Heating of Nanostructures. Chem. Rev. 2019, 119, 8087–8130. [Google Scholar] [CrossRef] [PubMed]
- Naya, S.; Teranishi, M.; Isobe, T.; Tada, H. Light wavelength-switchable photocatalytic reaction by gold nanoparticle-loaded titanium(IV) dioxide. Chem. Commun. 2010, 46, 815–817. [Google Scholar] [CrossRef] [PubMed]
- Higashimoto, S. Titanium-Dioxide-Based Visible-Light-Sensitive Photocatalysis: Mechanistic Insight and Applications. Catalysts 2019, 9, 201. [Google Scholar] [CrossRef]
- Kowalska, E.; Abe, R.; Ohtani, B. Visible light-induced photocatalytic reaction of gold-modified titanium(IV) oxide particles: Action spectrum analysis. Chem. Commun. 2009, 241–243. [Google Scholar] [CrossRef]
- Naya, S.; Inoue, A.; Tada, H. Self-Assembled Heterosupramolecular Visible Light Photocatalyst Consisting of Gold Nanoparticle-Loaded Titanium(IV) Dioxide and Surfactant. J. Am. Chem. Soc. 2010, 132, 6292. [Google Scholar] [CrossRef] [PubMed]
- Wang, D.W.; Pillai, S.C.; Ho, S.H.; Zeng, J.B.; Li, Y.; Dionysiou, D.D. Plasmonic-based nanomaterials for environmental remediation. Appl. Catal. B Environ. 2018, 237, 721–741. [Google Scholar] [CrossRef]
- Gelle, A.; Jin, T.; de la Garza, L.; Price, G.D.; Besteiro, L.V.; Moores, A. Applications of Plasmon-Enhanced Nanocatalysis to Organic Transformations. Chem. Rev. 2020, 120, 986–1041. [Google Scholar] [CrossRef]
- Ide, Y.; Matsuoka, M.; Ogawa, M. Efficient Visible-Light-Induced Photocatalytic Activity on Gold-Nanoparticle-Supported Layered Titanate. J. Am. Chem. Soc. 2010, 132, 16762–16764. [Google Scholar] [CrossRef]
- Zheng, Z.K.; Huang, B.B.; Qin, X.Y.; Zhang, X.Y.; Dai, Y.; Whangbo, M.H. Facile in situ synthesis of visible-light plasmonic photocatalysts M@TiO2 (M = Au, Pt, Ag) and evaluation of their photocatalytic oxidation of benzene to phenol. J. Mater. Chem. 2011, 21, 9079–9087. [Google Scholar] [CrossRef]
- Primo, A.; Corma, A.; Garcia, H. Titania supported gold nanoparticles as photocatalyst. Phys. Chem. Chem. Phys. 2011, 13, 886–910. [Google Scholar] [CrossRef] [PubMed]
- Widmann, D.; Behm, R.J. Active Oxygen on a Au/TiO2 Catalyst: Formation, Stability, and CO Oxidation Activity. Angew. Chem. Int. Ed. 2011, 50, 10241–10245. [Google Scholar] [CrossRef] [PubMed]
- Green, I.X.; Tang, W.J.; Neurock, M.; Yates, J.T. Spectroscopic Observation of Dual Catalytic Sites During Oxidation of CO on a Au/TiO2 Catalyst. Science 2011, 333, 736–739. [Google Scholar] [CrossRef]
- Widmann, D.; Behm, R.J. Activation of Molecular Oxygen and the Nature of the Active Oxygen Species for CO Oxidation on Oxide Supported Au Catalysts. Acc. Chem Res 2014, 47, 740–749. [Google Scholar] [CrossRef]
- Panayotov, D.A.; Morris, J.R. Catalytic degradation of a chemical warfare agent simulant: Reaction mechanisms on TiO2-supported Au nanoparticles. J. Phys. Chem. C 2008, 112, 7496–7502. [Google Scholar] [CrossRef]
- McEntee, M.; Gordon, W.O.; Balboa, A.; Delia, D.J.; Pitman, C.L.; Pennington, A.M.; Rolison, D.R.; Pietron, J.J.; DeSario, P.A. Mesoporous Copper Nanoparticle/TiO2 Aerogels for Room-Temperature Hydrolytic Decomposition of the Chemical Warfare Simulant Dimethyl Methylphosphonate. ACS Appl. Nano Mater. 2020, 3, 3503–3512. [Google Scholar] [CrossRef]
- Baturina, O.A.; Epshteyn, A.; Simpkins, B.; Bhattarai, N.; Brintlinger, T.H. Comparing photoelectrochemical methanol oxidation mechanisms for gold versus titanium nitride nanoparticles dispersed in P25 TiO2 matrix. J. Electrochem. Soc. 2019, 166, H485–H493. [Google Scholar] [CrossRef]
- Giles, S.L.; Sousa-Castillo, A.; Santiago, E.Y.; Purdy, A.P.; Correa-Duarte, M.A.; Govorov, A.O.; Baturina, O.A. Visible light driven oxidation of harmful 2-Chloroethyl ethyl sulfide using SiO2-TiO2 composite particles and air. Colloid Interface Sci. Commun. 2021, 41, 100362. [Google Scholar] [CrossRef]
- Johnson, P.B.; Christy, R.W. Optical Constants of Noble Metals. Phys. Rev. B 1972, 6, 4370–4379. [Google Scholar] [CrossRef]
- Siefke, T.; Kroker, S.; Pfeiffer, K.; Puffky, O.; Dietrich, K.; Franta, D.; Ohlidal, I.; Szeghalmi, A.; Kley, E.B.; Tunnermann, A. Materials Pushing the Application Limits of Wire Grid Polarizers further into the Deep Ultraviolet Spectral Range. Adv. Opt. Mater. 2016, 4, 1780–1786. [Google Scholar] [CrossRef]
- Moulder, J.F.; Stickle, W.F.; Sobol, P.E.; Bomben, K.D. Handbook of X-ray Photoelectron Spectroscopy; Perkin Elmer Corporation: Eden Prairie, MN, USA, 1992. [Google Scholar]
- Panayotov, D.; Yates, J.T. Bifunctional hydrogen bonding of 2-chloroethyl ethyl sulfide on TiO2-SiO2 powders. J. Phys. Chem. B 2003, 107, 10560–10564. [Google Scholar] [CrossRef]
- Sosa, C.; Bartlett, R.J.; Kubulat, K.; Person, W.B. A theoretical study of the harmonic vibrational frequencies and infrared intensities of XCH2CH2SCH2CH2X and XCH2CH2SH (X = H, Cl). J. Phys. Chem. 1989, 93, 577–588. [Google Scholar] [CrossRef]
- Thompson, T.L.; Panayotov, D.A.; Yates, J.T. Adsorption and thermal decomposition of 2-chloroethyl ethyl sulfide on TiO2 surfaces. J. Phys. Chem. B 2004, 108, 16825–16833. [Google Scholar] [CrossRef]
- Pedersen, D.B.; Duncan, S. Substituent effects on the adsorption of dialkyl sulfides on gold nanoparticles. J. Phys. Chem. A 2005, 109, 11172–11179. [Google Scholar] [CrossRef] [PubMed]
- Santiago, E.Y.; Besteiro, L.V.; Kong, X.T.; Correa-Duarte, M.A.; Wang, Z.M.; Govorov, A.O. Efficiency of Hot-Electron Generation in Plasmonic Nanocrystals with Complex Shapes: Surface-Induced Scattering, Hot Spots, and Interband Transitions. ACS Photonics 2020, 7, 2807–2824. [Google Scholar] [CrossRef]
Publisher’s Note: MDPI stays neutral with regard to jurisdictional claims in published maps and institutional affiliations. |
© 2021 by the authors. Licensee MDPI, Basel, Switzerland. This article is an open access article distributed under the terms and conditions of the Creative Commons Attribution (CC BY) license (https://creativecommons.org/licenses/by/4.0/).


