2. Materials and Methods
The cylindrical ingot of Cu–14 wt% Sn alloy was manuractured by vacuum induction melting of the high-purity 99.9998 wt% copper and 99.999 wt% tin. The as-cast ingots were cut into the 0.6 mm-thick discs for further HPT processing. The discs were then mechanically ground and chemically etched. The discs were afterwards sealed at room temperature in silica ampoules with a residual pressure of ~4 × 10⁻⁴ Pa. The ampoules were annealed at 320 °C for 1200 h and at 500 °C for 894 h. After annealing, the ampoules were quenched into cold water, then the samples were processed by HPT at a pressure of 6 GPa and room temperature for 5 anvil rotations at a constant rotation speed of 1 rpm using a computer-controlled HPT device custom-built by W. Klement GmbH, Lang, Austria. The sample thickness after HPT was 0.35 mm.
Torsion straining of a disc sample of diameter 2
R and thickness
t produces a shear strain γ = 2π
nr/
t (where
n is the number of plunger rotations and
r is the distance from the sample center). γ changes from zero at
r = 0 to a maximum of γ
max on the external surface at
r =
R. In order to compare the shear strain with a tensile deformation, the equivalent strain value
is frequently used [
23,
24]. All samples for further studies were cut from the deformed samples at a distance of
r = 3 mm from the middle of the disc. For
r = 3 mm and 5 plunger rotations, γ = 270 and
eeq = 156, respectively. This strain value was used for the manufacturing of nanograined materials in numerous previous studies [
23,
24].
For the metallographic investigations, the samples were ground with SiC grinding paper, and sequentially polished with 6, 3, and 1 μm diamond pastes. The structure examination of the samples was carried out using an FEI E-SEM XL30 scanning electron microscope (SEM) (FEI, Hillsborough, OR, USA) equipped with an EDAX Genesis EDS spectrometer (AMETEK, Inc., Berwyn, PA, USA). The SEM images were taken using a backscattered electron signal (BSE mode) in order to obtain the composition contrast between different phases. The thin foils for transmission electron microscopy (TEM) examination were manufactured by a twin-jet polishing technique using a D2 electrolyte manufactured by Struers Inc. TEM studies were carried out using a TECNAI G2 FEG super TWIN microscope (200 kV) (FEI, Hillsborough, OR, USA). The focused ion beam (FIB) technique was applied by means of FIB Quanta 3 D, TECNAI FEG microscopy (30 kV) (FEI, Hillsborough, OR, USA) for the preparation of thin foils of deformed material, in order to obtain the interface between the second phase and α-matrix. The X-ray diffraction (XRD) patterns were obtained in the Bragg–Brentano geometry in a Siemens D-500 X-ray diffractometer (Malvern Panalytical, Malvern, UK) with Cu-Kα radiation. The pseudo-Voigt function was used for fitting of the XRD peak profiles. The hardness was measured using an AGILENT G200 nanoindenter (Keysight Technologies, Santa Rosa, CA, USA) with an XP head at a load of 10 mN. The hardness measurements were performed along the radius of the deformed samples with a step of 100 nm.
3. Results
SEM micrographs of the Cu–14 wt% Sn alloy are shown in
Figure 1.
Figure 1a shows the microstructure of the Cu–14 wt% Sn alloy annealed at 320 °C for 1200 h. This state was the initial one before HPT. The (Cu) solid-solution matrix (or α-phase) appear dark, and the α+ε eutectoid colonies appear bright. The grain size in the (Cu) matrix was ~10–30 μm. The colonies of the α + ε phases had complicated shapes.
Figure 1b shows the same sample as in
Figure 1a, but additionally deformed by HPT. After HPT, the shape of the colonies of the α + ε phases did not change much. They were only slightly curved in the comparison with straight colonies before HPT.
Figure 2a shows the microstructure of the Cu–14 wt% Sn alloy annealed at 500 °C for 894 h. This state was also the initial one before HPT. The (Cu) solid-solution matrix (or α-phase) appears bright, and small particles of δ-phase appear dark. The grain size of (Cu) solid-solution matrix was about 200–300 μm.
Figure 2b shows the same sample as in
Figure 1a, but additionally deformed by HPT. The SEM image looks uniformly grey, since the sample contained only the ultrafine-grained (Cu) solid solution. The bright field (
Figure 2c) and dark field (
Figure 2d) TEM images demonstrate that the grain size in the (Cu) phase after HPT was about 150–200 nm, which was similar to other Cu-based alloys after HPT [
18]. The SAED pattern in
Figure 2c shows that the sample contained only the (Cu) phase. Thus, HPT led to the strong grain refinement in (Cu).
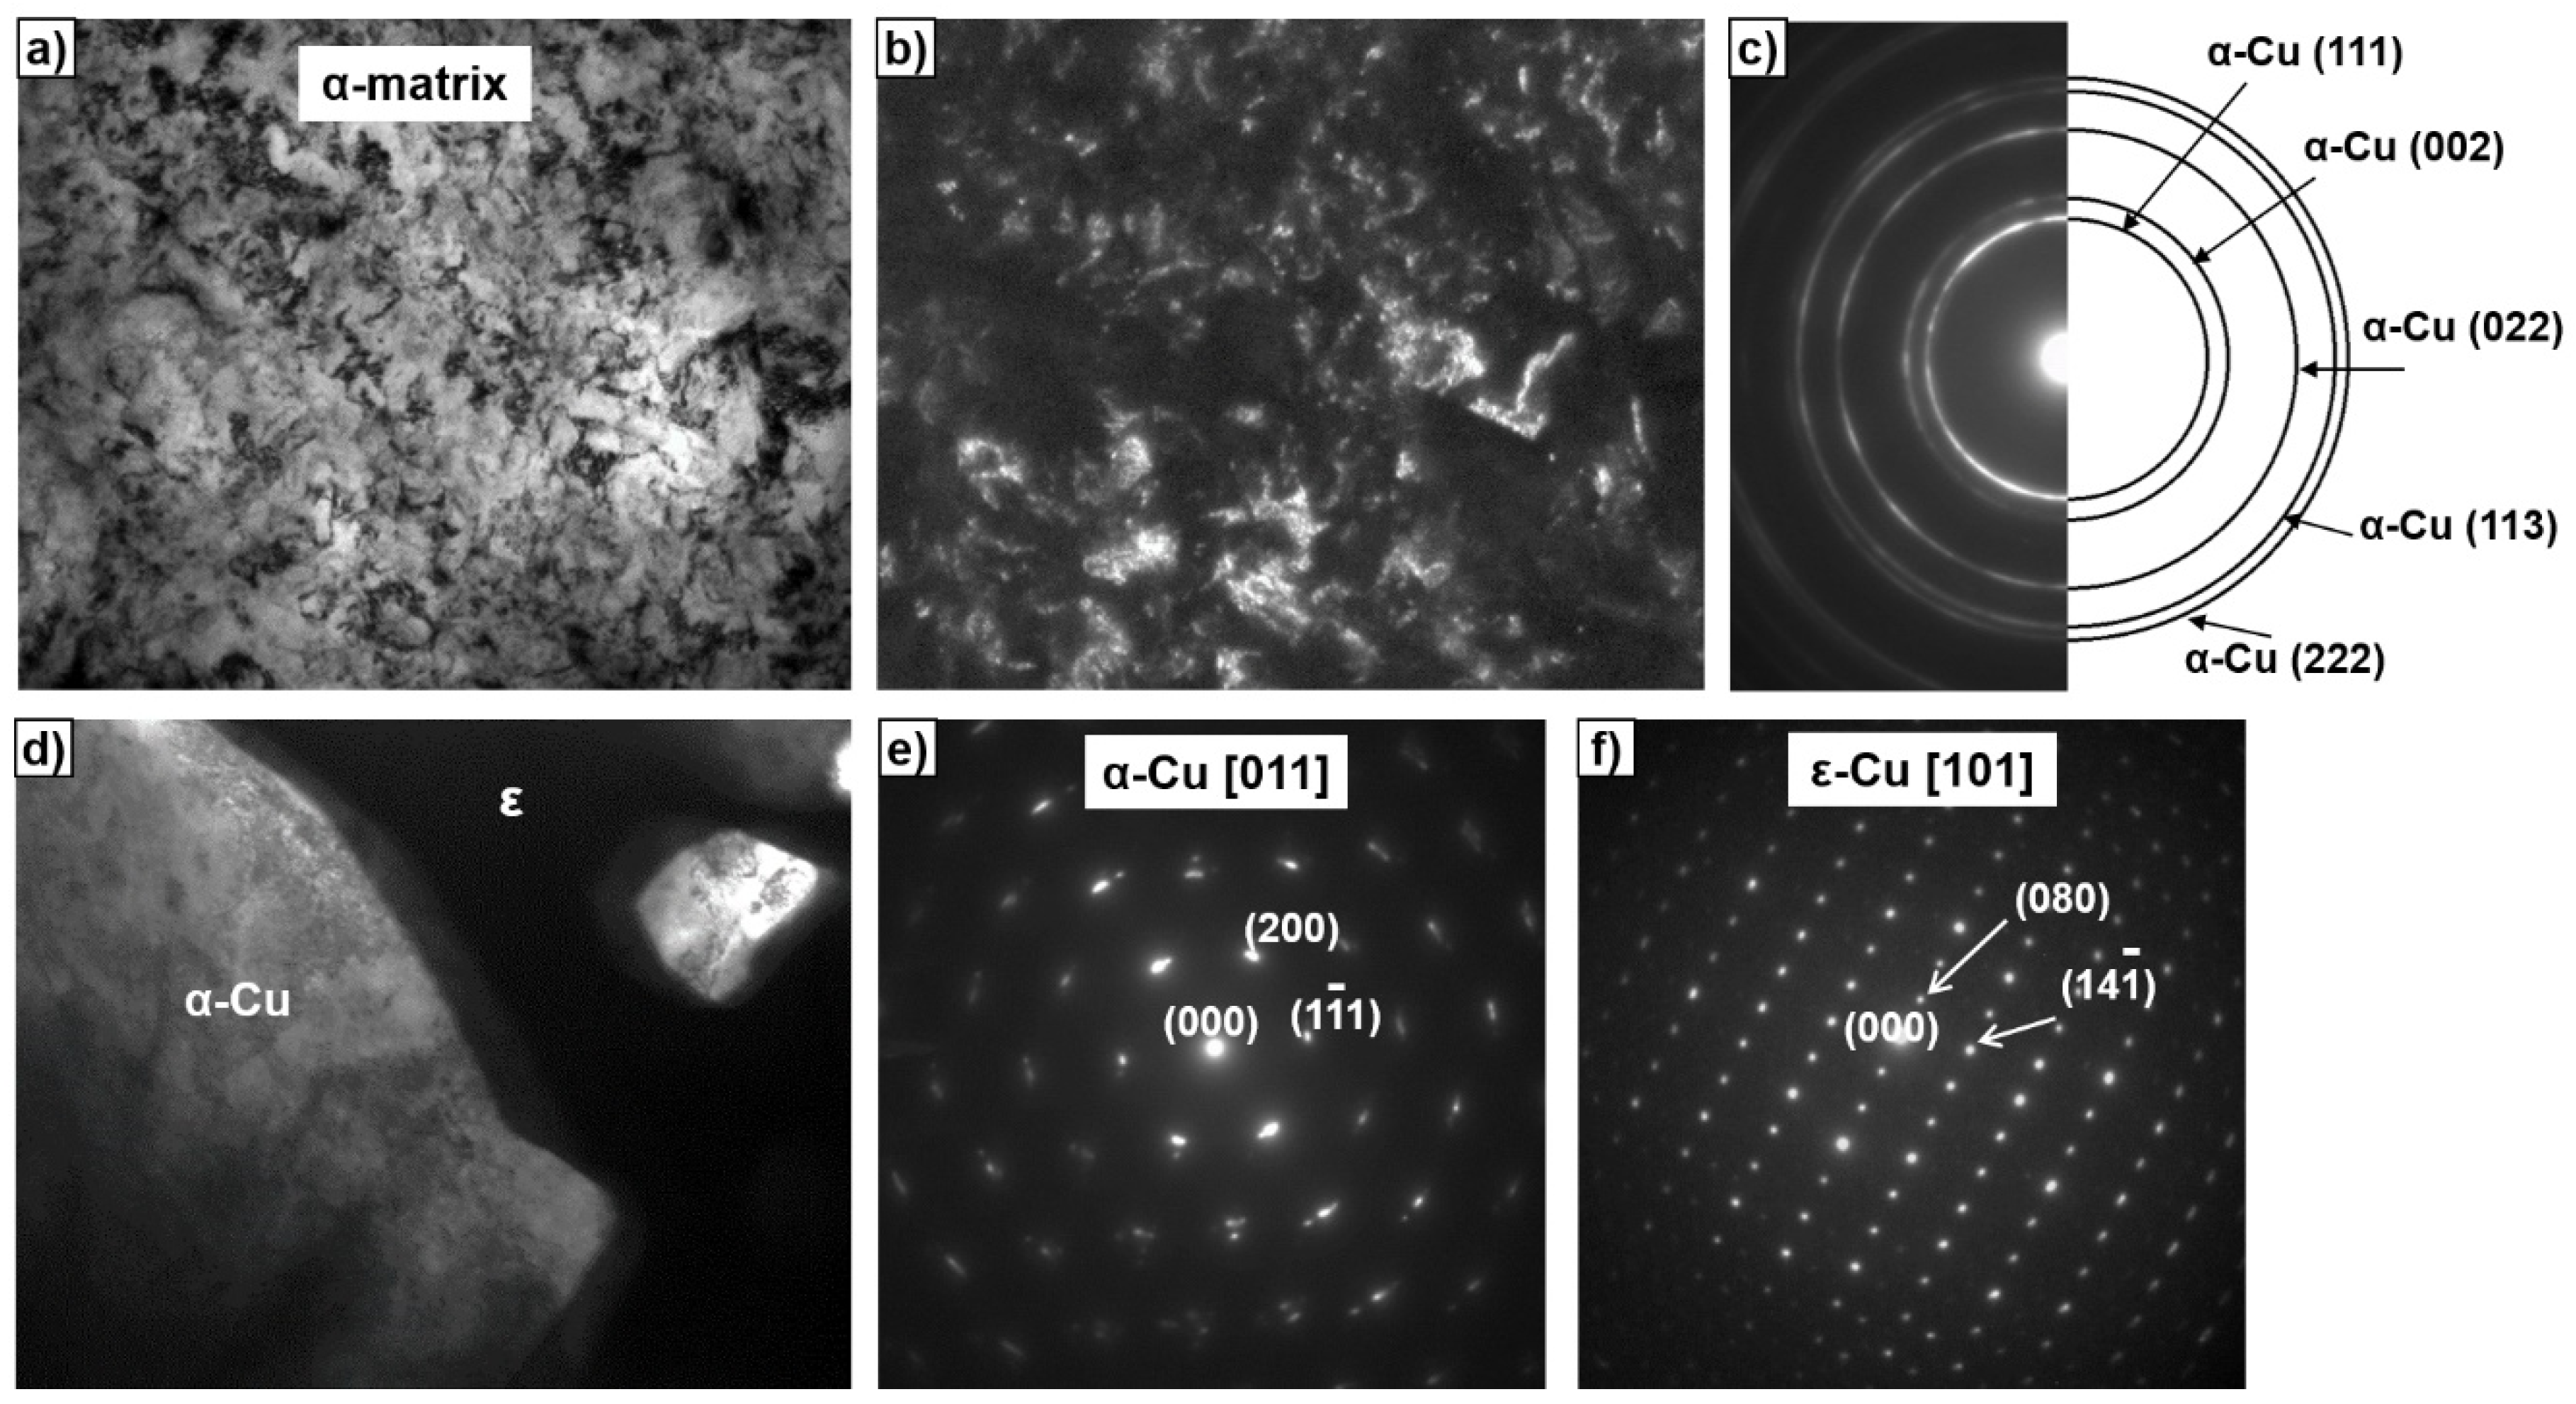
Figure 3 contains the TEM images of the microstructure of the HPT-deformed Cu–14 wt% Sn alloy, pre-annealed at 320 °C for 1200 h. Bright-field (
Figure 3a) and dark-field (
Figure 3b,d) images of the α-matrix of (Cu) solid solution show that the grain size in (Cu) phase after HPT also was about 150–200 nm, as in
Figure 2. The (Cu) grains also were not elongated.
Figure 3d shows the contact area between the α and ε phases. The SAED patterns for these α and ε phases are shown in
Figure 3e,f, respectively.
In
Figure 4a,b, the graphs of hardness are shown for the HPT-deformed samples of the Cu–14 wt% Sn alloy pre-annealed at 320 and 500 °C, respectively. The hardness was measured along the radius, starting from the center of the sample. The hardness in the middle of the sample was lower, and it increased up to a certain steady-state value (shown by the thick horizontal line) at a distance of 1.8 mm for the sample pre-annealed at 320 °C, and at 2.6 mm for the sample pre-annealed at 500 °C.
In
Figure 5, the X-ray diffraction patterns are given for the Cu–14 wt% Sn alloy annealed at 320 °C (red curves) before HPT (top red curve) and after HPT (bottom red curve), as well as at 500 °C (black curves) before HPT (bottom black curve) and after HPT (top black curve). The XRD pattern of the Cu–14 wt% Sn alloy annealed at 320 °C (top red curve) contains peaks for the (Cu) phase and intermetallic phase ε. The peaks are narrow, since the copper and ε grains were quite large (see microstructure in
Figure 1a). After HPT, the copper grains strongly refined (see
Figure 3). As a result, the peaks in
Figure 3b (bottom red curve) broadened. Moreover, the ε peaks became weaker in comparison with the copper peaks, and almost disappeared. This cannot be attributed to just the grain refinement. Indeed, the copper peaks after HPT were shifted toward the lower diffraction angles. In other words, the lattice parameter of the Cu-based solid solution increased. We know that an increase of Sn content in a Cu-based solid solution increases the (Cu) lattice parameter [
17]. This means that a certain part of ε precipitates are diluted in the copper matrix. As a result, the intensity of ε X-rays peaks strongly decreased after HPT.
The XRD pattern of the Cu–14 wt% Sn alloy annealed at 500 °C (bottom black curve) contains only peaks for the (Cu) phase. As we saw from
Figure 2, the amount of ε precipitates was very low, and therefore the ε peaks are not visible in the XRD pattern. The Cu peaks in
Figure 4 (bottom black curve) are narrow, since the copper grains were quite large (see micrographs in
Figure 2a). After HPT, the grains strongly refined (see
Figure 2c,d). As a result, the Cu peaks in
Figure 5 (top black curve) broadened. The ε peaks were not visible after HPT, as before HPT. However, the copper peaks shifted to the right after HPT. This shift to the right was weaker in comparison with the shift to left in the sample annealed at 320 °C (see red curves in
Figure 5). The most clearly visible is the shift of the (111) peak in the black patterns. The shift of the peaks (220) and (222) to the right is also visible. This shift to the right meant that the lattice spacing decreased due to the dissolution of tin in the Cu-based solid solution. The peak shift in the sample pre-annealed at 500 °C was much lower than in the sample pre-annealed at 320 °C. This meant that the amount of tin dissolved in the copper matrix during HPT decreased, and even changed the sign with increasing temperature of pre-annealing. The process of HPT-driven decomposition of a solid solution is very exciting, and has seldom been observed [
7,
10,
17,
18,
19]. Fortunately, a more detailed study of this process is possible in the Cu–Sn system because the maximum solubility of Sn in (Cu) is about 16 wt% Sn. Thus, we plan to produce alloys with higher tin content and investigate the HPT-driven precipitation of tin.
4. Discussion
In our previous works, the HPT of various copper-based alloys with silver, tin, cobalt, etc. dissolved in (Cu) was studied [
18]. The main result of these works was that, independent of the pre-annealing temperature, during the subsequent HPT processing, the alloy always reached the same state with a certain content of the dissolved component. It was only at a certain annealing temperature that the content of the dissolved component did not change. We called this temperature the effective temperature of severe plastic deformation,
Teff. Physically, it means that if we anneal the sample at
Teff, we will get a concentration of the second component dissolved in the copper matrix equal to the concentration in the copper-based solid solution after HPT. This process deserves a thorough theoretic description from various viewpoints and by different methods. In this paper, we made the first attempt at such a description, using the so-called non-equilibrium evolutionary thermodynamics (NEET).
A theoretical approach of non-equilibrium evolutionary thermodynamics was proposed earlier to describe the processes occurring during metal processing by SPD methods [
25,
26,
27,
28]. An important feature of this approach is the existence of a steady state, which is reached by any system subjected to SPD. Such a steady state is reached for all characteristics of the system; for example, for the density of structural defects like dislocations and grain boundaries. The concentration of dissolved component should also reach a steady-state value.
An important condition for the use of the NEET approach is the presence of plastic flow, which is the reason for the generation and annihilation of structural defects. The termination of plastic flow; that is, the transition to the elastic region or even to the absence of external stress, terminates the powers of NEET and the usual classical theory, and perhaps non-equilibrium thermodynamics come into force. The ultimate transition between them is absent in the very essence of the question.
Therefore, some of the phase diagrams in works [
17,
18], associated with annealing, should be constructed within the framework of the classical theory of diffusion phase transitions, and to construct the other part of the phase diagrams associated with SPD, it is necessary to use the NEET approach. In this paper, the calculations of the concentration of the dissolved component were carried out within the framework of the classical theory of phase transitions, which is the initial value for calculating their density in the framework of NEET.
The alloy under study can be described by the formula Cu
1−xSn
x, where
x is the concentration of Sn atoms. The elements Cu and Sn are in different groups and periods of the periodic table, and have different numbers of valence electrons. This circumstance explains the presence of many phases in the Cu–Sn phase diagram [
29]. In particular, the phases that can form include α, α + ε, α + δ, etc., where α is a solid solution of Sn in Cu, ε is a solid solution based on the electronic compound Cu
3Sn, and δ is a solid solution based on the electronic compound Cu
31Sn
8. The ε-phase has a hexagonal lattice, and the δ-phase has a complex cubic lattice. At the point (11%, 320 °C), there is a triple point (bifurcation). It must be underlined that the border between α and α + ε areas is convex, and the border between α and α + δ areas is convex. This indicates a significant difference in the nature of interactions in the alloy. There is an inflection at the bifurcation point. As indicated above, a first-order phase transition (PT) occurs in the region of the bifurcation point; i.e., the symmetry, lattice parameters, and constants of various kinds of interactions change. In the equilibrium phase diagram, such changes are almost invisible. However, the superposition of external severe deformation by HPT made it possible to see this transition. This can be seen in Figure 15 of [
17]. In the dependence of the lattice parameter before and after HPT on the temperature of pre-annealing, an S-shaped section exists. It is located in the region of the bifurcation point. Here, we propose a mathematical description of the effects that appear upon imposition of HPT in the Cu–Sn system.
In the theoretical consideration in this work, we used the virtual crystal model [
30]. In this case, the potential of the alloy is a “weighted” average potential of the alloy components. With this approximation, the potential is periodic. Consequently, it is possible to introduce a generalized vector order parameter (OP), which characterizes the change in the linear dimensions and shape of the elementary cell of the virtual lattice under certain influences. Usually, a linear combination of the displacements of the atoms of the unit cell is taken as the OP. According to Landau’s phenomenological theory, the non-equilibrium thermodynamic potential can be represented as
where
are the phenomenological parameters;
M is the torsion torque applied along the OZ axis;
is the density of defects; and
are the components of the OP vector. The terms with derivatives describe the structure’s inhomogeneities. As shown in [
31], the difference in the values of the exponents is
. Therefore, in what follows, we assume everywhere that
. Since in the plasticity region the value of the torsion torque does not depend on the number of revolutions, we will assume that the value of the torsion torque in the experiment of [
17] did not depend on the number of revolutions.
In accordance with the NEET, the torsion torque M should increase first with increasing strain due to the hardening of the material. Later, M reaches a constant steady-state value. Here, to simplify the calculations, we immediately set it equal to some constant (steady state) value. This circumstance will be taken into account later in more accurate versions of the theory, which will also consider the generation and annihilation of structural defects such as dislocations and grain boundaries.
The system of Euler equations for potential (1) has the form:
We will seek a solution to this system in the form of a spiral structure:
In the approximation of constancy of the OP modulus, we obtain:
Since the process is equilibrium, it follows from (4) that:
Equation (4) is biquadratic with respect to the OP modulus. Substituting (5) into (4), we obtain a quadratic equation for the OP modulus and a physical solution in the form:
Further, it is necessary to estimate what parameters change during the transition from one phase to another, as well as within each phase. Obviously,
change when the phases are changing. The change of α
1 is due to the different value of the phase-transition temperature. The change of α
2 is due to the different values of the lattice parameter of both phases. The change of δ is due to the differences in the interaction between the OP and defects. In addition, it is necessary to take into account the different temperature dependence of the defect density. It turned out that in order to achieve the best qualitative agreement between theoretical and experimental data, it was sufficient to take into account the quantitative change in the
coefficients, the change in magnitude and sign of δ, and the temperature dependence of the density of defects in the form
, where
is a phenomenological coefficient. The exponent
n depends on the difference between the temperatures of annealing and phase transition. Satisfactory results were obtained with the dependence shown in
Figure 6. This graph indicates that, up to the phase-transition temperature, the constant of interaction of the OP with defects first increased and then decreased. The solid line in
Figure 7 shows the
dependence in the absence of HPT. When the annealing temperature and phase transition temperature were equal, an
S-shaped anomaly appeared that was absent in the experimental curve. This difference was apparently due to the large temperature step between corresponding experimental measurements.
It follows from the experimental data that there is a certain critical temperature point
at which the graphs for
and
intersect. This is possible only in the case when the
coefficient depends on the annealing temperature and turns to infinity at
, and
also changes sign when passing through the critical point
. The graph of the
function should be similar to the graph of a
function with a breakpoint of the second kind. The plot of the
dependence under HPT is shown in
Figure 7, with a dotted line under the assumption that the sought dependence has the form:
where
γ3 is a phenomenological parameter. From a comparison of
Figure 7 and Figure 15 of work [
17], it can be seen that there is a qualitative agreement between the experimental and theoretical results. The sign of the propagation vector
(5) also depends on the sign of
. Hence, it follows that when passing through the critical temperature point, the propagation vector
changes its sign, and the spatial rotation of the spiral will be reversed.
The critical temperature point
mentioned above, where the graphs for
and
intersect, corresponds to a steady state according to the concepts of the NEET theory. From
Figure 7, it can be assumed that the steady state, characterized by a certain value of the tin concentration, should depend on the annealing temperature.
Based on the results obtained above, let us consider the behavior of the concentration of tin in a copper matrix when HPT is applied as a function of the annealing temperature
. According to the phase diagram given in [
17], at the lowest annealing temperature, the percentage of Sn is zero. Consequently, in this case, the OP value will correspond to the Cu lattice. With increasing
, an impurity Sn appears in the Cu-based solid solution, and the value of the generalized OP will change.
Since the sum of Cu and Sn concentrations is equal to unity, knowing the expression for the value of the generalized OP as a function of the OP for copper and OP for tin, we can find the dependence of the percentage of Sn on the annealing temperature. In the literature, the formula of the weighted arithmetic mean was mainly used. However, its use did not give a result that coincided with the conclusions of the experimental work [
17]. The best approximation turned out to be a dependence of the form:
where
are the OPs of the Cu and Sn lattices, respectively. According to the above, we will assume that
q1 =
q(
Tann) and, since the lattice parameters of copper and tin are not very different,
, where
β > 0 and is small. The solid line in
Figure 8 shows the result of a numerical calculation in the absence of torsion. This line is convex up to the bifurcation point, and after this point it is concave. Thus, it qualitatively coincides with the corresponding line on the phase diagram [
17]. The dashed line in
Figure 8 shows the result of the numerical calculation of the dependence upon the imposition of the HPT. It is seen that both lines, in accordance with the results of [
17], have vertical asymptotes, which corresponds to steady states.
It should be noted that all the results presented above were based on a potential containing Lifshitz invariants. It is of interest to consider the behavior of the OP in crystals in which these invariants are absent. In this case, the potential density for the two-component order parameter has the form:
The last term describes the interaction between the OP distortions along different axes. The extremum of a functional of the form (9) is found using the system of Euler–Poisson equations. As a result, we get:
Consider the behavior of the system at
. We will seek a solution in the form (3). We have:
It follows from here that:
After substituting (12) into (11), we obtain an equation similar to (4). Consequently, most of the conclusions drawn using a potential with Lifshitz invariants are also valid in this case. However, in this case, the intersection of the curves before and after the imposition of the HPT is impossible, since, according to (12), the sign changing of is impossible due to the nonnegativity of the square of the propagation vector.
Taking into account the coefficient for determining the modulus of the propagation vector, a transcendental equation is obtained, in which the OP modulus is explicitly included. Hence, it follows that the terms at describe the appearance of multiple harmonics in the process of torsion.


 ,
, 