Article

Influence of the Curing and Annealing Temperatures on the Properties of Solution Processed Tin Oxide Thin Films

Advanced Display Research Center, Department of Information Display, Kyung Hee University, Seoul 02447, Korea
*
Author to whom correspondence should be addressed.
Crystals 2021, 11(8), 851; https://doi.org/10.3390/cryst11080851
Submission received: 31 May 2021 / Revised: 16 July 2021 / Accepted: 19 July 2021 / Published: 22 July 2021
(This article belongs to the Special Issue Grain Size Control in the Processing of Poly-Crystalline Materials)

Abstract

:
We report the effect of the curing (Tcuring) and annealing (Tanneal) temperatures on the structural, electrical, and optical properties of solution processed tin oxide. Tanneal was varied from 300 to 500 °C, and Tcuring from 200 °C to Tanneal. All Tanneal lead to a polycrystalline phase, but the amorphous phase was observed at Tanneal = 300 °C and Tcuring ranging from 250 to 300 °C. This could be explained by the melting point of the precursor (SnCl2), occurring at 250 °C. The crystallinity can be effectively controlled by the annealing temperature, but the curing temperature dramatically affects the grain size. We can reach grain sizes from 5–10 nm (Tcuring = 200 °C and Tanneal = 300 °C) to 30–50 nm (Tcuring = 500 °C and Tanneal = 500 °C). At a fixed Tanneal, Hall mobilities, carrier concentration, and conductivity increased with the curing temperature. The Hall mobility was in the range of 1 to 9.4 cm2/Vs, the carrier concentration was 1018 to 1019 cm−3, and the conductivity could reach ~20 S/cm when the grain size was 30–50 nm. The optical transmittance, the optical bandgap, the refractive index, and the extinction coefficient were also analyzed and they show a correlation with the annealing process.

1. Introduction

With the emergence of oxide semiconductors for optoelectronic devices, various materials have been investigated. Like indium gallium zinc oxide (IGZO) [1], they usually use two or three cations that have an empty ns orbital (n ≥ 4) [2] and can reach high mobilities (~10 cm2/Vs). Yet, they are usually amorphous. On the other hand, single cations oxides semiconductors like In2O3, ZnO, or SnO2 are polycrystalline and demonstrate higher electrical performances with higher device mobilities [3]. In particular, SnO2 and doped SnO2 (with F or Sb) [4,5] has been a semiconductor applied to transistors [3,6,7,8,9,10,11], for gas sensing applications [12,13], but also more recently to perovskite solar cells [14,15,16,17,18,19,20,21].
For large area electronics, vacuum processing is usually preferred due to the high yield production. In vacuum processing, the substrate temperature, the partial pressure, and/or the total pressure are processing parameters before the annealing step [22,23,24]. However, vacuum processing requires high investments and maintenance costs. Non-vacuum processing like spin-coating [6,25], inkjet printing [26] have demonstrated competitive results with the vacuum processing materials and devices.
In the solution processing, like spin-coating, thin film formation follows the following steps: the preparation/fabrication of the precursor solution, the coating followed by the curing (steps (repeated until a target thickness is obtained [6]), and finally the annealing. Yet, if the annealing temperature [25] has usually an influence on the physical, chemical, electrical, and optical properties, there are too few investigations of the impact of the curing temperature on the properties of the thin films.
Various studies have demonstrated a substantial correlation between the grain size and the electrical, the optical properties of SnO2, and the maximum process temperature. The increase in electrical conductivity, carrier concentration, and mobility is understood to be correlated to the increase in crystallinity and crystal size of SnO2 [27]. The crystal size also depends on the film thickness [28].
S.-S. Lin et al. showed the effect of the substrate temperature when fabricating SnO2 thin films by sputtering. At a substrate temperature of 400 °C, the carrier concentration was 3.3 × 1018 cm−3, the mobility was 7.26 cm2/Vs and the resistivity was 2.58 × 10⁻¹ Ωcm. A substrate temperature of 500 °C leads to a carrier concentration of 1.7 × 1018 cm−3, an electrical resistivity of 6.78 × 10⁻² Ωcm and a mobility of 54.3 cm2/Vs. The films had a preferred (101) orientation and an optical bandgap of 3.5 eV [29].
Hydrophilic porous SnO2:H2O thin films deposited by the sequential ionic layer adsorption and reaction (SILAR) method demonstrated a high roughness (over 200 nm) with crystals of ~15 nm [30] and a high resistivity (107 Ωcm at room temperature). On the other hand, it is possible to obtain films with mobility of 8.6 cm2/Vs after annealing at 500 °C from SnCl2·H2O precursors [31].
G.K. Deyu et al. showed that SnO2 films made by spray pyrolysis and using SnCl4·H2O precursors could lead to films with mobility of ~23 cm2/Vs and a carrier concentration of ~1020 cm−3. They could achieve grains over 142 ± 27 nm [32]. S.-S. Lin et al. used SnCl4 as precursors for SnO2 and reported thin films with a grain size of ~31.8 nm. They used spray pyrolysis at a substrate temperature of 400 °C. The preferred crystal orientation was (211), but the electrical properties were not reported. The films had a band gap of ~4 eV [33]. The nebulized spray pyrolysis method using a precursor solution prepared with SnCl4·H2O at a substrate temperature of 450 °C lead to SnO2 thin films with a (110) preferred orientation, crystal sizes of ~38 nm, a Hall mobility of ~18 cm2/Vs, a carrier concentration of 5 × 1019 cm−3, and an optical bandgap of 3.75 eV [34]. Spray pyrolysis at 430 °C of solutions made with SnCl4 lead to SnO2 films with a (211) preferred orientation. The films demonstrated a carrier concentration of 2.343 × 1018 cm−3 and a mobility of 57 cm2/Vs [35]. The SnCl2·H2O precursor led to ultrasonic sprayed pyrolyzed SnO2 that had a (110) preferred orientation [36].
Dip-coated and 150 °C annealed SnO2 films demonstrated an optical bandgap of 3.8 eV and a (211) preferred crystal orientation. SnCl2·H2O was used as the precursor [37]. Kim and Oliver used sputtering and showed an amorphous SnO2 with a mobility of ~6 cm2/Vs, a carrier concentration of ~2 × 1020 cm−3, and a conductivity of ~160 (Ωcm)−1. The polycrystalline counterpart showed similar mobilities, but smaller carrier concentrations (less than 1 × 1020 cm−3) and conductivities (less than 40 (Ωcm)−1) [38]. Sputtered SnO2 could have a mobility ~15 cm2/Vs and a carrier concentration of 4 × 1019 cm−3 when rapid thermal annealing (RTA) at 450 °C was performed [39]. Microwaved annealing on sputtered SnO2 thin films could lead to thin films with the (211) preferred orientation, a Hall mobility of 16.1 cm2/Vs, and a carrier concentration of 2.6 × 1017 cm−3 [40].
For perovskite solar cells, plasma assisted atomic layer deposition of SnO2 led to crystallite sizes of ~25 nm, a carrier concentration in the 1019 cm−3 range, and mobilities of 35 cm2/Vs [20]. SnO2 fabricated by PEALD had crystals in the ~50 nm range size, bandgaps of 3.95 eV, a Hall mobility of 27 cm2/Vs, and a carrier concentration of 4 × 1019 cm−3 [24].
Doping with F has been a successful strategy to obtain low resistivity. With F doping of 15%, Peale et al. reported solution processed thin films with resistivity of ~1 mΩcm, a mobility ~10–15 cm2/Vs, and a carrier concentration above 1020 cm−3 [41]. We note also the preferred (200) orientation of the films. Without doping, their films had a resistivity of ~0.6 Ωcm. Using tin hydroxide nitrate based precursors, Nadarajah et al. reported undoped SnO2 thin films crystallizing at 300 °C, but the films did not show any electrical properties even at higher annealing temperatures. F incorporation was necessary to reach sufficiently high carrier concentrations [42]. When SnO2 is doped with 10% of F, an annealing temperature of 350 °C leads to the resistivity in the mΩcm range, a carrier concentration of 4 × 1019 cm−3, and a mobility of ~1 cm2/Vs [42].
In reported TFTs, we note that the (110) preferred orientation [7] leads to TFTs with mobilities of 40 cm2/Vs. The preferred (101) leads to ambipolar behavior [10], while the oxygen flow rate could control the p- or n-type character of tin oxide [11]. High field-effect mobility of 147 cm2/Vs was obtained with the (110) preferred orientation [9]. SnCl4·H2O used as the precursors for SnO2 TFT and led to crystals of 10.5 nm in size, an optical band gap of 3.66 eV, and a (110) preferred crystal orientation. The annealing temperature was 300 °C. The TFTs demonstrated a mobility of ~5.96 cm2/Vs [8].
From our previous study on amorphous tin oxide [6], we wanted to know if there was a range in the process temperature to obtain an amorphous phase. Also, as in the case of IGZO, it was important to compare the properties of the amorphous phase and the polycrystalline phase for further applications. In this study, we demonstrate the role of the curing (Tcuring) and the annealing (Tanneal) temperatures on the optical (transmittance and optical bandgap), electrical (Hall mobility, carrier concentration, and conductivity), and physical properties (crystallinity, grain size, and morphology) of SnO2 thin films made by spin-coating. We show that the curing step has a high impact on the final properties at a fixed annealing temperature. Also, we focus on the thin film properties and leave the device fabrication and analysis for another study.

2. Materials and Methods

We fabricated the 0.2 M SnO2 precursor solution by mixing SnCl2 with acetonitrile and ethylene glycol (35% and 65% in volume). The solution was then stirred overnight. The glass substrates were cleaned with acetone, and ultrasonication in isopropanol for 10 min, and dried under flowing N2. The solution was then spin-coated at 2000 rpm, cured at 100 °C for 5 min, and again cured at a Tcuring for 5 min. The coating and curing steps were repeated once. The sample was then annealed in air at Tanneal for 2 h. When Tanneal was 300 °C, Tcuring was 200, 220, 250, 280, or 300 °C. When Tanneal was 400 °C, Tcuring was 200, 300, or 400 °C. When Tanneal was 500 °C, Tcuring was 200, 300, 400, or 500 °C.
We evaluated the surface morphology by scanning electron microscopy (SEM) with a Hitachi S-4700. The surface roughness was evaluated by atomic force measurement (AFM) with a Park System Xe-7 with the tapping method on a 1 μm × 1 μm surface. The optical properties (transmittance, n, and k) and the thicknesses of the thin films were evaluated with a Jobin YVON -Uvisel ellipsometer in the 1.5–5 eV range. The Hall effect was measured with an Ecopia HMS-3000. At least 10 points were evaluated for averaging. We used the Van der Pauw geometry for the measurements. We measured the crystallinity by X-ray diffraction (XRD) by using the Cu Kα radiation at a wavelength of 1.54 Å. Thermogravimetric analysis was measured with a TG-DTA STD Q600 under N2 atmosphere. The temperature was raised at a rate of 10 °C/min.

3. Results and Discussions

Figure 1 shows the thermogravimetric and the differential thermal analysis of the precursor SnCl2. Three routes were analyzed: when the temperature increased (a) once from room temperature (RT) to 500 °C, (b) from RT to 220 °C, then decrease to RT, then increase to 300 °C, (c) from RT to 280 °C, then decrease to RT, then increase to 300 °C. In route (a) the weight percentage decreases monolithically down to 20% [43], while the temperature difference shows an endothermic peak at 254 °C. The peak shows the melting of SnCl2. As shown in route (b), we also observe the melting related peak at 253 °C. On the other hand, when following route (c), the peak at 253 °C is still observed, but on the cooling, we observe an exothermic peak by 225 °C, which we understand demonstrates the recrystallization of the powder. Then, when increasing to 300 °C, the endothermic peak appears at a slightly lower temperature of 251 °C. We note that up to 400 °C, the weight variation is less than 10%.
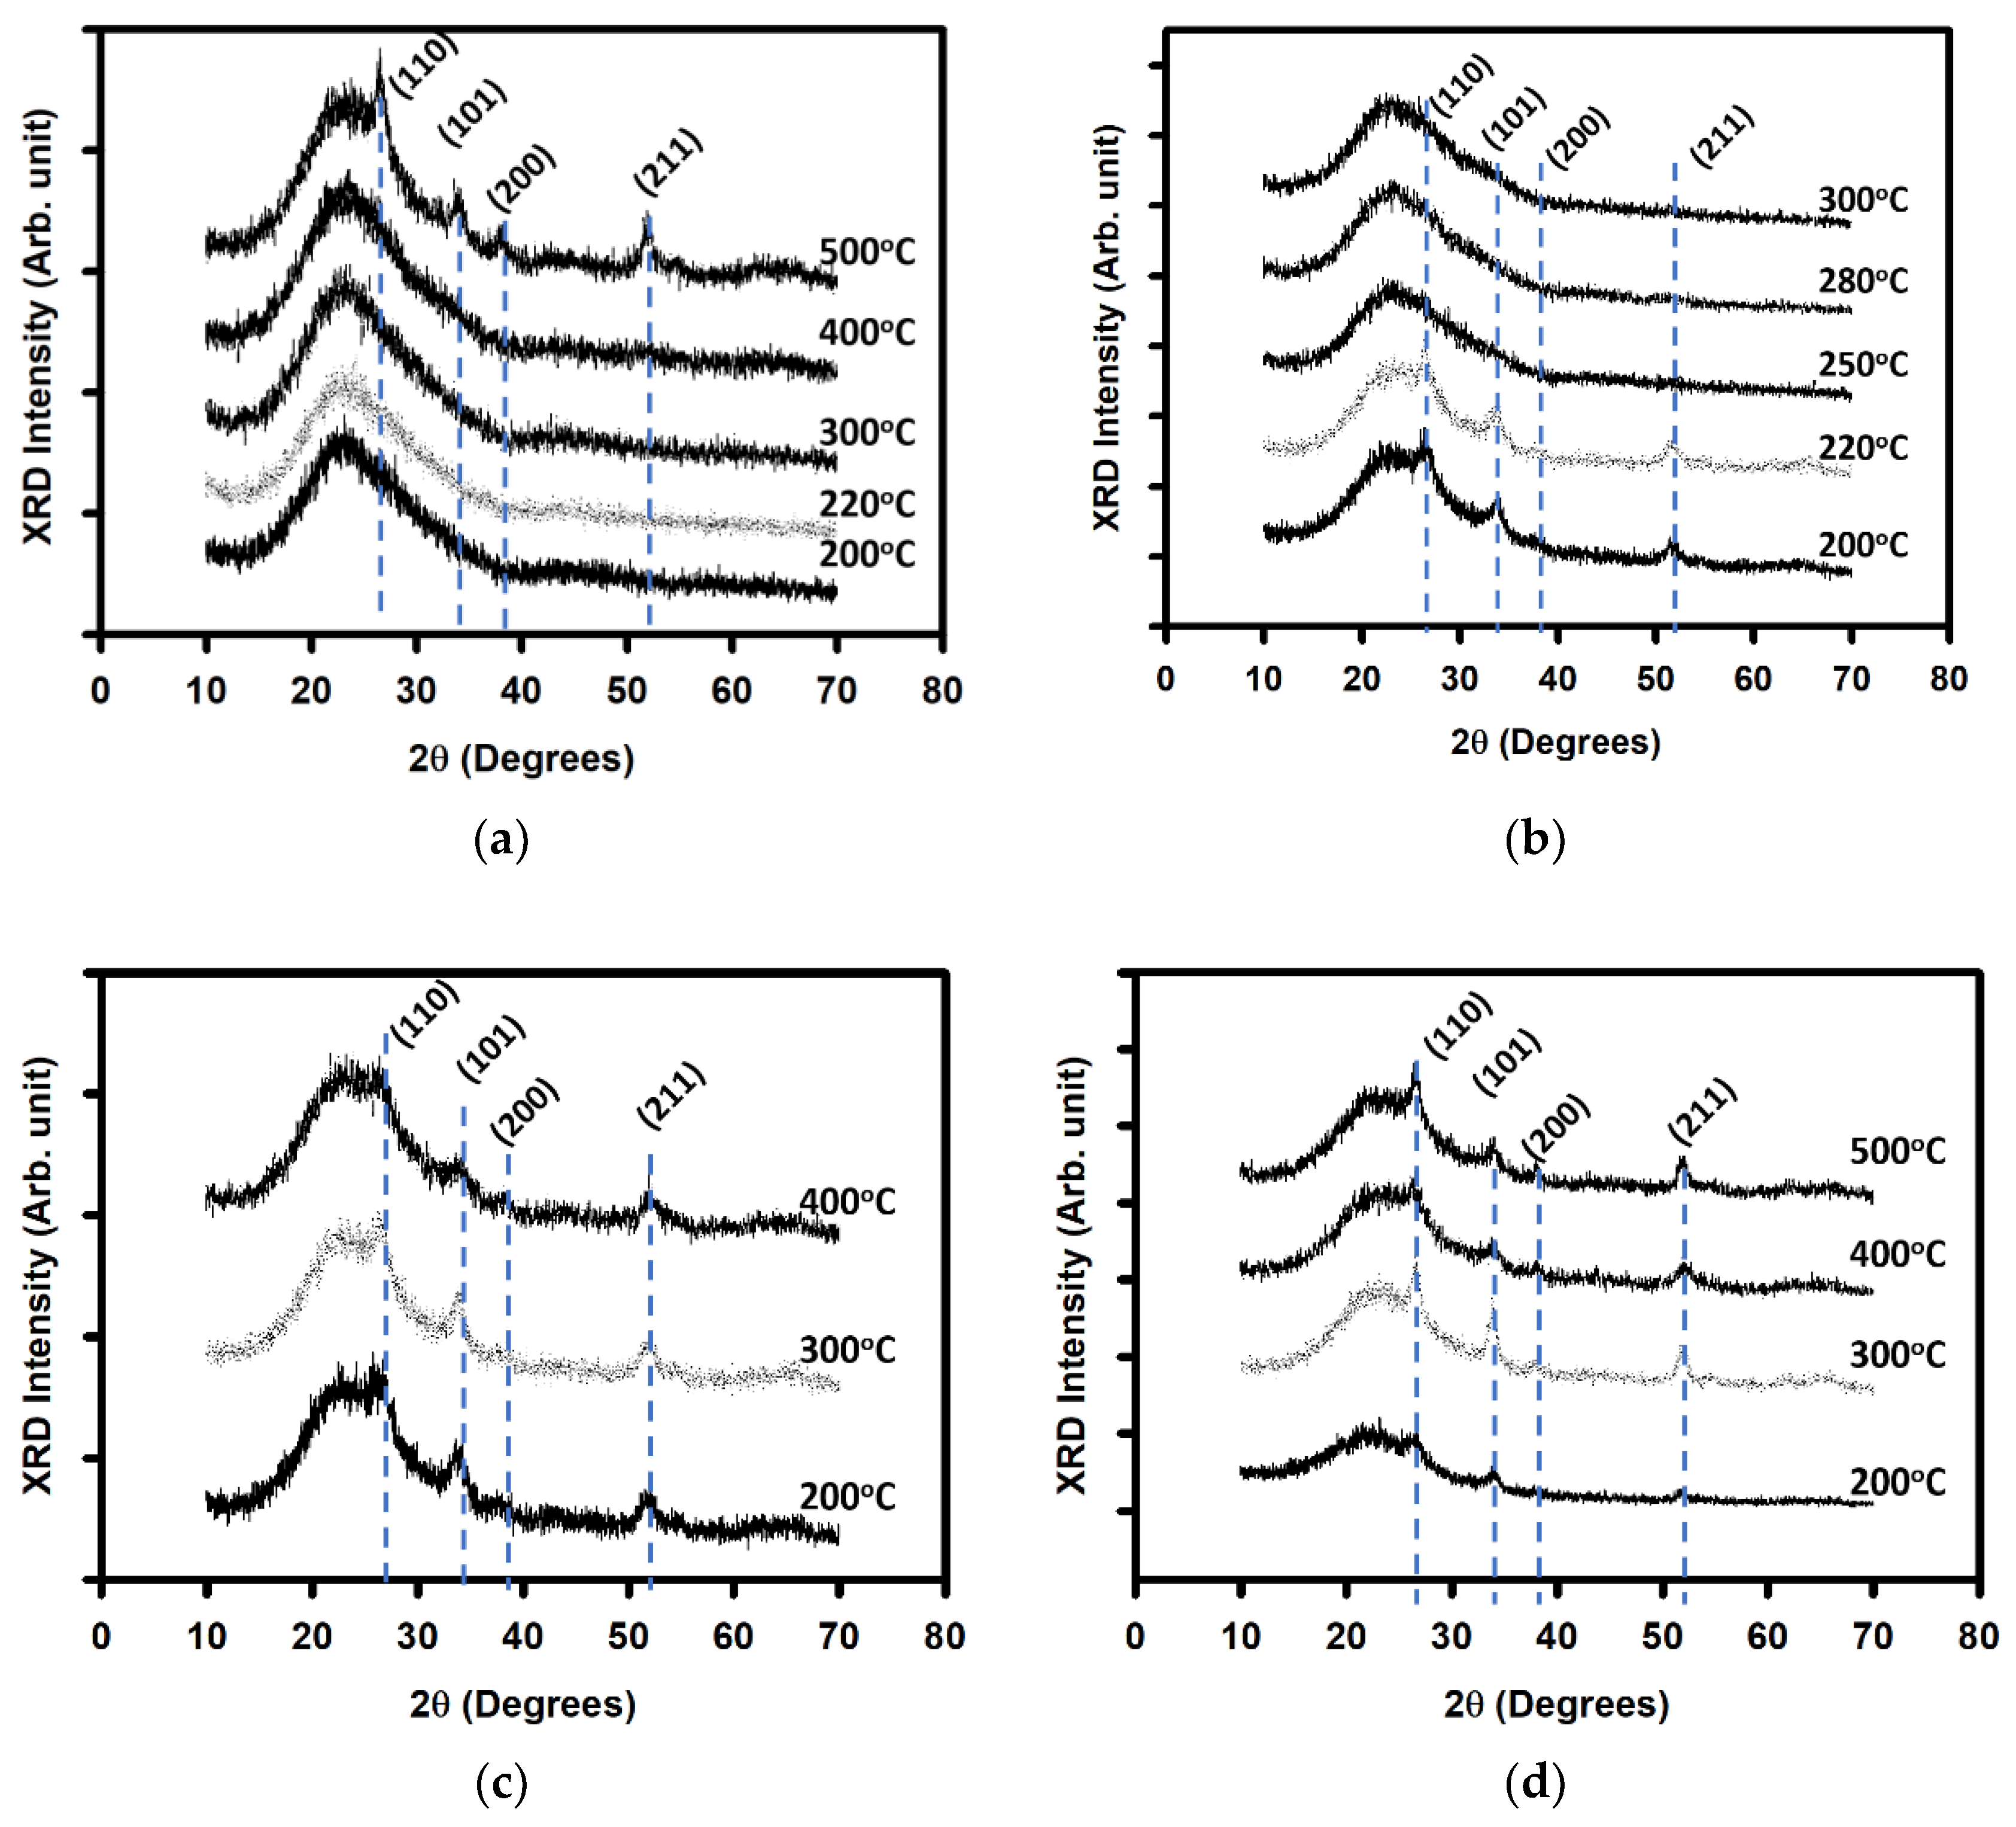
Figure 2 shows the diffraction patterns of SnO2. Before curing (Figure 2a) the sample cured at 500 °C shows the (110), (101), (200), and (211) peaks associated with polycrystalline SnO2. They are located at 26.87, 33.61, 36.93, and 51.93°, respectively. We observe that for Tanneal at 300 °C, a Tcuring of 200 or 220 °C would lead to the polycrystalline SnO2, while when Tcuring is in the range 250–300 °C, an amorphous phase is formed (see Figure 2b). We previously reported the amorphous phase when Tcuring was 280 °C and Tannealing was 300 °C [6]. Therefore, there is a Tcuring range to obtain the amorphous phase of SnO2. On the other hand, independent of Tcuring, annealing at 400 (Figure 2c), or 500 °C (Figure 2d), polycrystalline SnO2 is formed. We note that at Tcuring = Tanneal = 500 °C, we observe a (110) preferred orientation, which was reported to lead to high mobility TFTs [9]. The presence of a process window leading to an amorphous phase for a polycrystalline material has been previously observed. Tin oxyhydroxide led to an amorphous tin oxide phase for annealing temperature between 500 and 700 K [44]. In the present study, the process window is for the Tcuring and not the Tanneal. Also, as introduced before, the preferred orientation depends on the fabrication process and the process temperature. We note that spray pyrolysis could lead to (211) orientation [33,35], or (110) [34,36]. Also, we note that the TFTs leading to the highest mobility had a (110) preferred orientation [7,9]. We extracted the crystalline size from the Scherrer equation:
D = 0.9 λ β c o s θ ,
where D is the crystalline size, λ the wavelength of the incident CuK α   line, β is the full width at half maximum (FWHM), and θ is the Bragg angle. The crystallites are ~7 nm at Tanneal =300 °C, ~9 to ~17 nm at Tanneal = 400 °C, and ~8 to ~18 nm at Tanneal = 500 °C.
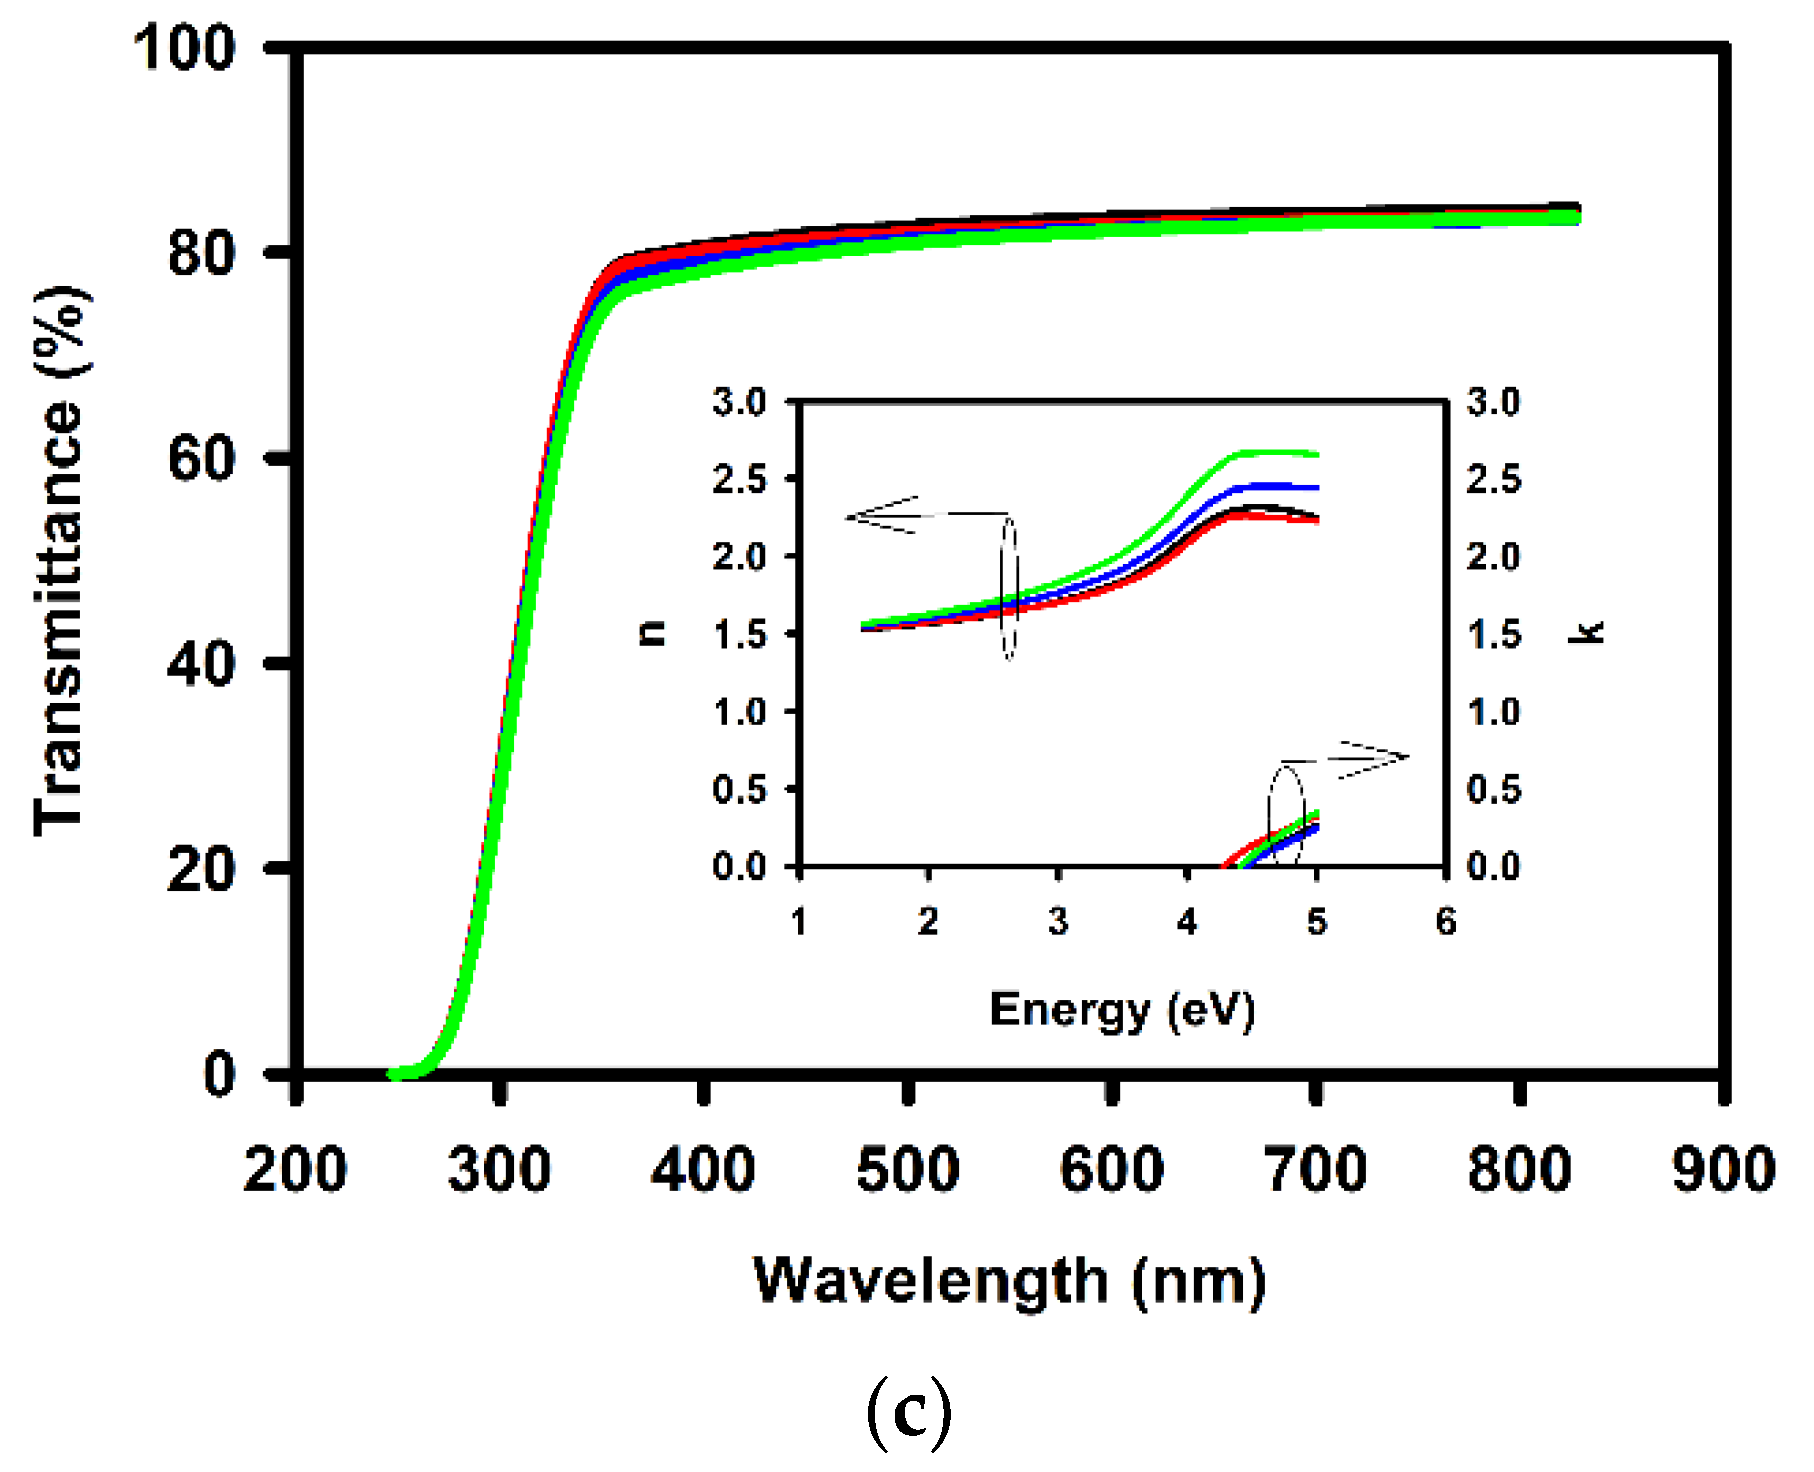
Figure 3 shows the transmittance of the thin films. First, we observe that the thin films annealed at 300 °C and cured in the 250–300 °C range show a higher transmittance than their 200 and 220 °C annealed sample counterpart (see Figure 3a). At 550 nm, only the thin film with Tcuring = 200 °C and Tanneal = 300 °C has a transmittance of 78.10%, lower than 80%. Second, at Tanneal of 400 (Figure 3b) and 500 °C (Figure 3c), the transmittance is over 80%.
The inset of each figure shows the refractive index and the extinction coefficient as a function of the energy. The maximum refractive index in the visible region is 2 to 2.8 for polycrystalline SnO2, and above 3 for amorphous tin oxide. The refractive index taken at 1.95 eV (corresponding to a wavelength of 633 nm) [24] has a value of 1.5 to 1.7, which is smaller than the reference handbook value of 2.06 eV [45]. A lower value was previously attributed to lesser dense films [24]. We previously reported the density of a-SnOx to be 5.29 g/cm3 [6], a value smaller than the handbook value of 6.45 g/cm3 [24,45]. Relating to the TGA data, up to 400 °C the material mass loss is less than 10%, but at 492 °C, ~78% of the total mass is lost, denoting the poor reactivity of the material at a temperature below 400 °C [43,46].
The optical band gap (Eg) can be extracted by the Tauc plot [47,48,49]:
(αhν)n = A (hν − Eg),
where α is the absorption coefficient, h the Planck constant, ν the frequency of the incident light, A is a proportional coefficient, and n is an exponential coefficient. Usually, n = 2 (for possible direct transitions), and n = 1/2 (for possible indirect transitions) are used for the evaluation of the optical bandgaps [50,51]. Various methods exist to extract the absorption coefficient. One method consists of using the extinction coefficient k because [50,52]:
α = 4πk/λ,
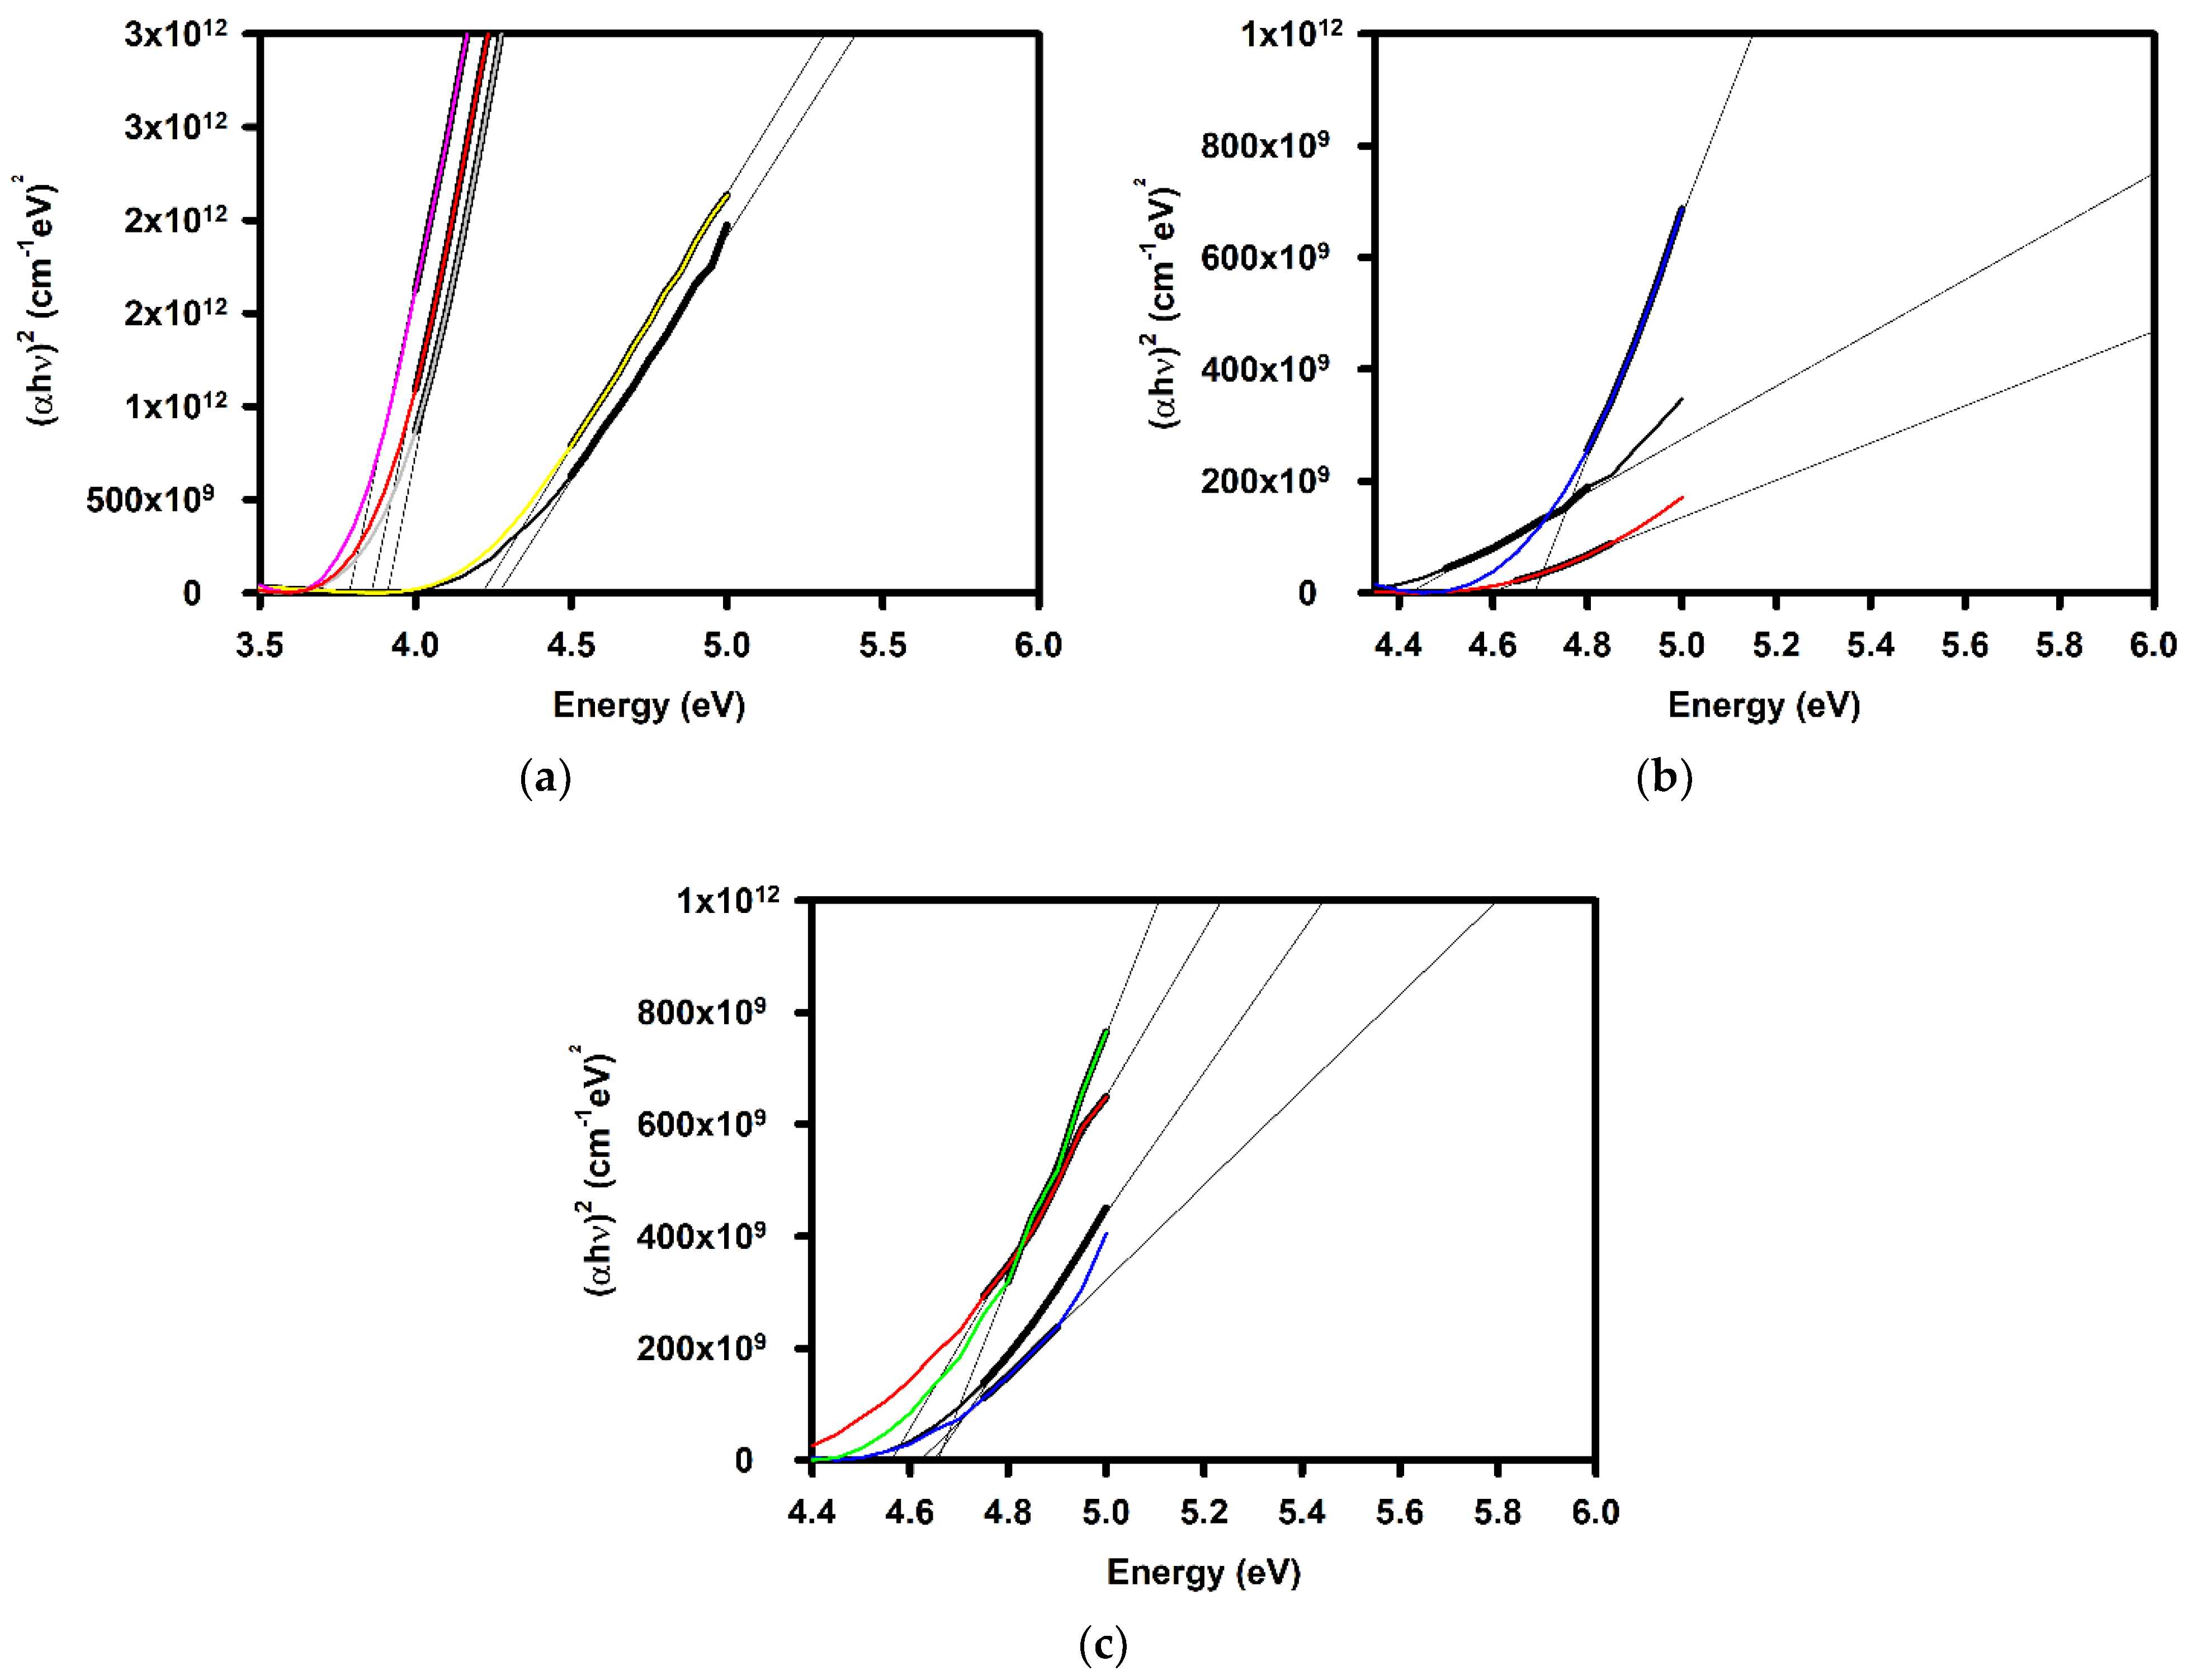
where λ is the wavelength. Nevertheless, the energy at which the absorption increases, (i.e., when k becomes positive), can help identify the optical bandgap [53]. The extraction of the bandgap from the extinction coefficient has been used for semiconductors and insulators [46,54,55,56,57]. So; we compared the values of the optical bandgap (Eg) extracted either at k = 0 or from the Tauc plot. The Tauc plots are shown in Figure 4. At Tanneal = 300 °C, the Eg extracted from the k = 0 method (the Tauc plot) showed a value of ~3.9 (~4.2) eV for the polycrystalline SnO2, while the amorphous tin oxide thin films have a smaller bandgap of ~3.6 (3.78 to 3.91) eV. At Tanneal = 400 °C, the extraction from the k = 0 method (the Tauc plot) led to values of Eg of 4.25 (4.42), 4.4 (4.59), and 4.45 (4.69)eV, when Tcuring was 200, 300, and 400 °C, respectively. At Tanneal = 500 °C, the values were 4.45 (4.64), 4.3 (4.56), 4.45 (4.62) and 4.4 (4.66)eV, when Tcuring was 200, 300, 400, and 500 °C, respectively. The k = 0 method leads to relatively smaller values of the bandgap. The difference lies in the extraction methodology: in the Tauc plot method, the value is extracted from a linear part of the (αhν)2 plot, while the value extracted from the k = 0 method is taken at k = 0. The difference in the values has also been reported before [53]. We note that J. Gong et al. showed that the optical bandgaps increased from 1.2 to 3.7 eV when the annealing temperature increased from room temperature to 600 °C for thermally evaporated SnO2 [58].
Figure 5 shows the results of the measurements of the electrical properties by the Hall effect. Figure 5a shows the variation of the carrier concentration as a function of the curing temperature at various annealing temperatures. At a fixed Tanneal, the carrier concentration increases with Tcuring. At Tanneal = 300 °C the carrier concentration was 3.88 ± 0.73 × 10¹⁸, 7.22 ± 0.42 × 10¹⁸, and 8.46 ± 0.30 × 1018 cm−3 when Tcuring was 250, 280, 300 °C. At Tanneal = 400 °C the carrier concentration was 4.05 ± 1.49 × 10¹⁸, 4.97 ± 0.85 × 10¹⁸, 5.46 ± 1.34 × 1018 cm−3 when Tcuring was 200, 300, 400 °C At Tanneal = 500 °C the carrier concentration was 5.02 ± 3.09 × 10¹⁸, 7.50 ± 0.31 × 10¹⁸, 9.38 ± 0.26 × 10¹⁸, and 14 ± 0.94 × 1018 cm−3 when Tcuring was 200, 300, 400, and 500 °C.
Similarly, the mobility and the conductivity increased with Tcuring at a fixed Tannealing as shown in Figure 5b,c. At Tanneal = 300 °C the mobility was 1.00 ± 0.12, 3.61 ± 0.19, and 5.02 ± 0.49 cm2/(Vs) when Tcuring was 250, 280, 300 °C, respectively. At Tanneal = 400 °C, the mobility was 1.08 ± 0.55, 1.96 ± 0.27, 4.49 ± 0.88 and cm2/(Vs) when Tcuring was 200, 300, 400 °C, respectively. At Tanneal = 500 °C, the mobility was 1.14 ± 0.69, 2.49 ± 0.16, 5.76 ± 0.19, 9.4 ± 0.1 cm2/(Vs) when Tcuring was 200, 300, 400, and 500 °C. At Tanneal = 300 °C, the conductivity was 4.07 ± 1.65, 4.19 ± 0.44, and 6.78 ± 0.44 Scm−1 when Tcuring was 250, 280, 300 °C. At Tanneal = 400 °C, the conductivity was 0.62 ± 0.23, 1.53 ± 0.01, and 3.36 ± 0.12 Scm−1 when Tcuring was 200, 300, 400 °C At Tanneal = 500 °C, the conductivity was 0.85 ± 0.17, 2.99 ± 0.19, 8.65 ± 0.09, and 21.10 ± 1.21 Scm−1 when Tcuring was 200, 300, 400, and 500 °C.
Interestingly, the amorphous SnO2 demonstrates higher electrical performances than its polycrystalline counterparts at a curing temperature of 300 °C, as was reported for IGZO [1], where the amorphous phase demonstrated higher Hall mobility than the crystalline phase. As presented in the introduction, the precursor and the method of fabrication have an impact on the electrical properties. Spray pyrolysis has been shown to provide high Hall mobilities (over 10 cm2/Vs) with a preferred (211) orientation [32,35]. Our results are similar to the SnO2 fabricated by the SILAR method [31]. We note nonetheless that our films are less than 50 nm, (compared to the >100 nm layers used by spray pyrolysis) and with thicker layers, the electrical conductivity may increase [28].
In Figure 6, we show the SEM and AFM images taken for Tcuring = Tanneal = 300 °C, (a and b), 400 °C (c and d), and 500 °C (e and f), respectively. All samples show some porosity, typical of solution processing [59]. The surface of the thin film annealed at 300 °C is amorphous, while the two others are polycrystalline. The surface of the 400 °C annealed film shows a better uniformity in grain size than the other polycrystalline film. Interestingly, on the surface of the Tcuring = Tanneal = 500 °C, several grains seem to reach ~50 nm, yet the majority of the grains are ~10 nm. However, as shown in the inset of Figure 6e, some of the ~50 nm grains are actually made of smaller grains being ~10 nm in size. This confirms the grain size value extracted by the calculation from the Scherrer equation. The AFM images confirm the amorphous (Figure 6b) and polycrystalline phase (Figure 6d,f) of SnO2. Both polycrystalline SnO2 show a variation in height, which could be evaluated with the peak to valley roughness (Rpv). They were 10.266, and 36.022 nm for the film annealed at 400, and 500 °C, respectively. The surface smoothness was evaluated with the RMS roughness (RRMS). The RRMS were 0.154, 1.020, and 1.566 nm for the films annealed at 300, 400, and 500 °C, respectively.
Considering all conditions, the surface RMS roughness (Rrms) was between 0.154 and 1.566 nm. Interestingly, for the amorphous SnO2 (Tanneal = 300 °C and Tcuring from 250 °C to 300 °C), the peak to valley roughness (Rpv) was below 2.3 nm, while the polycrystalline SnO2 had peak-to-valley from 4.9 to 36 nm. The various values are gathered in Table 1. We note that the grain sizes were in the range 5 to 10, 10 to 30, and 15 to 50 nm at Tanneal of 300, 400, and 500 °C, respectively. Nevertheless, the AFM images could not reveal the morphology of the bigger grains. This could lead to overestimation in the size of the grains, and also, because of the difference in height (Rpv), there could also be a misinterpretation in the assessment of the various grain sizes. As a comparison, only the spray pyrolyzed SnO2 at 420 °C could lead to a bigger grain size of 142 ± 27 nm, but had a (211) preferred orientation [32].
Therefore, we can understand that the smooth surfaces of the amorphous tin oxide thin films can explain in part the high mobility of the thin films, while the bigger grains can control the higher mobility and conductivity of the polycrystalline tin oxide.
Therefore, we understand that Tcuring is a dominant factor when annealing at 300 °C. When the Tcuring is smaller than the melting point, then there is no reorganization of the material, and the crystallization of SnO2 is favored. When Tcuring is at least equal to the melting temperature, then the multiple melting and recrystallizations could favor a random disposition of the atoms further leading to the amorphous phase of SnO2. At higher Tanneal, Tcuring influences all properties, and the higher the Tcuring, the higher the electrical properties and the grain sizes.

4. Conclusions

We report the impact of the curing and annealing temperature on the electrical, physical and optical properties of solution processed SnO2. We report that due to the melting point of ~250 °C of SnCl2, SnO2 can be amorphous when the curing temperature is between 250 and 300 °C and the anneal temperature was 300 °C. This is due to the melting point of the precursor SnCl2 and the multiple curing steps, which favors the random disposition of the atoms. The amorphous phase had a mobility of 5.02 ± 0.49 cm2/(Vs), carrier concentration of 8.46 ± 0.30 × 1018 cm−3. SnO2 crystal grain increases with increasing both Tcuring and Tanneal, ranging from 5–10 nm for Tcuring = 200 °C and Tanneal = 300 °C, to 35–50 nm when Tcuring = Tanneal = 500 °C. Under that condition the grain preferred orientation is (110), the mobility is 9.4 ± 0.1 cm2/(Vs) and the carrier concentration is 14 ± 0.94 × 1018 cm−3. We compared the k = 0 and the Tauc plot extraction methods for the optical band gap. The former leads to smaller values than the latter. The bandgap of polycrystalline SnO2 slightly increases with the annealing temperature (3.9–4.45 eV), whereas the amorphous phase is ~3.6 eV in the aforementioned Tcuring range. Considering the impact of Tcuring, the present study can also give a path to making new precursors for low temperature processed amorphous oxide semiconductors.

Author Contributions

Conceptualization, C.A.; investigation, C.A.; resources, J.J.; writing—original draft preparation, C.A.; writing—review and editing, C.A. and J.J.; funding acquisition, J.J. All authors have read and agreed to the published version of the manuscript.

Funding

This research was supported by the Technology Innovation Program (or Industrial Strategic Technology Development Program (10080454, Development of High-resolution OLED MicroDisplay and Controller SoC for AR/VR device) funded by the MOTIE (Ministry of Trade, Industry & Energy).

Institutional Review Board Statement

Not applicable.

Informed Consent Statement

Not applicable.

Data Availability Statement

Data sharing is not applicable to this article.

Conflicts of Interest

The authors declare no conflict of interest.

References

  1. Nomura, K.; Ohta, H.; Takagi, A.; Kamiya, T.; Hirano, M.; Hosono, H. Room-Temperature Fabrication of Transparent Flexible Thin-Film Transistors Using Amorphous Oxide Semiconductors. Nature 2004, 432, 488–492. [Google Scholar] [CrossRef] [PubMed]
  2. Hosono, H.; Yasukawa, M.; Kawazoe, H. Novel oxide amorphous semiconductors: Transparent conducting amorphous oxides. J. Non Cryst. Solids 1996, 203, 334–344. [Google Scholar] [CrossRef]
  3. Fortunato, E.; Barquinha, P.; Martins, R. Oxide Semiconductor Thin-Film Transistors: A Review of Recent Advances. Adv. Mater. 2012, 24, 2945–2986. [Google Scholar] [CrossRef]
  4. Wang, J.T.; Shi, X.L.; Liu, W.W.; Zhong, X.H.; Wang, J.N.; Pyrah, L.; Sanderson, K.D.; Ramsey, P.M.; Hirata, M.; Tsuri, K. Influence of Preferred Orientation on the electrical Conductivity of Fluorine doped Tin Oxide Films. Sci. Rep. 2014, 4, 3679. [Google Scholar] [CrossRef] [PubMed] [Green Version]
  5. Tsunashima, A.; Yoshimizu, H.; Kodaira, K.; Shimada, S.; Matsushita, T. Preparation and properties of Antimony-doped SnO2 films by thermal decomposition of tin 2-ethylexanoate. J. Mater. Sci. 1986, 21, 2731–2734. [Google Scholar] [CrossRef]
  6. Avis, C.; Kim, Y.; Jang, J. Amorphous Tin Oxide Applied to Solution Processed Thin-Film Transistors. Materials 2019, 12, 3341. [Google Scholar] [CrossRef] [PubMed] [Green Version]
  7. Jang, J.; Kitsomboonloha, R.; Swisher, S.L.; Park, E.S.; Kang, H.; Subramanian, V. Transparent High-Performance Thin Film Transistors from Solution-Processed SnO2/ZrO2 Gel-like Precursors. Adv. Mater. 2013, 25, 1042–1047. [Google Scholar] [CrossRef] [PubMed]
  8. Li, J.; Zhou, Y.H.; Zhong, D.-Y.; Li, X.-F.; Zhang, J.H. Simultaneous Enhancement of Electrical Performance and Negative Bias Illumination Stability for Low-Temperature Solution-Processed SnO2 Thin-Film Transistors by Fluorine Incorporation. IEEE Trans. Elec. Dev. 2019, 66, 4205–4210. [Google Scholar] [CrossRef]
  9. Shih, C.; Chin, A.; Lu, C.F.; Su, W.F. Remarkably high mobility ultrathin-film metal-oxide transistor with strongly overlapped orbitals. Sci. Rep. 2016, 6. [Google Scholar] [CrossRef] [Green Version]
  10. Nomura, K.; Kamiya, T.; Hosono, H. Ambipolar Oxide Thin-Film Transistor. Adv. Mater. 2011, 23, 3431–3434. [Google Scholar] [CrossRef]
  11. Sajiz, K.J.; Reena Mary, A.P. Tin Oxide Based P and N-Type Thin Film Transistors Developed by RF Sputtering. ECS J. Solid State Sci. Technol. 2015, 4, Q101–Q104. [Google Scholar] [CrossRef]
  12. Ponzoni, A. Morphological Effects in SnO2 Chemiresistors for Ethanol Detection: A Review in Terms of Central Performances and Outliers. Sensors 2021, 21, 29. [Google Scholar] [CrossRef] [PubMed]
  13. Suematsu, K.; Sasaki, M.; Ma, N.; Yuasa, M.; Shimanoe, K. Antimony-Doped Tin Dioxide Gas Sensors Exhibiting High Stability in the Sensitivity to Humidity Changes. ACS Sens. 2016, 1, 913–920. [Google Scholar] [CrossRef]
  14. Chen, H.; Liu, D.; Wang, Y.; Wang, C.; Zhang, T.; Zhang, P.; Sarvari, H.; Chen, Z.; Li, S. Enhanced performance of planar perovskite solar cells using low temperature solution-processed al-doped SnO2 as electron transport layers. Nano. Res. Lett. 2017, 12. [Google Scholar] [CrossRef] [Green Version]
  15. Jiang, Q.; Zhang, L.; Wang, H.; Yang, X.; Meng, J.; Liu, H.; Yin, Z.; Wu, J.; Zhang, X.; You, J. Enhanced electron extraction using SnO2 for high efficiency planar-structure HC(NH2)2PbI3-based perovskite solar cells. Nat. Energy 2017, 2. [Google Scholar] [CrossRef]
  16. Lee, H.B.; Kumar, N.; Ovhal, M.M.; Kim, Y.J.; Song, Y.M.; Kang, J.W. Dopant-Free, Amorphous–Crystalline Heterophase SnO2 Electron Transport Bilayer Enables >20% Efficiency in Triple-Cation Perovskite Solar Cells. Adv. Funct. Mater. 2020, 30. [Google Scholar] [CrossRef]
  17. Jeong, S.; Seo, S.; Park, H.; Shin, H. Atomic layer deposition of a SnO2 electron-transporting layer for planar perovskite solar cells with a power conversion efficiency of 18.3%. Chem. Commun. 2019, 55, 2433–2436. [Google Scholar] [CrossRef]
  18. Jung, K.-H.; Seo, J.-Y.; Lee, S.; Shin, H.; Park, N.-G. Solution-processed SnO2 thin film for a hysteresis-free planar perovskite solar cell with a power conversion efficiency of 19.2%. J. Mater. Chem. A 2017, 5, 24790–24803. [Google Scholar] [CrossRef]
  19. Manseki, K.; Splingaire, L.; Schnupf, U.; Sugiura, T.; Vafaei, S. Current Advances in the Preparation of SnO2 Electron Transport Materials for Perovskite Solar Cells. In Proceedings of the 5th Thermal and Fluids Engineering Conference, New Orleans, LA, USA, 5–8 April 2020; pp. 585–592. [Google Scholar]
  20. Kuang, Y.; Zardetto, V.; van Gils, R.; Karwal, S.; Koushik, D.; Verheijen, M.A.; Black, L.E.; Weijtens, C.; Veenstra, S.; Andriessen, R.; et al. Low-Temperature Plasma-Assisted Atomic-Layer-Deposited SnO2 as an Electron Transport Layer in Planar Perovskite Solar Cells. ACS Appl. Mater. Interf. 2018, 10, 30367–30378. [Google Scholar] [CrossRef] [PubMed]
  21. Kam, M.; Zhang, Q.; Zhang, D.; Fan, Z. Room-Temperature Sputtered SnO2 as Robust Electron Transport Layer for Air-Stable and Efcient Perovskite Solar Cells on Rigid and Flexible Substrates. Sci. Rep. 2019, 9. [Google Scholar] [CrossRef] [PubMed]
  22. Koo, H.S.; Lee, J.-A.; Heo, Y.-W.; Lee, J.H.; Lee, H.Y.; Kim, J.J. Effects of oxygen partial pressure on the structural and electrical properties of Al and Sb co-doped p-type ZnO thin films grown by pulsed laser deposition. Thin Solid Film. 2020, 708. [Google Scholar] [CrossRef]
  23. Cheng, J.; Wang, Q.; Zhang, C.; Yang, X.; Hu, R.; Huang, J.; Yu, J.; Li, L. Low-temperature preparation of ZnO thin film by atmospheric mist chemistry vapor deposition for flexible organic solar cells. J. Mater. Sci. Mater. Elec. 2016, 27, 7004–7009. [Google Scholar] [CrossRef]
  24. Won, J.H.; Han, S.H.; Park, B.K.; Chung, T.-M.; Han, J.H. Effect of Oxygen Source on the Various Properties of SnO2 Thin Films Deposited by Plasma-Enhanced Atomic Layer Deposition. Coatings 2020, 10, 692. [Google Scholar] [CrossRef]
  25. Banger, K.K.; Yamashita, Y.; Mori, K.; Peterson, R.L.; Leedham, T.; Rickard, J.; Sirringhaus, H. Low-temperature, high-performance solution-processed metal oxide thin-film transistors formed by a “sol gel on chip” process. Nat. Mater. 2011, 10, 45–50. [Google Scholar] [CrossRef]
  26. Choi, C.-H.; Lin, L.-Y.; Cheng, C.C.; Chang, C. Printed Oxide Thin Film Transistors: A Mini Review. ECS J. Solid State Sci. Technol. 2015, 4, P3044. [Google Scholar] [CrossRef]
  27. Lalasari, L.H.; Arini, T.; Andriyah, L.; Firdiyono, F.; Yuwono, A.H. Electrical, optical and structural properties of FTO thin films fabricated by spray ultrasonic nebulizer technique from SnCl4 precursor. AIP Conf. Proc. 2018, 1964. [Google Scholar] [CrossRef]
  28. Rey, G.; Ternon, C.; Modreanu, M.; Mescot, X.; Consonni, V.; Bellet, D. Electron scattering mechanisms in fluorine doped SnO2 thin films. J. Appl. Phys. 2013, 114. [Google Scholar] [CrossRef] [Green Version]
  29. Lin, S.-S.; Tsai, Y.-S.; Bai, K.-R. Structural and physical properties of tin oxide thin films for optoelectronic applications. Appl. Surf. Sci. 2016, 380, 203–209. [Google Scholar] [CrossRef]
  30. Pusawale, S.N.; Deshmukh, P.R.; Lokhande, C.D. Chemical synthesis and characterization of hydrous tin oxide (SnO2:H2O) thin films. Bull. Mater. Sci. 2011, 34, 1179–1183. [Google Scholar] [CrossRef]
  31. Jang, J.; Yim, H.; Cho, Y.-H.; Kang, D.-H.; Choi, J.-W. Optical and Electronic Properties of SnO2 Thin Films Fabricated Using the SILAR Method. J. Sens. Sci. Technol. 2015, 24, 364–367. [Google Scholar] [CrossRef] [Green Version]
  32. Deyu, G.K. Muñoz-Rojas, D.; Rapenne, L.; Deschanvres, J.L.; Klein, A.; Jiménez, C.; Bellet, D.; SnO2 Films Deposited by Ultrasonic Spray Pyrolysis: Influence of Al Incorporation on the Properties. Molecules 2019, 24, 2797. [Google Scholar] [CrossRef] [Green Version]
  33. Erken, O.; Ozkendir, O.M.; Gunes, M.; Harputlu, E.; Ulutase, C.; Gumus, C. A study of the electronic and physical properties of SnO2 thin films as a function of substrate temperature. Ceram. Int. 2019, 45, 19086–19092. [Google Scholar] [CrossRef]
  34. Palanichamy, S.; Mohamed, J.R.; Kumar, P.S.S.; Pandiarajan, S.; Amalraj, L. Physical properties of nebulized spray pyrolysised SnO2 thin films at different substrate temperature. Appl. Phys. A 2018, 124, 1–12. [Google Scholar] [CrossRef]
  35. Park, J.S.; Kim, D.Y.; Kim, W.-B.; Park, I.K. Realization of Eu-doped p-SnO2 thin film by spray pyrolysis deposition. Ceram. Int. 2020, 46, 430–434. [Google Scholar] [CrossRef]
  36. Yuliarto, B.; Gumilara, G.; Zulhendria, D.W.; Septiani, N.L.W. Preparation of SnO2 Thin Film Nanostructure for CO Gas Sensor Using Ultrasonic Spray Pyrolysis and Chemical Bath Deposition Technique. Acta Phys. Pol. A 2017, 131, 534–538. [Google Scholar] [CrossRef]
  37. Ashina, A.; Battula, R.K.; Chundi, E.R.N.; Sakthivel, S.; Veerappan, G. Dip coated SnO2 film as electron transport layer for low temperature processed planar perovskite solar cells. Appl. Surf. Sci. Adv. 2021, 4. [Google Scholar] [CrossRef]
  38. Kim, S.E.K.; Oliver, M. Structural, electrical, and optical properties of reactively sputtered SnO2 thin films. Met. Mater. Int. 2010, 16, 441–446. [Google Scholar] [CrossRef]
  39. Jäger, T.; Bissig, B.; Döbeli, M.; Tiwari, A.N.; Romanyuk, Y.E. Thin films of SnO2:F by reactive magnetron sputtering with rapid thermal post-annealing. Thin Solid Film. 2014, 553, 21–25. [Google Scholar] [CrossRef]
  40. Jo, K.-W.; Moon, S.-W.; Cho, W.-J. Fabrication of high-performance ultrathin-body SnO2 thin-film transistors using microwave-irradiation post-deposition annealing. Appl. Phys. Lett. 2015, 106. [Google Scholar] [CrossRef]
  41. Peale, R.E.; Smith, E.; Abouelkhair, H.; Oladeji, I.O.; Vangala, S.; Cooper, T.; Grzybowski, G.; Khalilzadeh-Rezaie, F.; Cleary, J.W. Electrodynamic properties of aqueous spray-deposited SnO2:F films for infrared plasmonics. Opt. Eng. 2017, 56. [Google Scholar] [CrossRef] [Green Version]
  42. Nadarajah, A.; Carnes, M.E.; Kast, M.G.; Johnson, D.W.; Boettcher, S.W. Aqueous Solution Processing of F-Doped SnO2 Transparent Conducting Oxide Films Using a Reactive Tin(II) Hydroxide Nitrate Nanoscale Cluster. Chem. Mater. 2013, 25, 4080–4087. [Google Scholar] [CrossRef]
  43. Zhao, Y.; Dong, G.; Duan, L.; Qiao, J.; Zhang, D.; Wang, L.; Qiu, Y. Impacts of Sn precursors on solution-processed amorphous zinc–tin oxide films and their transistors. RSC Adv. 2012, 2, 5307–5313. [Google Scholar] [CrossRef]
  44. Kitabayashi, S.; Koga, N. Thermal Decomposition of Tin(II) Oxyhydroxide and Subsequent Oxidation in Air: Kinetic Deconvolution of Overlapping Heterogeneous Processes. J. Phys. Chem. C 2015, 119, 16188–16199. [Google Scholar] [CrossRef] [Green Version]
  45. Patnaik, P. Handbook of Inorganic Chemicals; McGraw-Hill: New York, NY, USA, 2003. [Google Scholar]
  46. Heo, J.; Hock, A.S.; Gordon, R. Low Temperature Atomic Layer Deposition of Tin Oxide. Chem. Mater. 2010, 22, 4964–4973. [Google Scholar] [CrossRef]
  47. Tauc, J. Optical properties and electronic structure of amorphous Ge and Si. Mat. Res. Bull. 1968, 3, 37–46. [Google Scholar] [CrossRef]
  48. Makuła, P.; Pacia, M.; Macyk, W. How To Correctly Determine the Band Gap Energy of Modified Semiconductor Photocatalysts Based on UV−Vis Spectra. J. Phys. Chem. Lett. 2018, 9, 6814–6817. [Google Scholar] [CrossRef] [Green Version]
  49. Zanatta, A.R. Revisiting the optical bandgap of semiconductors and the proposal of a unifed methodology to its determination. Sci. Rep. 2019, 9, 1–12. [Google Scholar] [CrossRef] [Green Version]
  50. Viezbicke, B.D.; Patel, S.; Davis, B.E.; Birnie, D.P., III. Evaluation of the Tauc method for optica absorption edge determmination: ZnO thin films as a model system. Phys. Status Solidi B 2015, 8, 1700–1710. [Google Scholar] [CrossRef]
  51. Pankove, J.I. Optical Processes in Semiconductors; Courier Corporation: Mineola, NY, USA, 1971. [Google Scholar]
  52. Liu, P.; Longo, P.; Zaslavsky, A.; Pacifici, D. Optical bandgaps of single- and multi-layered amorphous germanium ultra-thin films. J. Appl. Phys. 2016, 119. [Google Scholar] [CrossRef]
  53. Pan, S.S.; Zhang, Y.X.; Teng, X.M.; Li, G.H.; Li, L. Optical properties of nitrogen-doped SnO2 films: Effect of the electronegativity on refractive index and band gap. J. Appl. Phys. 2008, 103. [Google Scholar] [CrossRef]
  54. Janicek, P.; Niang, K.M.; Mistric, J.; Palka, K.; Flewitt, A.J. Spectroscopic ellipsometry characterization of ZnO:Sn thin films withvarious Sn composition deposited by remote-plasma reactive sputtering. Appl. Surf. Sci. 2017, 421, 557–564. [Google Scholar] [CrossRef]
  55. Di, M.; Bersch, E.; Diebold, A.; Consiglio, S.; Clark, R.; Leusink, G.; Kaack, T. Comparison of methods to determine bandgaps of ultrathin HfO2 films using spectroscopic ellipsometry. J. Vac. Sci. Tech. A 2011, 29. [Google Scholar] [CrossRef]
  56. Forouhi, A.R.; Bloomer, I. Optical Dispersion Relations for Amorphous Semiconductors and Amorphous Dielectrics. Phys. Rev. B 1986, 34, 7018–7026. [Google Scholar] [CrossRef]
  57. Forouhi, A.R.; Bloomer, I. Optical Properties of Crystalline Semiconductors and Dielectrics. Phys. Rev. B 1988, 38, 1865–1874. [Google Scholar] [CrossRef] [PubMed]
  58. Gong, J.; Wang, X.; Fan, X.; Dai, R.; Wang, Z.; Zhang, Z.; Ding, Z. Temperature dependent optical properties of SnO2 film study by ellipsometry. Opt. Mater. Express 2019, 9, 3691–3699. [Google Scholar] [CrossRef]
  59. Parra, R.; Joanni, E.; Espinosa, J.W.M.; Tararam, R.; Cilense, M.; Bueno, P.R.; Varela, J.A.; Longo, E. Photoluminescent CaCu3Ti4O12-based thin films synthesized by a sol-gel method. J. Am. Ceram. Soc. 2008, 91, 4162–4164. [Google Scholar] [CrossRef]
Figure 1. Weight (%) and differential temperature analysis of SnCl2 as a function of the temperature. (a) A single increase up to 500 °C. (b) Increase of the temperature up to 220 °C, decrease down to RT, and increase up to 300 °C. (c) Increase of the temperature up to 280 °C, decrease down to RT, and increase up to 300 °C. In all figures, the graph in black (blue) represents the variation in weight % (temperature difference). In (b) and (c), the first increase in temperature is represented by a solid line, the decrease with a dotted line, while the second increase is shown with a dashed line.
Crystals 11 00851 g001
Figure 2. The XRD patterns of SnO2 at various curing and annealing temperatures. (a) Before annealing, and after annealing at (b) 300, (c) 400, and (d) 500 °C.
Crystals 11 00851 g002
Figure 3. The transmittance of SnO2 thin films cured at various temperatures and annealed at (a) 300, (b) 400, and (c) 500 °C, respectively. The inset of each figure shows n and k as a function of the energy. In all graphs, the black, red, blue, and green line represents a curing temperature of 200, 300, 400, and 500 °C, respectively. In (a) the yellow, pink, and grey line represents a curing temperature of 220, 250, and 280 °C, respectively.
Crystals 11 00851 g003aCrystals 11 00851 g003b
Figure 4. The Tauc plot for the extraction of the optical bandgap of SnO2 thin films cured at various temperatures and annealed at (a) 300, (b) 400, and (c) 500 °C, respectively. In all graphs, the black, red, blue, and green line represents a curing temperature of 200, 300, 400, and 500 °C, respectively. In (a) the yellow, pink, and grey line represents a curing temperature of 220, 250, and 280 °C, respectively.
Crystals 11 00851 g004
Figure 5. The electrical properties of SnO2 measured by the Hall effect. (a) The carrier concentration as a function of the curing temperature with various annealing temperatures, (b) the Hall mobility as a function of the curing temperature with various annealing temperatures, (c) the conductivity as a function of the curing temperature with various annealing temperatures.
Crystals 11 00851 g005
Figure 6. The surface morphology of SnO2 measured by SEM and AFM. Tcuring = Tanneal = (a) and (b) 300 °C, (c) and (d) 400 °C, (e) and (f) 500 °C, respectively.
Crystals 11 00851 g006
Table 1. Summary of the Rpv and Rrms with various curing and annealing temperatures.
Annealing
Temperature
(°C)
Curing
Temperature
(°C)
Rpv
(nm)
Rrms
(nm)
3002004.9260.391
2205.5480.339
2502.2770.261
2801.9860.16
3001.6820.154
4002006.0870.537
3005.5940.552
40010.2661.020
50020014.0721.365
30012.9540.741
4005.9120.683
50036.0221.566
Publisher’s Note: MDPI stays neutral with regard to jurisdictional claims in published maps and institutional affiliations.