Abstract
CeO2 is an important energy storage material that can be used in solid fuel cells. Adding citric acid can improve the particle distribution of the pyrolytic preparation of CeO2 inside the reactor. Through Fluent, this paper investigated the pyrolysis preparation of CeO2 with the addition of citric acid by adopting the Eulerian multiphase flow model, component transportation model, and standard k-ε turbulence model. The experimental and simulation results suggest that the addition of citric acid can alter the pressure, temperature, and component distributions inside the reactor. When the mass fraction of O2 is 0.3, the concentration distribution effect of the CeO2 component is optimal and its conversation rate is the highest. When the mass fraction of citric acid is 0.04, the concentration distribution effect of the CeO2 component is the best, as witnessed by the high CeO2 concentration at the exit. It was found that an O2 content of 30 wt % and citric acid content of 4 wt % were optimal operating conditions for this technology.
1. Introduction
Rare earth materials can be applied in national defense, spaceflight, automobile, and medical treatment applications. The light rare earth element, cerium, accounts for half of the rare earth resources, where CeO2 is the most important compound of the light rare earth cerium resources. CeO2 nanoparticles can be used as an accelerant for the wound healing of effective sterilization applications and medical treatments for pollutants [1]. In addition, these particles can be used for solid fuel cells [2] in new environmentally friendly automobiles, as well as optical polishing [3]. The preparation method and chemical reaction environment can affect the structure, size, and morphology of CeO2, which further influence the physicochemical properties of CeO2. Therefore, how to control the structural characteristics of CeO2 products has become a hotspot for current scientific research.
Commercially, CeO2 is prepared by oxalic acid precipitation and carbonate precipitation, but this method has disadvantages of low efficiency, large consumption of raw materials, and environmental pollution. Zhang et al. [4] devised the preparation of the rare earth oxide by directly roasting the rare earth chloride. This is a type of green production method with no exhaust gas or wastewater emission and, simultaneously, the resultant hydrogen chloride (HCl) can be directly recycled. At present, industrially produced CeO2 does not specify the granularity and specific surface area. In addition, the CeO2 products lack variety and the application range is narrow. This leads to the current situation where the output of CeO2 is high, but the usage amount is low and there is excess supply. Great efforts have been made to prepare CeO2 particles with specific and unique morphology [5,6,7,8,9]. Xi et al. [10] found that rod-like morphology and size, as well as the polishing performance of the obtained CeO2, can be changed by adding zinc acetate. Dler et al. [11] dissolved cerous acetate in glacial acetic acid, added a mixture of isooctane and 2-butanol as the raw solution, and used flame spray pyrolysis to control the O2 and raw solution. Through the flow rate of the flame, CeO2 with high crystallinity and a specific surface area of 101–240 m2/g could be obtained. A study on the pyrolysis preparation of CeO2 by adding citric acid shows that CeO2 spheres with high crystallinity and good degrees of sphericity can be formed after the addition of citric acid [12]. Our group uses a Venturi jet reactor to prepare micro-nano spherical CeO2. The effects of different fuel types, gas-phase velocities, material concentrations, and parameters of particle shape and reactor structure on the products were investigated. Preliminary studies show that solid particle residues can easily block the reactor chambers, which influences the preparation of CeO2 [13,14]. The CO2 and water produced by the reaction between citric acid and O2 will not create solid particle residue in the reactor that can readily influence the CeO2 pyrolysis and further affect the distribution of CeO2 particles.
By changing the experimental reaction conditions, detecting the purity and morphology characteristics of the products, and analyzing the influence of pyrolysis reaction conditions on pyrolysis efficiency, the pyrolysis reactor could be designed and optimized [15,16]. Multiple high-temperature experiments were needed, which doubled the economic and time costs. Moreover, an air-tight and opaque reactor was used for high-temperature pyrolysis preparation of the CeO2, which prohibited the direct observation and detection of the speed, temperature, and concentration distributions of the inner fluid. Therefore, this paper performs a simulation of the pyrolysis of CeO2 with added citric acid [17,18,19], explores the influence of citric acid addition concentration on the composition distribution in the reactor, and determines the optimal operating parameters for the Venturi jet flow pyrolysis technology.
2. Modelling
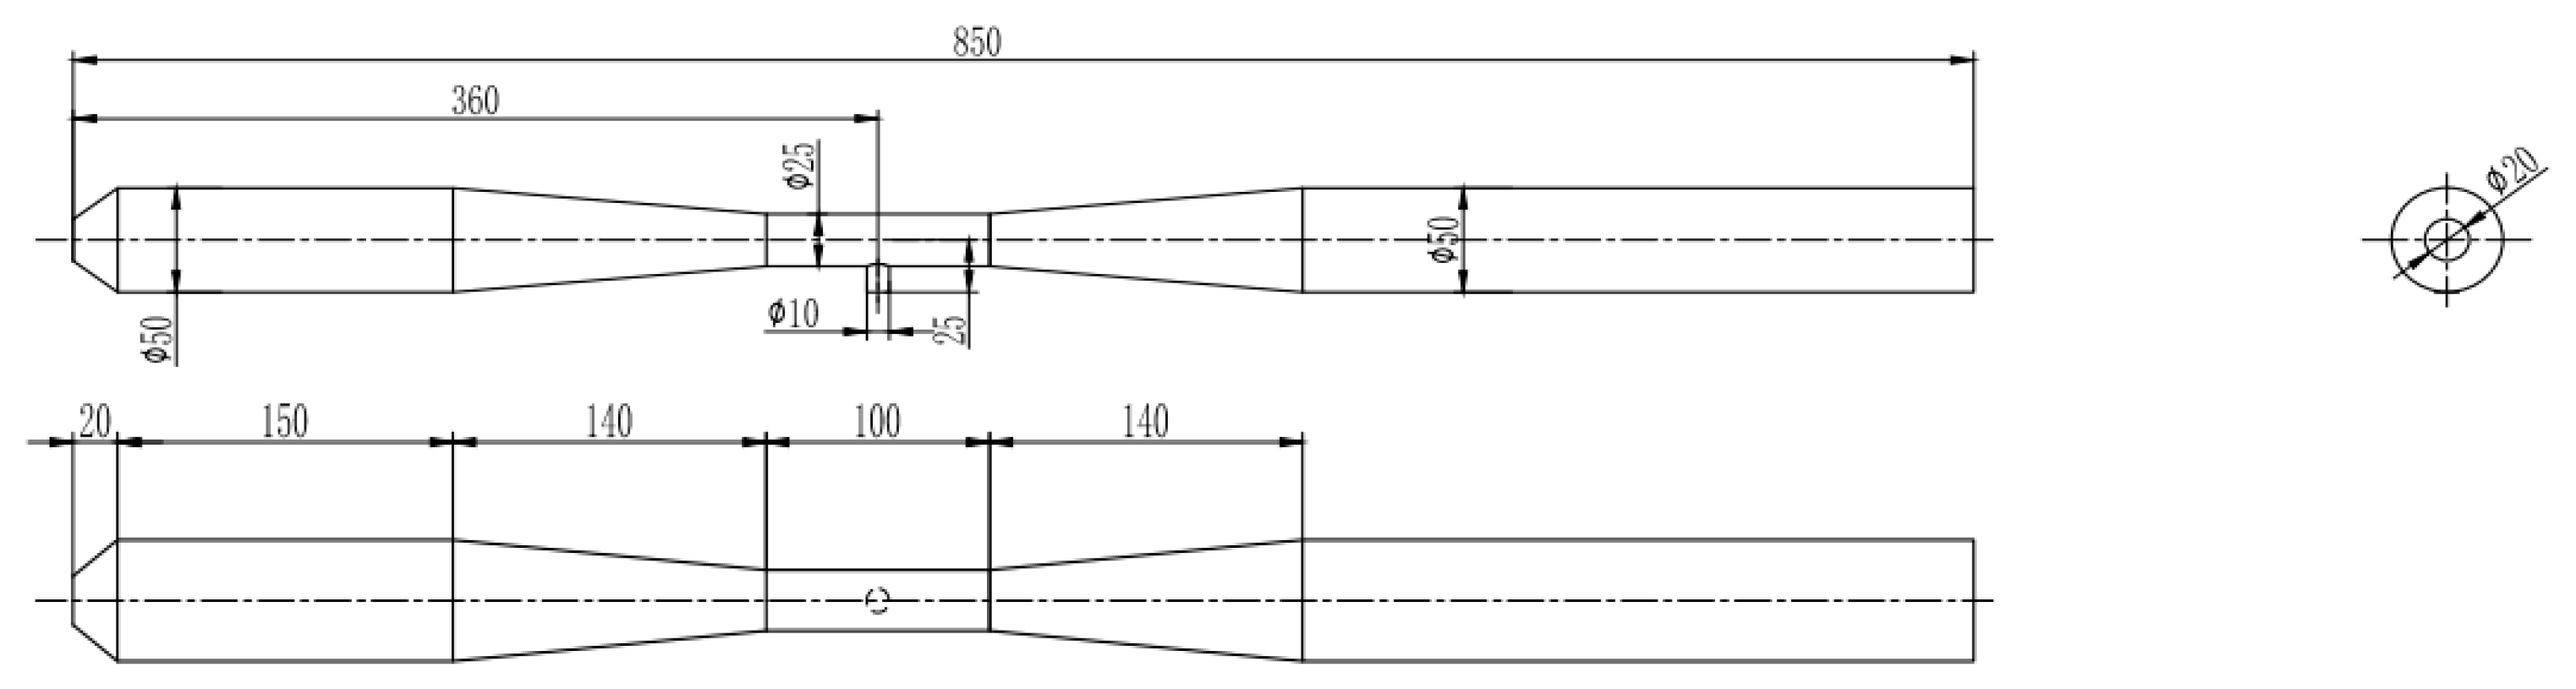
The specific structure and size of the Venturi pyrolysis reactor are shown in Figure 1. The first half of the Venturi pipe provides heat for the pyrolysis preparation of CeO2 via methane combustion. The throat is the main region of the multi-step reaction so that encryption processing is performed in the grid processing. Using SolidWorks to build models for the reactor, grid generation is performed using ICEM software, where the grid type is a hexahedron grid. Encryption processing is done on the throat component, where there are three material inlets, and the grid number is 380,000. The grid generation of the Venturi reactor is shown in Figure 2a. The simulation involves the combustion reaction of methane; the evaporative phase change of water; and the pyrolytic reaction of CeO2, which is a chemical process with multiple reactions. The Euler model is used to describe the two-phase flow behavior of the gas-solid. A standard k-ε model is used for the turbulent flow inside jet reactor. The chemical reaction uses the ED model for component transport, and the Lee model is adopted for the evaporative phase change model of water. This paper details the following heterogeneous reaction:
2CeCl3(s) + 3H2O(g) + 1/2O2(g) → 2CeO2(s) + 6HCl(g)
2C6H8O7 (s) + 9O2(g)→12CO2(g) + 8H2O(g)
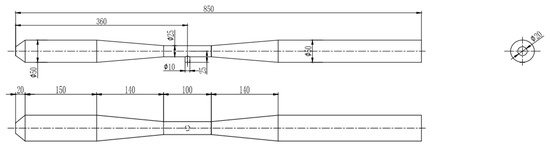
Figure 1.
Dimensions of the jet-flow pyrolysis reactor (unit: mm).
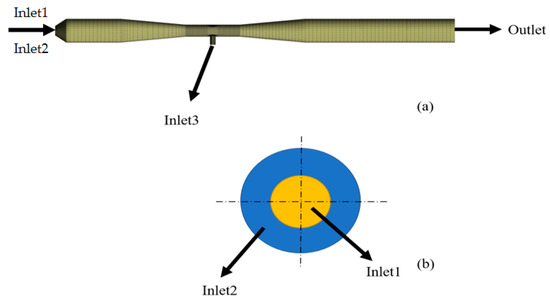
Figure 2.
Mesh generation: (a) meshed reactor and (b) gas-phase velocity.
The kinetic equation of pyrolysis is as follows:
The mass fraction of methane is 1, and the mass fraction of O2 is between 0.1 and 0.3. The mass fraction of citric acid is between 0.01 and 0.04, and the mass fraction of CeCl3 is 0.052. As shown in Figure 2, there are three inlets for the Venturi jet reactor. The speeds were set in Inlet1, Inlet2, and lnlet3. Methane, oxygen, and materials enter the reactor from inlet1, inlet2, and inlet3 with speeds of 2.88, 21.15, and 0.03 m/s, respectively, and then set to an initial temperature of 300 K. Free flow boundary conditions were selected for the outlet, and the wall surface is set as an adiabatic condition. The calculation time interval is 0.001 s and time step independence verification is shown in [20]. To ensure the stability and accuracy of the calculation results, there is no obvious change in the content of CeO2 at the outlet after 50 s. Therefore, a 50 s chemical simulation time was selected for calculation and observation.
3. Results and Discussion
3.1. The Selection of Monitoring Line and Area
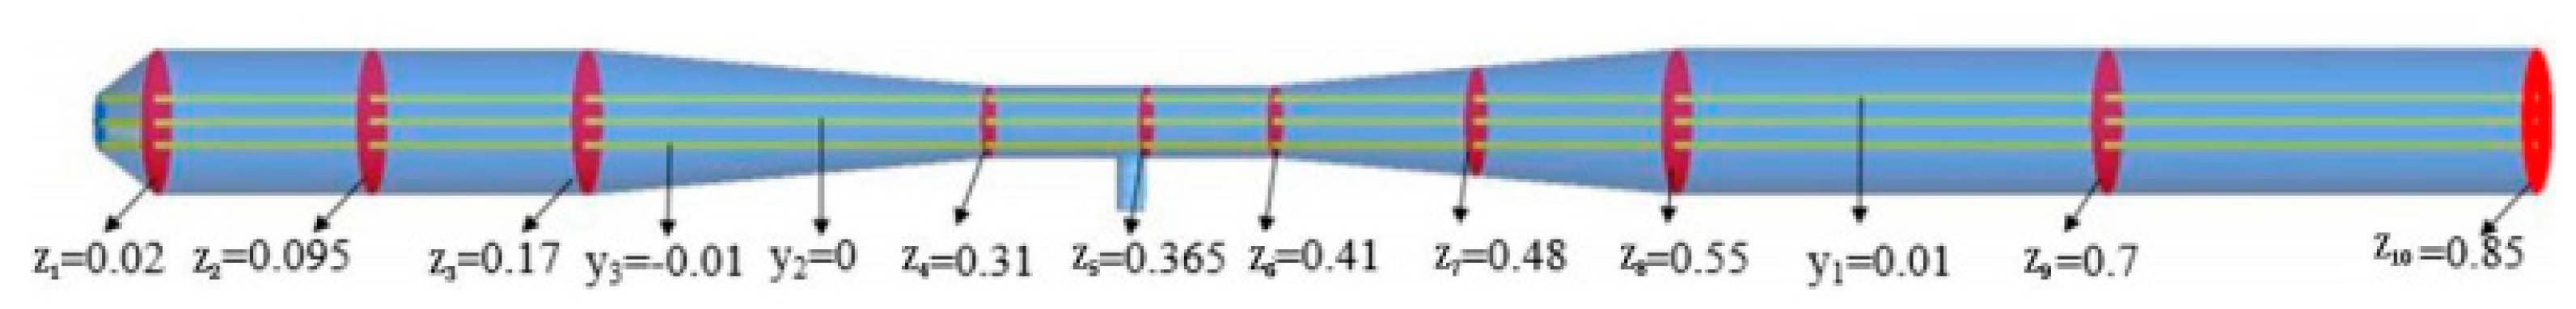
To analyze the fluid flow in the reactor and pyrolysis process in detail, three monitor lines were selected inside the reactor, which are the lateral axis and two parallel lines with 0.01 m space above and below the lateral axis, respectively, and marked as y1 = −0.01 m. Ten monitoring areas were selected with Z1 = 0.02 m and Z10 = 0.85 m, respectively, which were widely distributed on the critical locations in the reactor, as shown in Figure 3. Table 1 illustrates the comparative results of the simulation and experiments. The error between the experimental value and simulation value of the gas-phase flow rate detected in the outlet is within 10%, which is acceptable. This indicates that the selected dynamics model, boundary conditions, and numerical simulation model are all relatively accurate. The error may result from the fact that the product content is rushed out of the chamber by the gas or the residue is accumulated in the chamber.

Figure 3.
Selection of monitoring line and monitoring surface.

Table 1.
Model verification.
3.2. Effects of Added Citric Acid on Various Parameters
3.2.1. Reactor Pressure
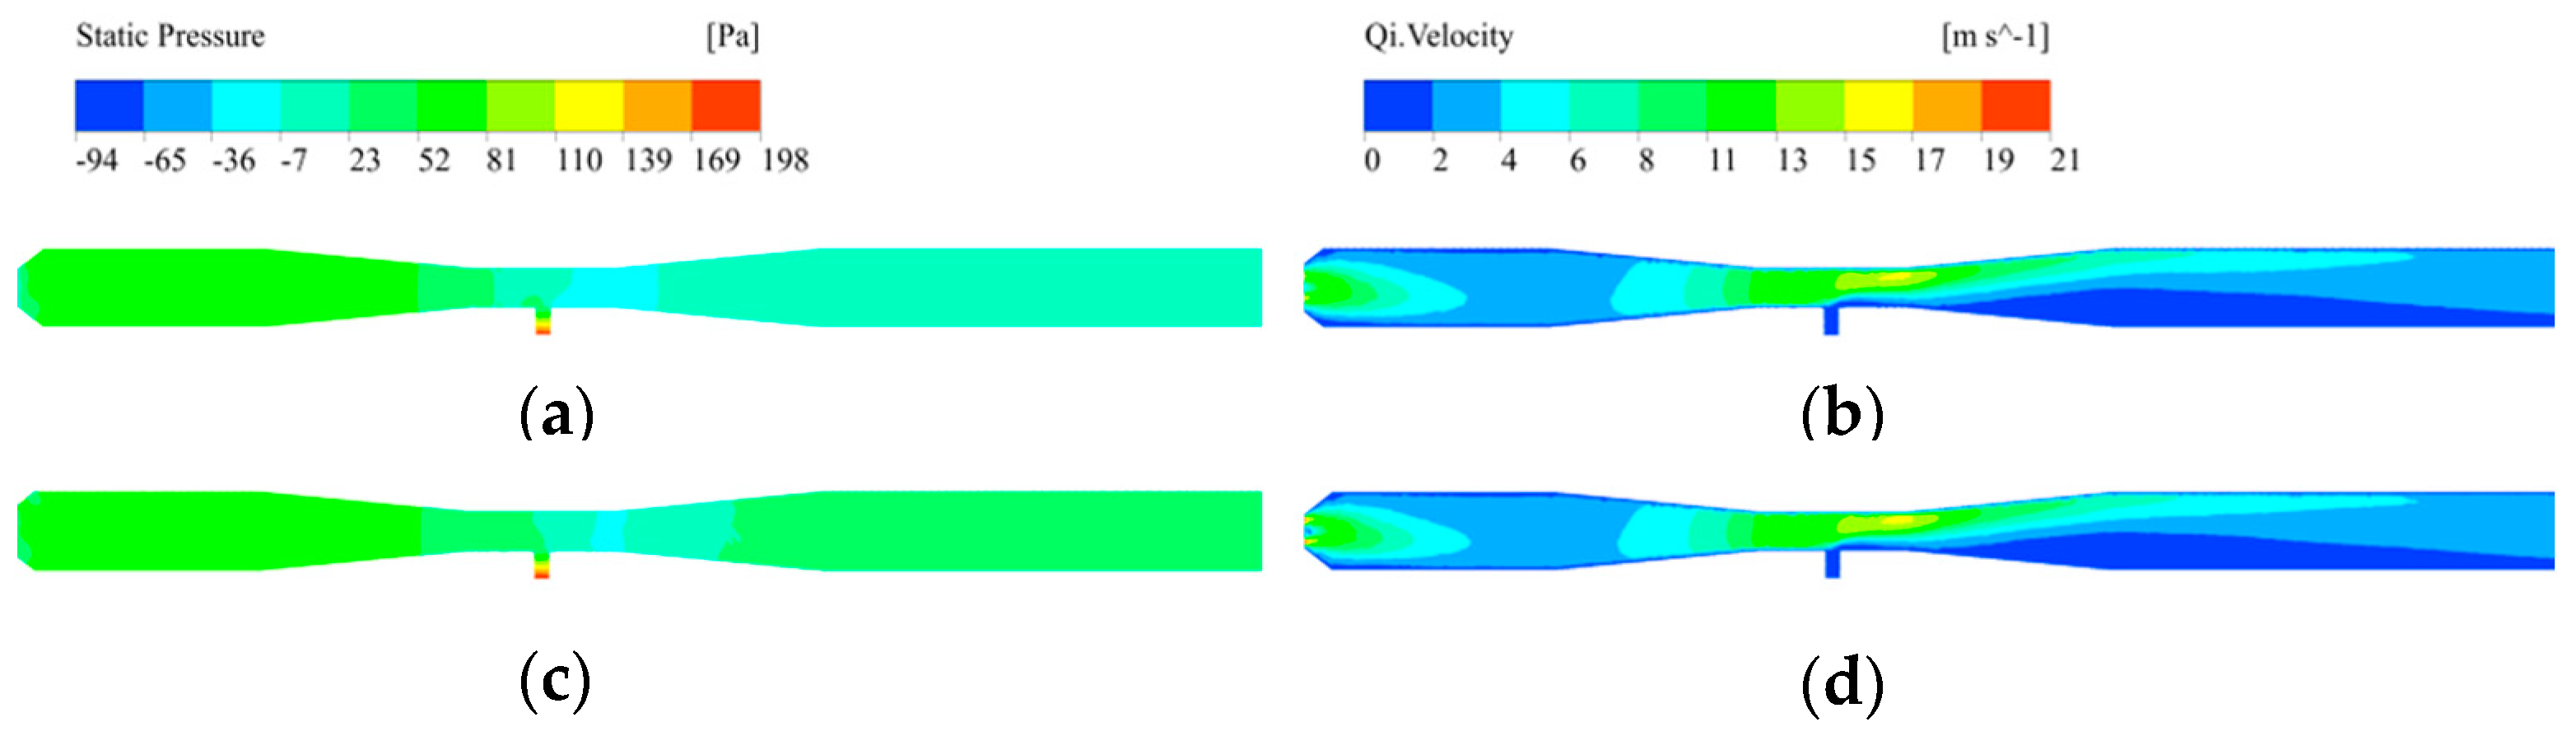
Figure 4a,b show the distribution nephograms of the pressure and rate in the reactor without the addition of citric acid, respectively. Figure 4c,d show the distribution nephograms of the pressure and rate in the reactor with the addition of citric acid, respectively. The distribution nephogram uses the yz plane as the monitoring area. From the comparison between (a,c), as well as (b,d), it is observed that the trend for the pressure and gas-phase velocity in both cases is almost the same. The gas mixture of methane and oxygen rapidly enters from Inlet1 and Inlet2 to produce instant negative pressure. The pressure increases rapidly with the decreasing gas-phase rate in the extension chamber and the front end of the direct chamber. In the contraction chamber and throat position, the gas-phase rate increases as the pressure decreases. In addition, the flow rate of the fluid reaches its highest in the latter half of the throat, forming its largest negative pressure. As the rate of fluid decreases when entering the extension chamber and the direct chamber of the outlet, the pressure is increased and achieves steady state in the outlet position. In Figure 4c, the area of the nephogram of the highest negative pressure at the throat position is lower than that in Figure 4a. The citric acid produces a certain amount of high-speed gas at the throat position, which instantaneously enters the throat, relieving the intrinsic negative pressure and decreasing the impact of negative pressure on the inner wall of the throat.
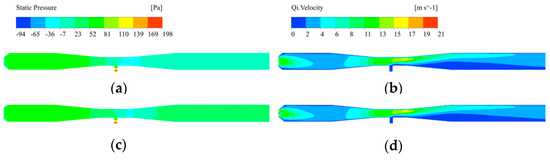
Figure 4.
The distribution nephogram of the pressure and velocity in the reactor: (a) pressure distribution without the addition of citric acid, (b) velocity distribution without the addition of citric acid, (c) pressure distribution with the addition of citric acid, and (d) velocity distribution without the addition of citric acid.
3.2.2. Temperature Distribution
For the convenience of contrasting analysis, in this study, 0.00 C6H8O7 was set to represent no added citric acid. Figure 5 shows the changing temperature along the monitor line y2. Without the addition of citric acid, the temperature inside the reactor is provided by the combustion of CH4, which reaches its highest value in the first half of the reactor. In the throat position, with the entrance of the CeO2 solution in the materials inlet, the water absorbs heat in the solution via evaporative phase change, and when the temperature reaches its lowest value, the heat absorption is via CeO2 pyrolysis. With the addition of citric acid, the exothermic reaction between citric acid and O2 causes the position of maximum temperature in the reactor to move back and the minimum temperature is increased.
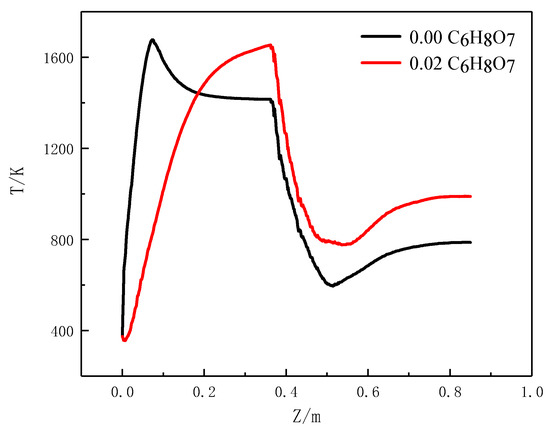
Figure 5.
Temperature curves for the reactor with and without the addition of citric acid.
3.2.3. CO2 Concentration
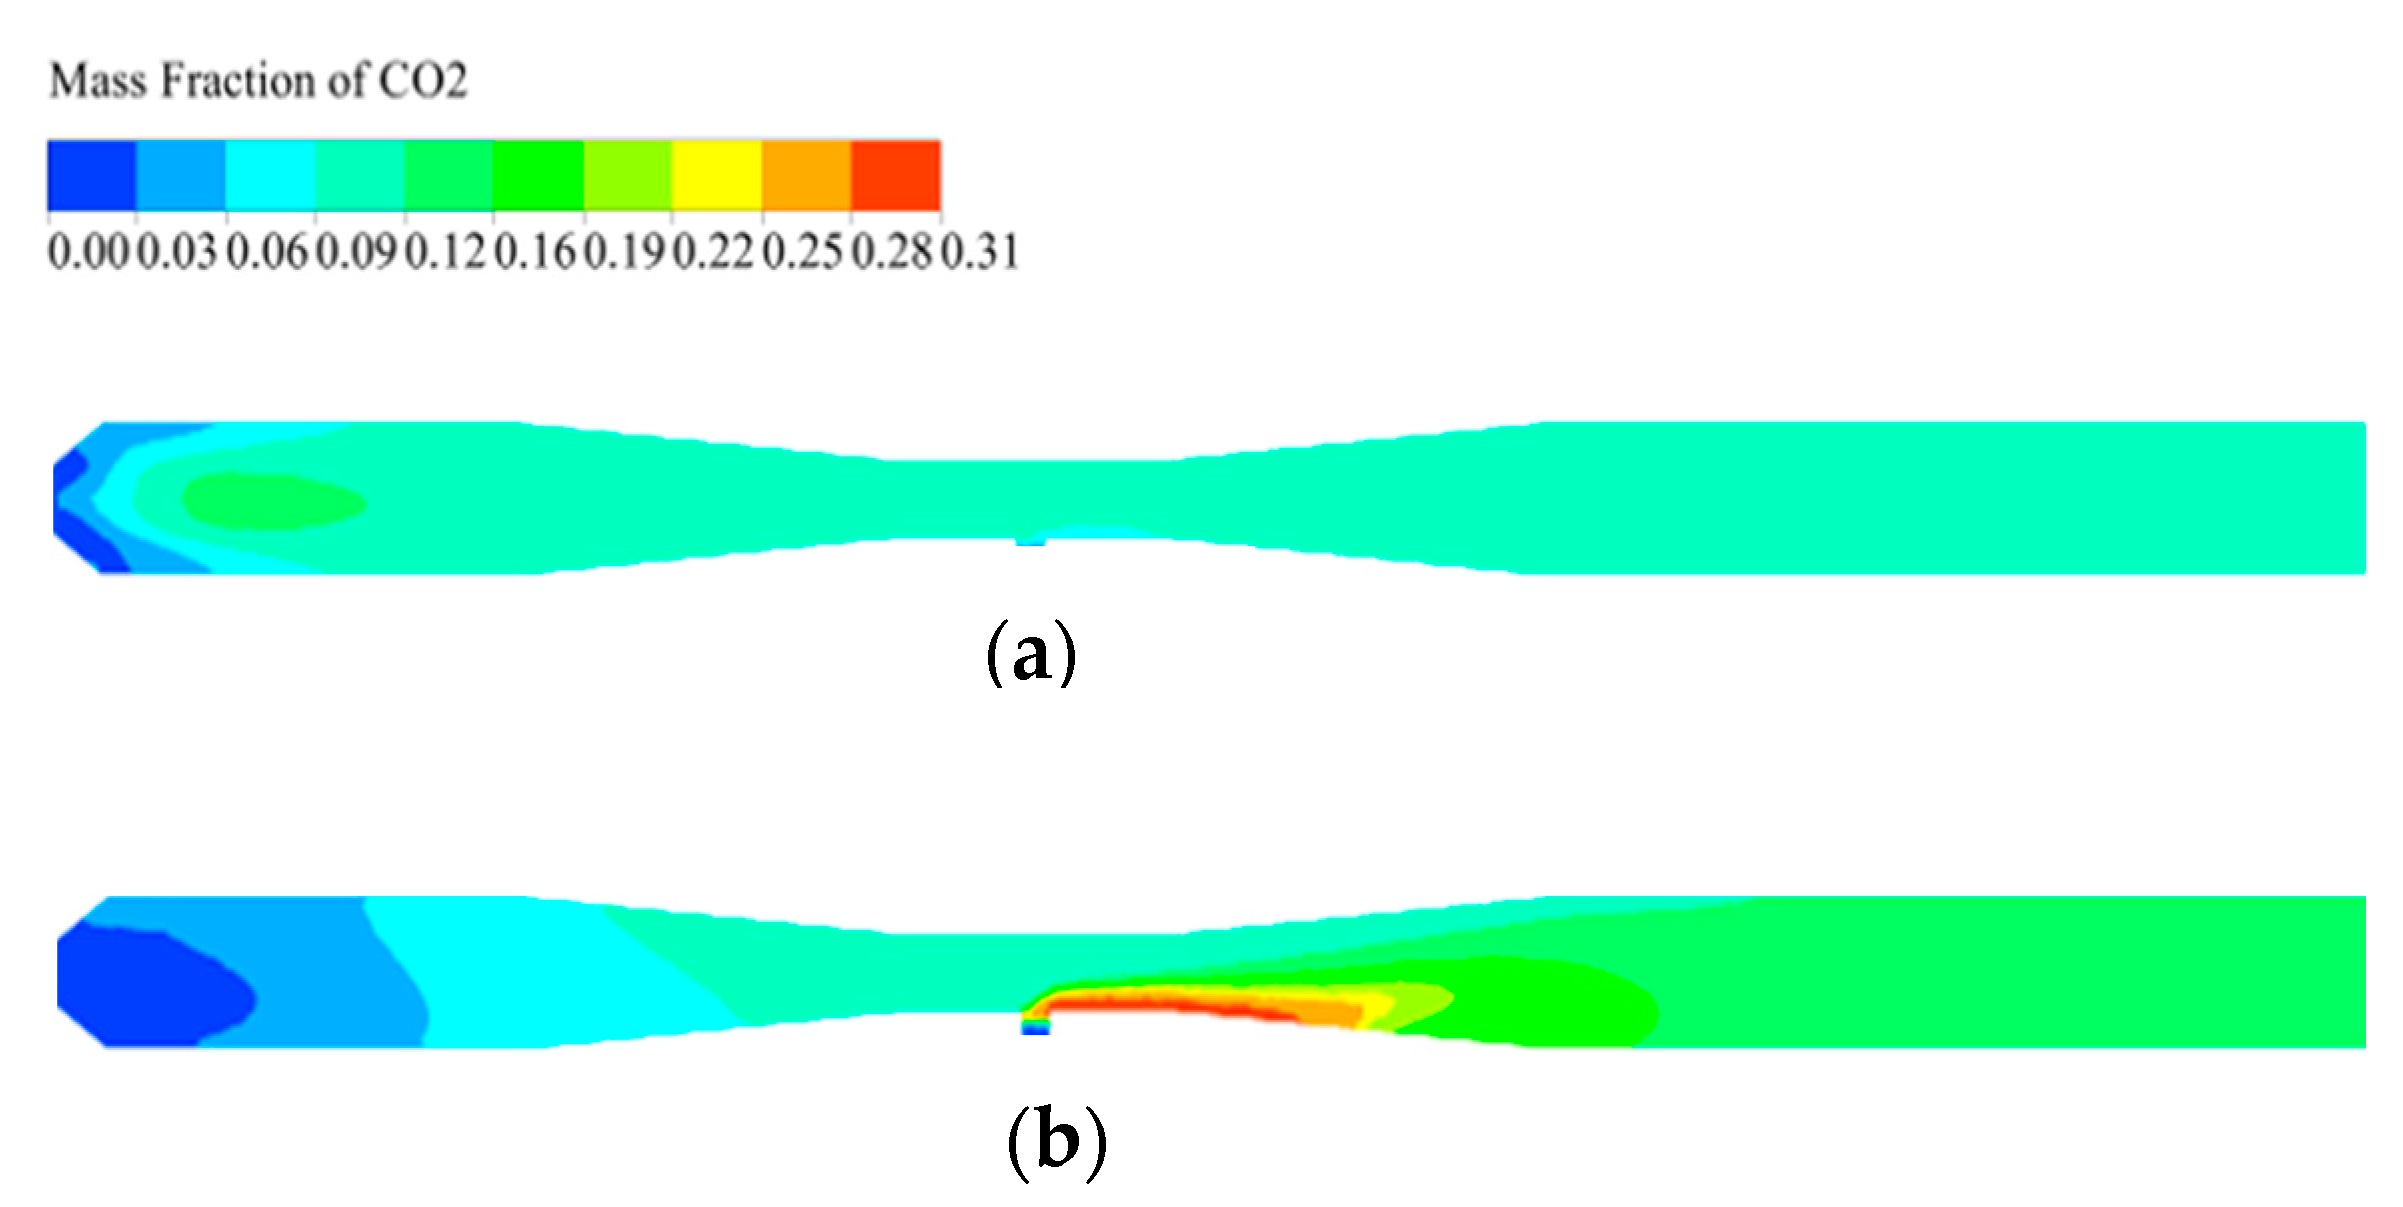
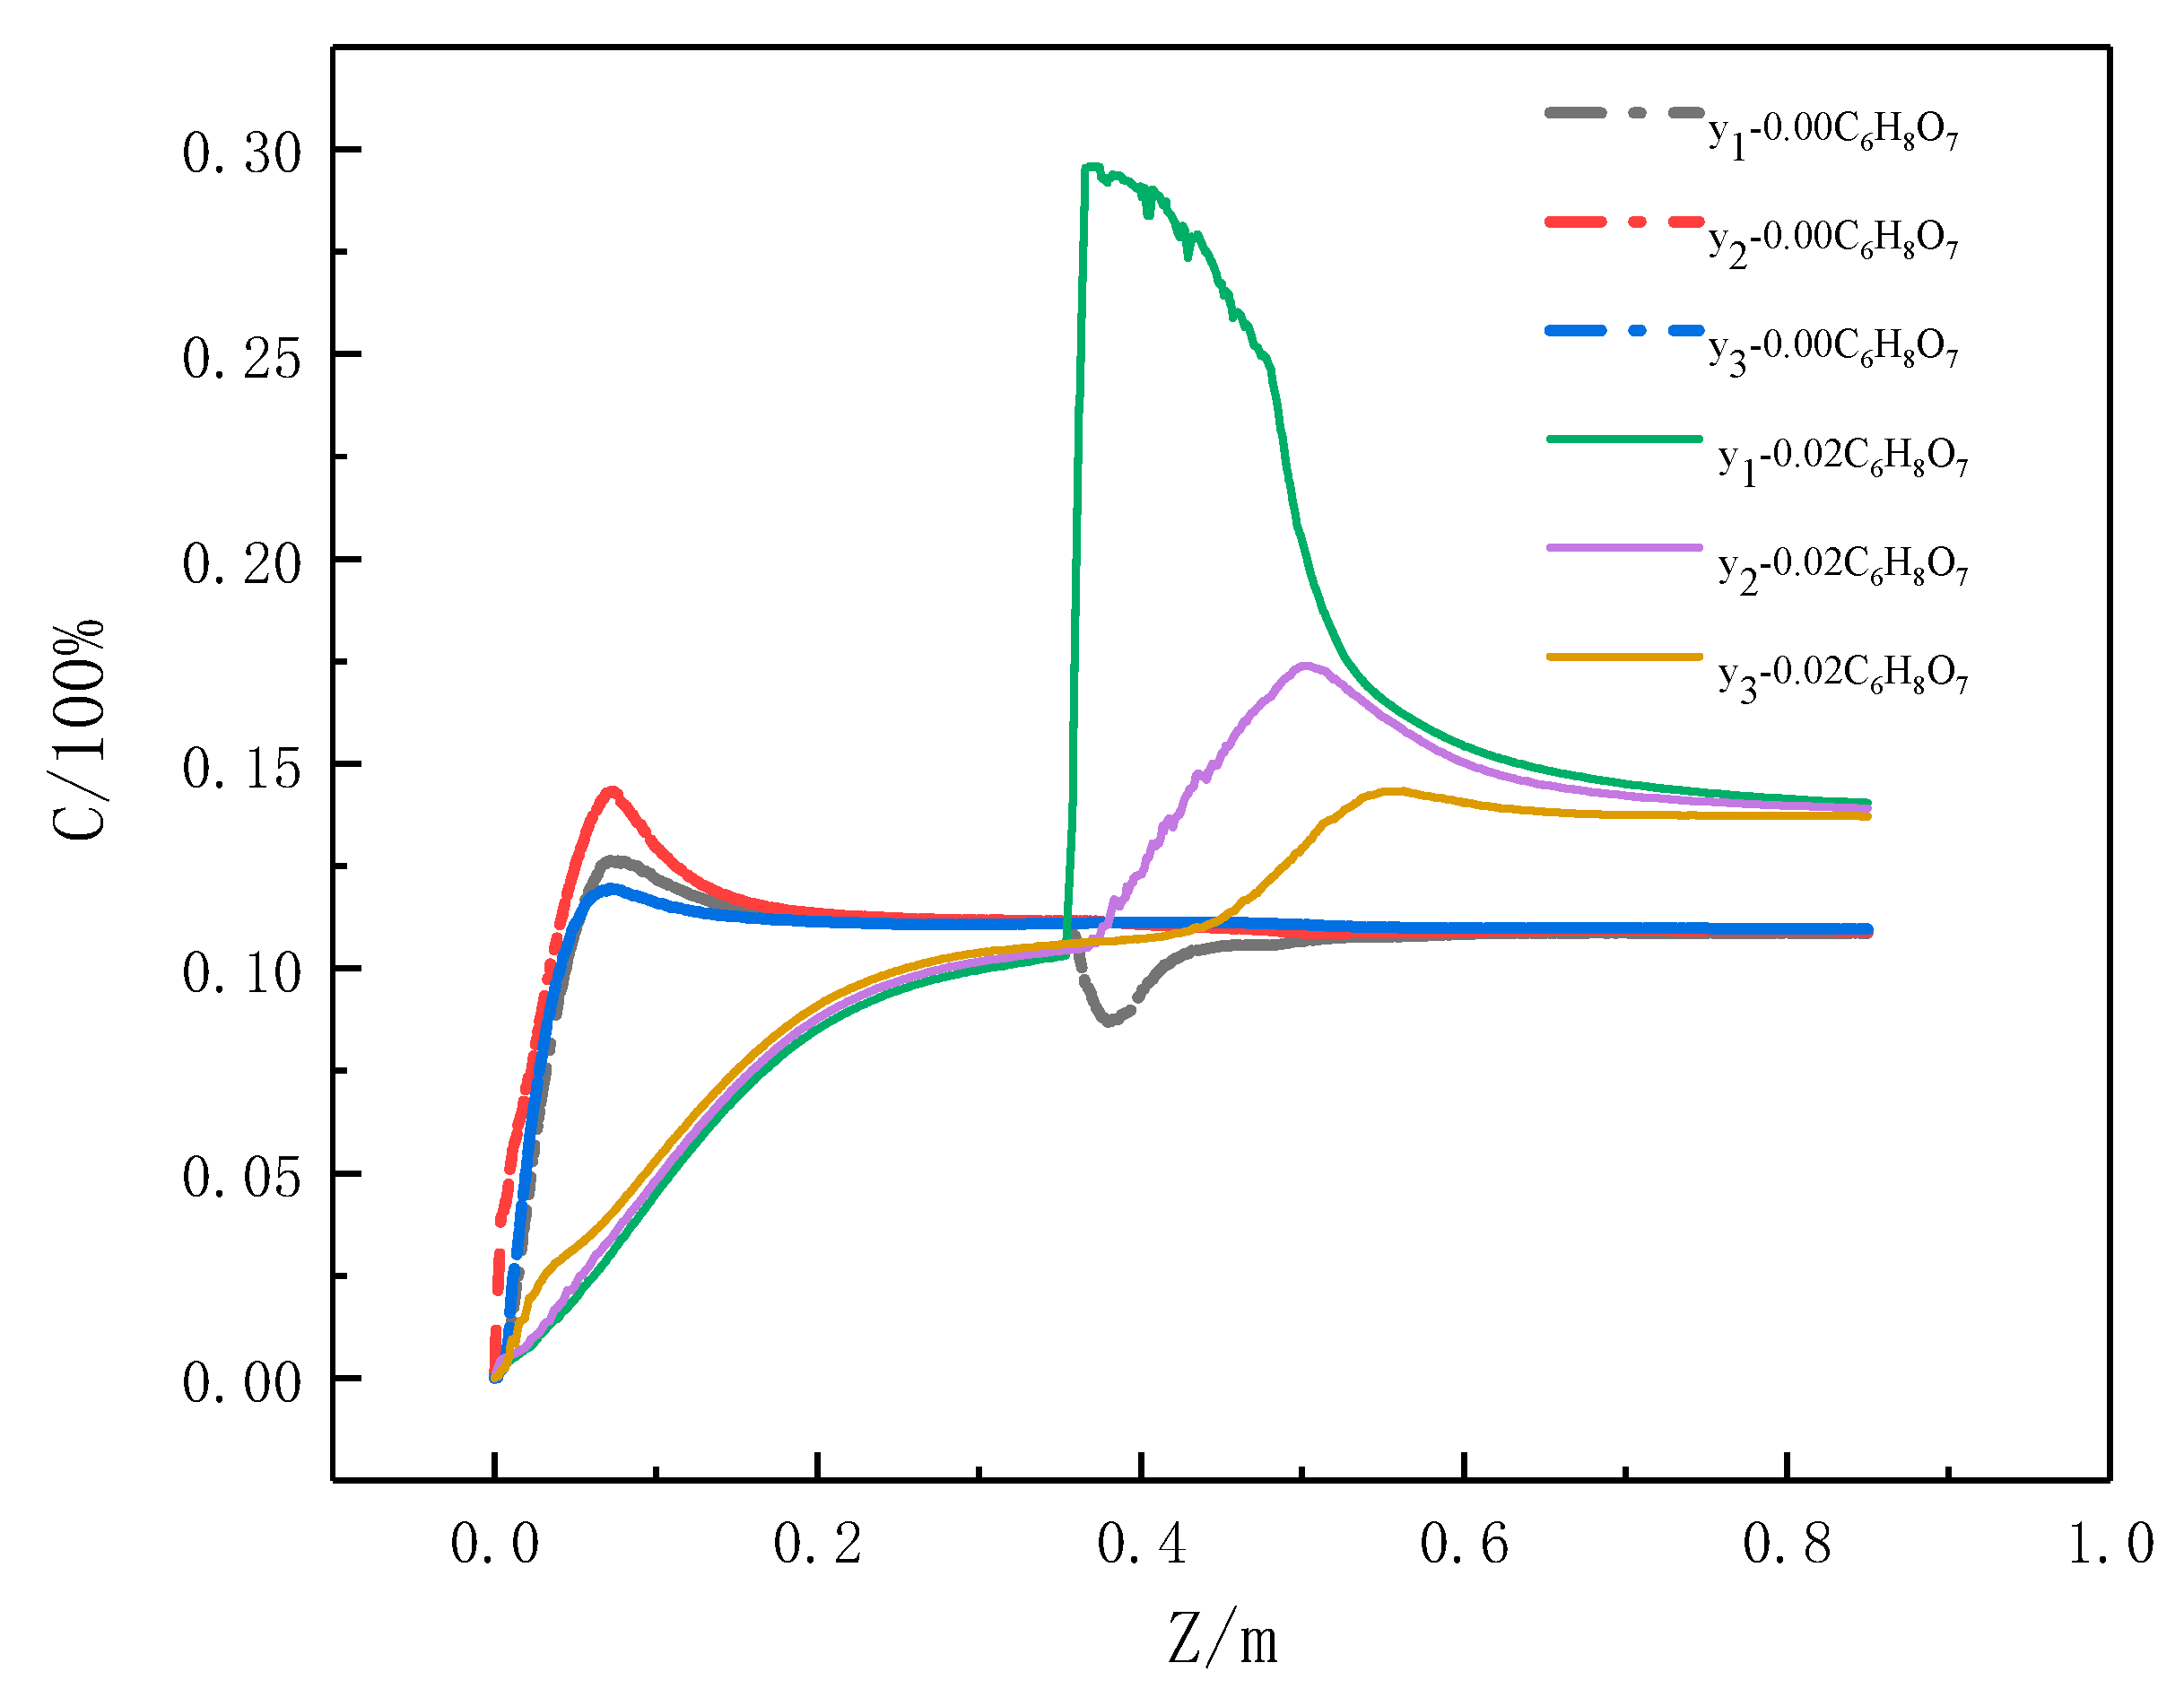
Figure 6a,b ashow the CO2 concentration field distribution nephograms for CO2 preparation with or without the addition of citric acid, respectively. Figure 7 shows the change in CO2 concentration on monitor lines y1, y2, and y3. As shown in Figure 6, CO2 is produced by the combustion of CH4 without the addition of citric acid and the parts with the highest CO2 content in the heart of the first half of the reactor, and the gas contents in other parts are almost the same. With the addition of citric acid, CO2 concentration is highest in the materials inlet and the bottom half of the throat. Other parts with relatively high contents are distributed in the latter half of the reactor. From the CO2 concentration changing on the monitor lines, we know that the combustion between citric acid and O2 releases a large amount of CO2, causing its highest concentration to be almost half of the CO2 produced without the addition of citric acid. The trends of the three monitor lines without the addition of citric acid are the same, and there are negligible differences between the corresponding values of each point on the z axis, which is relatively stable. However, for the three monitor lines with the addition of citric acid, the change in the curve at the throat is very large, indicating inhomogeneous distribution of CO2 at the throat.
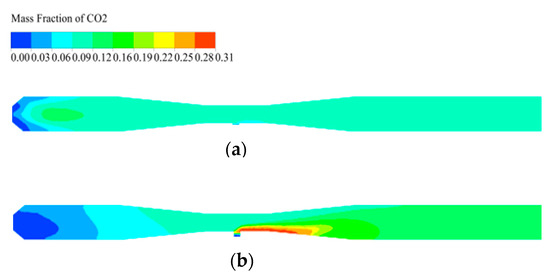
Figure 6.
Distribution nephogram of CO2 concentration field: (a) without the addition of citric acid and (b) with the addition of citric acid.
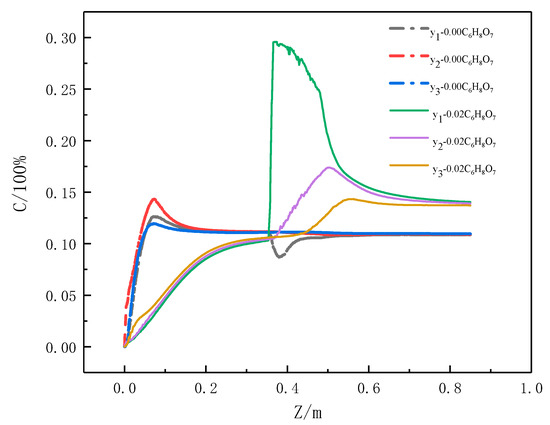
Figure 7.
CO2 concentration distribution graph of the monitoring lines.
3.3. Effects of O2 Concentration on CeO2 Pyrolysis
3.3.1. Temperature
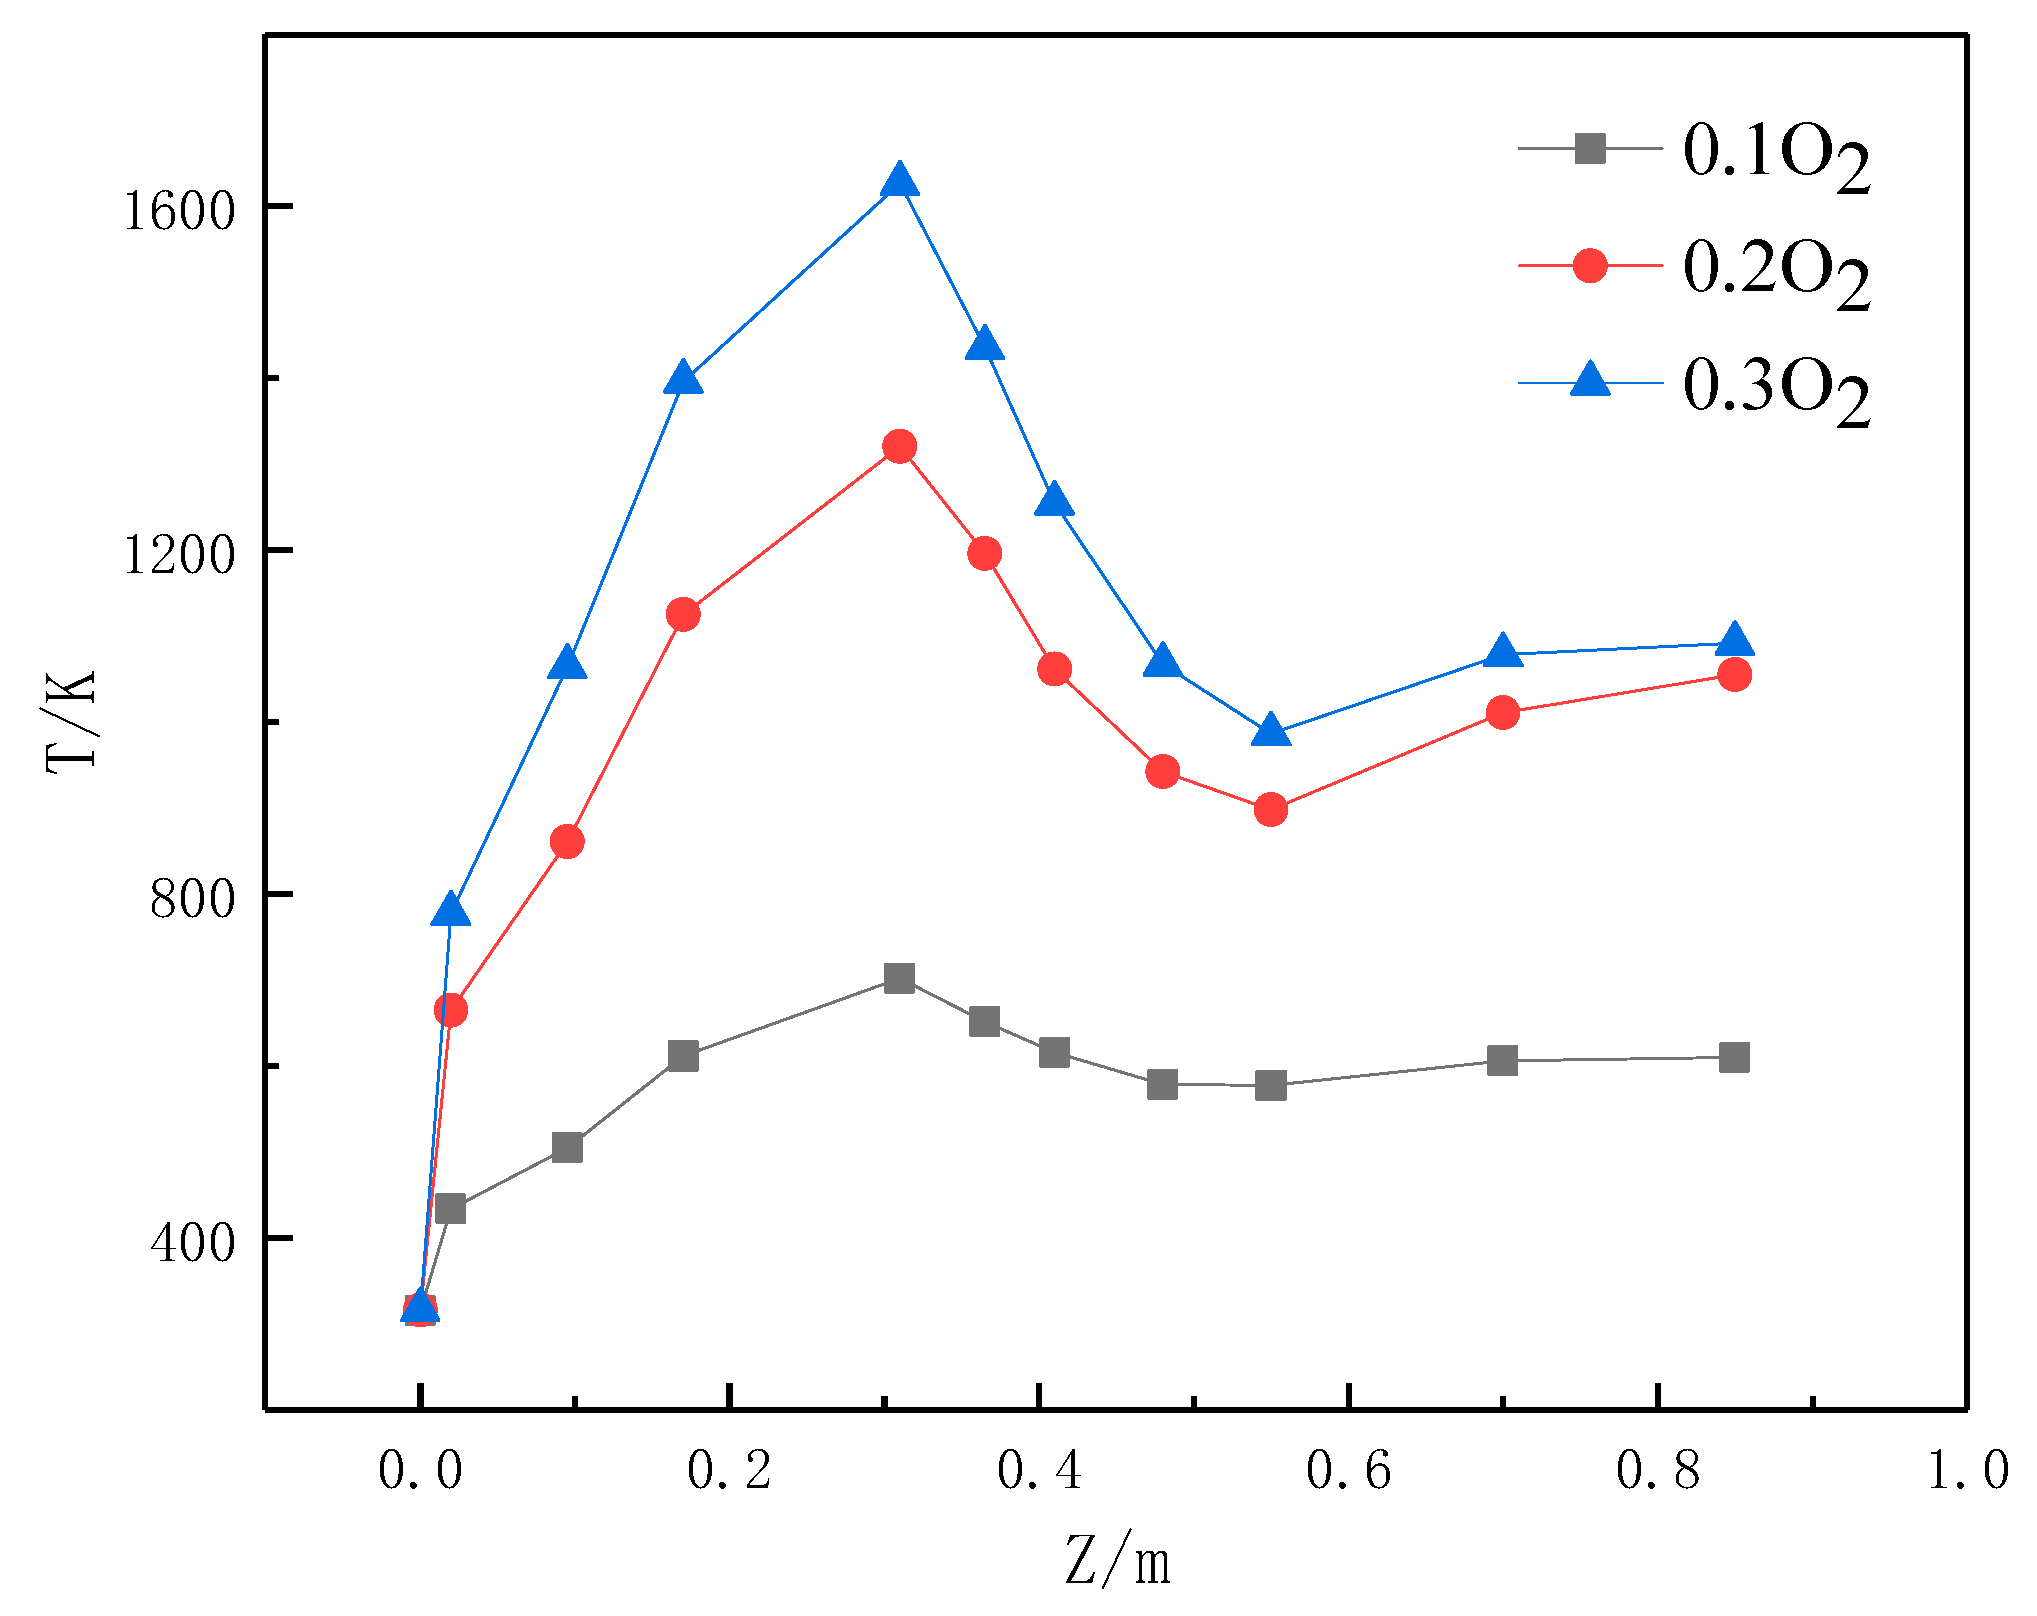
The O2 content was set at 0.1, 0.2, and 0.3, and the citric acid concentration was 0.04. The average temperature in the Venturi pipe reactor was monitored by selecting inlet and Z1-Z10 as the 11 monitoring areas. As can be seen from Figure 8, in the first half of the reactor, the higher the O2 content, the higher the temperature, which indicates more fully combusted methane. The maximum temperature inside the reactor is reached near the front end of the throat. In the throat part, the endothermic reaction, like CeO2, absorbs the heat and causes a decrease in temperature. In contrast, the citric acid reaction releases the heat in the latter part of the throat and leads to a slight recovery in temperature in the latter half of the reactor. The changing O2 content corresponds to three temperature curves with similar trends. A higher O2 content leads to a more complete exothermic reaction and higher temperature, which is beneficial for the pyrolysis preparation of CeO2.
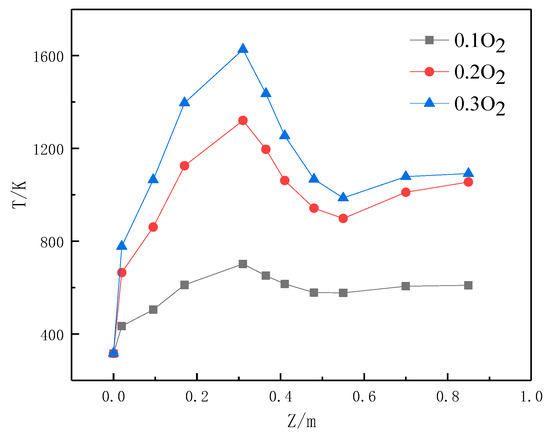
Figure 8.
Temperature curves with respect to the O2 ratio.
3.3.2. Distribution of Solid Particles
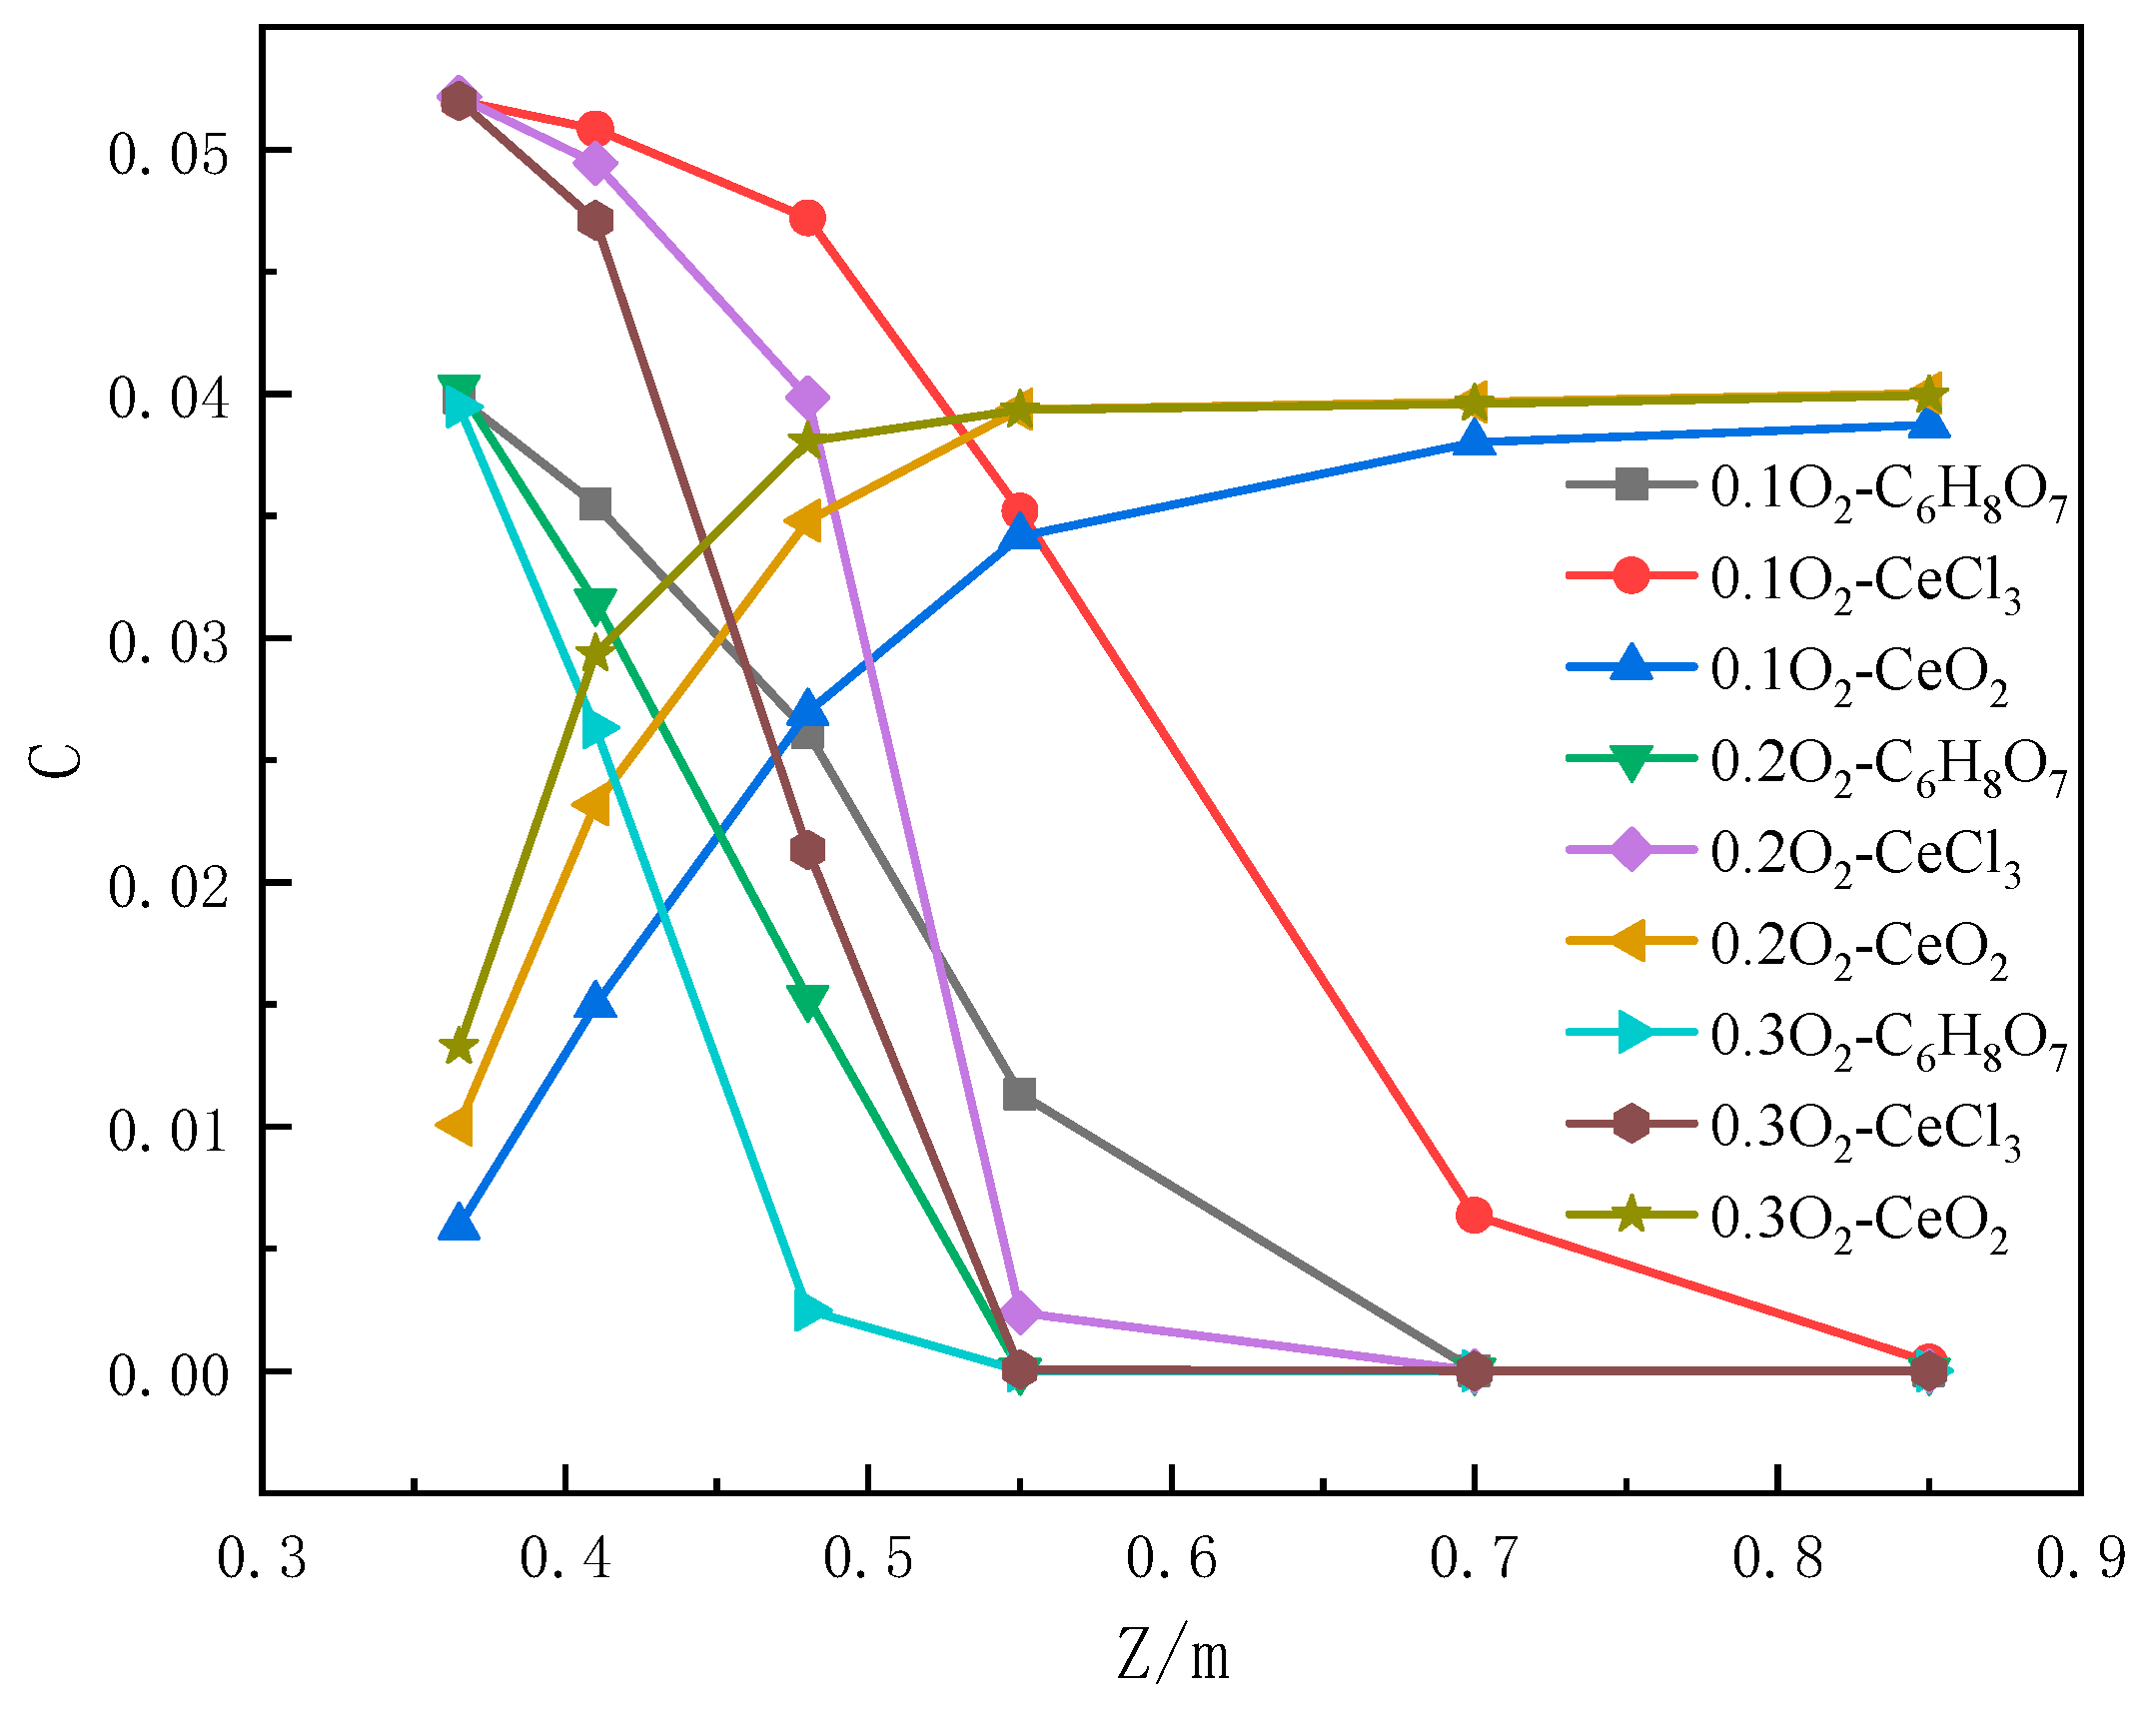
The gas-solid reaction primarily occurs at the throat and its latter part. Six monitoring areas, Z5–Z10, were set to monitor the maximum content of solid particles in the reactor. Figure 9 is the change in solid particles’ concentration with respect to O2 concentrations. As shown in Figure 9, a higher O2 content leads to a more complete reaction of solid particles and higher percent conversion. Therefore, the solid particles are not likely to accumulate in the throat part and the CeO2 product content is higher. Figure 10 shows the O2 content distribution nephogram in the outlet with respect to varying O2 ratios. Figure 10 fully illustrates that the O2 content in the outlet is highest when the O2 content is 0.03, and a certain amount of residue indicates that the reaction is complete. Therefore, by combining the influence of temperature and solid particle concentration, the optimal condition for preparing CeO2 is to add citric acid and an oxygen content of 0.03.
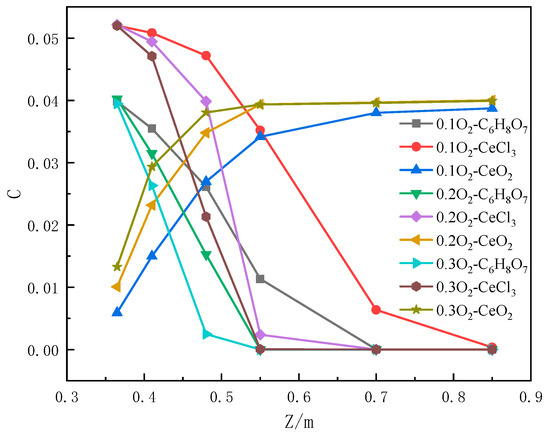
Figure 9.
Solid particle concentration curves with respect to the O2 ratio.
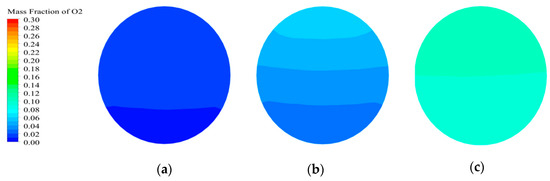
Figure 10.
O2 content distribution nephogram at the outlet with different O2 ratios: (a) 0.1 O2, (b) 0.2 O2, and (c) 0.3 O2.
3.4. Effects of Citric Acid Content on CeO2 Pyrolysis
3.4.1. Pressure
Gas pressure is related to factors including temperature and gas concentration. In a closed container, unstable gas pressure can create gas flow to strike the particle reactant, leading to inhomogeneous contact with the reactants. In the meantime, the huge pressure difference can cause solid particles to form a jam when entering the expansion chamber from the contraction chamber. Therefore, the inlet1 and 11 monitoring areas, Z1-Z10, were set to monitor the gas pressure, and the correlation of citric acid addition ratio from 0 and 0.04 was analyzed. As seen in Figure 11, the highest negative pressure was produced at the contraction chamber. In addition, at positions before the second expansion chamber in the reactor, the pressure change with respect to the citric acid addition ratio was almost the same. After expansion, the pressure significantly decreased when adding the citric acid. This is because there is an exothermic reaction between the citric acid and O2 in the second expansion part in the reactor, causing the temperature to increase and the gas pressure to decrease. When the addition ratio increases from 0.01 to 0.04, a large amount of CO2 is produced in the reaction of citric acid and O2, which is enough to compensate for the pressure change brought by the temperature increase. At this time, the pressure of the position after the second expansion part was slightly increased compared with no addition of citric acid.
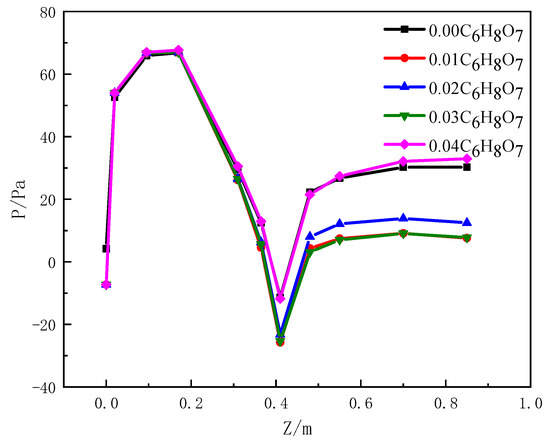
Figure 11.
Reactor pressure curves with different citric acid ratios.
For pyrolysis in a closed reactor, the pressure instability can influence the morphology and size of CeO2 particles, creating substandard CeO2 particles. Therefore, based on pressure stability, a citric acid content of 0.04 should be selected as the optimal preparation condition.
3.4.2. CeO2 Concentration
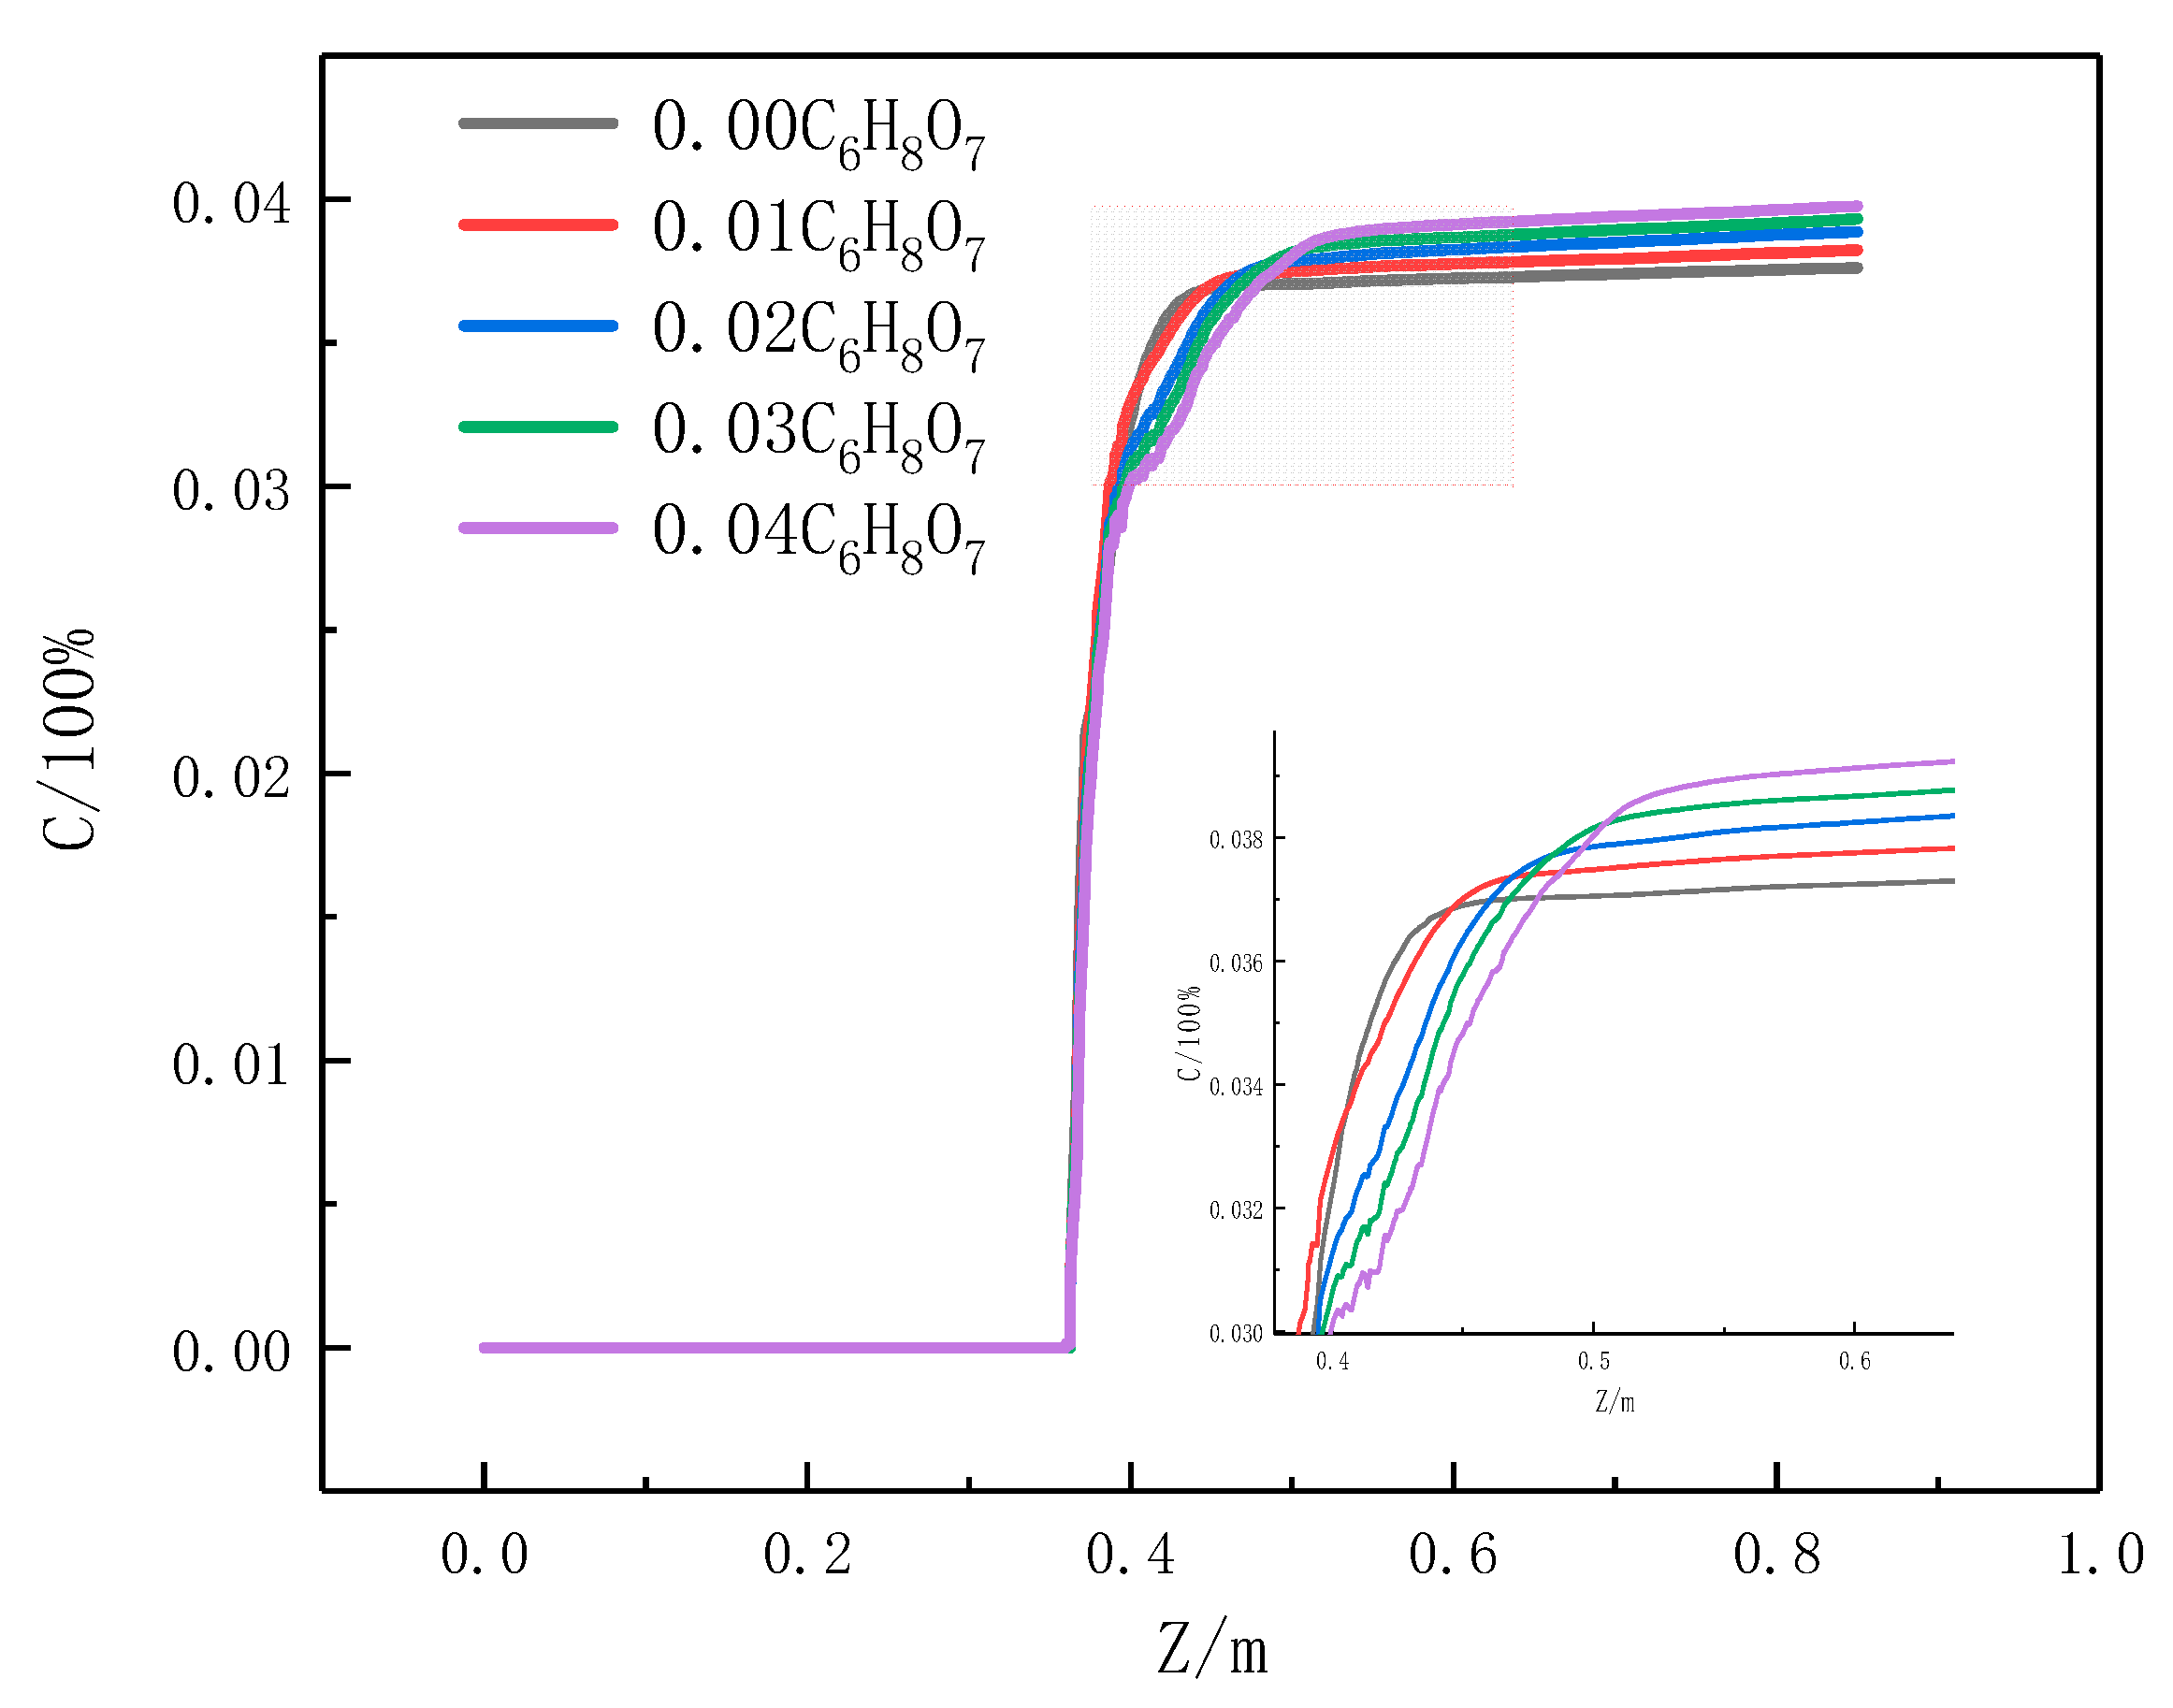
The CeO2 concentration change on the monitoring line is shown in Figure 12. When citric acid is added, the CeO2 concentration slightly decreased at the throat, while the CeO2 concentration at the outlet slightly increased. This is because of the CO2 generated in the reaction of citric acid and O2, which influences the CeO2 pyrolysis reaction and changes the CeO2 distribution inside the Venturi reactor. As the addition ratio of citric acid increases from 0.01 to 0.04, the CeO2 concentration at the throat of the reactor is reduced, and the CeO2 concentration at the outlet is increased. Therefore, 0.04 should be selected as the citric acid addition ratio, which can improve the CeO2 particle distribution and decrease the product particle jam near the throat.
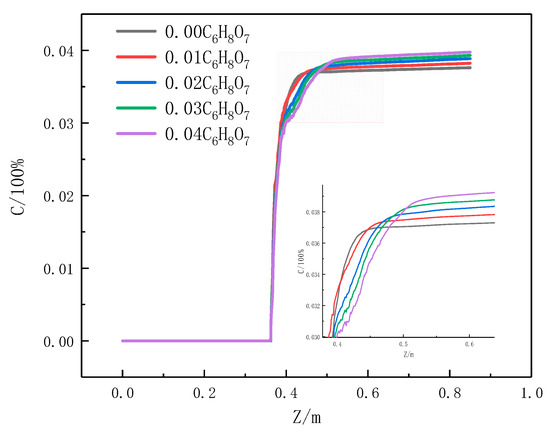
Figure 12.
Relationship between the highest CeO2 concentration and various citric acid ratios.
3.4.3. Characterization of CeO2
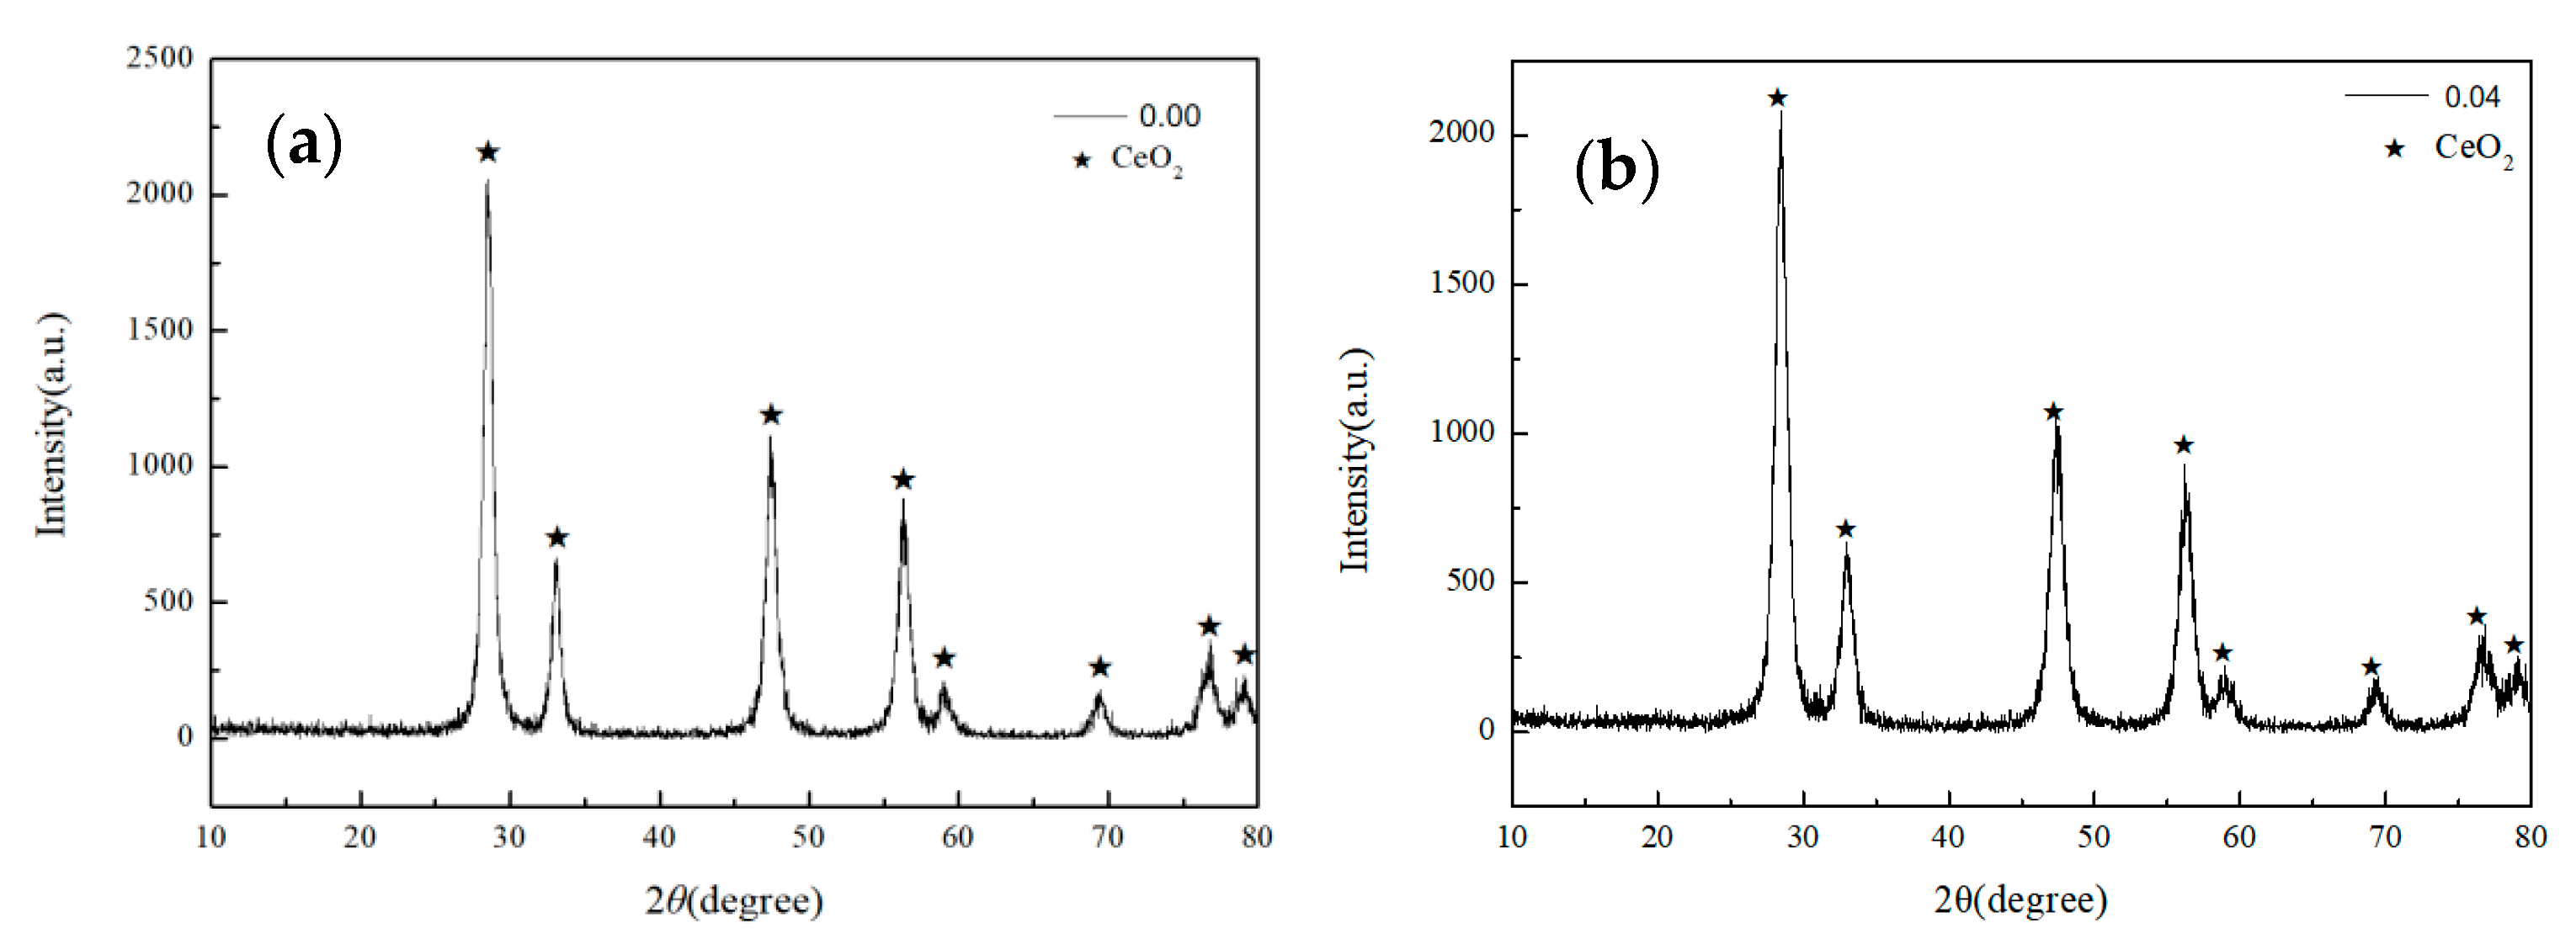
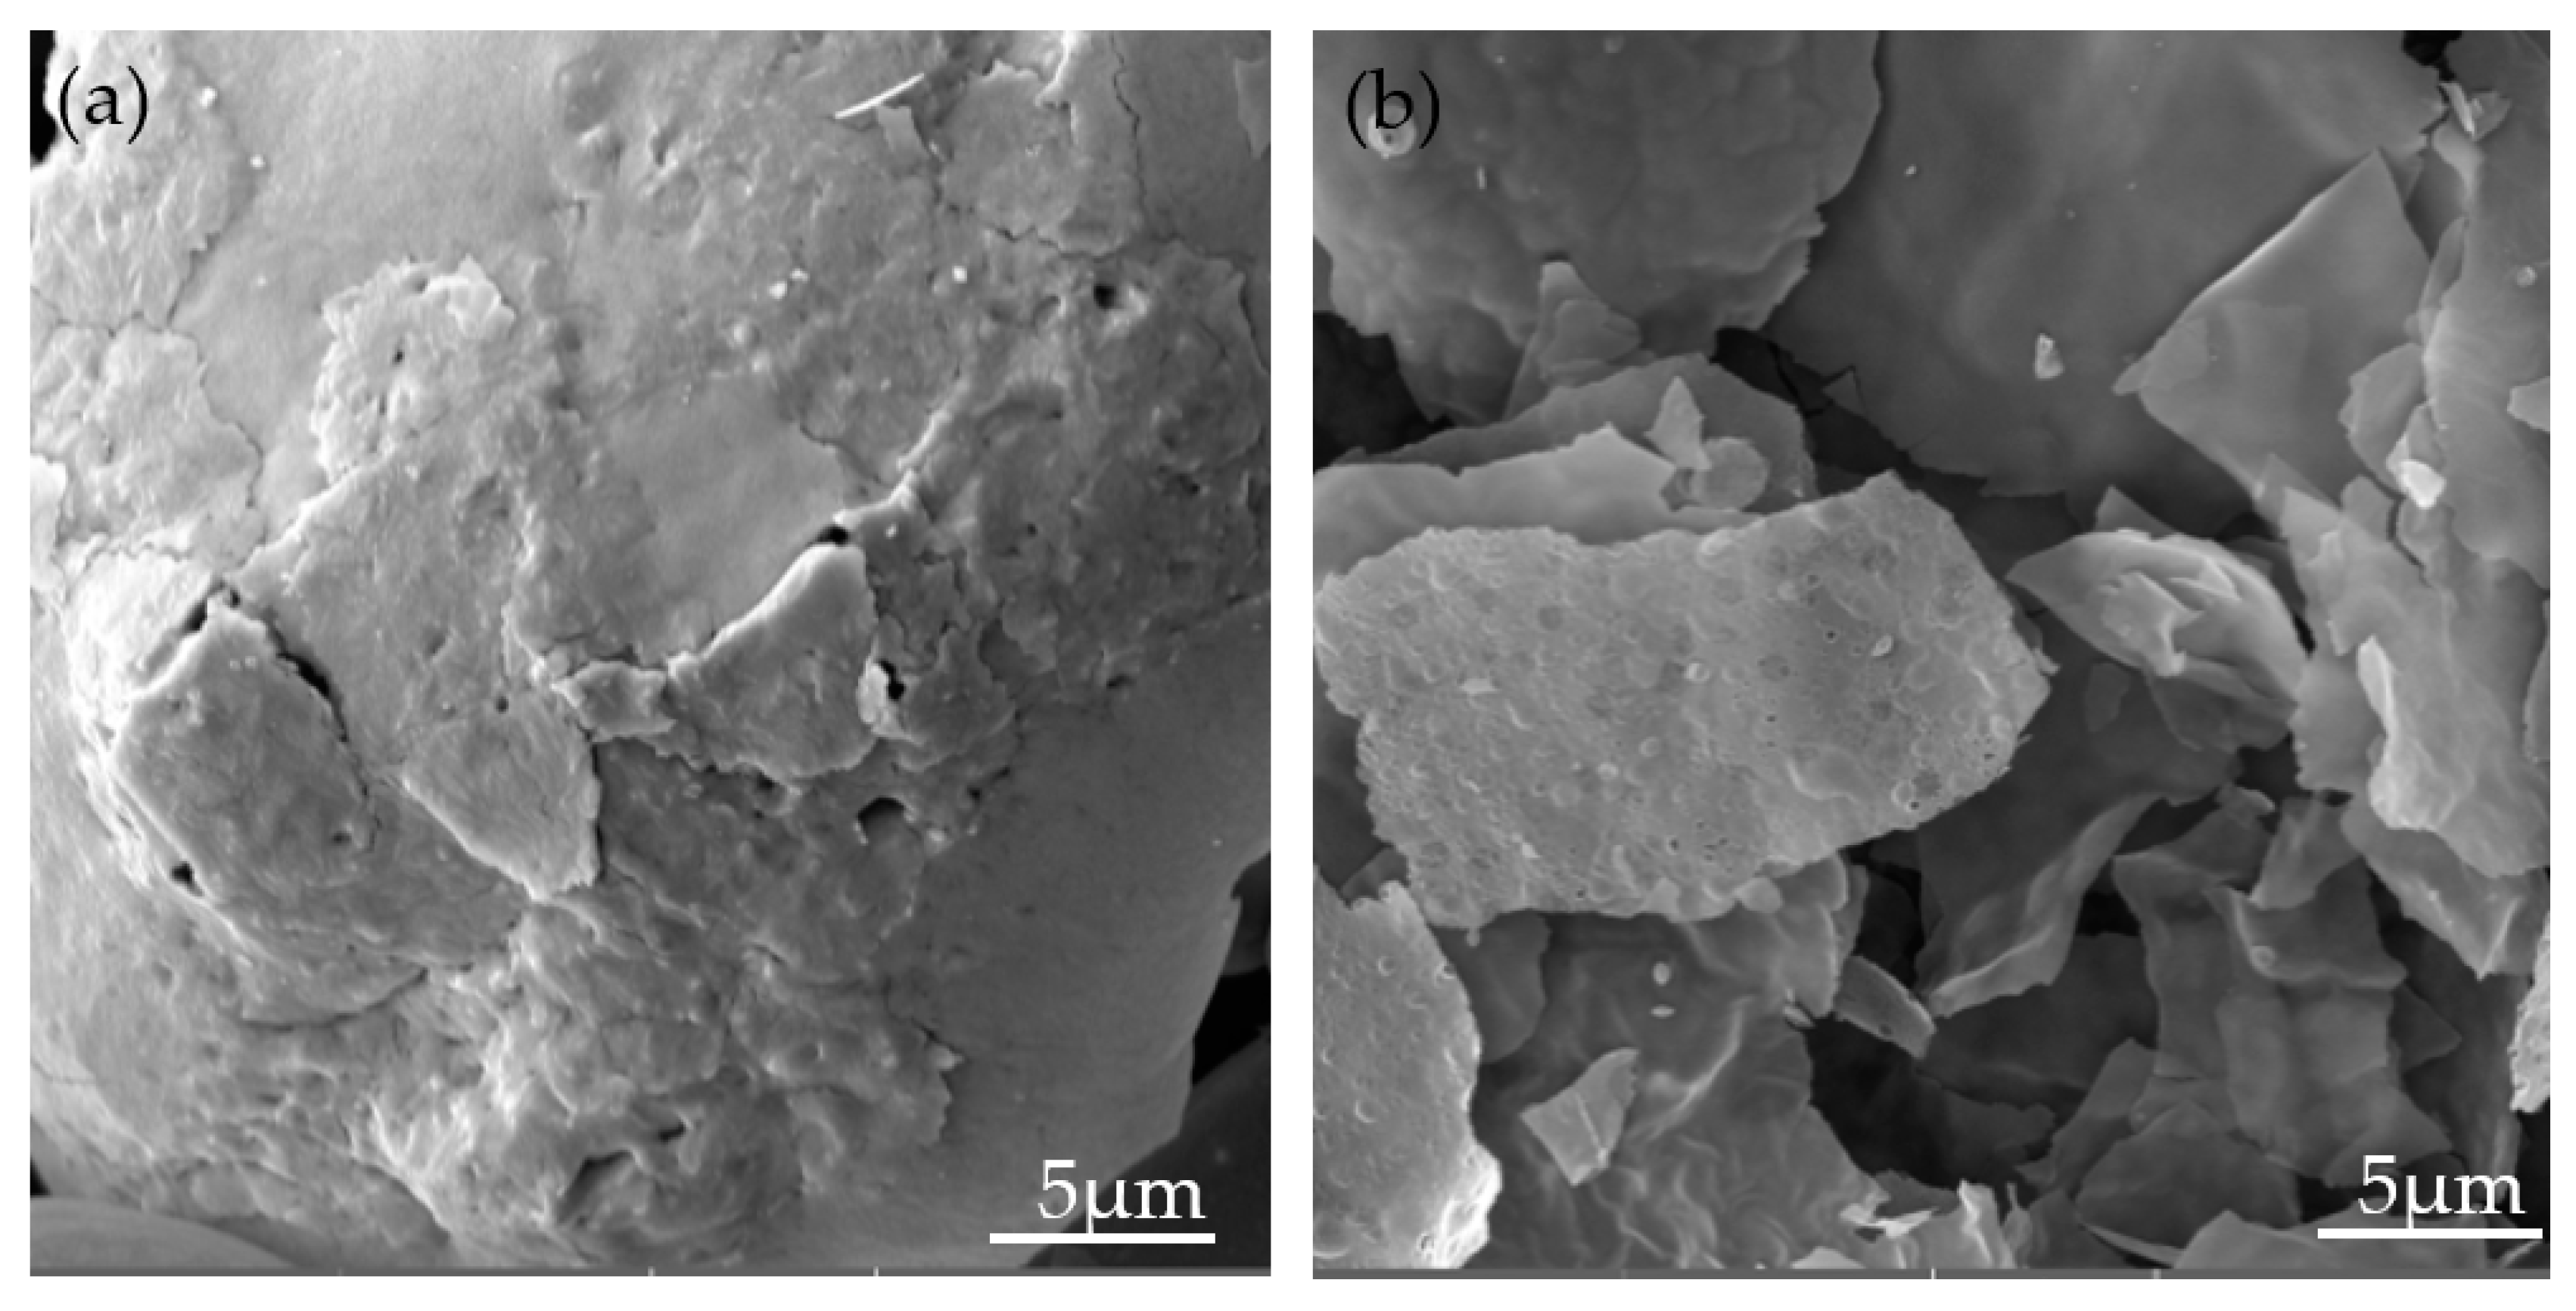
XRD and SEM analyses of the products CeO2 have been investigated in an experiment when the mass fraction of citric acid changed (0.00, 0.04). The Miniflex600 desktop X-ray diffractometer was used for the phase analysis of the sample. The FIB/FE-SEM GAIA 3 XMN dual ion field emission scanning electron microscope was used to observe the micro morphology of the sample. The XRD analysis in Figure 13 shows that the CeO2 sample prepared in the experiment consists of a single phase of CeO2, and the CeO2 has a high purity. In Figure 14, the SEM results show that the shape of CeO2 is spherical when the citric acid has a 0.00 mass fraction. With the mass fraction of citric acid increasing, the spherical CeO2 begins to burst, the shape of CeO2 gradually changes from sphere to plate-like, and the CeO2 finally forms a regular plate-like shape. This is because the citric acid completely decomposes into CO2 and H2O at high temperature, which increases the product gas pressure, and the spherical particles finally “burst” into fragments.
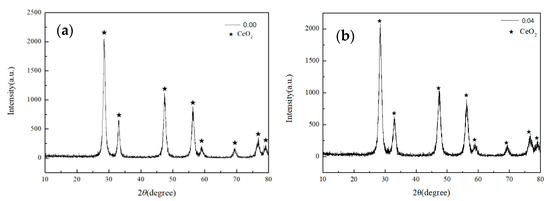
Figure 13.
XRD analysis of the products CeO2 when the mass fraction of citric acid changed: (a) 0.00 and (b) 0.04.

Figure 14.
SEM analysis of the products CeO2 when the mass fraction of citric acid changed: (a) 0.00 and (b) 0.04.
4. Conclusions
(1) In pyrolysis, the addition of citric acid relieves the highest negative pressure within the reactor and decreases the strike of negative pressure on the inner wall of the throat. It also pushes the position of maximum temperature in the reactor backwards and increases the minimum temperature, which causes the distribution of CO2 to be inhomogeneous, with most CO2 concentrated in the material inlet and the bottom half of the throat.
(2) A higher O2 content leads to more complete chemical reactions inside the reactor, higher temperature within the reactor, and higher conversion rate of the solid reactants so that the throat is less likely to be jammed. When the O2 content is 30 wt %, the pyrolysis temperature is the highest, and the distribution effect of the CeO2 component concentration is the best at the highest conversion.
(3) Higher citric acid ratios result in more stable pressure inside the reactor and better distribution of the CeO2 component concentration. When the citric acid content is 4 wt %, the pressure inside the reactor is the most stable, and the distribution effect of the CeO2 component concentration is the best.
Author Contributions
Conceptualization, C.L.; Funding acquisition, C.L.; Methodology, M.-H.S.; Project administration, C.L.; Resources, Z.-F.W.; Software, M.-H.S.; Validation, H.-X.Y. and T.-Y.X.; Visualization, H.-X.Y. All authors have read and agreed to the published version of the manuscript.
Funding
This research was funded by the National Natural Science Foundation of China (51904069), the open fund of the Key Laboratory of iron and steel metallurgy and resource utilization of Wuhan University of science and technology (FMRU19-1), the Natural Science Foundation of Hebei Province of China (E2019501085), and the Scientific Research Fund project of Northeastern University at Qinhuangdao (XNY201808).
Institutional Review Board Statement
Not applicable.
Informed Consent Statement
Not applicable.
Data Availability Statement
Not applicable.
Conflicts of Interest
The authors declare the organizations that sponsored the research have no conflict of interest.
References
- Carvajal, S.; Perramón, M.; Casals, G.; Oró, D.; Ribera, J.; Morales-Ruiz, M.; Casals, E.; Casado, P.; Melgar-Lesmes, P.; Fernández-Varo, G.; et al. Cerium Oxide Nanoparticles Protect against Oxidant Injury and Interfere with Oxidative Mediated Kinase Signaling in Human-Derived Hepatocytes. Int. J. Mol. Sci. 2019, 20, 5959. [Google Scholar] [CrossRef] [PubMed] [Green Version]
- Kosynkin, V.D.; Arzgatkina, A.A.; Ivanov, E.N.; Chtoutsa, M.G.; Grabko, A.I.; Kardapolov, A.V.; Sysina, N.A. The study of process production of polishing powder based on cerium dioxide. J. Alloys Compd. 2000, 303–304, 421–425. [Google Scholar] [CrossRef]
- Chueh, W.C.; Hao, Y.; Jung, W.; Haile, S.M. High electrochemical activity of the oxide phase in model ceria-Pt and ceria-Ni composite anodes. Nat. Mater. 2012, 11, 155–161. [Google Scholar] [CrossRef] [PubMed] [Green Version]
- Lv, C.; Dou, Z.; Zhao, Q. Simulation of Process and Reactor Structure Optimization for CeO2 Preparation from Jet-Flow Pyrolysis. JOM 2019, 71, 1660–1666. [Google Scholar] [CrossRef]
- Chen, C.Y.; Tseng, T.K.; Tsai, S.C.; Lin, C.K.; Lin, H.M. Effect of precursor characteristics on zirconia and ceria particle morphology in spray pyrolysis. Ceram. Int. 2008, 34, 409–416. [Google Scholar] [CrossRef]
- Mercadelli, E.; Ghetti, G.; Sanson, A.; Bonelli, R.; Albonetti, S. Synthesis of CeO2 nanoaggregates of complex morphology. Ceram. Int. 2013, 39, 629–634. [Google Scholar] [CrossRef]
- Rood, S.C.; Ahmet, H.B.; Gomez-Ramon, A.; Torrente-Murciano, L.; Reina, T.R.; Eslava, S. Enhanced ceria nanoflakes using graphene oxide as a sacrificial template for CO oxidation and dry reforming of methane. Appl. Catal. B Environ. 2019, 242, 358–368. [Google Scholar] [CrossRef]
- Peedikakkandy, L.; Kalita, L.; Kavle, P.; Kadam, A.; Gujar, V.; Arcot, M.; Bhargava, P. Preparation of spherical ceria coated silica nanoparticle abrasives for CMP application. Appl. Surf. Sci. 2015, 357, 1306–1312. [Google Scholar] [CrossRef]
- Francesco, C.; Alberto, C.; Danilo, L. Thermally stable surfactant-free ceria nanocubes in silica aerogel. J. Colloid Interface Sci. 2021, 583, 376–384. [Google Scholar]
- Xi, Z.Q.; Chen, Y. Effect of zinc acetate on morphology and polishing properties of cerium oxide. Modem Chem. Ind. 2019, 39, 120–123. [Google Scholar]
- Mädler, L.; Stark, W.J.; Pratsinis, S.E. Flame-made ceriananoparticles. J. Res. 2002, 17, 1356–1362. [Google Scholar]
- Yang, G.S.; Bian, X.; Cui, L.X.; Xie, B.; Wu, W.Y. Study on Preparation of Nano Cerium Oxide Powder by Spray Roasting of Cerium Chloride Solution. Chin. Rare Earths 2017, 38, 72–78. [Google Scholar]
- Lv, C.; Zhang, T.A.; Dou, Z.H.; Zhao, Q.Y. Numerical simulation of preparation of ultrafine cerium oxides using jet-flow pyrolysis Rare. Metals 2019, 38, 1160–1168. [Google Scholar]
- Lv, C.; Zhang, T.A.; Hao, B. Simulation of the Scale-Up Process of a Venturi Jet Pyrolysis Reactor. Metals 2019, 9, 979. [Google Scholar] [CrossRef] [Green Version]
- Izu, N.; Uchida, T.; Matsubara, I.; Itoh, T.; Shin, W.; Nishibori, M. Formation mechanism of monodispersed spherical core–shell ceria/polymer hybrid nanoparticles. Mater. Res. Bull. 2011, 46, 1168–1176. [Google Scholar] [CrossRef]
- Wu, W.Y.; Xue, S.F.; Bian, X.; Wang, Z.F. Study on the Preparation Process for CeO2 Superfine Powder. J. Northeast. Univ. (Nat. Sci.) 2015, 36, 800–804. [Google Scholar]
- Akroyd, J.; Smith, A.J.; Shirley, R.; McGlashan, L.R.; Kraft, M. A coupled CFD-population balance approach for nanoparticle synthesis in turbulent reacting flows. Chem. Eng. Sci. 2011, 66, 3792–3805. [Google Scholar] [CrossRef]
- Sung, Y.; Raman, V.; Fox, R.O. Large-eddy-simulation-based multiscale modeling of TiO2 nucleation chemistry. Chem. Eng. Sci. 2011, 66, 4370–4381. [Google Scholar] [CrossRef]
- Li, X.G.; Ma, B.G.; Wu, B.; Jian, S.W.; Luo, Z.T. Numerical simulation and optimization of cold air flow field in sprayed calciners. J. Harbin Inst. Technol. 2009, 41, 226–228. [Google Scholar]
- Lv, C. Numerical Simulation of Pyrolysis Process of Metal Chlorides; Northeastern University: Shen Yang, China, 2017. [Google Scholar]


Publisher’s Note: MDPI stays neutral with regard to jurisdictional claims in published maps and institutional affiliations. |
© 2021 by the authors. Licensee MDPI, Basel, Switzerland. This article is an open access article distributed under the terms and conditions of the Creative Commons Attribution (CC BY) license (https://creativecommons.org/licenses/by/4.0/).