Article

Study on Flexural Performance of Concrete Beams Reinforced by Steel Fiber and Nano–SiO2 Materials

1
School of Civil Engineering and Architecture, Zhengzhou University of Aeronautics, Zhengzhou 450046, China
2
State Key Laboratory of Green Building in Western China, Xi’an 710043, China
3
School of Civil Engineering, Henan Institute of Engineering, Zhengzhou 451191, China
*
Author to whom correspondence should be addressed.
Crystals 2021, 11(8), 927; https://doi.org/10.3390/cryst11080927
Submission received: 7 July 2021 / Revised: 4 August 2021 / Accepted: 9 August 2021 / Published: 10 August 2021

Abstract

:
Steel fiber and Nano–SiO2 reinforced concrete is a novel material of concrete which has great potential to be used in practical engineering. However, there is relatively little literature available on the flexural behavior of steel fiber and Nano–SiO2 materials reinforced concrete (SFNMRC) beams. Hence, the main objective of this paper is to investigate the flexural performance of SFNMRC beams through combined experimental and theoretical studies. A total of 10 specimens were tested to investigate the flexural behavior and the effect of some key parameters, including concrete strength, the volume fraction of steel fiber, and the amount of Nano–SiO2. The load vs. deflection curves of SFNMRC beams during the whole loading process were analyzed in detail. The failure mode was discussed in detail, and the specimens all behaved in a very ductile manner. Furthermore, the test results indicated that bending cracks and concrete crushing were formed in the compression zone of all specimens. With the increase in concrete strength and the volume fraction of steel fiber, both the cracking load and ultimate load of beams increased. The amount of Nano–SiO2 had a limited effect on the flexure performance. Finally, the calculation formula for predicting the flexural bearing capacity of SFNMRC beams was derived with consideration of the effect of steel fiber on the cracked sections after beam cracking. The predicted results show satisfactory agreement with both experimental results. The studies may provide a considerable reference for designing this type of structure in engineering practice.

1. Introduction

Concrete material is the foundation of engineering construction, which is widely used in water conservancy and hydropower, marine coasts, civil construction, roads, bridges, etc. However, ordinary concrete is brittle and has low tensile strength; thus, it can easily crack under a stress load. With a continuous increase in load amount, cracks develop rapidly. Adding steel fiber into ordinary concrete can effectively delay the generation of tension cracks and improve tensile properties, shear properties, and bending properties [1]. Experimental research shows that incorporating an appropriate amount of steel fibers can enhance the shear capacity of reinforced concrete (RC) beams and slabs [2,3,4,5]. The compressive strength of steel fiber reinforced concrete is mainly related to the performance of concrete [6,7,8] but has nothing to do with the length–diameter ratio of steel fiber [9]. An increase in the steel fiber volume ratio has limited improvement in compressive strength, generally within 25%. However, the compressive strength shows a downward trend when the steel fiber volume ratio is greater than 1.0–2.0% [10,11]. The influence of steel fiber on the strength of concrete is mainly reflected in the remarkable improvement of tensile properties. Generally, when the volume ratio of steel fiber is 1.0–2.0%, the tensile strength can be improved by 40–190% compared with ordinary concrete. The tensile strength can be improved to a greater extent by increasing concrete strength [12,13,14]. At the same time, the greater the length–diameter ratio of steel fiber, the higher the tensile strength of steel fiber reinforced concrete [9]. Steel fiber can also improve the flexural strength and flexural toughness of concrete. The research results show that the flexural strength of steel fiber concrete is much higher than that of ordinary concrete. When the volume ratio of steel fiber reaches 2.0%, the flexural strength of steel fiber concrete is about 50–90% higher than that of ordinary concrete [15,16,17].
However, the micro-scale composite of fiber materials that can improve the performance of the concrete structure is relatively limited, so it is a good area to explore further and popularize the micro-scale composite materials [18,19]. Theoretically speaking, micro-scale materials, such as nanomaterials, can be better and more evenly dispersed in a concrete matrix and interface structure by taking advantage of their scale advantages [20,21,22]. Compared to other nanoparticles (for example, Nano–CaCO3), Nano–SiO2 has a unique advantage in the potential pozzolanic reaction with cement hydration products [23,24].
Nano–SiO2 (hereafter called NS) is widely used in cement-based materials, and it can promote a pozzolanic reaction when added into concrete admixture. The pore filling effect of NS can reduce the porosity and improve the permeability resistance of the matrix [25,26,27]. Khed [28] studied the combined effect of nano-silica and fly ash on the properties of self-compacting concrete. They observed that the compressive strength increased by 94% on 70% fly ash and 5% NS compared to concrete prepared with 70% fly ash alone. Gaitero [29] observed that the calcium leaching rate could be remarkably reduced from cement paste on the addition of 6% of NS in cement. Kong [30] observed a higher resistance for the mortar to chloride penetration by means of adding NS. Wang [31] studied the influence of nanomaterials on the performance of road cement concrete. The test results showed that adding the appropriate amount of NS and TiO2 into concrete could improve compressive strength, flexural strength, and permeability resistance. Shih [32] carried out an experimental study on the effect of nano-silica on the properties of Portland cement composites. The results showed that the strength of cement paste mixture could be effectively improved by adding sol-state nano-silica. Li [33] indicated that adding NS and Nano-Fe2O3 into cement mortar could fill capillary pores in cement mortar, accelerate the hydration reaction of cement, and increase the performance of slurry. Zhang [34] studied the influence of NS on steel fiber concrete. The test results showed that adding a certain amount of NS could improve the compressive strength, splitting tensile strength, and flexural strength of steel fiber reinforced concrete.
The related research indicated that there were many types of research on steel fiber reinforced concrete or nano-concrete formed by adding steel fiber or nanomaterials. However, there is little research on steel fiber and Nano–SiO2 materials reinforced concrete (SFNMRC) beams formed by adding steel fiber and nanomaterials at the same time. Therefore, this paper uses the complementary advantages of Nano–SiO2 and steel fiber to study the flexural behavior of SFNMRC beams. Ten specimens were tested, and the effects of key parameters such as concrete strength, steel fiber volume fraction, and the amount of NS on the flexural performance of beams were studied. Based on the experimental results, the failure mode, load–deflection relationship, flexural capacity, and strain distribution along the height of the cross-section were analyzed elaborately. Furthermore, considering the effect of steel fiber on the cracked sections after beam cracking, the calculation formula for predicting the flexural capacity of SFNMRC beams was derived.

2. Experimental Programs

2.1. Materials

Ordinary Portland cement of 42.5 grade in accordance with China National Standard GB 175–2009 and clean tap water were used in the test. The fine aggregates were natural river sand with a fineness modulus of 2.73. The coarse aggregates were limestone gravel with a particle size of 5–20 mm. According to GB8076-2008 [35], liquid polycarboxylate water-reducer was used to improve the workability of the fresh concrete. Steel fibers added to the concrete are hook fibers to enhance the anchoring of fibers in the matrix (Figure 1a). The aspect ratio of the fiber used was equal to lf/df = 35 mm/0.55 mm = 64, and the nominal yield tensile strength was 1345 MPa. The Nano–SiO2 used was a highly purified amorphous silica powder with a large surface area, strong adsorption property, and good dispersion characteristics (Figure 1b). The average particle size of NS was 30 nm and the specific surface area was 200 m2/g.

2.2. Specimen Design

In this paper, a total of 10 specimens were designed and tested to investigate the flexural behavior of beams, including nine steel fiber and Nano–SiO2 materials reinforced concrete (SFNMRC) beams and one reinforced concrete (RC) beam. The parameters considered in the flexural test included concrete strength, steel fiber volume fraction, and the amount of NS. The detailed information of the specimens is summarized in Table 1 and Figure 2, where B, D, and L are the width, depth, and length of beam, respectively. The effective beam span was 2700 mm with end bearings of 150 mm. The distance between the two loading points in the pure bending zone was 900 mm, and the length of the shear span was 900 mm. Two 10 bars were embedded in the compression zone of the shear-span, and two main steel bars with a diameter of 16 mm were arranged in the tension zone along the longitudinal direction of the beam.
Meanwhile, six concrete cube specimens with dimensions of 150 mm × 150 mm × 150 mm and six concrete prismatic specimens with dimensions of 150 mm × 150 mm × 300 mm were prepared and cured under the same condition as the specimens; then, the compressive strength, splitting tensile strength, and elastic modulus of the concrete were determined according to GB/T 50081–2002 [36]. The cubic and prismatic specimens were cast from the same batch mix of concrete and tested simultaneously as the beam specimens. Three cubic and prismatic specimens were used to determine the average strength of each concrete mixture.
Before the bending tests, the mechanical properties of the respective steel and concrete were tested in accordance with the corresponding Chinese standard. The concrete cubes and prisms were tested using a universal testing machine (UTM) with a 3000 kN load capacity. The bars with a diameter of 10 mm had a yield strength of 375.0 MPa and ultimate strength of 547.7 MPa, while the bars with a diameter of 16 mm had a yield strength of 364 MPa and ultimate strength of 540.9 MPa. All beams had a concrete cover of 20 mm to the transverse stirrups. The detailed material properties are listed in Table 1.

2.3. Test Procedure

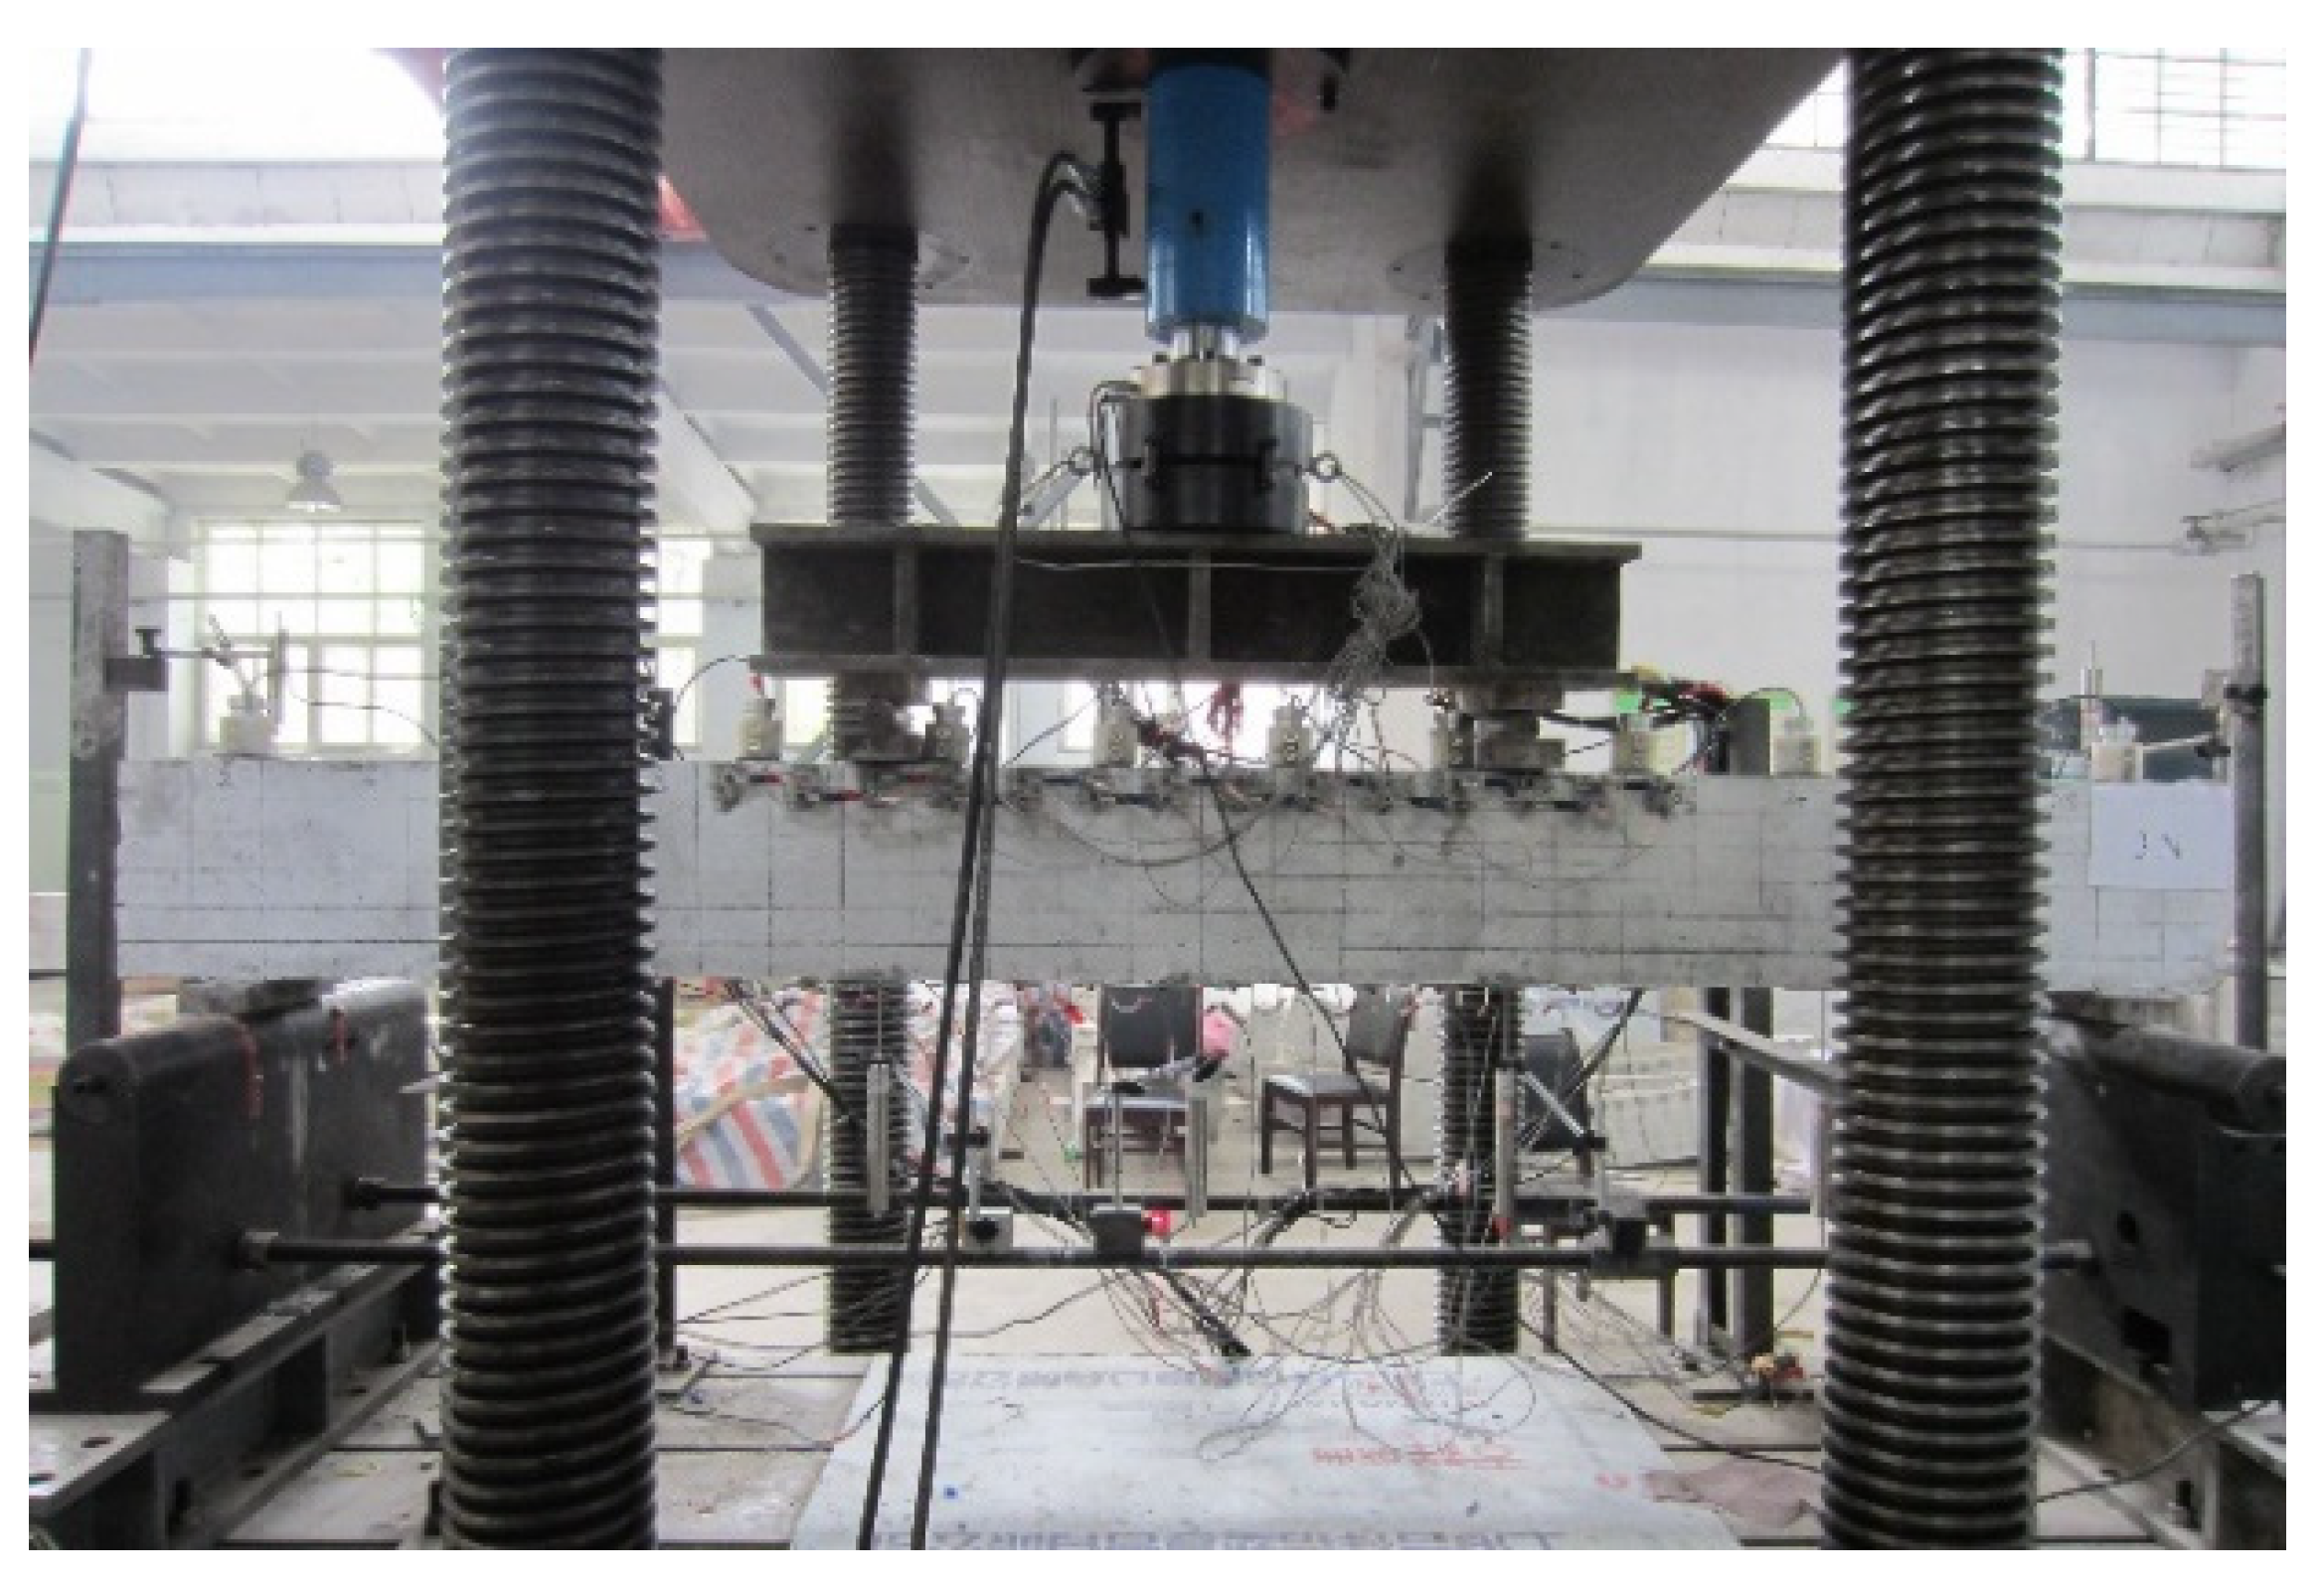
The test apparatus and loading set-up of the beam specimens are shown in Figure 2 and Figure 3. All tests were conducted under four points with simply supported condition. The load was applied to the specimens under monotonic loading using a 2000 kN hydraulic servo testing machine, and equal magnitude loads were applied at the two loading points located at a distance of one third of the span length from either support.
Before the formal loading, the specimen was preloaded 2–3 times to examine the reliability of the test setup and the instrumentations. The preload was less than 70% of the calculated cracking load, and then the formal loading stage began. A loading rate of 0.5–1.0 mm/min was adopted for formal loading. The loading of each stage was less than 5% of the ultimate load before the cracking load of the test beam, and the loading of each stage after the cracking load of the test beam was generally 10–20% of the ultimate load. After the load of each stage was stabilized, the indication values of each instrument were collected manually by the data acquisition system DH3816. After the formal loading was completed, the residual load was unloaded according to the loading grade.

3. Experimental Results and Discussion

3.1. Load–Midspan Deflection Relationship

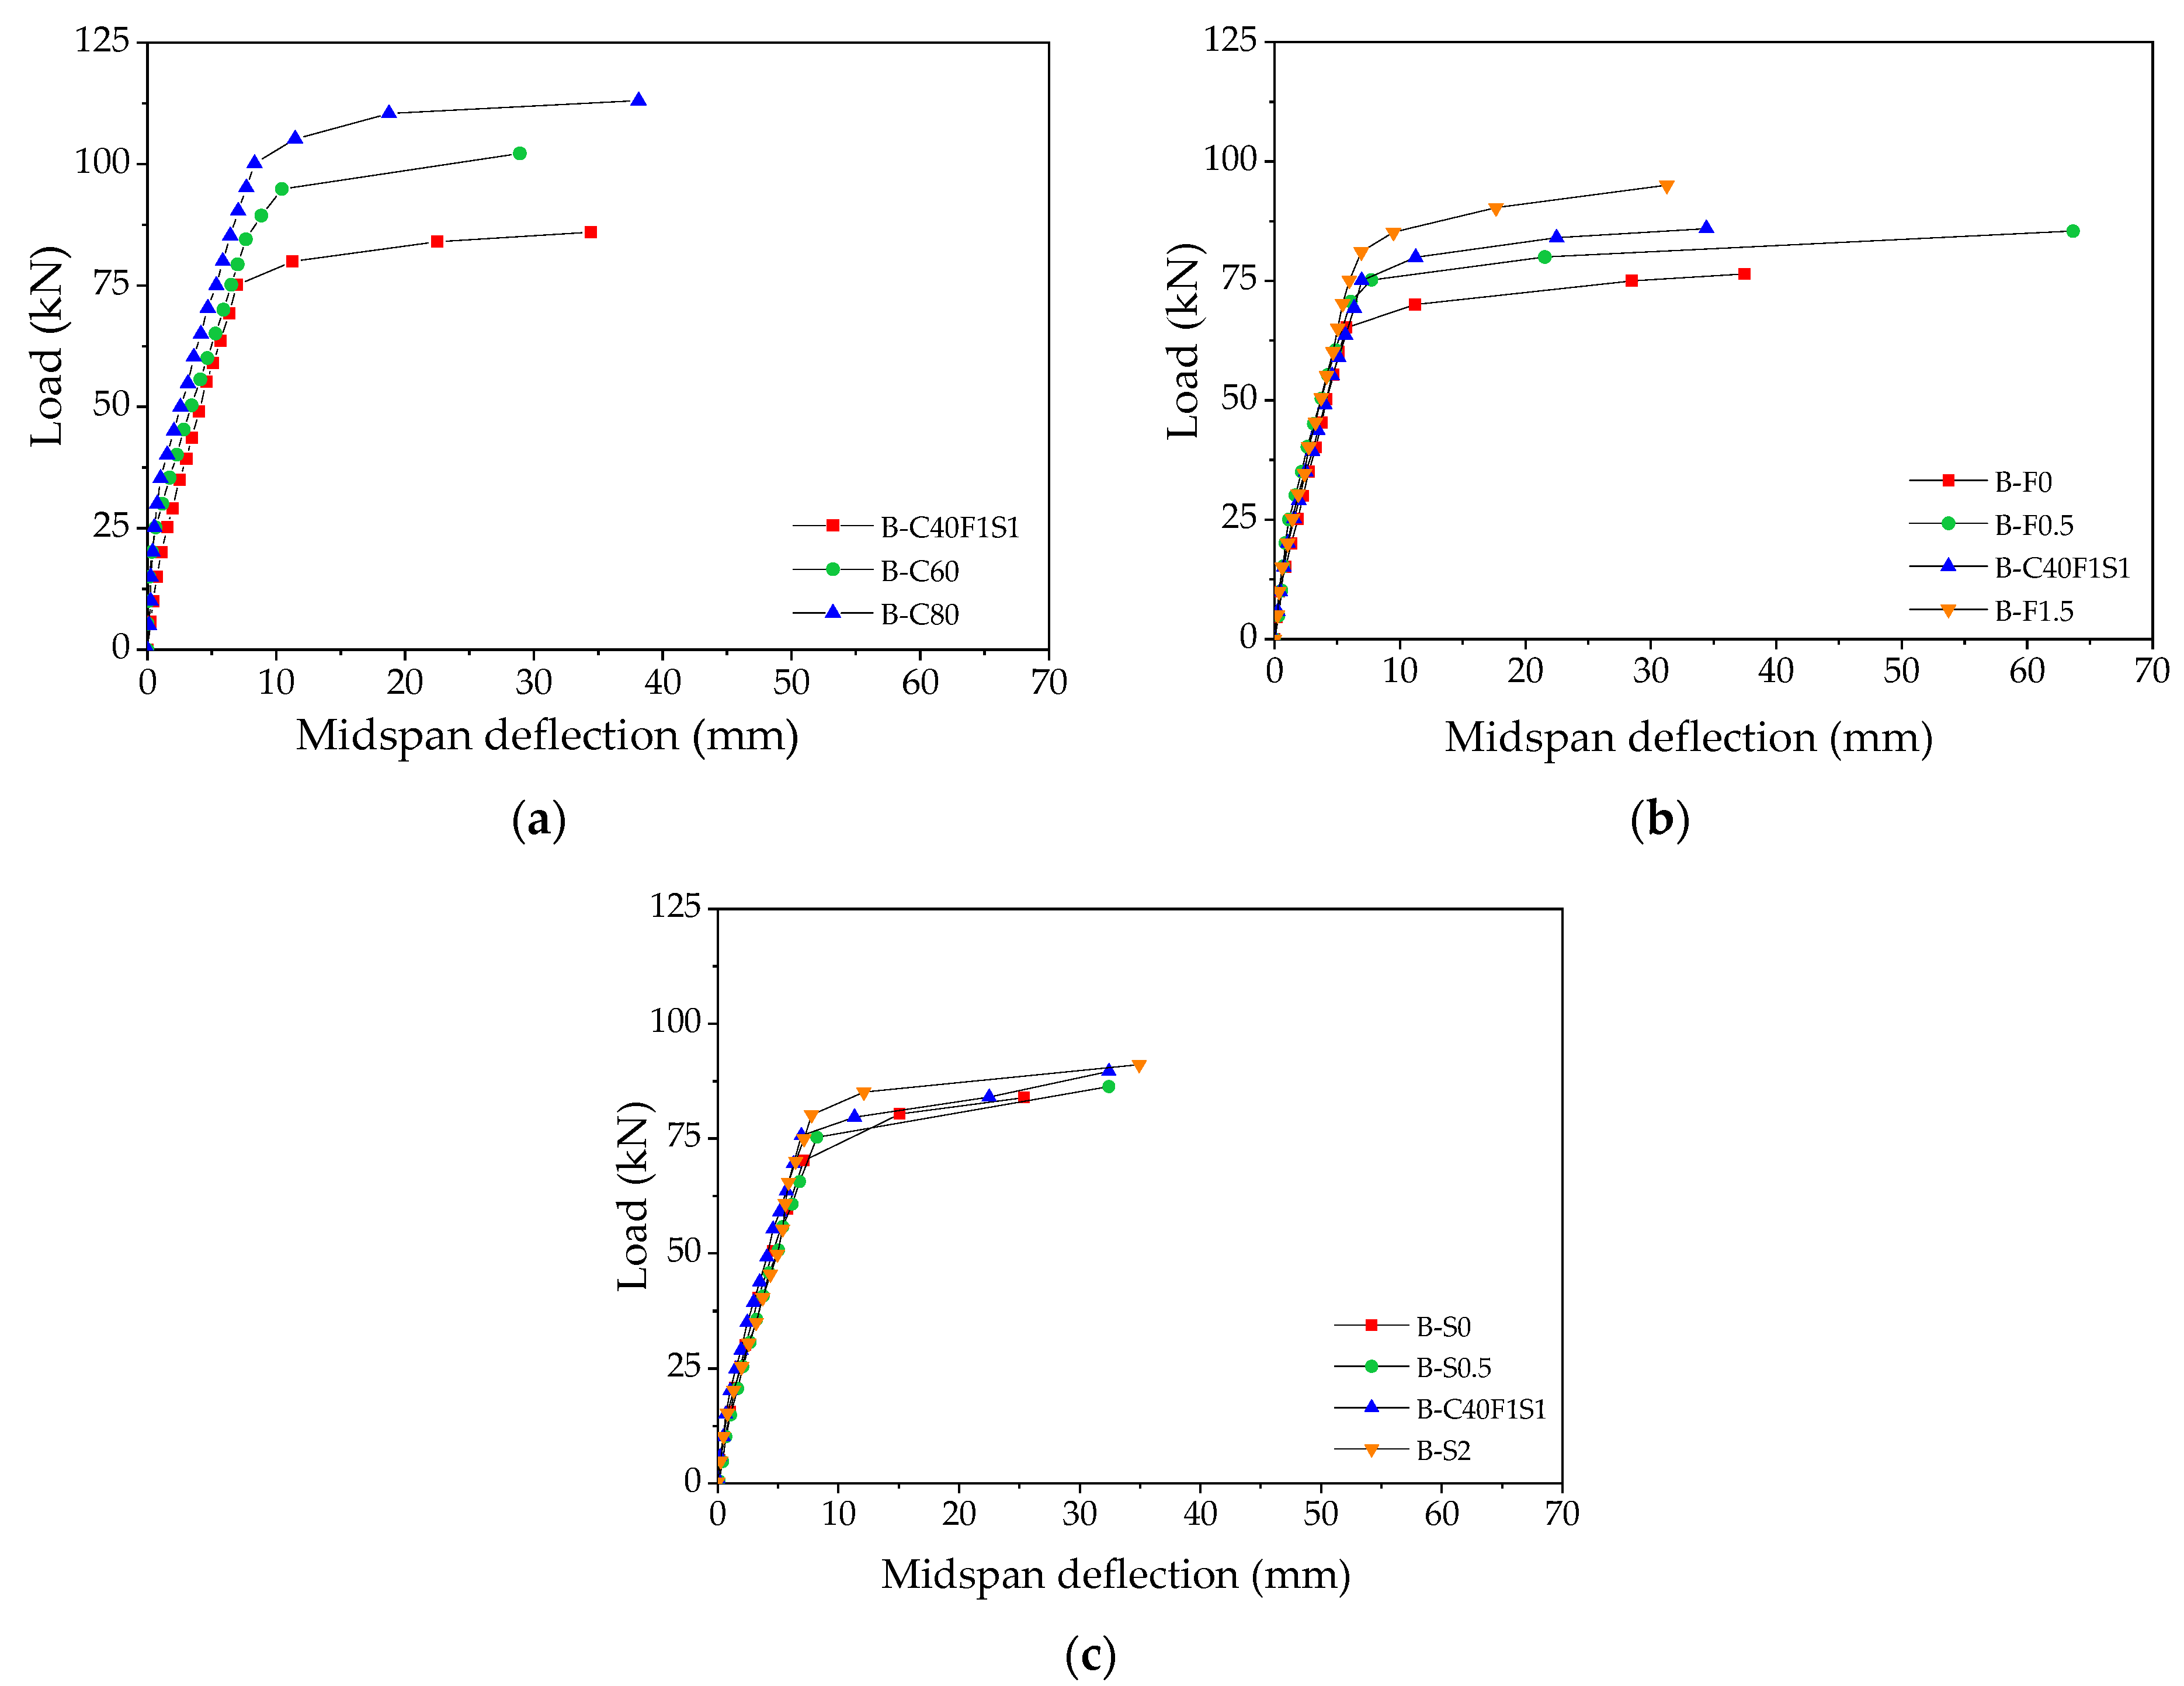
Based on the test observation and measured load vs. midspan deflection curves of specimens, as shown in Figure 4, the specimens under bending generally were considered to experience three stages until failure: loading stage, cracking stage, and yield stage of steel bars.
Loading stage: At the initial loading stage, all specimens were in the elastic phase, indicating that the applied load increased linearly with the displacement increasing. In this stage, the load increased faster than other stages, whereas the increment of deflection was very limited. The bending moment and tensile strain of the beam section were tiny, and the tensile stress in the tension zone was shared cooperatively by the concrete, steel fiber, and longitudinal main steel bars. Figure 4 shows that the higher the concrete strength, the higher the initial stiffness of the specimen beams, while the volume fraction of steel fiber and the amount of NS have little effect on the initial stiffness.
Cracking stage: At this stage, the cracks mainly propagated in the tension zone of the beams, which indeed resulted in a substantial degradation of structural stiffness as the load increased. However, the cracks distributed on the beam did not widen or extend immediately, because steel fiber can limit the crack propagation and bear tensile stress. Hence, the structural stiffness of SFNMRC beams did not decrease continuously with the increase of load.
Yield stage of steel bars: When the load increased and approached the ultimate load, the sudden fracture of steel fiber across the crack consumed a lot of energy, which led to a significant change in the slope of the curve. An obvious inflection point in the curve indicated that the steel bar began to enter the yield stage. At this stage, the load increased slowly, and the deflection increased significantly. No obvious descending in curves was observed, indicating a good ductility of specimens under bending. The load continued to grow, the cracks widened, and longitudinal cracks appeared at the top of the beam. Finally, the concrete in the compression zone was crushed and fell off, and the beam was damaged.

3.2. Ultimate Load (Pu)

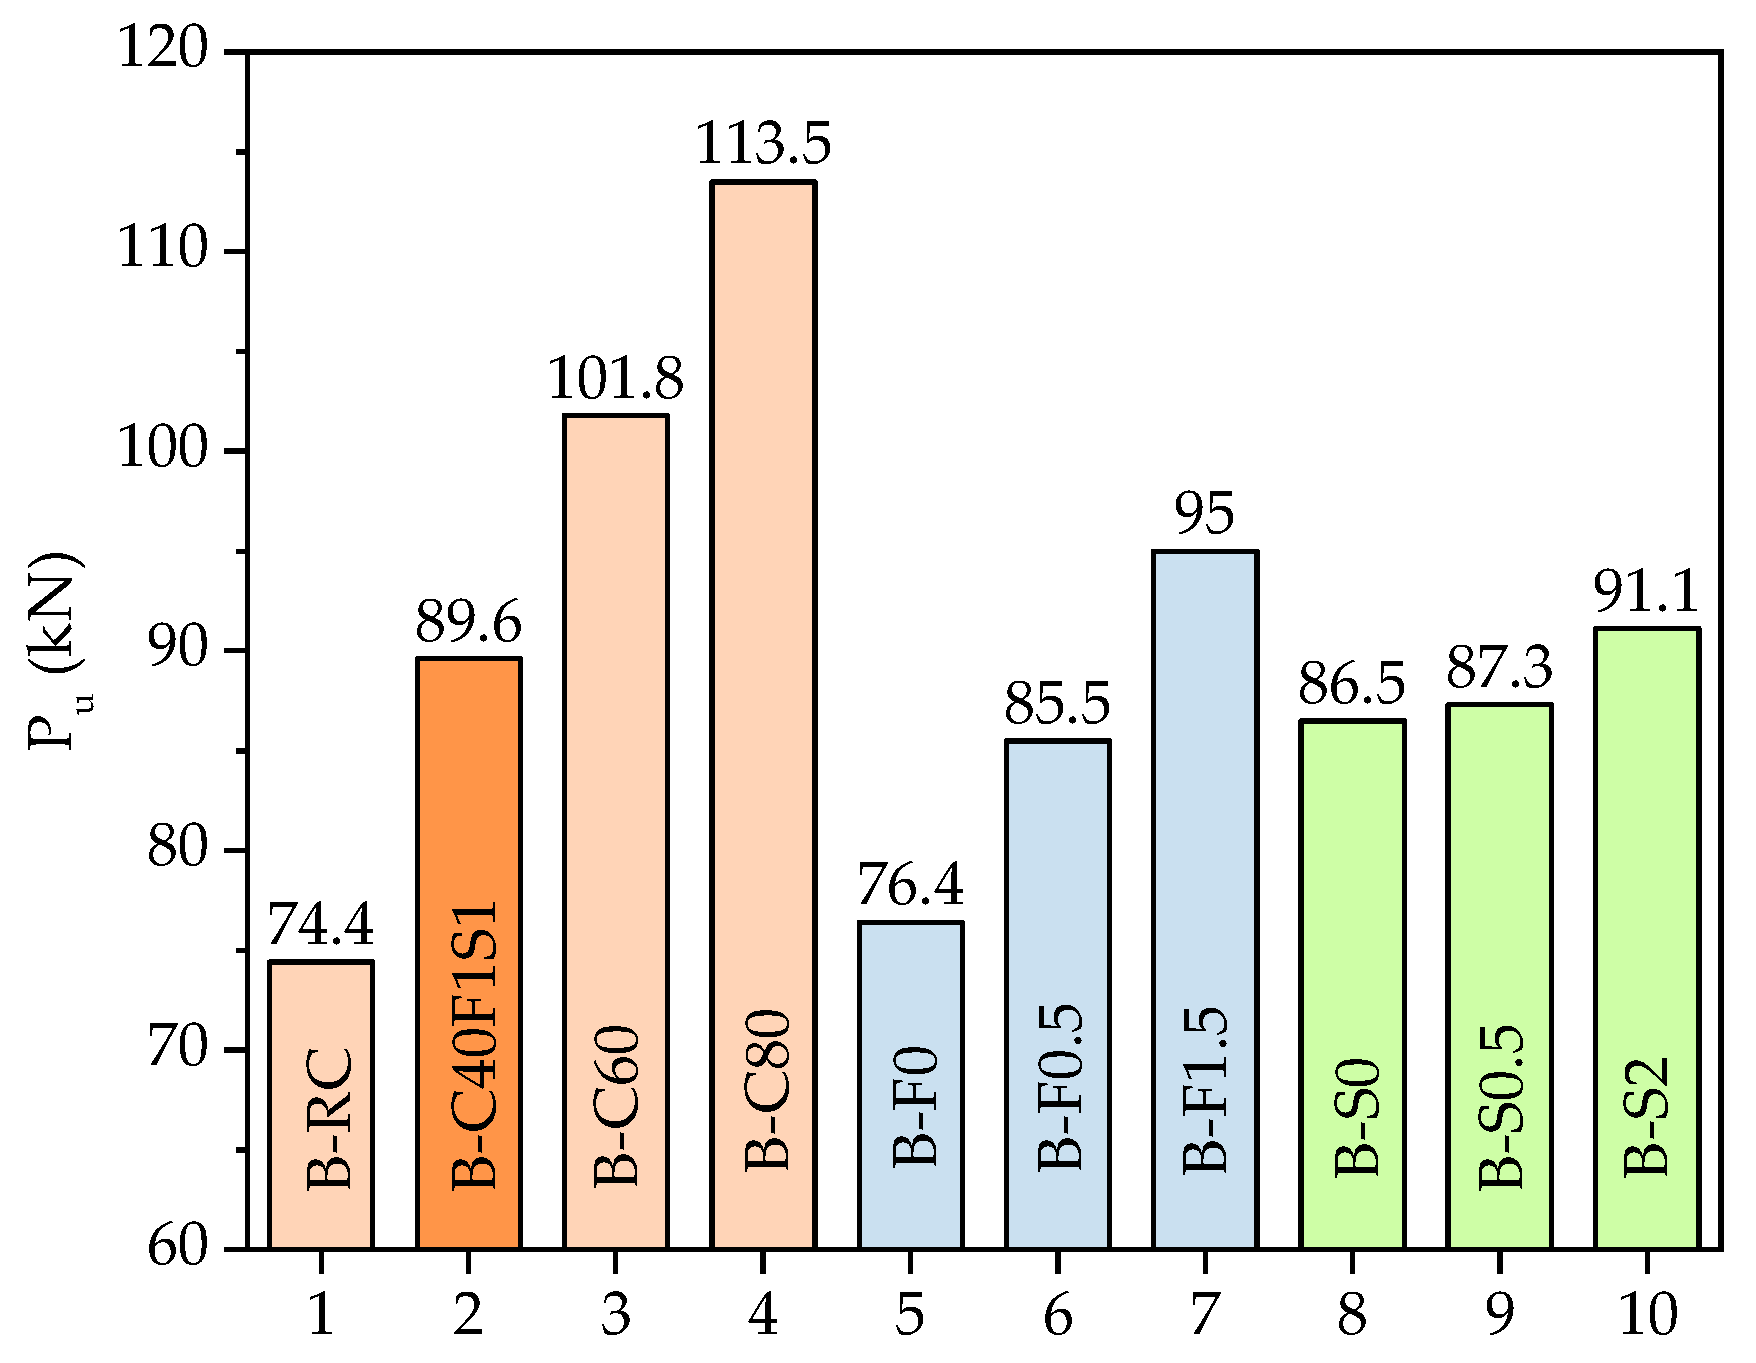
Figure 5 gives the comparisons of the ultimate load (Pu) for all the tested specimens. Compered to B–C40F1S1 specimen, the ultimate load of the B–C60 and B–C80 specimens were improved by 14% and 27% with the increase of concrete strength from C40 to C60 and C40 to C80, respectively. Besides, a lower increase rate of the ultimate load was observed with an increase in concrete strength, indicating that high-strength concrete used in SFNMRC beams can reduce the height of the compression zone in the section and result in an increase in the force arm from the steel bar to the resultant force point of concrete compression.
In comparison with the B–F0 specimen, the ultimate load (Pu) of B–F0.5, B–C40F1S1, and B–F1.5 specimens with 0.5%, 1.0%, and 1.5% steel fiber volume fractions were improved by 12%, 17%, and 24%, respectively. Greater improvement is generally obtained with a higher fiber volume fraction. Therefore, it can be concluded that increasing the steel fiber volume fraction of beams can be an effective means of improving the ultimate load.
Compared to the B–S0 specimen, the ultimate loads of B–S0.5, B–C40F1S1, and B–S2 specimens were improved by 1%, 3%, and 5%, respectively. The results indicate that NS content had limited influence on the ultimate load.

3.3. Failure Modes

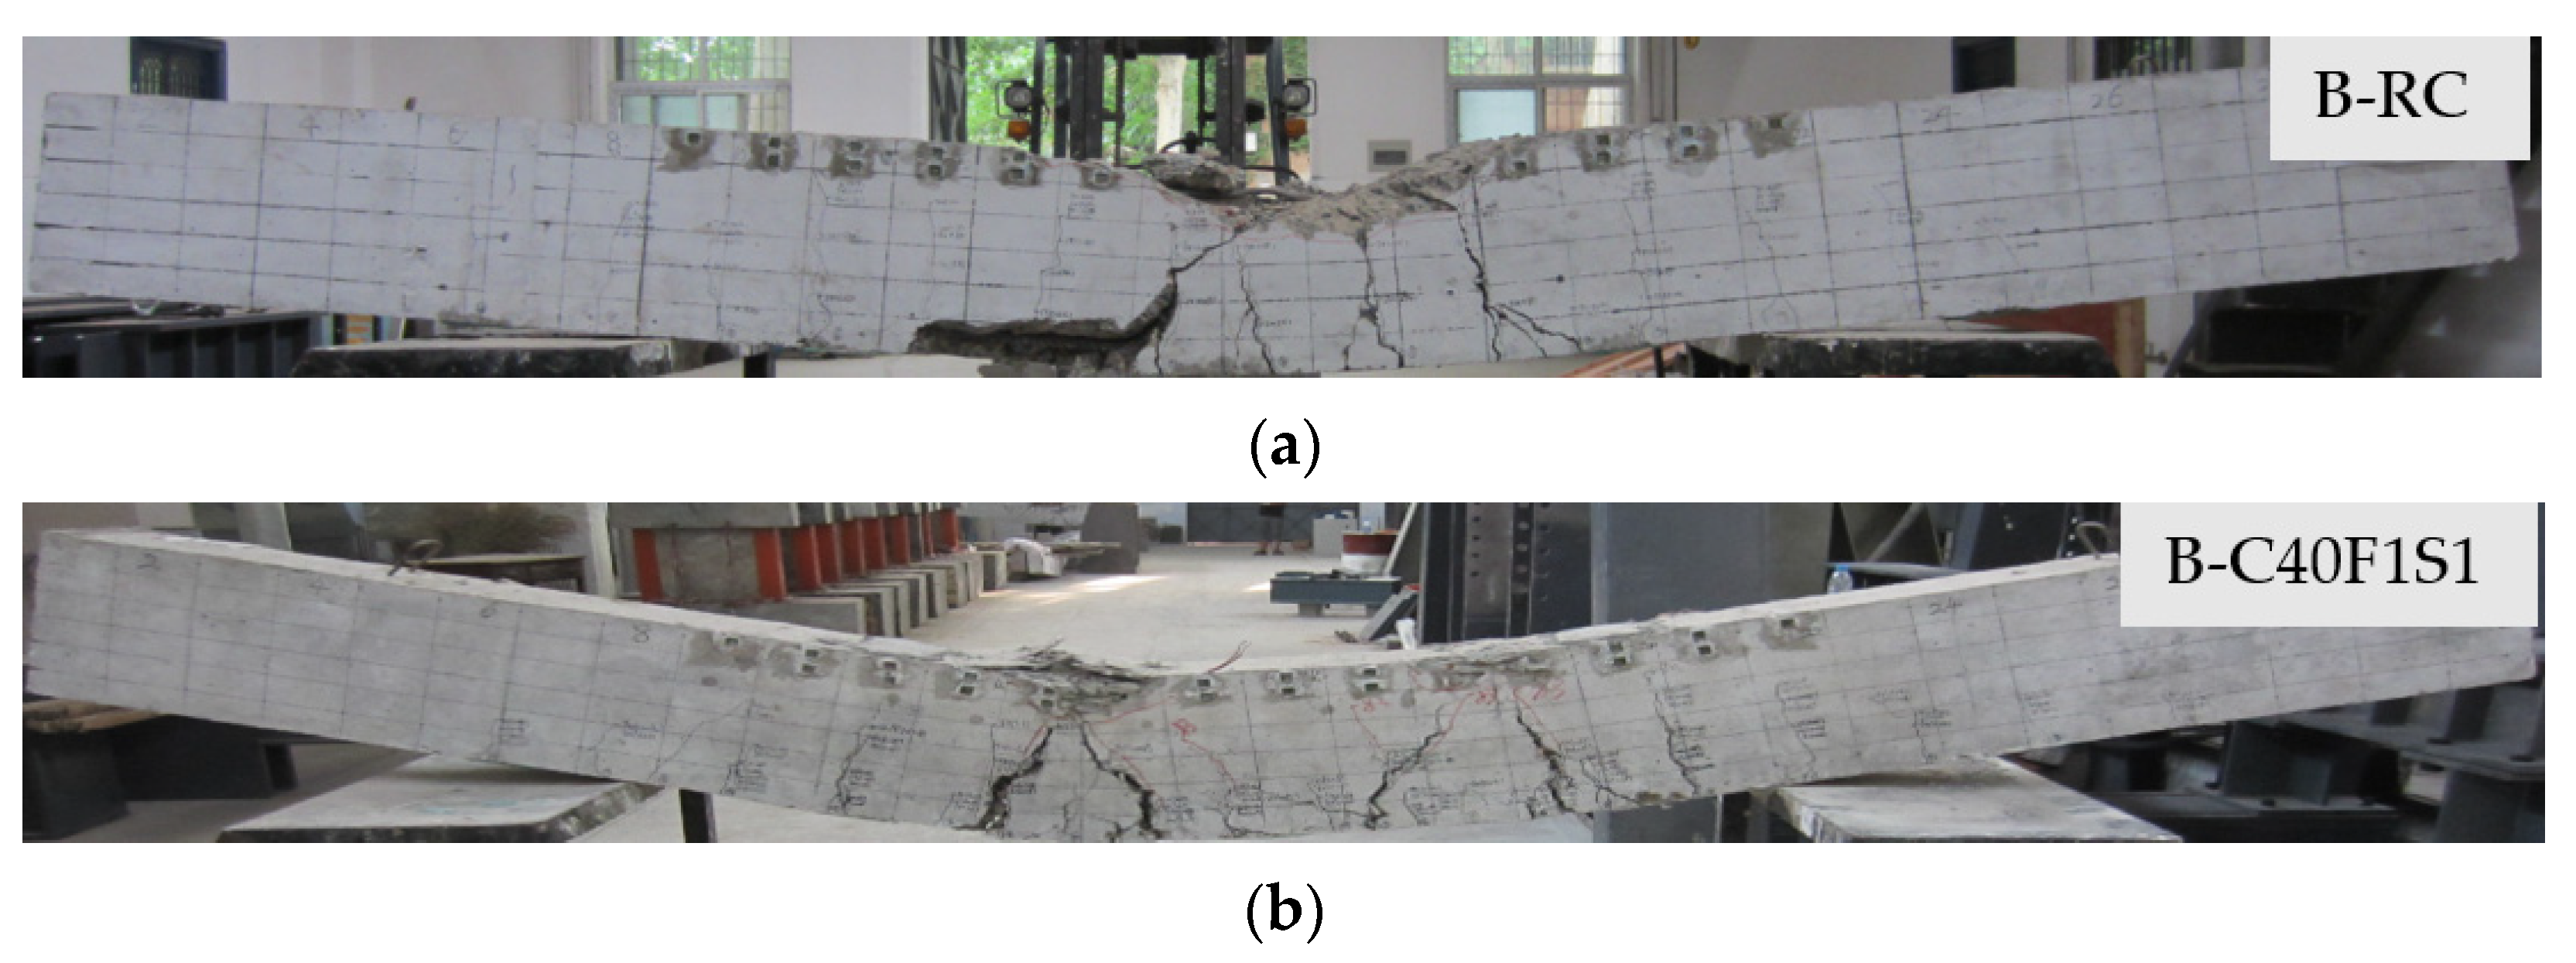
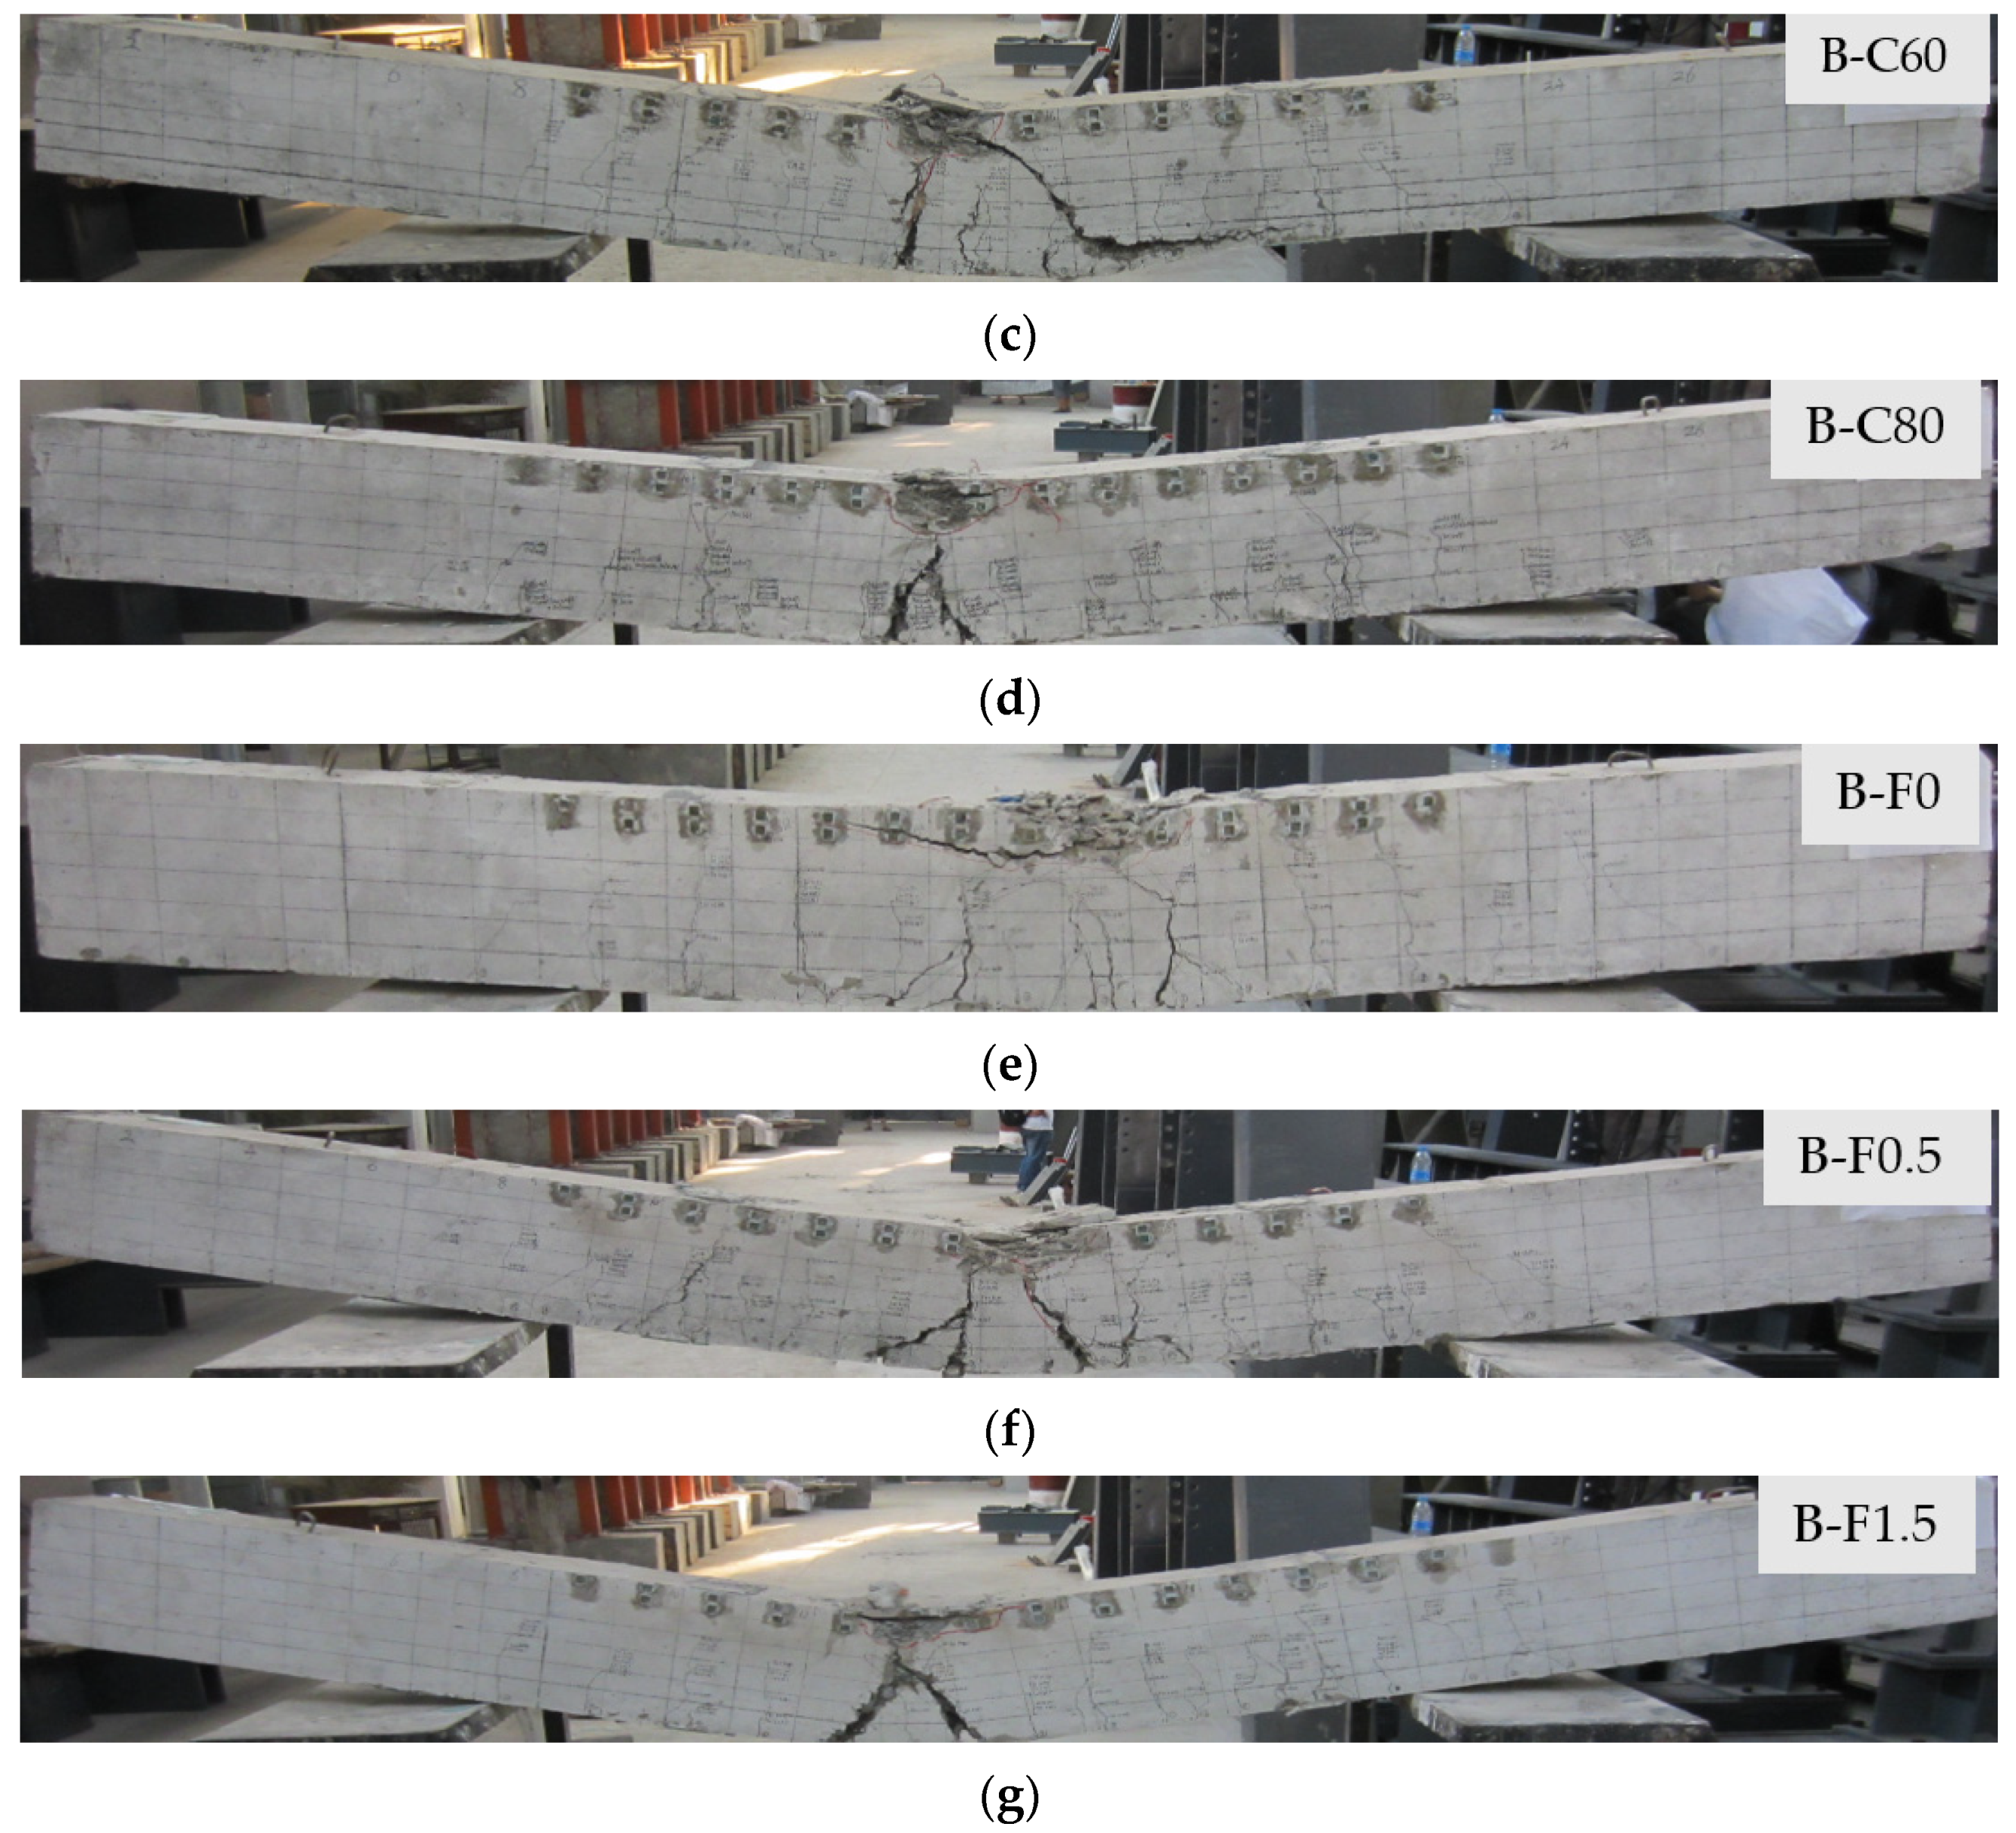
For better observation and record of deformation and cracking patterns on the surface of the specimens, white paint was sprayed with several layers on the outer surface of the specimens. Theoretically speaking, when the midspan deflection of specimens reached about 3% of the length of specimens which was considered as the failure criteria, the specimen failed. Figure 6 shows the typical failure modes and cracking patterns of the specimens. The failure modes of the specimens showed an outward folding failure mechanism and the specimens all failed in a very ductile manner. The final failure was characterized by the formation of major flexural cracks and concrete crushing in the compression zone within the constant moment region. Moreover, no obvious difference of failure modes among each tested specimen was observed, indicating that both the concrete strength and steel fiber volume fractions have no effect on the failure modes.
In addition, Figure 6b–d shows the effect of concrete strength on the failure mode of SFNMRC beams. In these beams, after the appearance of several initial cracks, with a small increase in the load, one of the cracks in the constant bending moment region quickly opened and developed to the extreme compression fibers of the concrete. This proved that increasing the concrete strength had a positive effect on the cracking performance of SFNMRC beams, which was the result of strain reduction in the tensile zone. In addition, compared to the B–C40F1S1 specimen, the maximum crack widths of beams B–C60 and B–C80 were decreased by 5% and 7%, respectively. This shows that increasing the concrete strength is an effective method to reduce the crack width of SFNMRC concrete specimens.
Figure 6a,e–g shows the effect of steel fiber volume fraction on the failure mode of SFNMRC beams. A sudden brittle failure mode was observed in the RC beam with several larger cracks before concrete crushing. The beam experienced a sudden load decrease immediately after the ultimate load (Figure 6a). In contrast, the SFNMRC beams exhibited considerable deformation capacity after reaching the maximum load and provided sufficient notice before failure. The flexural bearing capacity of the SFNMRC beam with 1.5% steel fiber volume fraction was improved by 28% compared to the conventional RC beam. After yielding the longitudinal bars, the steel fibers were progressively pulled out as the deflection increased rapidly. The number of cracks in the SFNMRC beams gradually increased with an increase in load. The presence of steel fiber in the concrete increased the number of cracks yet reduced the crack width and spacing in the ultimate state, as the fibers at crack surfaces inhibited the propagation and widening of cracks. The flexural performance of the SFNMRC beams was considerably improved due to the addition of steel fibers. The deformation capacity of the concrete in the compression zone increased, and the steel fibers delayed the final concrete crushing. In addition, the amount of NS increased the number of cracks and decreased the width and spacing of cracks as shown in Figure 6a,e.

3.4. Cracking Load

Figure 7 shows the comparison of the cracking load (Fcr) for all the tested specimens. The cracking load of B–C60 and B–C80 specimens were improved by 64% and 109% with an increase in concrete strength from C40 to C60 and C40 to C80, in comparison to the B–C40F1S1 specimen. This indicates the positive effect of concrete strength on improving the cracking load in the beams.
Compered to B–F0 specimen, the cracking load of B–F0.5, B–C40F1S1, and B–F1.5 specimens with 0.5%, 1.0%, and 1.5% steel fiber volume fractions were improved by 1%, 3%, and 11%, respectively. This is because the addition of steel fiber can resist and limit crack. Still, the steel fiber also increased the heterogeneity of concrete, especially for steel fiber reinforced concrete members with dense reinforcement. Steel fiber was not easy to disperse evenly in members, but it did not influence the function of steel fiber after crack development.
With the increase in NS content, the cracking loads of the specimen showed an increasing trend as a whole. In comparison with the B–S0.5 specimen, the cracking load of the B–C40F1S1 and B–S2 specimens with 1.0% and 2% NS contents were improved by 3% and 34%, respectively. This shows that with an increase in NS content, the cracking load of the specimens increased. The reason is that NS filled the voids in concrete and improved the microscopic structure of concrete. In addition, NS also improved the compactness of concrete, enhanced the bonding performance between steel fiber and concrete, and inhibited the development and extension of micro-cracks in concrete.

3.5. Load–Strain Relationship

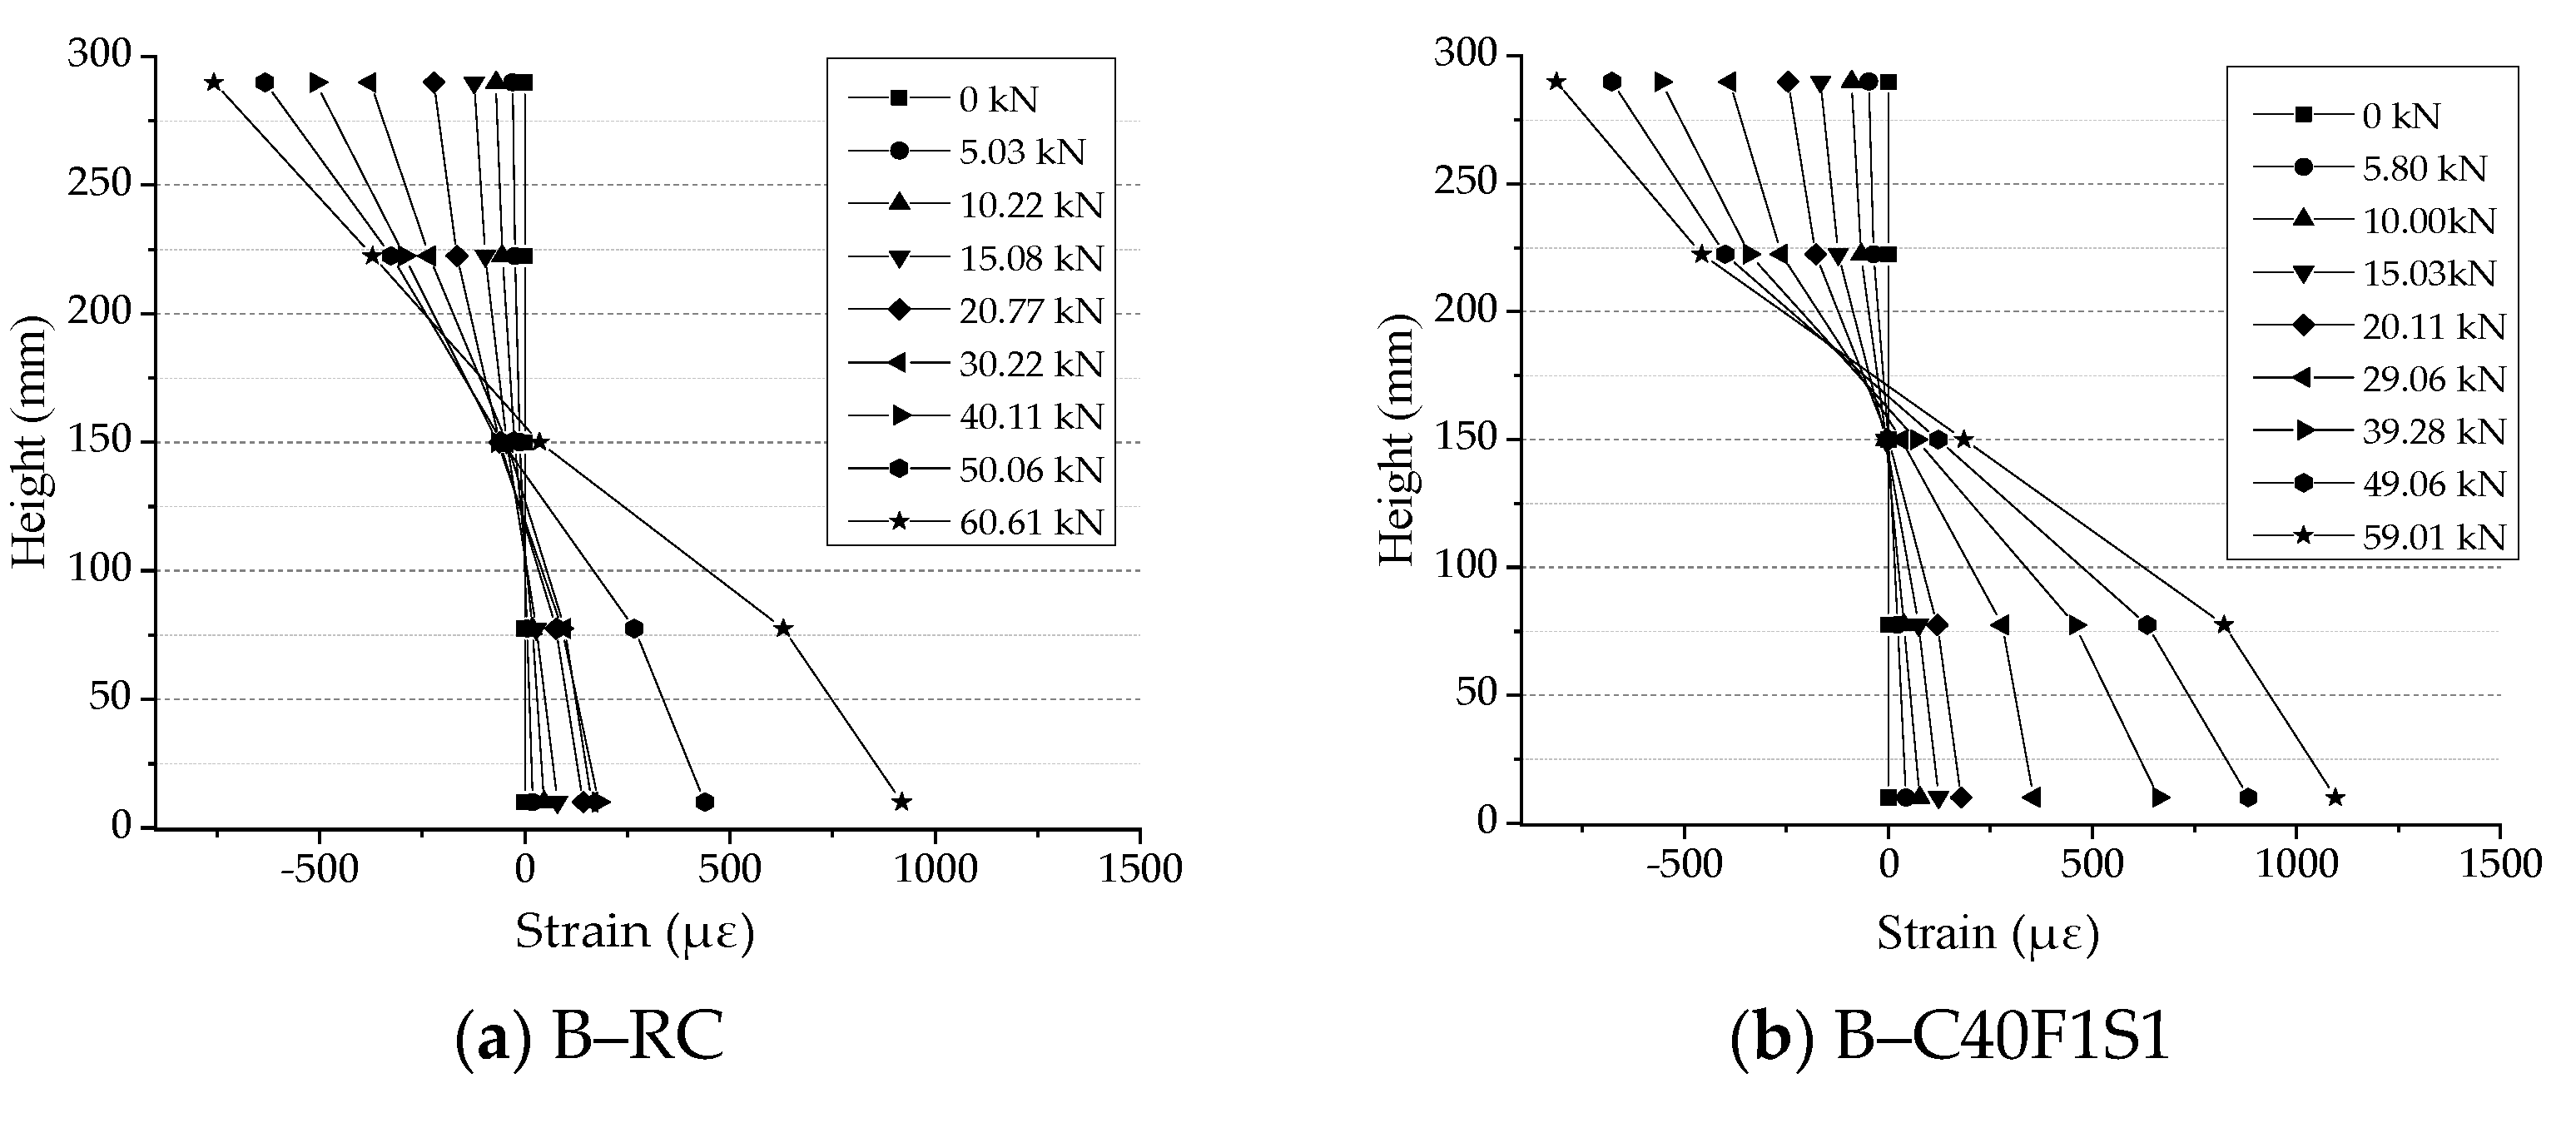
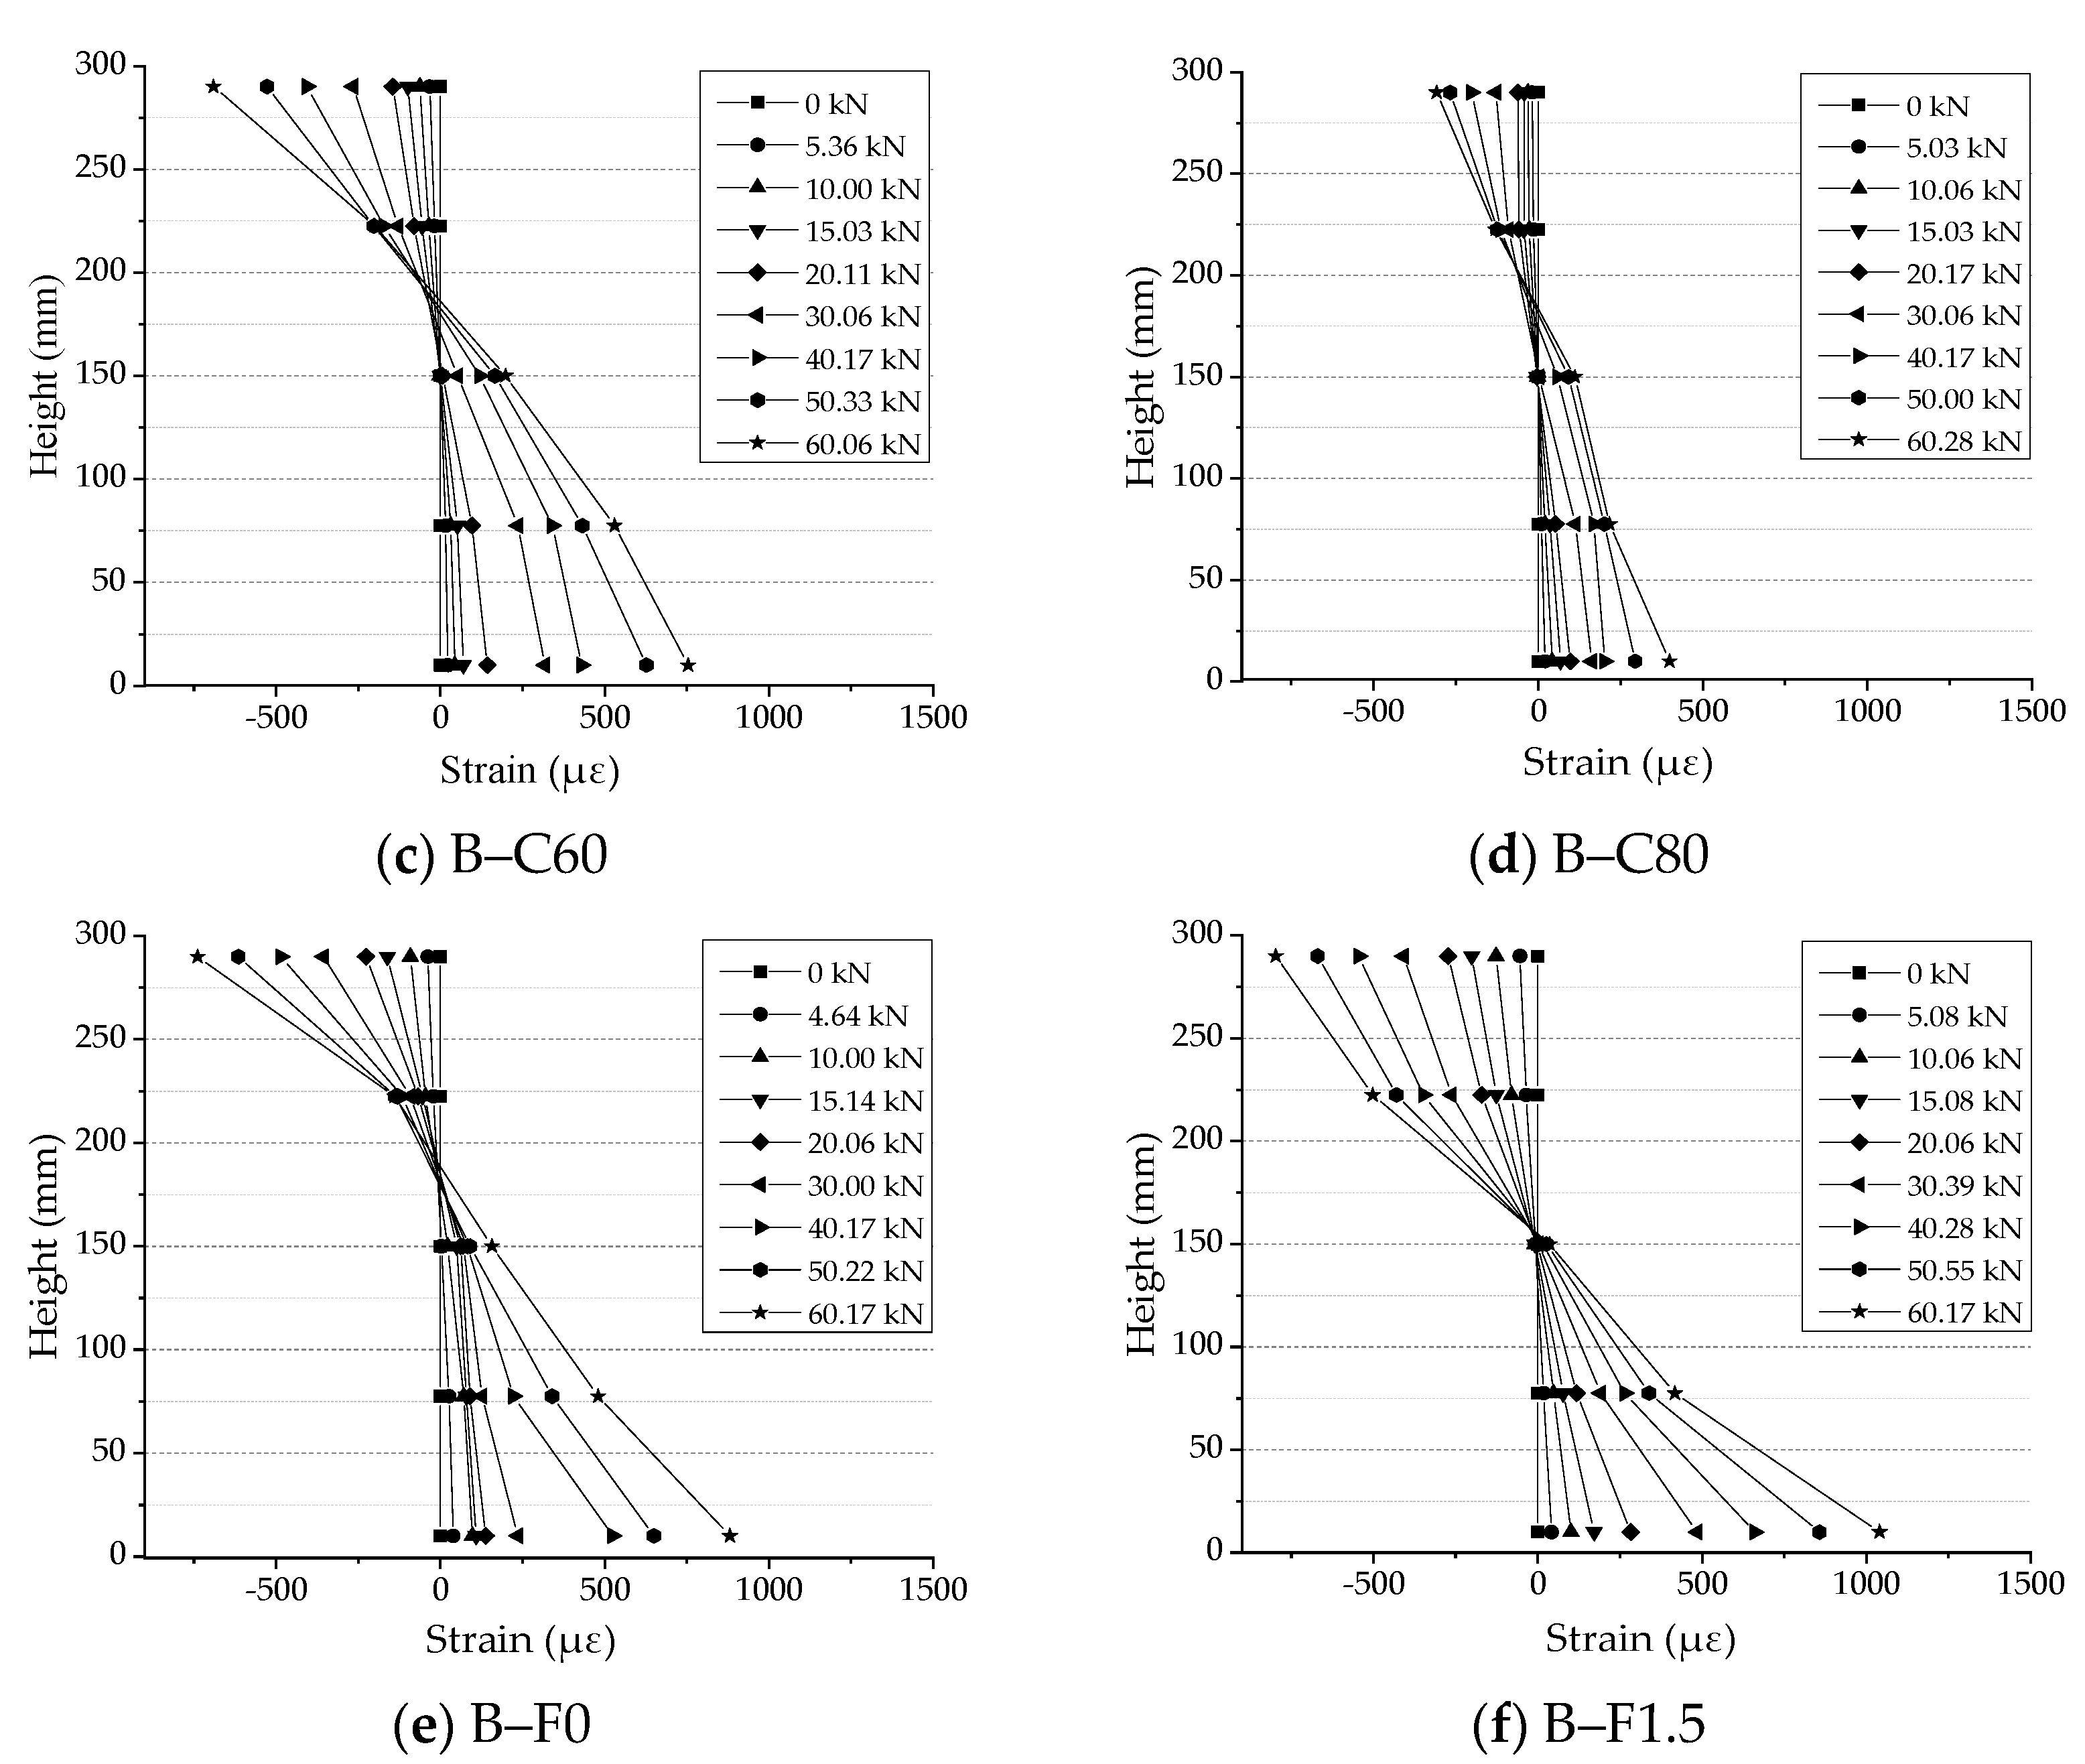
Figure 8 presents the measured strain distribution along with the height of the cross-section at various load levels, where the strain is defined as negative in compression zone and positive in tensile zone, respectively. At first, it can be seen in Figure 8 that the strain development in tension zone was greater than that in the compression zone. In addition, with the increase in load, the neutral axis gradually moved upwards from the centroidal axis of the cross-section. Under the same load grade, the greater the concrete strength and the smaller the tensile strain of concrete in the compression and tensile zone, the better the deformability of the beam is, as shown in Figure 8b–d. On the contrary, with an increase in strain, the SFNMRC beams were more stable than the reinforced nano-concrete beams without steel fiber, as shown in Figure 8a,b,e, which is mainly due to the steel fiber bearing partial tensile stress in the tensile zone of the beam, limiting the crack development and delaying the redistribution of internal force of the beam. Moreover, the larger the volume fraction of steel fiber, the more pronounced the effect is, as shown in Figure 8b,e,f. The addition of NS has no significant influence on the strain development of concrete in the middle section of the beam span, as shown in Figure 8a,e. Lastly, the intersecting point of the midspan strain curves represented the position of the neutral axis of the plane. The results were consistent with the assumption of planar cross-section behavior at the midspan of the specimens.

4. Calculation Method of Flexural Bearing Capacity

4.1. Fundamental Assumptions

According to the Chinese code for the design of concrete structures (GB 50010–2010) [37], it is necessary to provide some assumptions for predicting the flexural bearing capacity of the SFNMRC beams, and the assumptions can be made as follows:
(1)
It can be seen from the height vs. strain in Figure 8 that the section strain approximately changes linearly along with the beam height, which is consistent with the assumption of the planar cross-section behavior.
(2)
The compressive stress of SFNMRC beams in the compression zone is simplified as equivalent rectangular stress. The simplification principle is that the resultant force of compressive stress is constant, and the moment of the resultant force of compressive stress on the neutral axis remains the same. Therefore, the compressive stress distribution height adopts the conversion height. The equivalent compression zone height is the measured compression zone height multiplied by the coefficient β; compressive stress is the axial compressive strength of steel fiber reinforced concrete multiplying fc by a coefficient α.
(3)
Because steel fiber bears a part of tensile stress in the tensile zone of the beam, the role of steel fiber should be considered when calculating the bearing capacity. Therefore, the tensile stress distribution of steel fiber reinforced nano-concrete in the tensile zone is simplified as an equivalent rectangular stress diagram. The simplification principle is that the resultant force of tensile stress remains unchanged, and the moment of the resultant force of tensile stress on the neutral axis is constant.
(4)
The bond between the steel bar and SFNMRC is good, and there is no bond failure. When the beam is damaged, the tensile reinforcement has reached the yield strength.

4.2. Materials Constitutive Model

  • Concrete
According to the test, the addition of NS did not change the compressive stress–strain relationship of SFNMRC. To simplify calculations, the compressive stress–strain relationship of SFNMRC is defined as the segmented model [38] of steel fiber reinforced concrete. Consequently, the compressive stress–strain relationship is evaluated by Equation (1):
σ c = { f c ( α a ε c ε 0 + ( 3 2 α a ) ( ε c ε 0 ) 2 + ( α a 2 ) ( ε c ε 0 ) 3 ) ε c ε 0 f c ε c ε 0 α d ( ε c ε 0 1 ) 2 + ε c ε 0 ε c ε 0
where σc and εc are the compressive stress and stress of concrete, respectively; fc is the axial compressive strength of concrete (Mpa); fcu is the characteristic value of cube compressive strength concrete (Mpa). ε0 is the compressive strain corresponding to the stress of fc, and since steel fiber and nanomaterials have little influence on the compressive properties of concrete, the compressive strain of SFNMRC can be considered as ordinary concrete and estimated by Equation (2) [37]; αa and αd are the parameters, which are expressed by Equations (3) and (4).
ε 0 = 0.02 + 0.5 ( f cu 50 ) × 10 5 0.02
α a = E c ( 1.3 + 0.014 f c + 0.96 ρ f l f / d f ) / f c × 10 3
α d = ( 1.4 + 0.012 f c 1.45 ) [ 1 0.8 ( ρ f l f / d f ) 0 . 298 ]
where Ec is the elastic module of concrete; lf, df, and Vf are the length, diameter, and volume ratio of steel fiber, respectively.
  • Steel bar
According to the tensile test results of steel bars, the stress–strain relationship of longitudinal tensile steel bars is calculated as follows:
σ s = E s ε s
where σs is the tensile stress of steel bars; εs is the tensile strain of steel bars.
For optimum reinforcement beam failure, the tensile stress σs of longitudinal tensile reinforcement reaches the yield strength fy:
σ s = f y

4.3. Calculation of Flexural Bearing Capacity

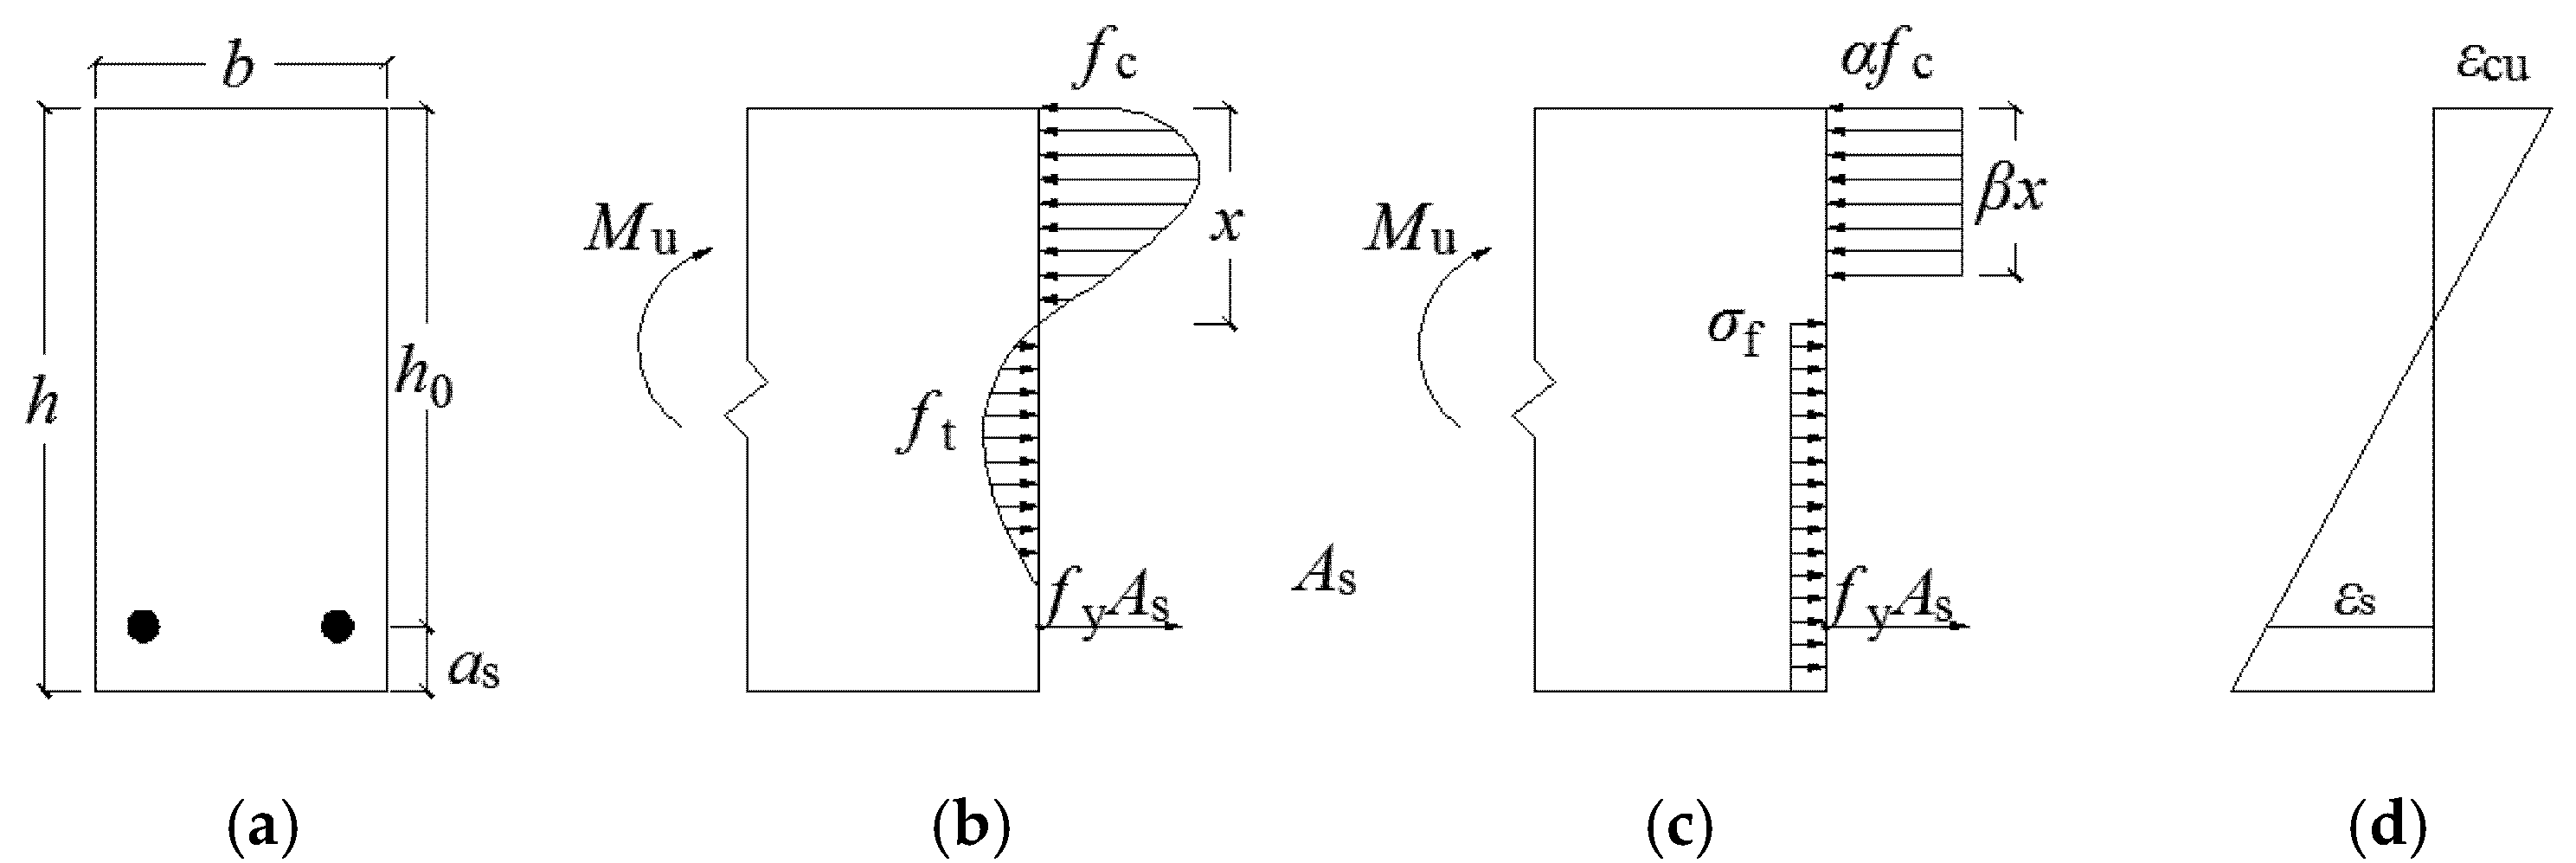
According to the above assumptions, it can be concluded that under the bearing capacity limit state of the beam section, the concrete at the top edge of the compression zone first reaches the limit compressive strain. Then, the longitudinal tensile reinforcement reaches the yield strength but has not yet reached the tensile strength. Figure 9 displaces the stress and strain distributions of SFNMRC. Assuming that the height of equivalent rectangular compressive stress distribution of the compression zone is x , according to the plane section assumption, the compressive strain at any place in the compression zone is εc:
ε c = ε cu x y
where εcu is the ultimate compressive strain of SFNMRC, ε cu = 0.0033 ( f cu 50 ) × 10 5 ,   ε cu 0.0033 .
As shown in Figure 9b, in terms of the balance forced, the resultant force C in the compressive region is estimated by Equation (8):
C = σ s A s + T f
where As is the sum of sectional area of tensile steel bars; Tf is the resultant force of SFNMRC in tension zone.
The micro-pressure strain of a certain unit c in the compression zone can be obtained by differentiating the two sides of Formula (9):
d ε c = ε cu x d y
The resultant force C and the bending moment of the resultant force C on the neutral axis can be expressed by:
C = b 0 x σ c ( ε c ) d y = b x ε cu 0 ε cu σ c ( ε c ) d ε c
y c C = b 0 x σ c ( ε c ) y d y = b ( x ε cu ) 2 0 ε cu σ c ( ε c ) ε c d ε c
where b is the width of beam cross section; yc is the distance from the resultant action point in the compression zone to the neutral axis. Consequently, combining Equations (10) and (11), the distance yc can be expressed by:
y c = x ε cu 0 ε cu σ c ( ε c ) ε c d ε c 0 ε cu σ c ( ε c ) d ε c
Because the actual stress distribution of the cross-section and the equivalent rectangular stress distribution of the cross-section have the same position of the resultant force acting point, the distance between the resultant force acting point of the concrete in the compression zone and the reinforcement in the equivalent effect diagram remains same. The equilibrium equation can be obtained from Figure 9b,c:
h 0 ( x y c ) = h 0 β x 2
where h0 is the effective height of section. Substituting Equation (12) into Equation (13), the equivalent rectangular stress distribution compression zone height reduction factor β can be expressed by:
β = 2 ( 1 0 ε cu σ c ( ε c ) ε c d ε c ε cu 0 ε cu σ c ( ε c ) d ε c )
If k = 0 ε cu σ c ( ε c ) ε c d ε c ε cu 0 ε cu σ c ( ε c ) d ε c , Equation (14) can be simplified as:
β = 2 ( 1 k )
As the actual stress distribution of the cross section is equal to the area of the equivalent rectangular stress distribution of the cross section, which can be obtained according to Figure 9b,c:
x ε cu 0 ε cu σ c ( ε c ) d ε c = α f c β x
Substituting Equation (15) into Equation (16), the reduction coefficient of concrete compressive strength in the compression zone with equivalent rectangular stress distribution α can be expressed by:
α = 0 ε cu σ c ( ε c ) d ε c 2 ( 1 k ) ε cu f c
The cross-sectional equilibrium conditions shown in Figure 9c are as follows:
α f c β x b = A s f y + σ f ( h x ) b
where h is the section height of the beam; σf is the equivalent tensile stress of SFNMRC in the tensile zone. From Formula (18), it can be obtained that the height x of the beam compression zone is:
x = A s f y + σ f b h α f c β b + σ f b
The distance between the resultant force points of the compression zone and tension zone and the resultant force points of reinforcement can be obtained as follows:
M u = α f c β x b ( h 0 β 2 x ) σ f ( h x ) b ( h x 2 a s )
where a s is the distance from the resultant force point of reinforcement to the edge of tension zone.
The equivalent tensile stress σf of SFNMRC can be obtained by substituting the test results in this paper into Equation (20). It can be seen from the test results that the equivalent tensile stress σf of SFNMRC is related to the tensile strength ft of the concrete matrix and the characteristic parameters of steel fiber λf. The change in nanomaterial content has relatively little influence on the strength of steel fiber concrete, which should not be considered separately here. According to the regression analysis of the test results in this paper, the equivalent tensile stress σf of steel fiber nano-concrete can be calculated by the following formula:
σ f = 0.525 f t λ f
where λf is the characteristic parameter of steel fiber, λf = ρf (lf/df). It can be approximately converted according to the method provided in reference [39]:
f t = 0.9 f ts , 0
where fts,0 is the splitting tensile strength of matrix cube.

4.4. Formula Validation

The flexural bearing capacity of SFNMRC and steel fiber reinforced concrete beams in this paper and in references [40,41] are collected to verify the accuracy of the calculation method proposed in this paper. Table 2 summarizes the comparisons of flexural bearing capacity between experimental and corresponding predicted values, where ratios are values of experimental results divided by the corresponding predicted results. From Table 2, it can be seen that the average ratio of M u / M u exp is 1.00 with a COV (coefficient of variation) of 0.09. Therefore, the comparisons demonstrate that the formula proposed in this paper are rational for predicting the flexural bearing capacity of SFNMRC beams and steel fiber reinforced concrete beams.

5. Conclusions

This paper presents a combined experimental and theoretical study on the flexural behavior of SFNMRC beams by conducting 10 tests in terms of the complete curve analysis, failure modes, flexural capacity, and so on. The parameters considered in this paper included concrete strength, steel fiber volume fraction, and the amount of NS. Based on the experimental and analytical results reported in this study, the following conclusions can be drawn:
  • Flexural specimens are considered to experience three stages until failure: loading stage, cracking stage, and yield stage of steel bars. Bending cracks and concrete crushing are formed in the compression zone for all specimen beams.
  • Increasing concrete strength can reduce the width of cracks and therefore help to enhance the flexural performance of beams. Besides, adding steel fiber can effectively resist and prevent cracks in the core concrete from propagating quickly. The higher the fiber volume fraction is, the greater the improvement is. Moreover, increasing the amount of NS can reduce the crack spacing and increase the number of cracks.
  • Based on the equilibrium condition between axial force and bending moment, the calculation method for predicting the flexural bearing capacity of SFNMRC beams is derived. The proposed formula can reasonably predict the flexural capacity of SFNMRC and steel fiber reinforced concrete beams at the same time. In addition, the proposed approach is concise and accurate to use in engineering practices. Therefore, this formula is recommended to be used for calculating the bearing capacity of SFNMRC beams.

Author Contributions

K.S.: conceptualization and design, data curation, methodology, investigation, and resources. M.Z.: data curation, writing—original draft preparation, and formal analysis. T.Z.: conceptualization, formal analysis, and writing—review and editing. R.X.: formal analysis, visualization, and methodology. P.L.: visualization and project administration. G.C.: investigation and visualization. All authors have read and agreed to the published version of the manuscript.

Funding

This research was funded by the National Natural Science Foundation of China (51708514), Key Scientific Research Projects of Colleges and Universities of Henan Provincial Department of Education (21A560015), National Natural Science Foundation of China (51809085), and Foundation of Henan Educational Committee (202102310254).

Institutional Review Board Statement

Not applicable.

Informed Consent Statement

Not applicable.

Data Availability Statement

Data are available on request from the authors.

Acknowledgments

The authors acknowledge the financial support from the National Natural Science Foundation of China (51708514), Key Scientific Research Projects of Colleges and Universities of Henan Provincial Department of Education (21A560015), National Natural Science Foundation of China (51809085), and Foundation of Henan Educational Committee (202102310254).

Conflicts of Interest

The authors declare that they have no conflict of interest.

References

  1. Rizzuti, L.; Bencardino, F. Effects of fiber volume fraction on the compressive and flexural experimental behavior of SFRC. Contemp. Eng. Sci. 2014, 7, 379–390. [Google Scholar] [CrossRef]
  2. Long, N.M.; Rovňák, M. New formula for the estimation of shear resistance of fibre reinforced beams. Can. J. Civil. Eng. 2011, 38, 23–35. [Google Scholar]
  3. Nguyen-Minn, L.; Rovnak, M.; Tran-Quoc, T. Punching Shear Capacity of Interior SFRC Slab–Column Connections. J. Struct. Eng. 2012, 138, 613–624. [Google Scholar] [CrossRef]
  4. Long, N.M.; Rovňák, M.; Tran-Ngoc, T.; Le-Phuoc, T. Punching shear resistance of post–tensioned steel fiber reinforced concrete flat plates. Eng. Struct. 2012, 45, 324–337. [Google Scholar]
  5. Lee, J.Y.; Shin, H.O.; Yoo, D.Y.; Yoon, Y.S. Structural response of steel–fiber–reinforced concrete beams under various loading rates. Eng. Struct. 2018, 156, 271–283. [Google Scholar] [CrossRef]
  6. Yun, H.-D.; Lim, S.-H.; Choi, W.-C. Effects of Reinforcing Fiber Strength on Mechanical Properties of High-Strength Concrete. Fibers 2019, 7, 93. [Google Scholar] [CrossRef] [Green Version]
  7. Abbass, W.; Khan, M.I.; Mourad, S. Evaluation of mechanical properties of steel fiber reinforced concrete with different strengths of concrete. Constr. Build. Mater. 2018, 168, 556–569. [Google Scholar] [CrossRef]
  8. Zwa, B.; Cs, A.; Khk, B. Investigation of mechanical properties and shrinkage of ultra–high performance concrete: Influence of steel fiber content and shape. Compos. Part B Eng. 2019, 174, 107021. [Google Scholar]
  9. Yazc, E.; Nan, G.; Tabak, V. Effect of aspect ratio and volume fraction of steel fiber on the mechanical properties of SFRC. Constr. Build. Mater. 2007, 21, 1250–1253. [Google Scholar]
  10. Xie, X.P.; Yang, G.J.; Gao, D.Y. Compressive Strength of Steel Fiber Reinforced High–strength Concrete. J. Henan Univ. Sci. Technol. Nat. Sci. 2008, 5, 54–56, 69, 117. [Google Scholar]
  11. Lee, S.-C.; Oh, J.-H.; Cho, J.-Y. Compressive Behavior of Fiber-Reinforced Concrete with End-Hooked Steel Fibers. Materials 2015, 8, 1442–1458. [Google Scholar] [CrossRef] [Green Version]
  12. Khalaj, G.; Nazari, A. Modeling split tensile strength of high strength self compacting concrete incorporating randomly oriented steel fibers and SiO2 nanoparticles. Composites 2012, 43, 1887–1892. [Google Scholar] [CrossRef]
  13. Zhang, J.; Yan, C.W.; Jia, J.Q. Compressive Strength and Splitting Tensile Strength of Steel Fiber Reinforced Ultra High Strength Concrete (SFRC). Appl. Mech. Mater. 2010, 34–35, 1441–1444. [Google Scholar] [CrossRef]
  14. Chowdhury, M.A.; Islam, M.M.; Zahid, Z.I. Finite Element Modeling of Compressive and Splitting Tensile Behavior of Plain Concrete and Steel Fiber Reinforced Concrete Cylinder Specimens. Adv. Civil. Eng. 2016, 2016, 11. [Google Scholar] [CrossRef]
  15. Jang, S.J.; Yun, Y.J.; Yun, H.D. Influence of Fiber Volume Fraction and Aggregate Size on Flexural Behavior of High Strength Steel Fiber–Reinforced Concrete (SFRC). Appl. Mech. Mater. 2013, 372, 223–226. [Google Scholar] [CrossRef]
  16. Moon, D.Y.; Kang, T.S.; Chang, S.H.; Lee, G.P.; Bae, G.J. Flexural performance evaluation of SFRC with design strength of 60 MPa. J. Korean Tunn. Undergr. Space Assoc. 2013, 15, 175–186. [Google Scholar]
  17. Aldossari, K.M.; Elsaigh, W.A.; Shannag, M.J.M. Effect of Steel Fibers on Flexural Behavior of Normal and High Strength Concrete. Int. J. Civ. Archit. Struct. Constr. Eng. 2014, 8, 22–26. [Google Scholar]
  18. Wang, L.L.; Lin, X. Mechanical Properties and Micro mechanism of Concrete Modified by Carbon Nanofibers. Concr. Cem. Products. 2020, 1, 51–54. [Google Scholar]
  19. Rezania, M.; Panahandeh, M.; Razavi, M.J.; Berto, F. Experimental study of the simultaneous effect of nano–silica and nano–carbon black on permeability and mechanical properties of the concrete. Theor. Appl. Fract. Mec. 2019, 104, 102391. [Google Scholar] [CrossRef]
  20. Sanchez, F.; Sobolev, K. Nanotechnology in concrete—A review. Constr. Build. Mater. 2010, 24, 2060–2071. [Google Scholar] [CrossRef]
  21. Sobolev, K.; Shah, S.P. Nanotechnology of Concrete: Recent Developments and Future Perspectives; ACI Publication, SP-254; American Concrete Institute: Farmington Hills, MI, USA, 2008. [Google Scholar]
  22. Han, L.I.; Gao, D.Y.; Zhao, J. Research on Mechanical Properties and Chloride Ion Penetration Resistance of Fiber and Nanometer Materials Reinforced Concrete. J. North China Inst. Water Conserv. Hydroelectr. Power 2012, 33, 39–45. [Google Scholar]
  23. Zhang, M.H.; Islam, J.; Peethamparan, S. Use of nano–silica to increase early strength and reduce setting time of concretes with high volumes of slag. Cem. Concr. Comp. 2012, 34, 650–662. [Google Scholar] [CrossRef]
  24. Shaikh, F.; Supit, S.; Sarker, P.K. A study on the effect of nano silica on compressive strength of high volume fly ash mortars and concretes. Mater. Des. 2014, 60, 433–442. [Google Scholar] [CrossRef]
  25. Jo, B.W.; Kim, C.H.; Tae, G.H.; Park, J.B. Characteristics of cement mortar with nano–SiO2 particles. Constr. Build. Mater. 2007, 21, 1351–1355. [Google Scholar] [CrossRef]
  26. Ji, T. Preliminary study on the water permeability and microstructure of concrete incorporating nano–SiO2. Cem. Concr. Res. 2005, 35, 1943–1947. [Google Scholar] [CrossRef]
  27. Björnström, J.; Martinelli, A.; Matic, A.; Börjesson, L.; Panas, I. Accelerating effects of colloidal nano–silica for beneficial calcium–silicate–hydrate formation in cement. Chem. Phys. Lett. 2004, 392, 242–248. [Google Scholar] [CrossRef]
  28. Khed, V.C.; Mohammed, B.S.; Nuruddin, M.F. Effects of Nano–Silica modified Self–Compacted, High Volume Fly Ash Mortar on Slump Flow and Compressive Strength. Madr. J. Nano Tec. Sci. 2016, 1, 7–10. [Google Scholar] [CrossRef]
  29. Gaitero, J.J.; Campillo, I.; Guerrero, A. Reduction of the calcium leaching rate of cement paste by addition of silica nanoparticles. Cem. Concr. Res. 2008, 38, 1112–1118. [Google Scholar] [CrossRef] [Green Version]
  30. Kong, D.; Du, X.; Su, W.; Hua, Z.; Yang, Y.; Shah, S.P. Influence of nano–silica agglomeration on microstructure and properties of the hardened cement–based materials. Constr. Build. Mater. 2012, 37, 707–715. [Google Scholar] [CrossRef]
  31. Wang, L.M.; Song-Song, H.E. Influence of Nano Materials on Properties of Cement Concrete Roads. J. Dalian Jiaotong Univ. 2014, 35, 56–60. [Google Scholar]
  32. Shih, J.Y.; Chang, T.P.; Hsiao, T.C. Effect of nano-silica on characterization of Portland cement composite. Mater. Sci. Eng. A 2006, 424, 266–274. [Google Scholar] [CrossRef]
  33. Li, H.; Xiao, H.G.; Yuan, J.; Ou, J. Microstructure of cement mortar with nano-particles. Compos. Part B Eng. 2004, 35, 185–189. [Google Scholar] [CrossRef]
  34. Zhang, S. Testing Research on Doped Nano-Silica Steel Fiber Reinforced Concrete. Mater. Thesis Zhengzhou Univ. 2010, 2, 20–50. [Google Scholar]
  35. Tian, P.; Wang, L. Application Guide of National Standard GB 8076-2008 Concrete Admixtures; China Standards Press: Beijing, China, 2009. [Google Scholar]
  36. Rong, J.; Lu, J. GB/T 50081–2002, Standard for Test Method of Mechanical Properties on Ordinary Concrete; China Architecture & Building Press: Beijing, China, 2002. [Google Scholar]
  37. Huang, S.; Wang, Y. GB 50011-2010, Code for Seismic Design of Buildings; China Architecture & Building Press: Beijing, China, 2010. [Google Scholar]
  38. Gao, D. Stress–strain curves of steel fibre concrete under axial compression. J. Hydraul. Eng. 1991, 10, 43–48. [Google Scholar]
  39. Rong, H. Experimental study on the tensile performance of steel fiber reinforced concrete. China Civil. Eng. J. 2006, 39, 63–67. [Google Scholar]
  40. Guan, Q.; Jia, Y.; Zhang, M. Research on Flexural Behavior of Steel Fiber Reinforced High–strength Concrete Beams. New Build. Mater. 2007, 12, 15–18. [Google Scholar]
  41. Zhang, H. Experimental Study on the Flexural Performance of Steel Fiber High–Strength Ceramsite Concrete Beams; Huaqiao University: Quanzhou, China, 2015. [Google Scholar]
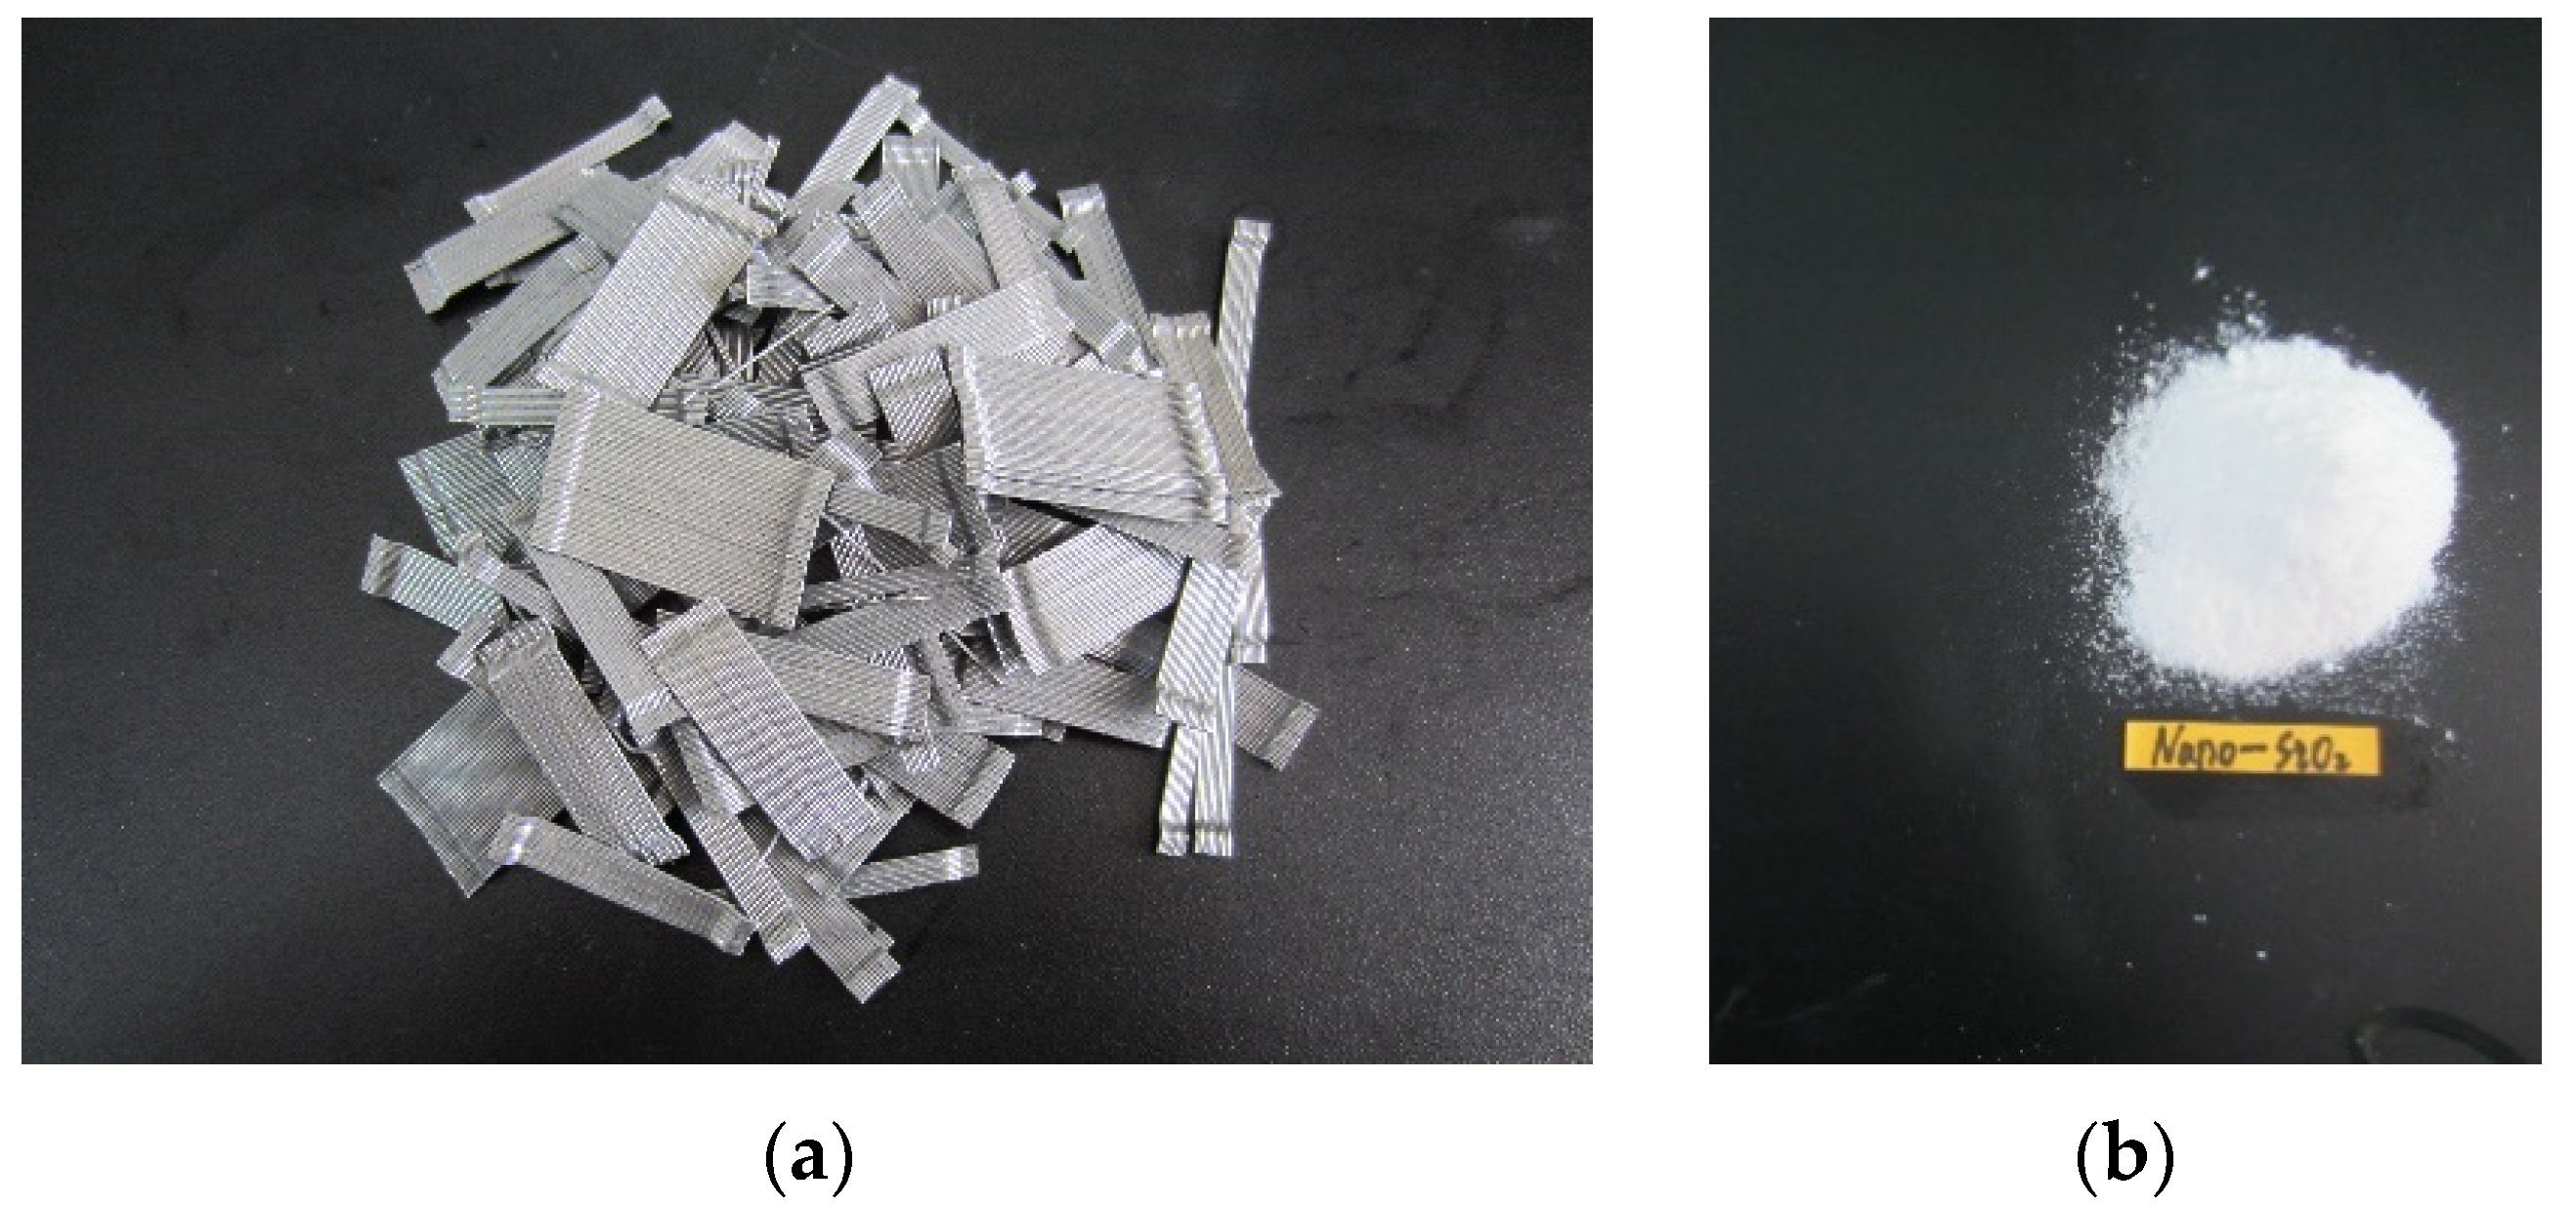
Figure 1. Materials: (a) steel fiber; (b) Nano–SiO2.
Crystals 11 00927 g001
Figure 2. Details of test layout: (a) schematic view of the SFNMRC beam, loading configuration, and position of LVDT; (b) section and reinforcement details of test beams (unit: mm).
Crystals 11 00927 g002
Figure 3. The test apparatus and loading set-up.
Crystals 11 00927 g003
Figure 4. Load–deflection relationship of specimens with different (a) concrete strength; (b) volume fraction of steel fiber; (c) amount of NS.
Crystals 11 00927 g004
Figure 5. Ultimate load of all tested specimens.
Crystals 11 00927 g005
Figure 6. Bending failure process and failure modes: (a) B-RC; (b) B-C40F1S1; (c) B-C60; (d) B-C80; (e) B-F0; (f) B-F0.5; (g) B-F1.5.
Crystals 11 00927 g006aCrystals 11 00927 g006b
Figure 7. Cracking load of all the tested specimens.
Crystals 11 00927 g007
Figure 8. The strain of concrete along the height of the cross-section: (a) B–RC, (b) B–C40F1S1, (c) B–C60, (d) B–C80, (e) B–F0, (f) B–F1.5.
Crystals 11 00927 g008aCrystals 11 00927 g008b
Figure 9. Stress and strain distributions of the strengthened beams under bending failure: (a) cross section; (b) stress distribution; (c) equivalent rectangular compressive stress distribution; (d) strain distribution.
Crystals 11 00927 g009
Table 1. Detailed parameters of the test specimens.
Beam NumberB × D × L (mm3)Concrete Strength (Mpa)Volume Fraction of Steel Fiber (%)Amount of NS (%)Cubic Compressive Strength (Mpa)Modulus of Elasticity (Mpa)
B–RC150 × 300 × 3000C400039.8231,500
B–C40F1S1150 × 300 × 3000C401.01.043.0332,500
B–C60150 × 300 × 3000C601.01.065.8237,400
B–C80150 × 300 × 3000C801.01.075.2339,400
B–F0150 × 300 × 3000C4001.039.2232,500
B–F0.5150 × 300 × 3000C400.51.040.2931,900
B–F1.5150 × 300 × 3000C401.51.046.0632,000
B–S0150 × 300 × 3000C401.0041.3230,600
B–S0.5150 × 300 × 3000C401.00.542.0929,400
B–S2150 × 300 × 3000C401.02.043.9329,500
Table 2. Comparisons of tests and predicted flexural bearing capacity.
ReferenceSpecimen Labels M u exp / kN · m M u / kN · m M u exp / M u
This paperB–F0.538.4438.451.00
B–40F1S140.3040.441.00
B–F1.542.7642.391.01
[40]2–0.5–III–30080.1091.320.88
2–1.0–III–30082.8092.970.89
2–2.0–III–30094.5091.671.03
[41]LCB0.5–356.2060.420.93
LCB1.0–360.6053.701.13
LCB1.5–363.8055.041.16
Average 1.00
COV 0.09
Note: COVcoefficient of variation, the flexural bearing capacity; M u exp —experimental flexural bearing capacity; Mupredicted flexural bearing capacity.
Publisher’s Note: MDPI stays neutral with regard to jurisdictional claims in published maps and institutional affiliations.