Article

Systematic Comparison on Convective Heat Transfer Characteristics of Several Pin Fins for Turbine Cooling

State Key Laboratory for Strength and Vibration of Mechanical Structures, School of Aerospace, Xi’an Jiaotong University, No.28, West Xianning Road, Xi'an 710049, China
*
Authors to whom correspondence should be addressed.
Crystals 2021, 11(8), 977; https://doi.org/10.3390/cryst11080977
Submission received: 19 July 2021 / Revised: 12 August 2021 / Accepted: 13 August 2021 / Published: 17 August 2021

Abstract

:
This paper is focused on the heat transfer augment ability and friction factor of different cross-section pin fins. An experimental study is conducted in a wide rectangular channel. The steady-state thermochromic liquid crystals (TLC) method is applied to measure the tested surface temperature. Nine sets of pin fins are employed in the experiment. The nominal diameter of all pin fins is the same value. Nine sets of pin fins have three roundness shapes (Circle, Ellipse and Oblong), three streamline shapes (Dropform, NACA and Lancet) and three quadrangle shapes (Diamond, Diamond-s and Square), respectively. The arrangement parameters of all nine shapes are kept the same. As they have the same nominal diameter and arrangement, the channel blockage ratio is the same for each pin fin set. Reynolds numbers range from 10,000 to 60,000. The pressure losses of pin fin arrays are measured to obtain friction factor. Meanwhile, the overall thermal performances of all nine sets are also considered and compared. The results show heat transfer enhancement abilities of quadrangle shape pin fins are relatively higher than the roundness and streamline shapes. Diamond-s pin fins present the largest averaged Nusselt number and overall thermal performance on the endwall for all the nine pin fins under different Re. Concerning overall thermal performance, the traditional Circle pin fin is the second best. The pressure loss of streamline shape pin fins is the lowest in these three shape types. Moreover, the characteristic of local heat transfer distribution varies substantially for different pin shapes at low Re.

1. Introduction

Pin fin is a common and efficient cooling structure. It is widely employed in heat exchangers and the internal cooling of gas turbine blade. In a narrow cooling channel, pin fins have several advantages. They can not only enhance the convective heat transfer but also strengthen the channel structure. Although the pin fin is a simple cooling element, its cooling efficiency is quite high. The wake shedding from pin fin could increase the turbulence intensity, leading to a well-mixed flow. Wakes from upstream pin fins greatly contribute to heat transfer enhancement and affect the flow of downstream pin fins [1,2]. Thus, some researchers have also tried to combine the pin fin with other cooling structures [3,4,5], such as dimple, protrusion and deepened scales. As well as in a narrow cooling channel, pin fins could also be used on the internal wall of blade tip and target surface of jet impingement [6,7].
Many investigations have been done to study factors which can affect pin fin heat transfer performance. Huang et al. [8] studied the effect of pin fin arrangement method. The inline and staggered pin fin arrays are compared in their experiment. The results show the heat transfer of staggered pin fin arrays is about a quarter higher than that of inline arrays. Lawson et al. [9] and Lyall et al. [10] had investigated pin fins with different spanwise and streamwise spacing in a multiple-row arrays channel and single-row array channel, respectively. It was found that spanwise spacing played a more important role in pressure drop than that of streamwise spacing, and streamwise spacing had larger effect on heat transfer enhancement. Thus, the pin fin arrangement could significantly affect the heat transfer performance. Lau et al. [11] revealed that the height-to-diameter ratio of applied pin fins is normally within the range of from 0.5 to 4. Armstrong and Winstanley [12] indicated that the average heat transfer coefficient in short pins used in turbines is lower than that in long ones. Chyu et al. [13] studied the effect of the pin fin height-to-diameter ratio. Their results show that the averaged heat transfer augmentations of H/D = 3 and 4 are larger than that of H/D = 2, but H/D = 2 pin fin arrays have the greatest thermal performance. Therefore, although the height of pin fin will be determined by the channel aspect ratio, the height values should also be within a rational range.
The pin fin cross-sectional shape is a more important factor affecting heat transfer and friction factors in the pin fin channel. The circular pin fin is the most widely used pin fin in real applications. However, previous studies have indicated that other pin fin shapes also have some advantages compared with circular pin fins. Chang et al. [14] and Pandit et al. [15] used diamond pin fins in their heat transfer experiments. The heat transfer result shows that diamond pin fins perform better than circular pin fins at a low Re. When Re increases, the heat transfer of circular pin fins is close to that of diamond pin fins, or even slightly better. Kirsch et al. [16] applied an oblong pin fin to study its heat transfer enhancement and pressure loss. Compared with the circular pin fin, the averaged heat transfer of an oblong pin fin is about 30% lower than that of a circular pin fin, and their boundary layer separation conditions are different. Uzol and Camci [17] investigated two kinds of elliptical-shaped pin fins. The heat transfer augmentation and pressure drop were studied, and the results were compared with that of a circular pin fin. Their results show that even though the circular pin fin has a better heat transfer enhancement ability than the elliptical pin fin, its pressure drop is much higher, at almost two times of that of elliptical pin fin. The numerical studies of Sahiti et al. [18] compared the heat transfer performance of a circular pin fin with streamlined pin fins. Jia et al. [19] and Kirsch et al. [20] also studied the heat transfer and fluid flow characteristics of a cone-shaped pin fin and irregular circle pin fin, respectively, in a microchannel. It was found that, compared with smooth pin fin arrays, the rough pin fin arrays have a larger effect on pressure drop than on heat transfer enhancement.
The above experimental results prove that pin fin shapes greatly affect the heat transfer characteristic and friction of channels with pin fin arrays. As some researchers used the thermocouple measurement method, they could not present heat transfer coefficient distribution results. For some other results, the distribution resolution is not high enough to analyze the heat transfer details. A high space resolution could help to explore the flow structure around pin fins. Besides this, even for the same pin fin cross-section, conclusions are not consistent in different papers. For example, in some papers, circular pin fins have the best thermal performance, but in other papers they do not. In the present experimental study, all sets of pin fins have the same nominal diameter, relative spanwise pitch and streamwise pitch, with the same blockage area in the channel. The steady-state thermochromic liquid crystals (TLC) method is used to measure the temperature. High space resolution results are obtained. This paper systematically compares the heat transfer characteristics of pin fins with different shapes. Several different pin fin shapes are involved. The results could explain the mechanism whereby the pin fin’s shape affects its heat transfer distribution and heat transfer augmentation ability. Meanwhile, the advantages and disadvantages of different shapes are explored. The comparison results could help in turbine design. A reasonable alternative pin fin shape could achieve a better thermal performance and lower levels pressure loss on turbine cooling.

2. Experimental Setup
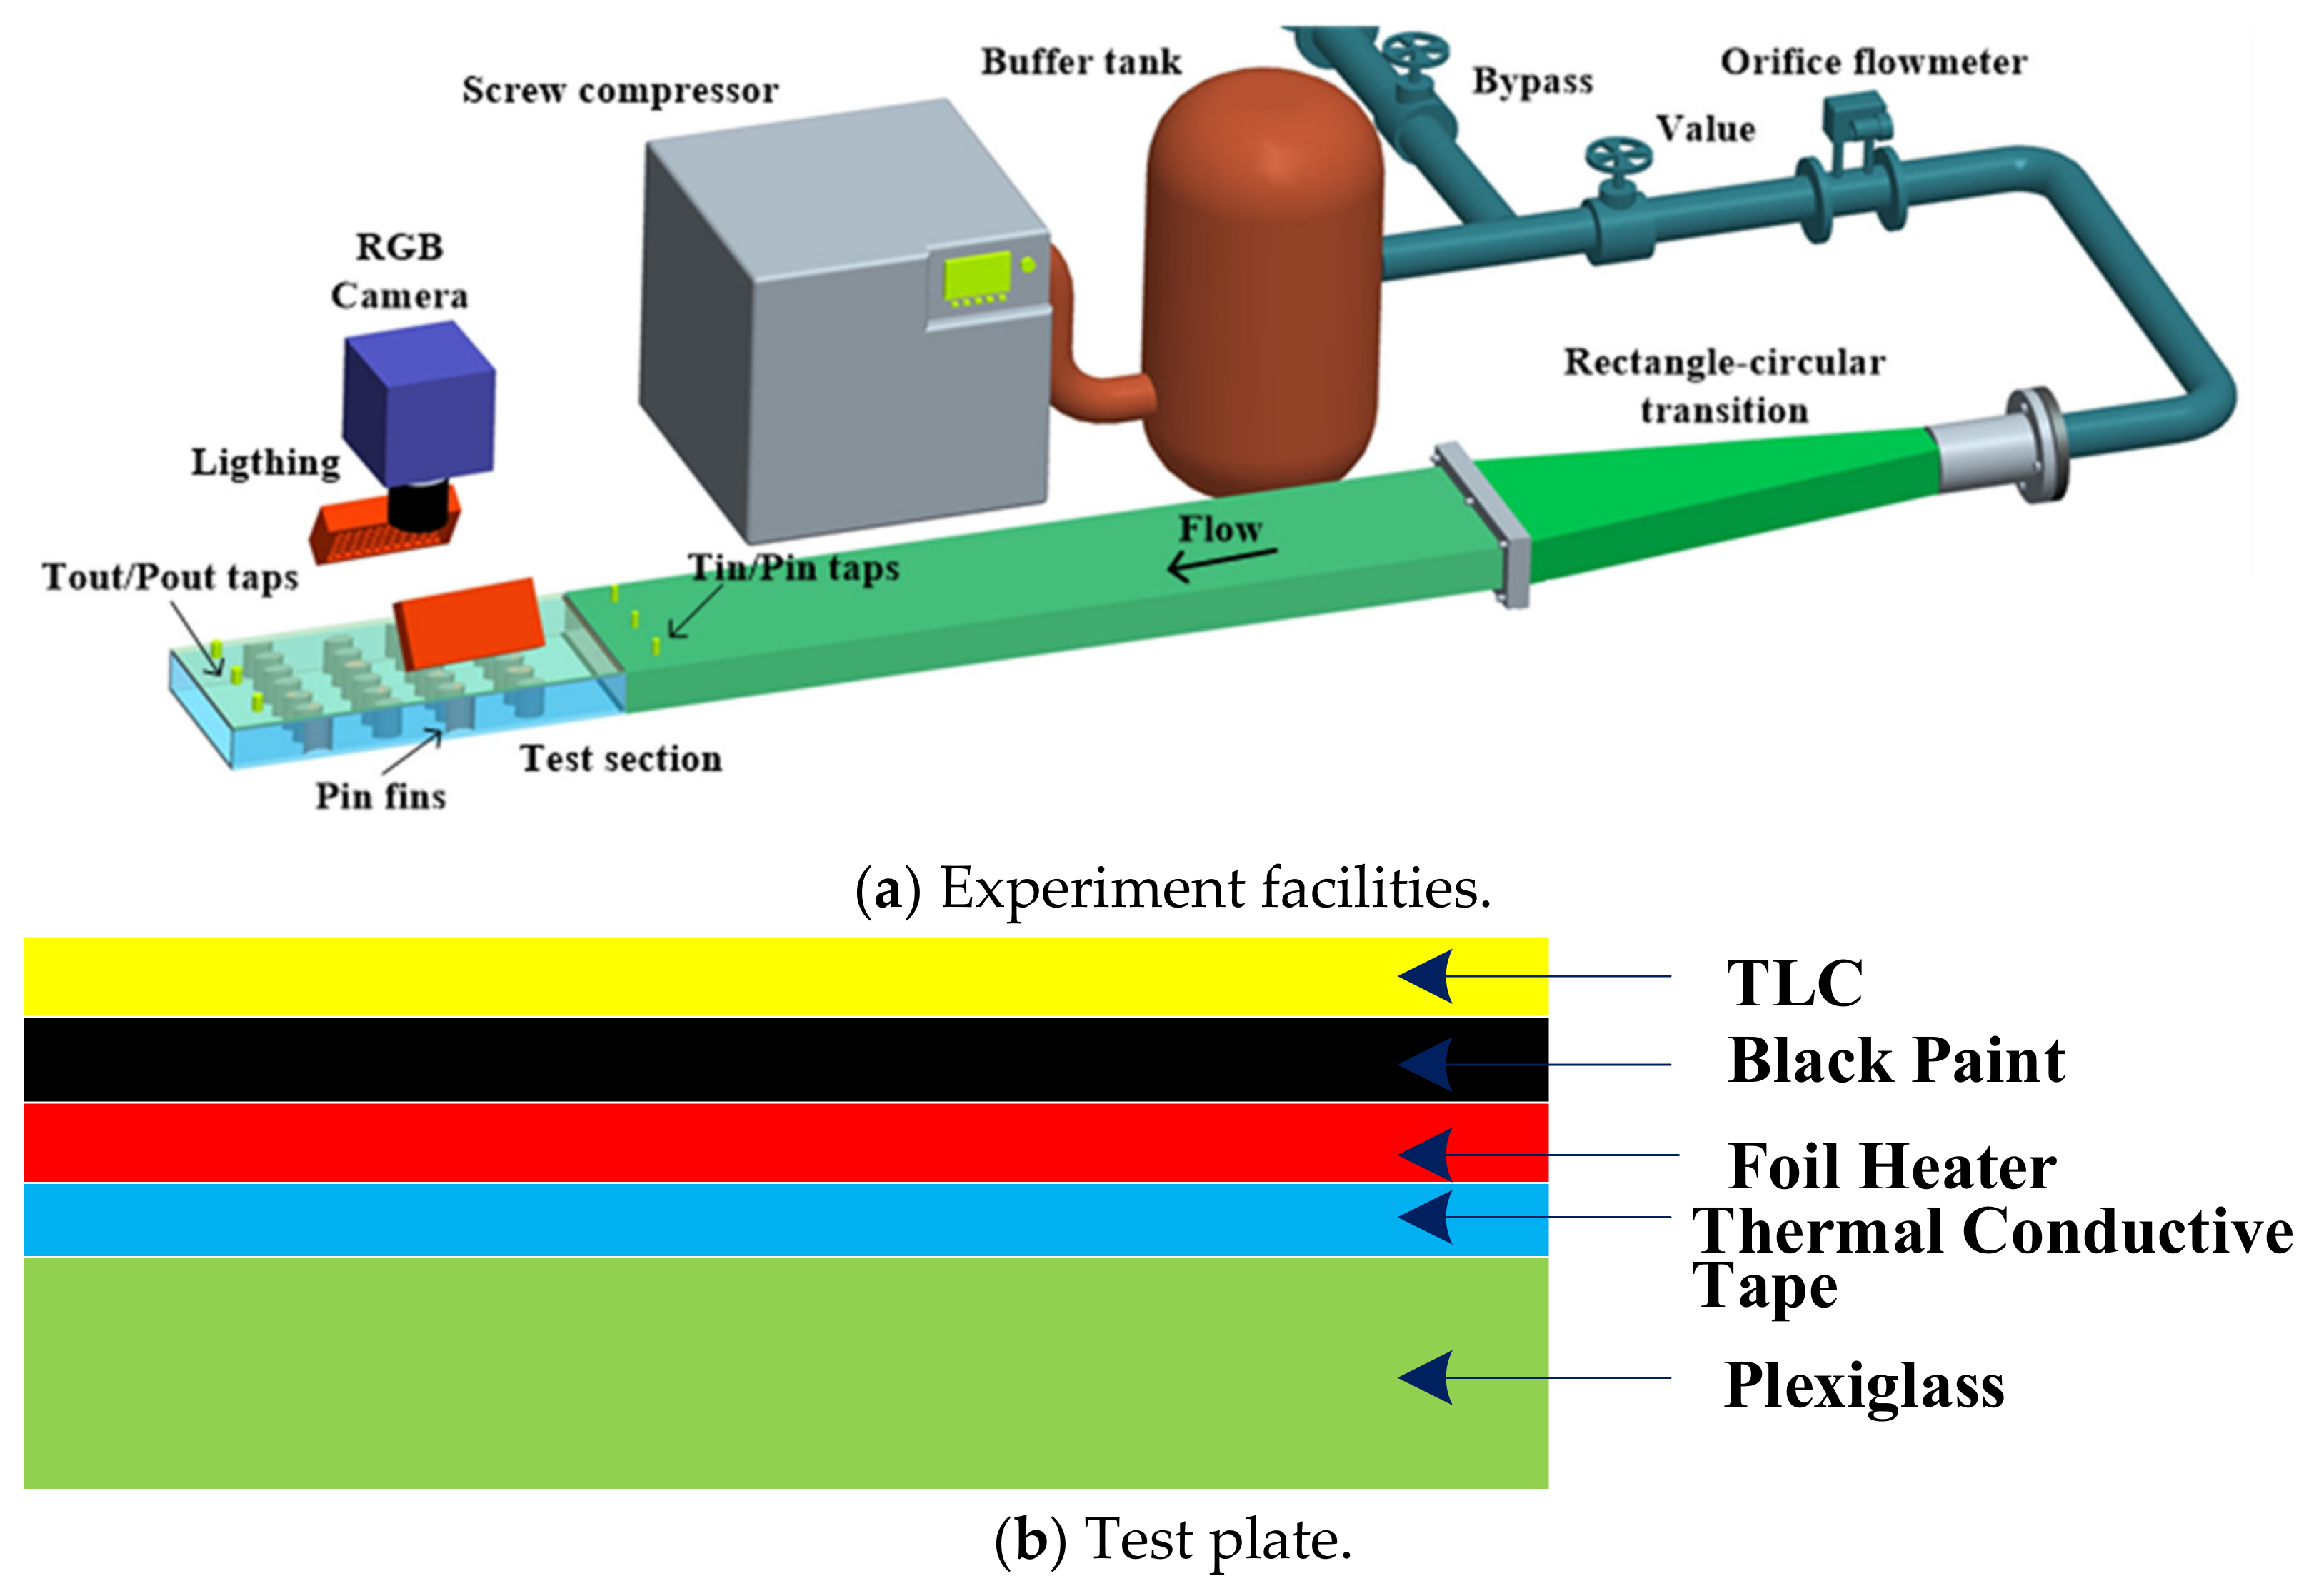
2.1. Facilities

Figure 1a displays a sketch of the experimental facility. A screw compressor was used to provide the mass flow, accompanied by a cooler/dryer. The maximum flow mass of the compressor was 0.1 kg/s. The orifice flowmeter is applied to measure the flow rate. The main flow was ducted to a circle-to-rectangle transition piece before entering the wide channel, which was used to avoid the boundary layer separation and reduce the unsteady vortex. The cross-section of the rectangular channel (AR = 4) is 100 mm wide and 25 mm high, with a length of 750 mm. The channel wall was made of Plexiglass with a thickness of 10 mm. Plexiglass plate is transparent, which is necessary for capturing images. It is also a thermal insulation material. There are unheated parts and heated parts of the channel. The entrance section’s length was 500 mm, which is 12.5 Dh (where Dh is 40 mm). Before heat transfer measurement, hot wire (model 54T42 from Dantec Dynamics (16-18 Tonsbakken, DK-2740 Skovlunde, Denmark)) was used to measure the flow turbulence and velocity in the channel. It was found that the velocity difference of center plane is less than 1.2% from the location of x = 10.5Dh to x = 12.5Dh, which means the flow is fully developed before entering the test section. The turbulence intensity was about 1.5%. The length of the heated test plate was 250 mm. A RGB camera (Sony XCDSX-90CR) was used to take the TLC images of the heated section. Two LED white light sources were applied to illuminate the test surface.

2.2. Experiment Method

Figure 1b depicts a sketch of the test plate. The foil heater was made of stainless steel. Its thickness was 0.02 mm. It is thin enough to avoid the effect of lateral heat conduction through the heater, and the temperature distribution of the foil was quite uniform. The foil heater and Plexiglass plate were bonded together by thermal conductive tape. The thickness of Plexiglass is 15 mm. Black paint was sprayed on the stainless-steel heater as a background. Then, liquid crystal (R40C20W by Hallcrest (1911 Pickwick Lane, Glenview, IL, USA)) was sprayed, layer by layer, on the black paint. The liquid crystal’s color changing range was between 40 °C and 60 °C. A DC power that can accurately control the output voltage was applied to adjust the total input power. To avoid the interference of other lights, experiments were conducted in a dark room. The pressure taps on the test channel wall were used to measure the pressure drop of pin fin arrays. The measurement range of the pressure gauge was 0–5 kPa and the pressure gauge was produced by Setra®. Six calibrated Type-K thermocouples were also mounted to measure the center line temperature of the inlet and outlet planes. They were used to calculate the bulk temperature difference. The temperature difference between inlet and outlet was about 3–5 °C. Therefore, the air thermophysical properties are considered to be unchanged during the experiment. On the external bottom surface of the test section, another 12 thermocouples of 4 × 3 were embedded. These temperatures were applied to calculate the conduction loss profile on the bottom plate.

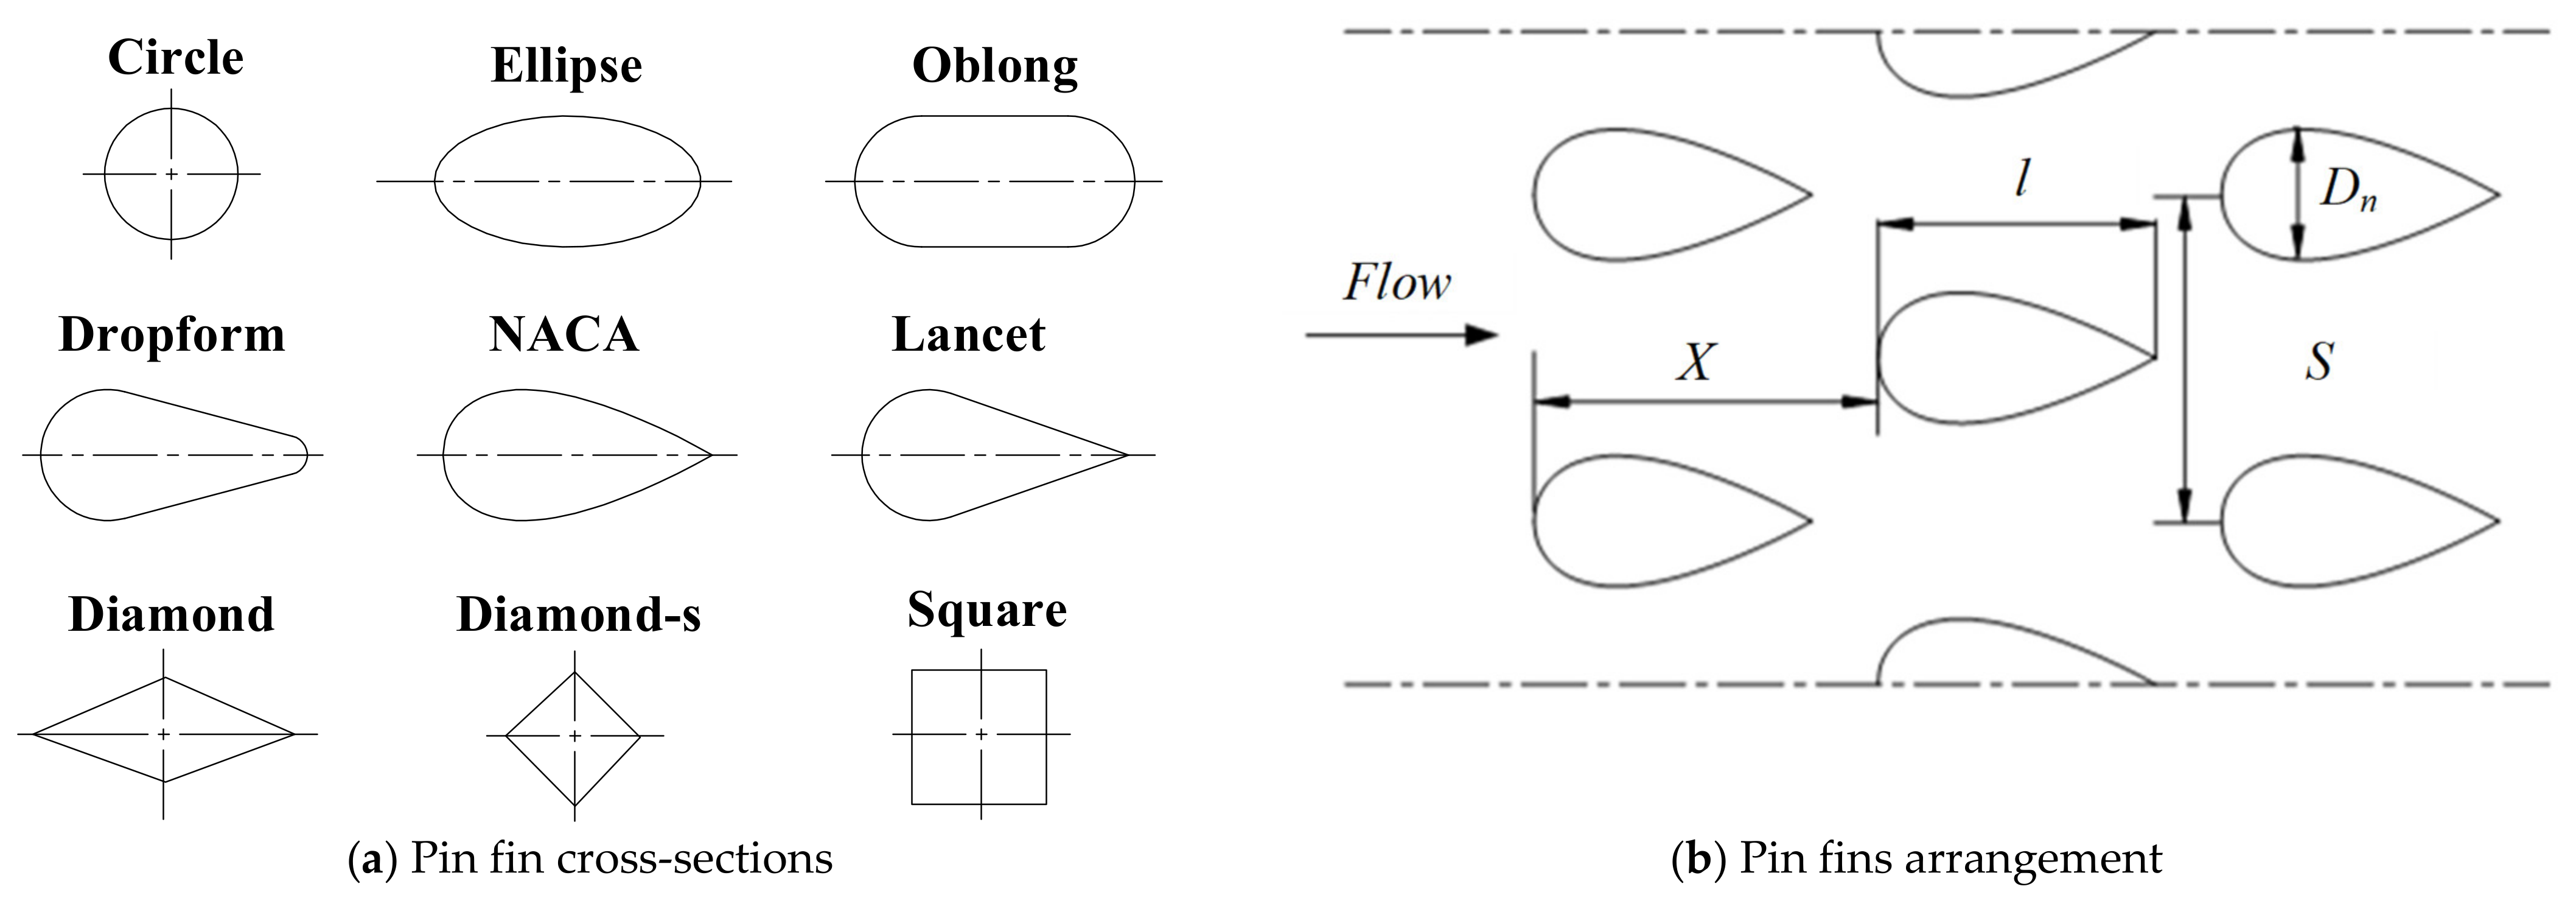
2.3. Description of the Test Section

Three different shape types were employed in this experiment, and for each type, there were three pin fin cross-sections. These were of three roundness shapes (Circle, Ellipse and Oblong), three streamline shapes (Dropform, NACA and Lancet) and three quadrangle shapes (Diamond, Diamond-s and Square), respectively.
The cross-sections of the nine selected pin fins are depicted in Figure 2a. In the present work, the maximum profile thickness is 8 mm and the chord is 16 mm. These nine types of pin fins all had the same nominal diameter Dn of 8 mm. The height of the pin fins, H = 24 mm, and there were some insulating foams with a thickness of 1 mm between the pin fins and the top plate. Therefore, pin fins could be fixed at their locations by the insulating form. The pitches S was 16 mm and X was 36 mm. Zhang et al. [21] applied for a patent for a new airfoil design. Pin fins were widely used in this design, not only in the trailing edge but also in the middle part. Since the pin fins were not used in a traditional way, the arrangement is also not traditional. This experiment was based on the design of Zhang et al. [21], so the X/Dn value was a little bigger than that in common research. The Ellipse’s minor axis length was equal to the diameter of Circle, and the major axis length is two times the minor axis length. The diameter of the Oblong pin fin corresponded to the diameter of Circle and its length was two times the Circle diameter. The Dropform’s larger circle diameter was D1 = 8 mm and the small circle diameter was D2 = 2.4 mm. The Lancet is similar to Dropform, with D2 = 0. The profile of the NACA pin fin is given by the following equation [22].
y = 5t(0.2969x0.5 − 0.126x − 0.3516x2 + 0.2843x3 − 0.1015x4)
where t denotes the maximum profile thickness as a percentage of chord length. The Diamond and Diamond-s are inscribed by Ellipse and Circle, respectively. The side length of Square is Dn.
There were four rows of pin fins on the heated test section, made of Plexiglass. Rows one and three had six complete pin fins while rows two and four had five complete and two half pin fins. Figure 2b shows the geometry and arrangement of pin fins on the heated wall. Arrangements were the same for all nine types of pin fins. Due to their having the same nominal diameter and arrangement, the channel blockage ratio was the same for each pin fin set. Pin fins had a length of l/Dn = 2, except for Circle, Diamond-s and Square. The height-to-diameter ratio was H/Dn = 3, relative spanwise pitch was S/Dn = 2 and streamwise pitch was X/Dn = 4.5. The arrangement of X/Dn = 4.5 was selected to accommodate the pin fin length. The Reynolds number based on channel hydraulic diameter ranged from 10,000 to 60,000.

3. Data Reduction

As the working fluid is air and the temperature is close to room temperature, the air thermophysical properties are fixed and Prandtl number of Pr = 0.7. The Reynolds number is defined as:
R e = u D h ν
The u is mean velocity of the flow at inlet plane of the channel. Dh is the channel hydraulic diameter, which is based on the smooth region of the pin fin channel. ν is kinematic viscosity of air.
The friction factor of the channel is defined as:
f = 2 Δ P D h ρ u 2 L
The ΔP is the inlet and outlet pressure difference, ρ is the air density and L is the distance between pressure taps.
The Nusselt number represents the non-dimensional heat transfer coefficient:
N u ( x , y ) = h ( x , y ) D h k
The h is the local heat transfer coefficient, and k is the thermal conductivity of the air.
Dittus–Boelter and Blasius correlation is used as the baseline:
N u 0 = 0.023 Re 0.8 Pr 0.4
f 0 = 0.316 Re 0.25  
The heat transfer coefficient is given by:
h ( x , y ) = q c o n v T w ( x , y ) T b ( x )
Here, qconv is the heat flux of the convection. Tw is the wall temperature, measured by the TLC method. For the steady-state TLC method, before data acquisition, the temperature difference should be less than 0.1 °C per five minutes. Tb is bulk temperature, which is obtained through a linear interpolation of inlet and outlet temperature.
qconv can be obtained from the energy balance below:
q t o t a l = q c o n v + q c o n d + q r a d
qtotal is the total input power through the foil heater. qcond and qrad are conduction and radiation heat flux, respectively. Both of these are heat losses. More details were introduced by Mayo et al. [23]. The heat transfer through pin fins is also calculated, and it is less than 3% of the total input power, so this heat loss is neglected.
The radiative heat loss is computed using a simplified model, neglecting the presence of the narrow side walls, qrad can be calculated by this equation:
q r a d = σ ( T w 4 T p 4 ) 1 ε w + 1 ε p 1
ε is the emissivity and σ is the Stefan–Boltzmann constant. The emissivity of the TLC surface is assumed to be εw = 0.9, The emissivity of Plexiglass is assumed to be εp = 0.86. Tp is temperature of the surrounding, non-heated wall.
The conductive heat loss is described as:
q c o n d = k P l e x i t P l e x i ( T h T e x t )
kPlexi is the Plexiglass thermal conductivity and tPlexi is the thickness of test plate. Th is the temperature of foil heater. As the thickness of foil heater is so thin, Th is assumed to be equal to Tw. Text is measured by thermocouples embedded in the external bottom surface of the test plate. Then, qconv can be obtained by Formulas (8)–(10).
Before carrying out the experiment, a calibration must be conducted to obtain the TLC calibration curve. The hue value can be used to compute the temperature of the test surface. The relationship between hue and RGB (R, G and B value) is described as:
Hue = 1 2 π tan 1 [ 3 ( G B ) 2 R G B ]

4. Uncertainty Analysis

The experimental uncertainty analysis was performed after the experiment. According to the measurement and calculation, the estimations for heat loss qcond and qrad are about 1% to 5% and 1% to 3% of the total input power, respectively. As the total input power is quite large at a high flow rate, the heat loss is smaller at a larger Reynolds number. The measurement accuracy of pressure gauge is ±5 Pa. The temperature measurement error of thermocouples is ±0.5 °C. This becomes ±0.3 °C when the temperature is measured by the steady-state TLC method. Moreover, according to the uncertainty estimate method introduced by Kline and McClintock [24], the measurement uncertainties of Re, f and Nu are ±4.3%, ±5% and ±5.2%, respectively.

5. Results and Discussion

5.1. Nu Distribution on the Endwall

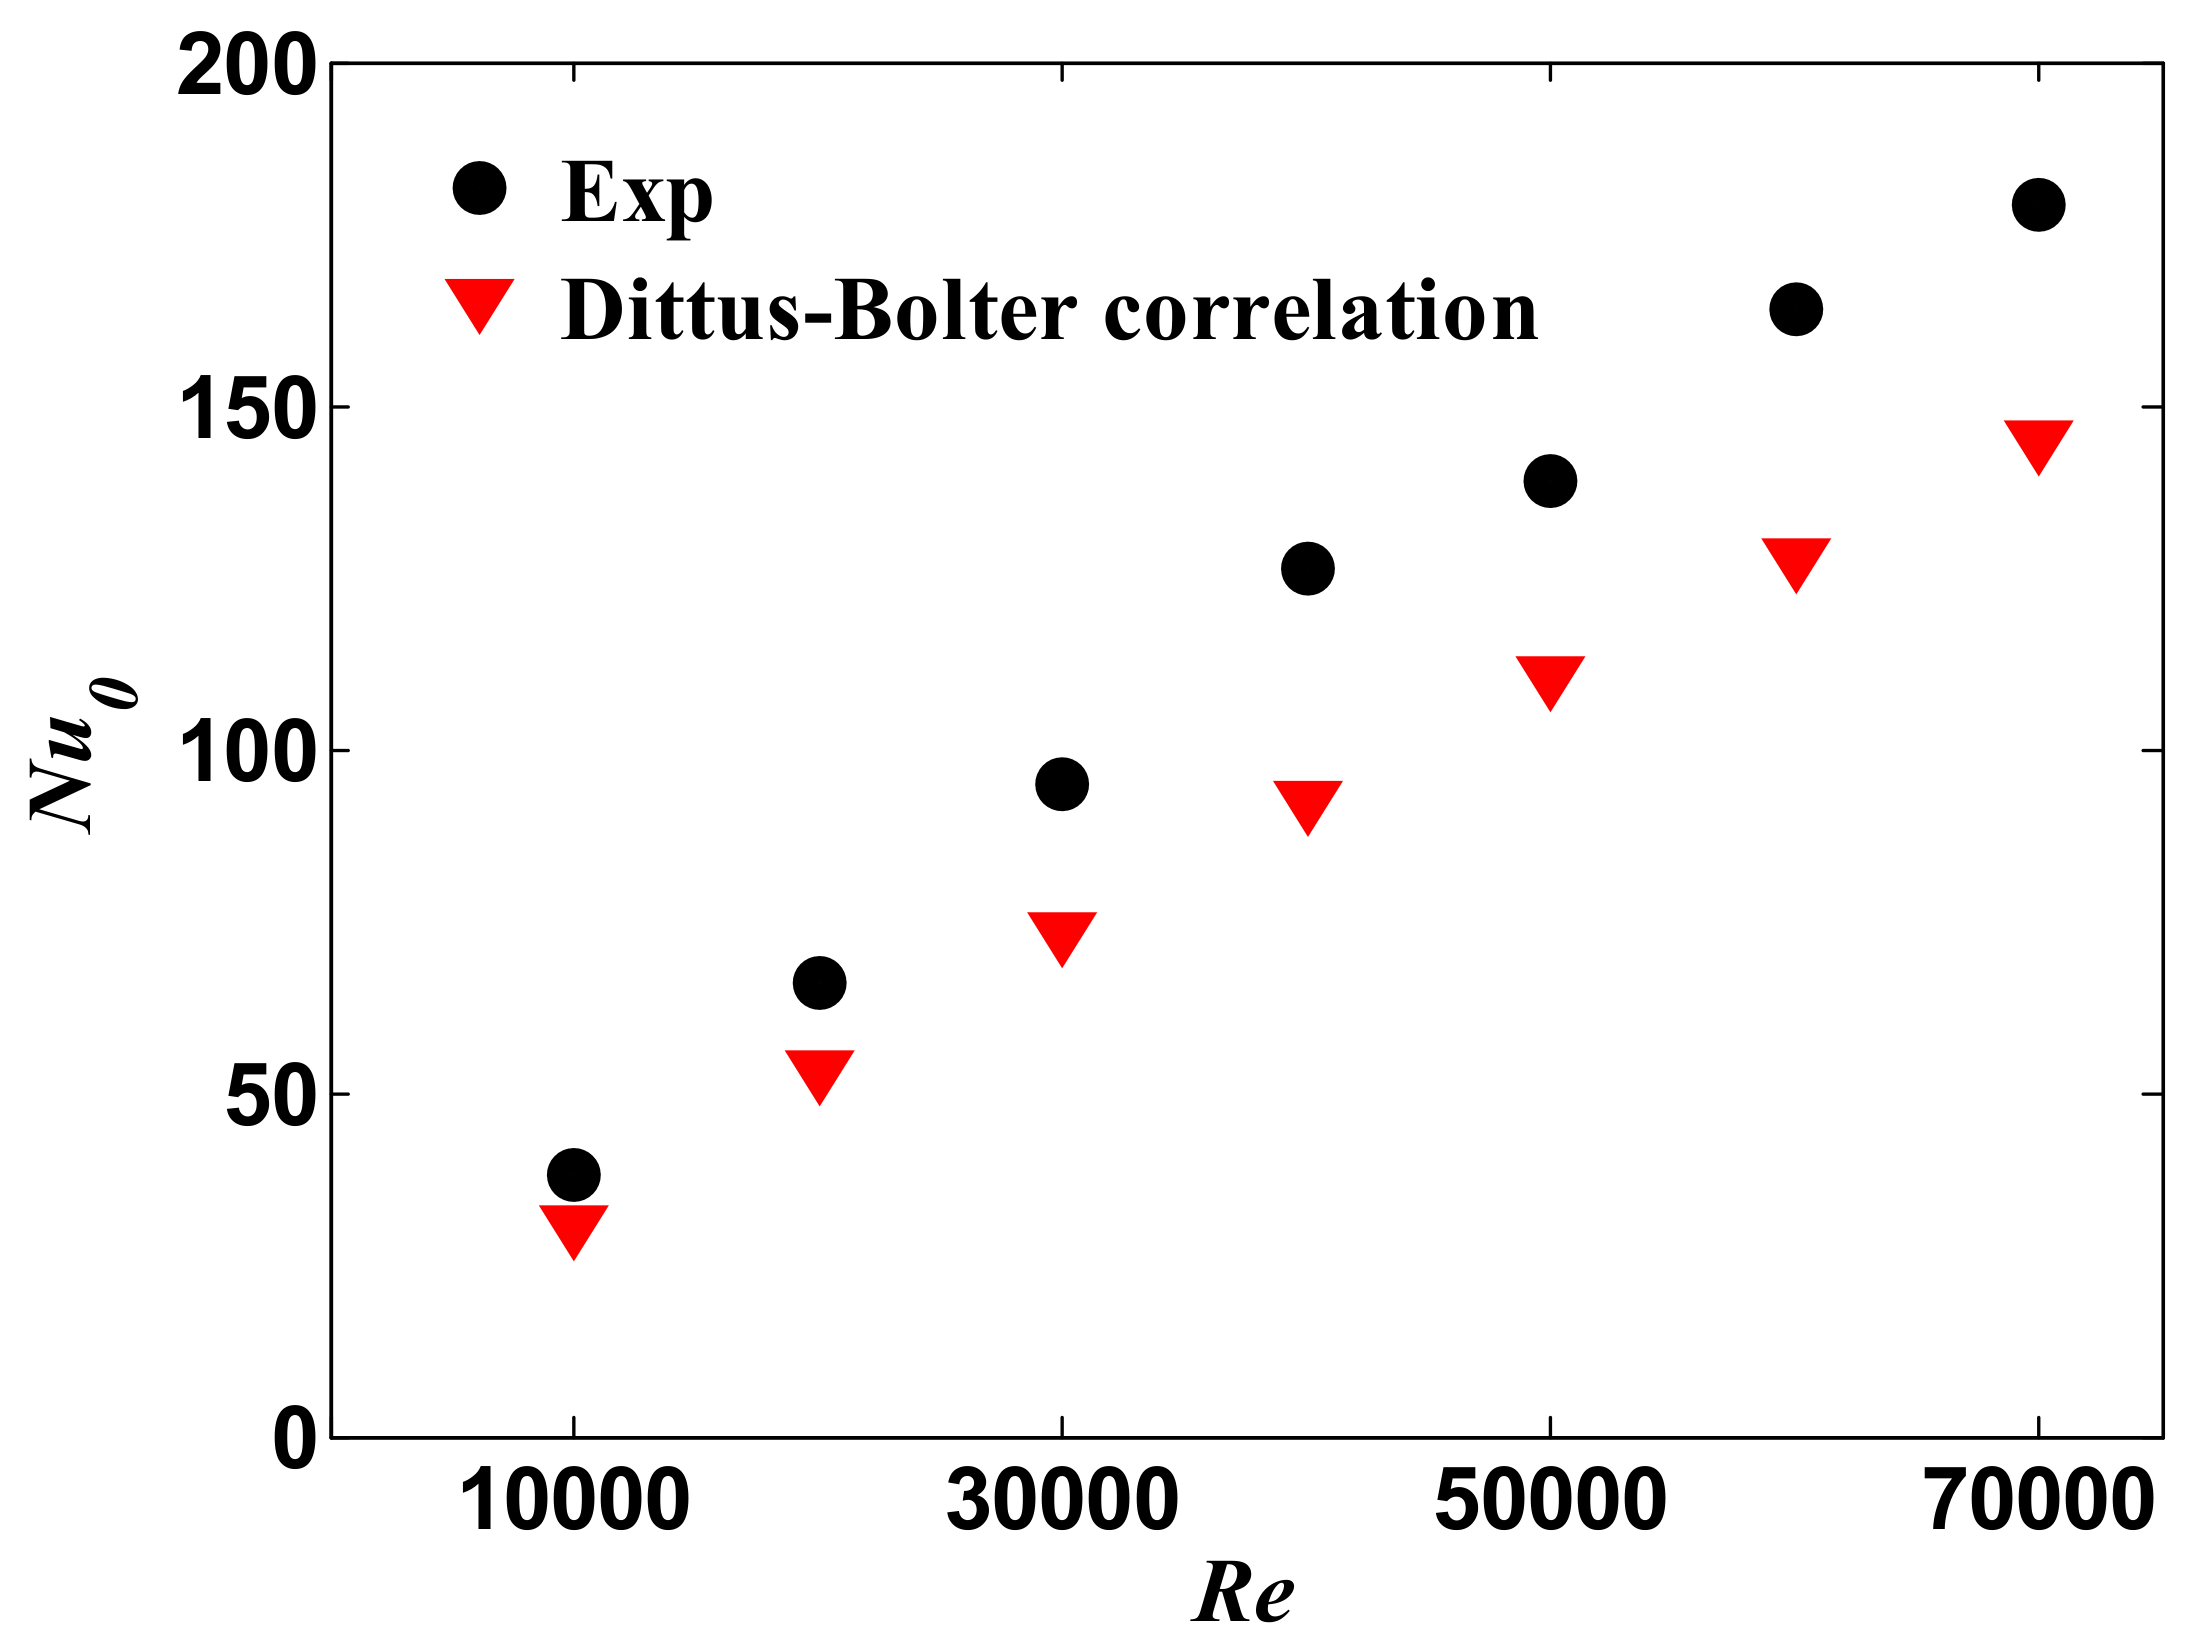
5.1.1. Data Validation

Before the experiment, the Nusselt numbers and friction factors of a smooth channel are measured to validate the experimental results. The Reynolds numbers are as same as those in the latter experiment. The baseline measurement will also be used as a basis of comparison for the pin fins channel.
Figure 3 shows a comparison of the baseline Nusselt number and the empirical data. Nu0 is the averaged local Nu value of the smooth plate. The empirical data comprise the Dittus–Boelter correlation for the thermally fully developed flow in a heated, smooth, circular duct. It can be seen that baseline Nusselt numbers have the same trend as the empirical data, where Nusselt numbers become lager when the Reynolds number increases. However, they are 10–20% higher than the empirical values at different Reynolds numbers. Figure 4 displays a comparison of the baseline friction factor and the Blasius correlation. It was found that the friction factor obtained in the experiment is larger than the Blasius correlation by 11–25%, within the Reynolds numbers range.
The deviation between the experiment data and correlation result is reasonable. On the one hand, for the empirical correlation, the channel cross-section is circular, and all the walls are heated. However, in this experiment, only one wall is heated, in the rectangular channel. The channel roughness should also be different. On the other hand, the deviations may be caused by the measurement uncertainties of 5% and 5.2%, respectively. The biases are acceptable, and a reasonable match between experimental values and empirical data is observed. This comparison could validate the measurements’ reliability.

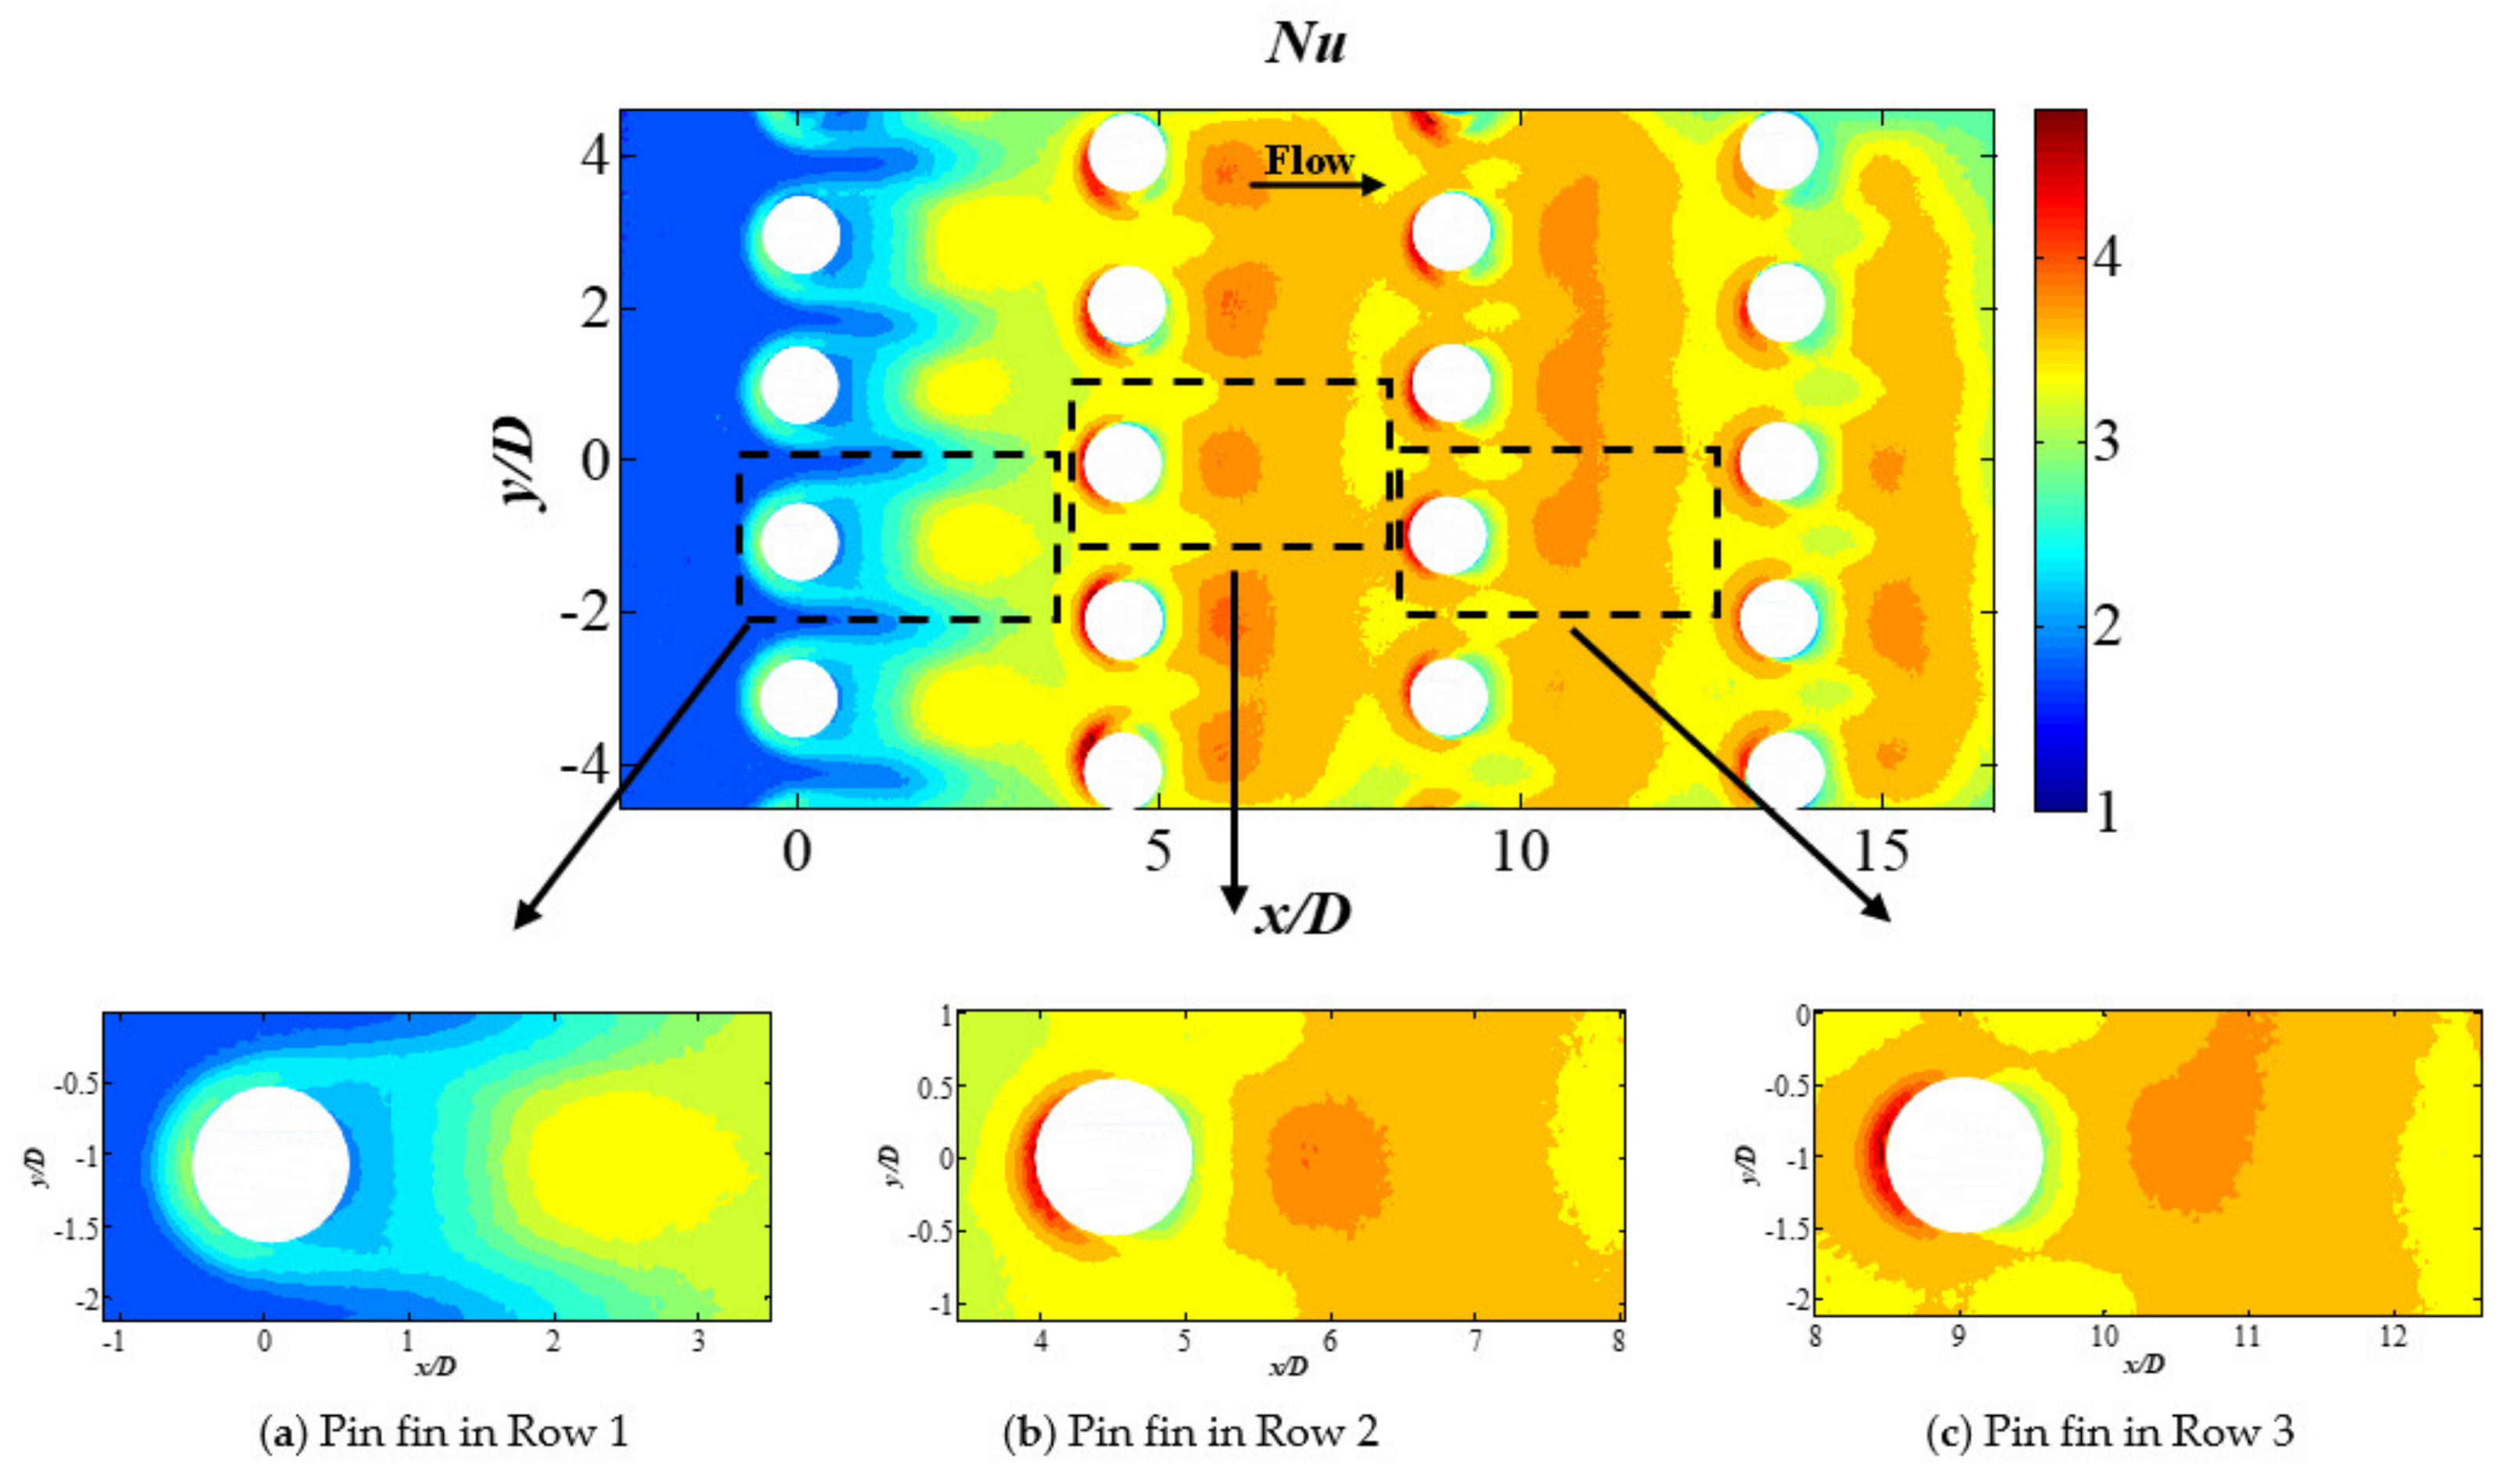
5.1.2. Nu Distribution in Channel with Circle Pin Fins

Figure 5 shows the local distribution of Nu/Nu0 on the endwall of Circle pin fins at Re = 10,000. Nu0 is based on the experiment data of a smooth channel. The white circles represent the locations of pin fins where the temperature is not acquired. The flow direction is from left to right. With the flow progressing downstream, it is obvious that the heat transfer characteristics are different downstream of each row. The flow and heat transfer are developed downstream the third row. The spatial resolution of temperature measurement in this experiment is high enough to resolve the subtle variation in heat transfer around pin fins caused by complex flow structures, especially for the first row. The details of Nu distribution around a single pin fin are presented in Figure 5a–c to show the characteristics of heat transfer distribution for different pin rows. Three pin fins are chosen, from Row 1 to 3. The pin fin in Row 4 is not compared, because the difference between Row 3 and Row 4 is small.
For Row 1, the heat transfer is enhanced right upstream of the pin fin. High heat transfer regions wrap around the pin fin and extend downstream. The shape of the high Nu region indicates that a horseshoe vortex exists around the Circle pin fin, and the local heat transfer is, therefore, enhanced. For Row 2, upstream of the pin fin, the heat transfer is also substantially augmented. However, this high heat transfer region does not extend further downstream. This indicates that the horseshoe vortex around the pin fin of Row 2 is weak, or does not contribute much to local heat transfer enhancement. This is consistent with the observations in Kirsch et al. [25], where the horseshoe vortex is visible in the first row and less apparent in the downstream rows. The relatively high Nu region right upstream pin of Row 2 could also be caused by the thinner boundary layer in this stagnation region.
Downstream of each pin fin, heat transfer is low in the recirculation wake region. Downstream the wake of each pin fin, the pronounced high heat transfer region dominates. This high Nu region has a large area. The loci of these high Nu regions are exactly downstream of the pin fin rows. Meanwhile, as the flow progresses downstream, the loci of these high Nu regions move closer to the corresponding pin fin, as seen in Figure 5. Our previous study [26] shows that these large high Nu regions correspond to strong cross-stream velocity fluctuations, caused by the shedding of the large vortex from pin fins. Thus, the shedding of the large vortex and related cross-stream velocity fluctuation is the primary flow mechanism driving heat transfer enhancement in these regions for Circle pin fins.

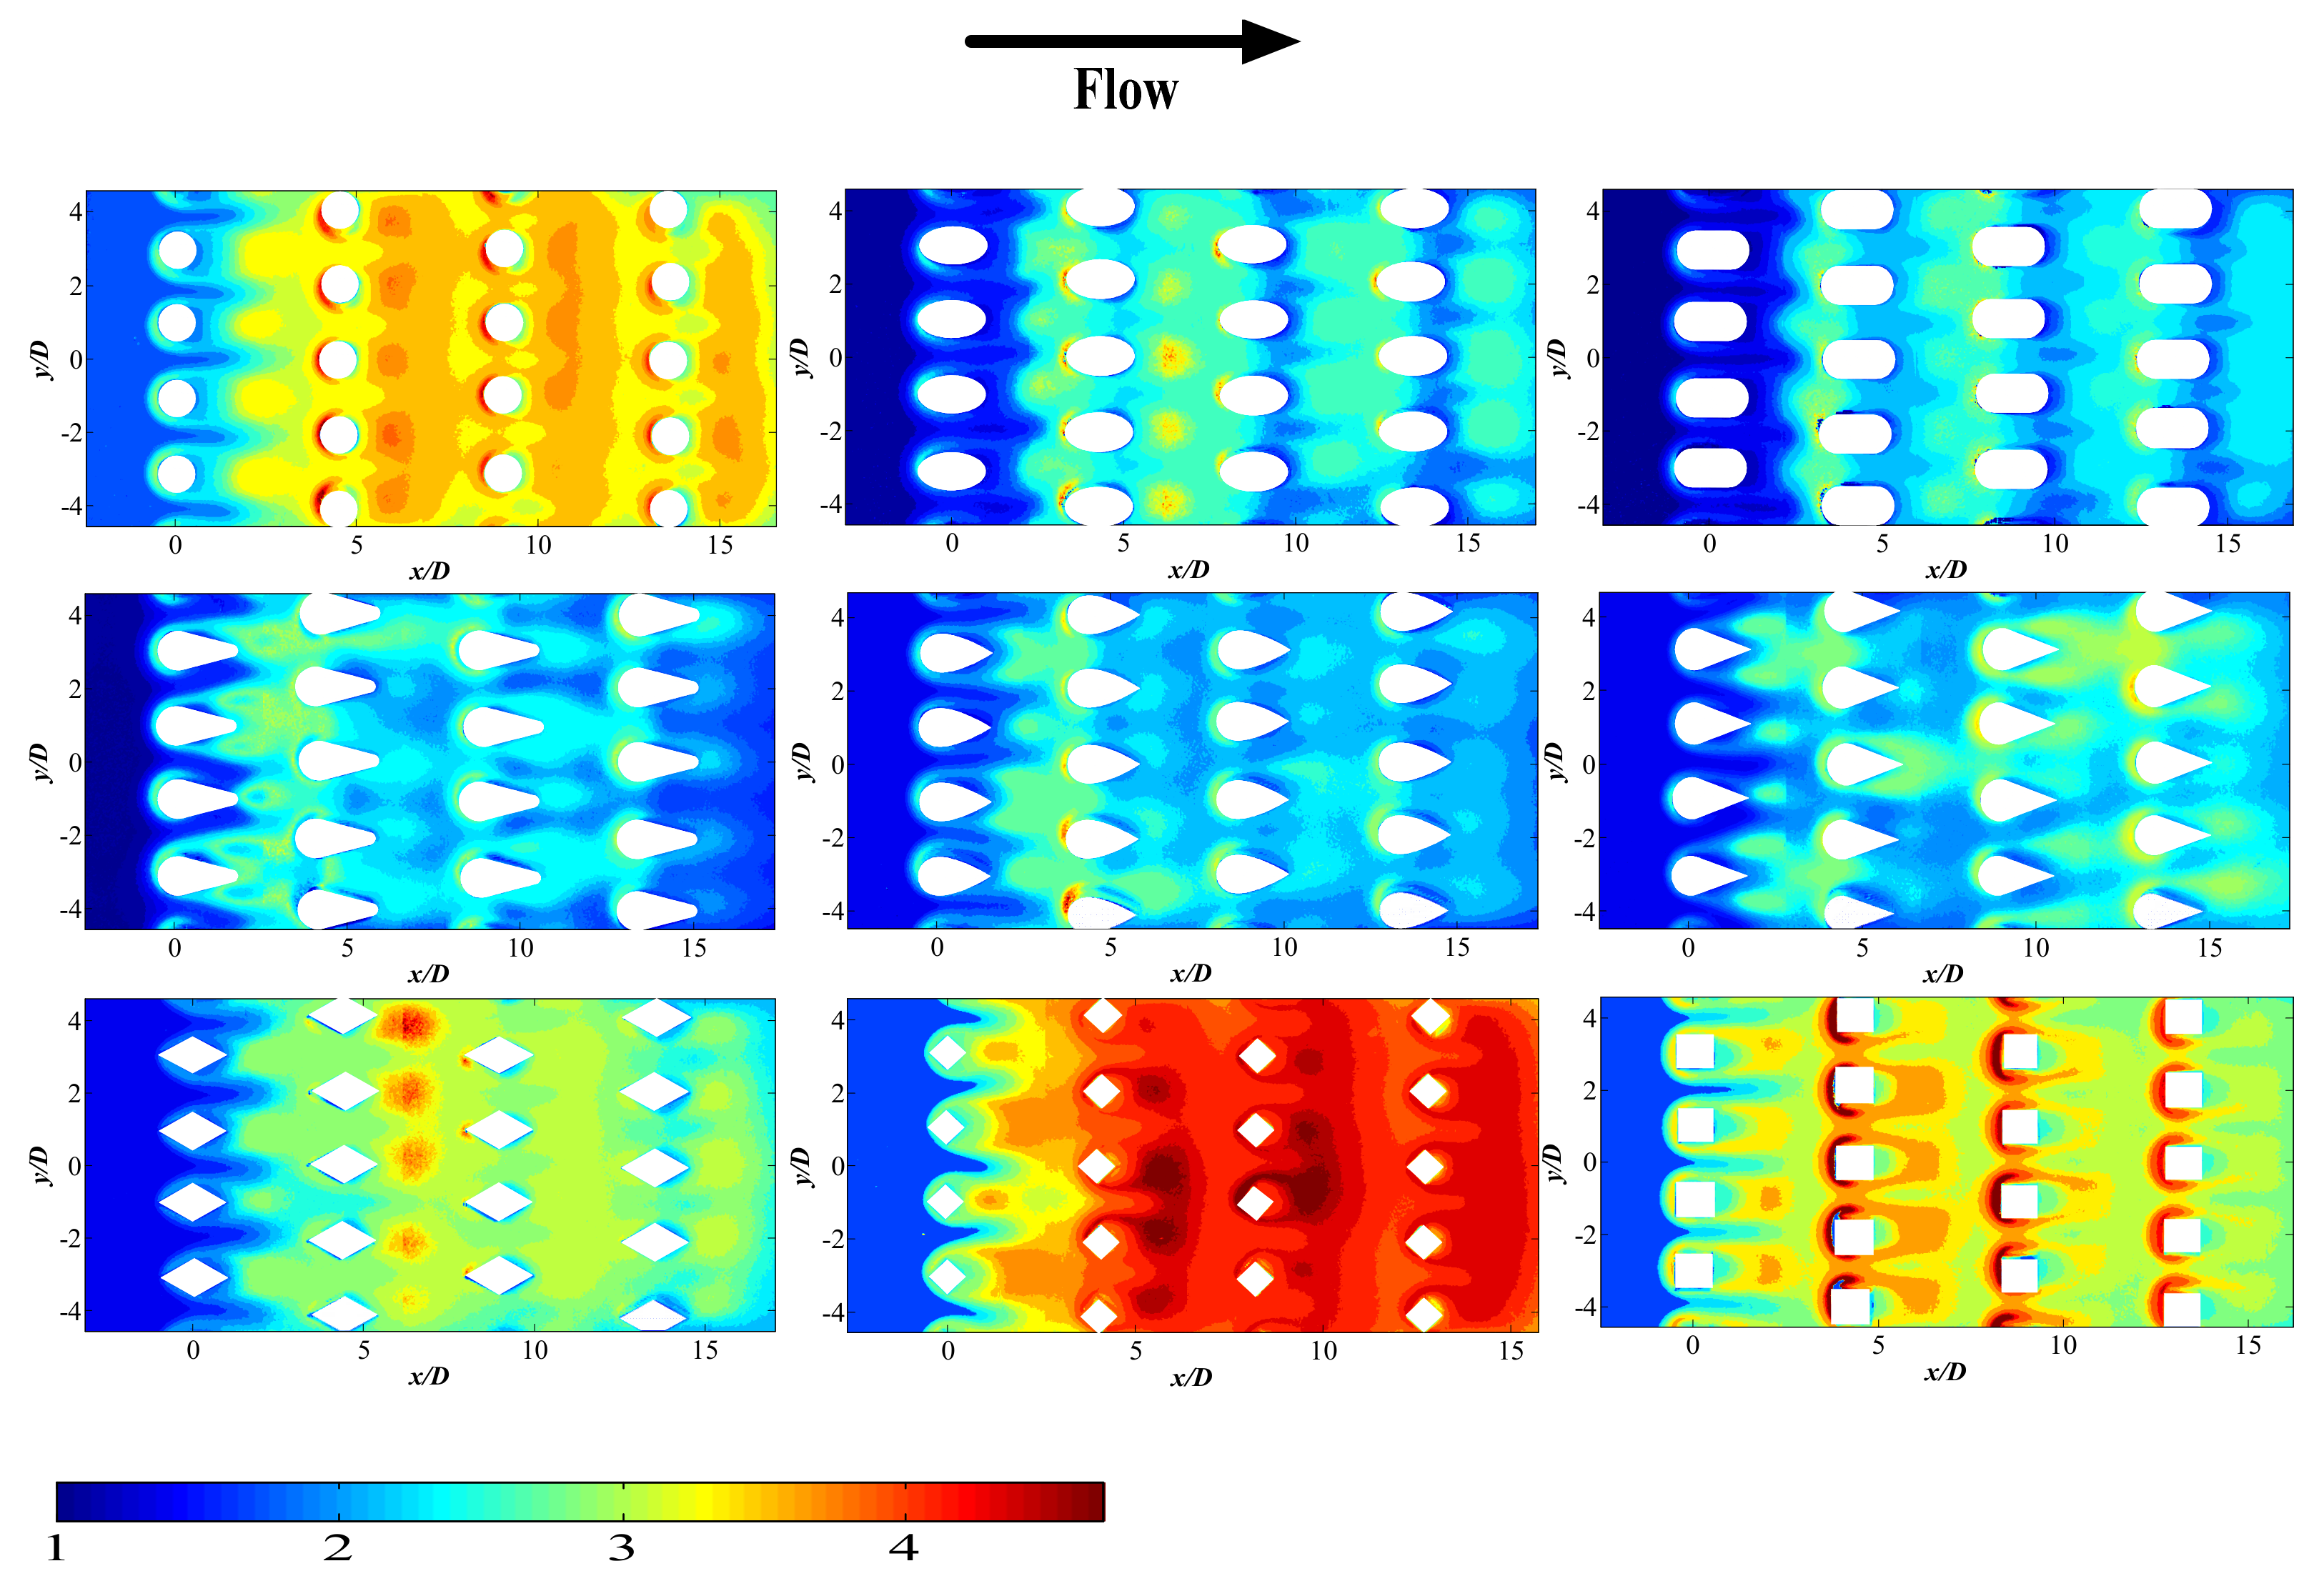
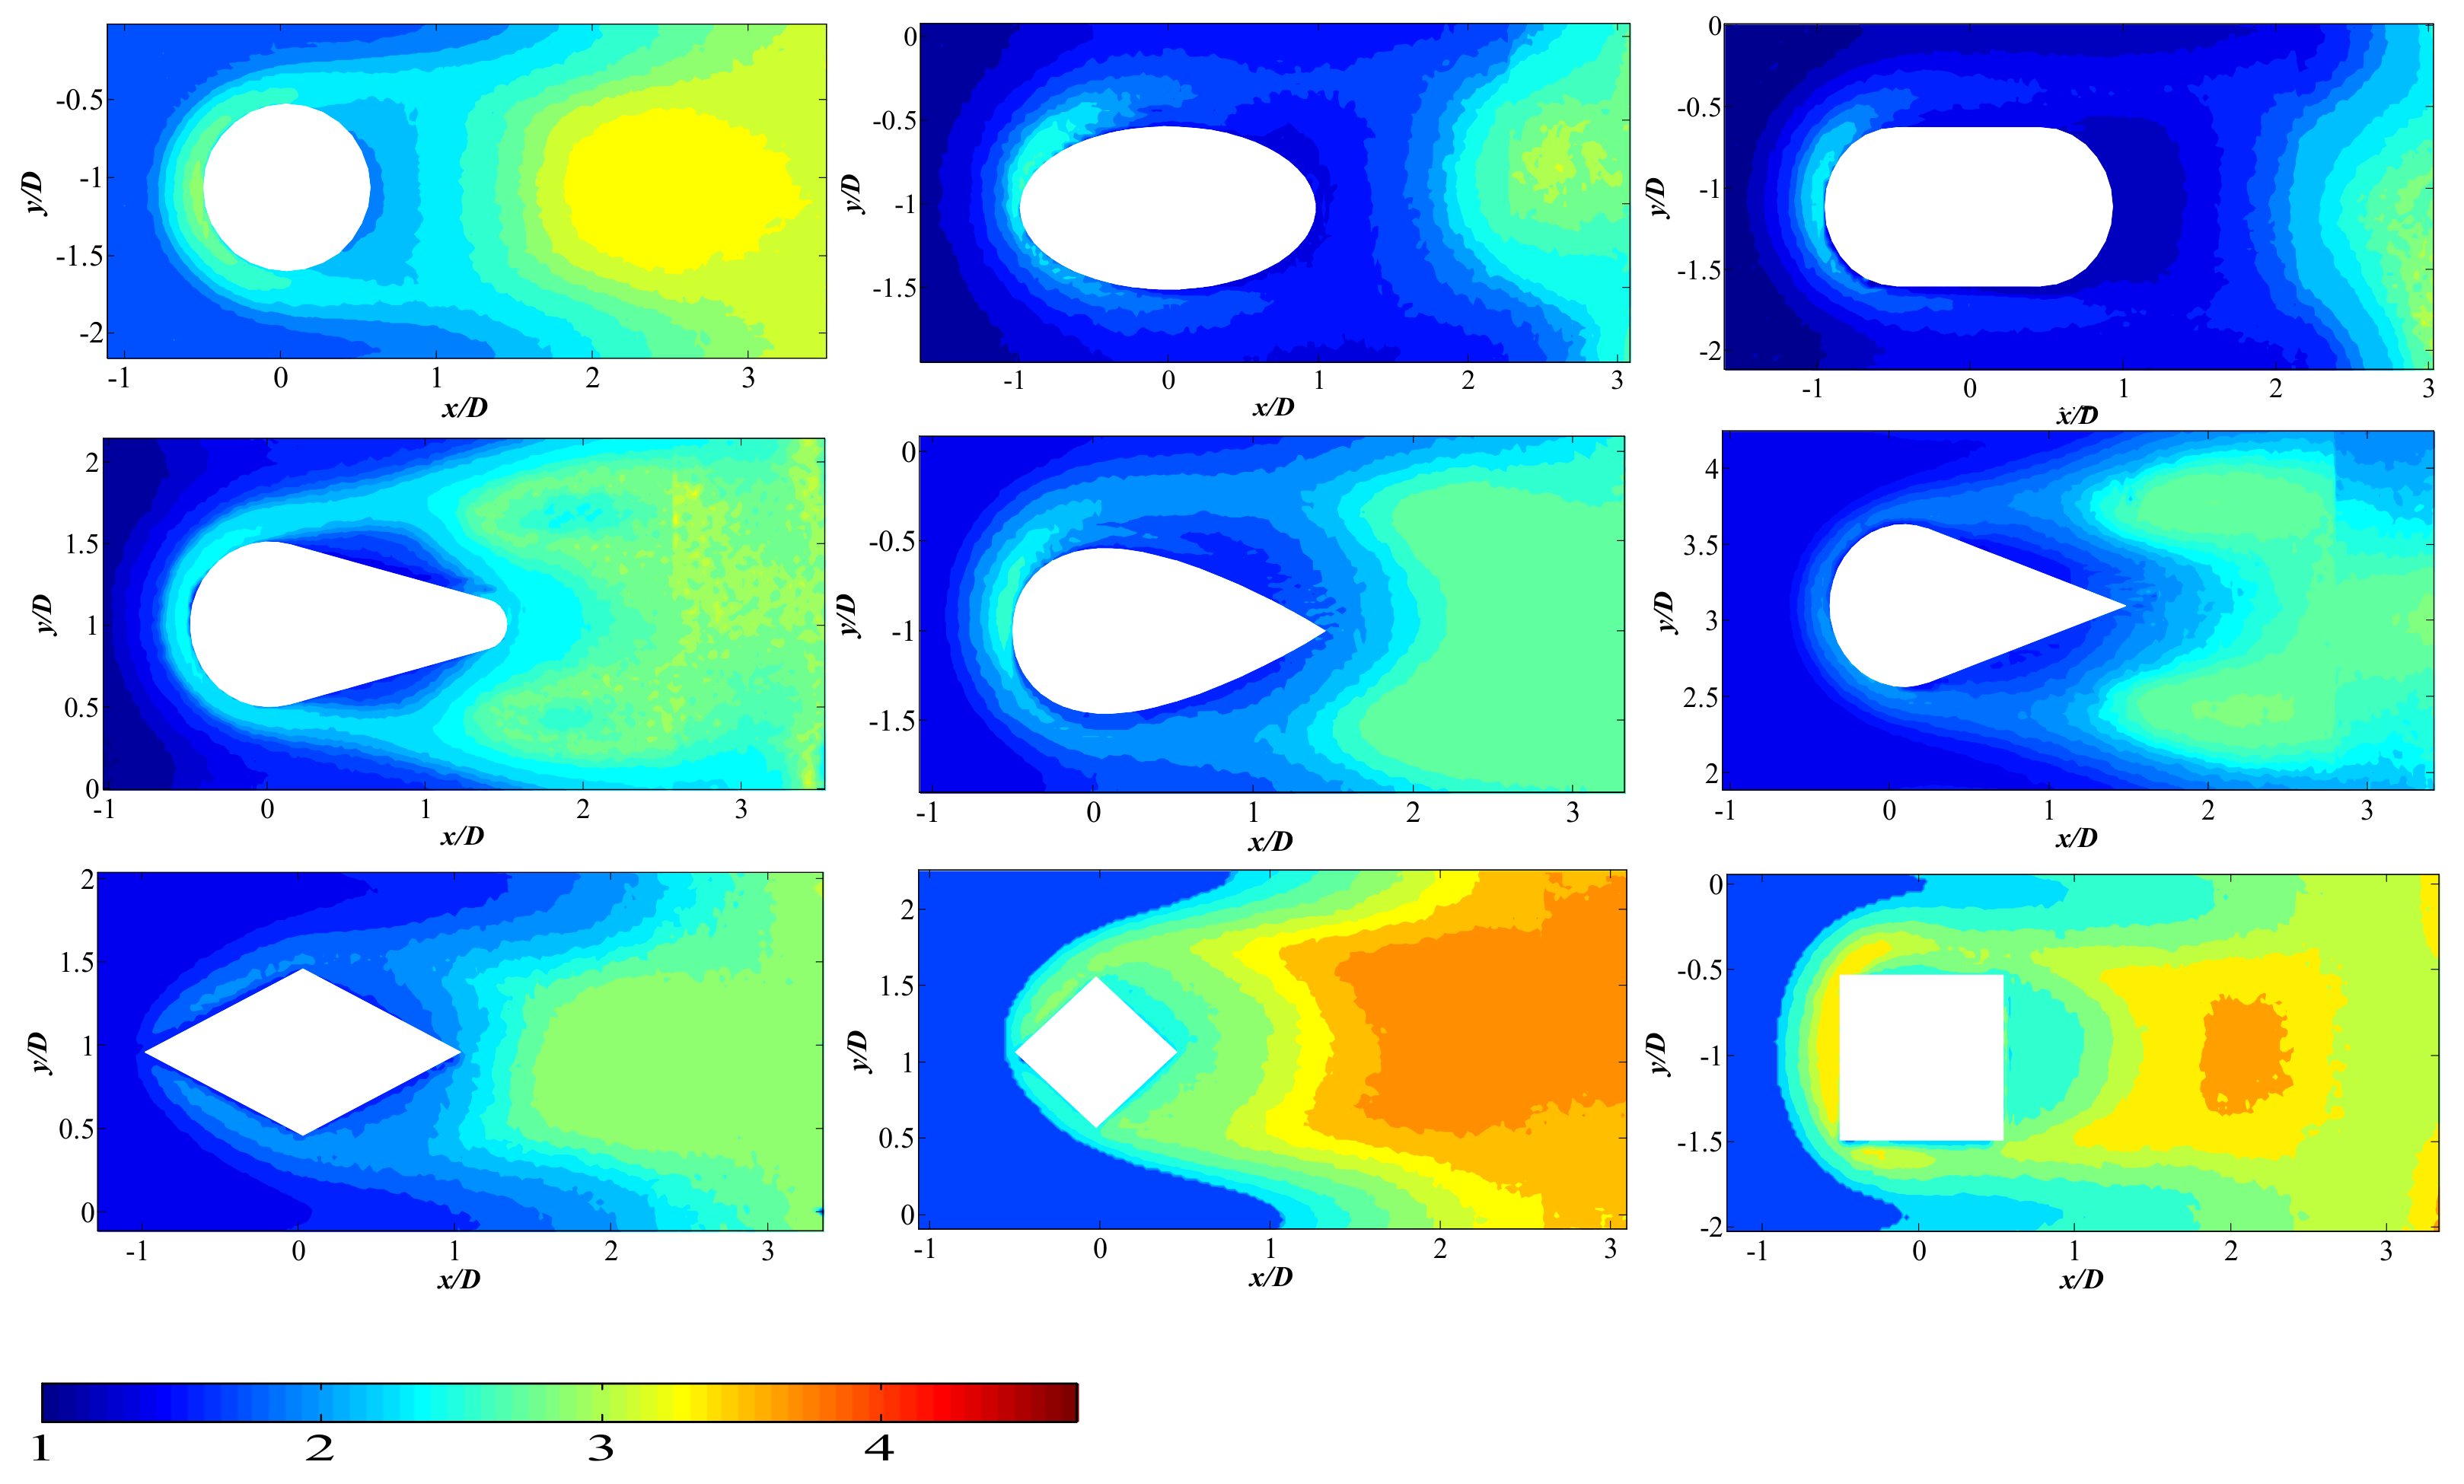
5.1.3. Effect of Pin Fin Shape on Nu Distribution

Nusselt number distribution varies substantially with pin fin shape. Figure 6 shows the local distribution of Nu/Nu0 on the endwall of the nine types of pin fins at Re = 10,000. Figure 6 clearly demonstrates that the heat transfer enhancement of Diamond-s pin fin is the best. Square, Circle and Diamond rank from second to fourth. The values of Ellipse and Oblong are relatively low, and that of the streamline shape pin fin is the lowest. Except for streamline shapes, the highest Nu is downstream the second row. Then, the Nu distribution gradually becomes repetitive downstream the 3rd row, which means that the flow and heat transfer is fully developed downstream the 3rd row.
The Nu distributions for Circle, Ellipse and Oblong are similar, but Circle has the best heat transfer. The high Nu regions downstream the first row are closer to the second row for Ellipse and Oblong compared to those for Circle pins. This means that the flow is not well developed before encountering pin fins in the second row and being constrained. Ellipse and Oblong need a larger streamwise pitch to obtain a better heat transfer performance. The distributions of the three streamline shape pin fins are similar and relatively uniform. The vortex and unsteadiness from the boundary layer separation of the streamline cross-section is weaker. However, the Nu of Lancet is a little higher than the other two.
The shape of Diamond-s is similar to the Diamond with a shorter length, but their heat transfer enhancement abilities are quite different. The shorter Diamond-s shape pin fins achieve the highest Nu of all the pin fins. Compared with the Diamond pin fin, the shorter length makes its sharp corner angles bigger. These bigger angles could lead to a stronger flow separation and mixing.
The apparent variation in Nu distributions for different pin fin shapes indicates that the flow structures, as well as their contribution to heat transfer enhancement, are substantially affected by pin fin shapes. To investigate the detailed differences in heat transfer and flow structures, the Nu distribution around a single pin fin is compared for all nine shapes in Figure 7. All the pin fins are chosen from the first row at Re = 10,000.
For Circle and streamline shapes with round nose, there are slender high heat transfer regions extending downstream around pin fins. This indicates that the horseshoe vortex exists in these shapes and contributes to heat transfer enhancement around the pin fins. However, there is no apparent slender high heat transfer region for Ellipse and Oblong pin fins. For quadrangle shapes, the high heat transfer regions on both sides of the pin fin look more like the region of the separating shear layer than the horseshoe vortex.
For the three roundness shapes, there are low-velocity recirculation regions right and downstream of the pin fins. The heat transfer in these regions is relatively weak and the length of these regions is about 1D. Then, heat transfer is substantially increased downstream this recirculation region. The border between low and high heat transfer regions is almost flat along the y direction. Our previous study [26] shows the similarities between this distribution of high Nu and the large cross-stream velocity fluctuation downstream Circle pin fins, and provides evidence that this heat transfer enhancement downstream pin fins is caused by large vortex shedding and the related cross-stream velocity fluctuation. It is reasonable to derive the same mechanism for the three roundness shapes.
However, for the other six shapes, the shape of the border is curved and has peaks on both sides of the pin fins. This means that the shear layer unsteadiness on both sides plays a more important role in heat transfer enhancement for these pin fins, especially for streamline shapes. For these shapes, the small-scale turbulent intensity in developing shear layer and their mixing might be more crucial for heat transfer, since large vortex shedding and its induced cross-stream velocity fluctuation might not be present downstream streamline shapes. For quadrangle shapes, heat transfer on both sides of the shear layer region and the region of downstream recirculation are enhanced, which means that small-scale shear layer unsteadiness and large-scale fluctuations downstream are both crucial for heat transfer enhancement for quadrangle shapes.
Nu numbers are laterally averaged and shown in Figure 8 for all nine pin fin sets. For most pin fins, the peak locations represent the leading edge of the pin fin arrays, since heat transfer is the strongest at the leading edge of pin fins in the presence of horseshoe vortex and stagnation. At the same time, the difference between the leading and trailing edge of pin fins is quite large. Heat transfer right and downstream of the pin fin is the lowest for most cases. For Diamond and Diamond-s pin fins, there are no peaks in the leading edge. Due to the sharp leading edge for Diamond and Diamond-s pin fin, no horseshoe vortex could be induced, and the stagnation area is small. The maximum heat transfer occurs between rows for Diamond and Diamond-s pin fins, which is different from other shapes.
It can also be found that, for almost all nine pin fins, the global peak occurs downstream the second row. However, the heat transfer augmentations downstream Diamond-s are even higher than local peaks in other pin fins. Heat transfer augmentation of Diamond-s pin fins is the highest at almost all streamwise locations except for the leading edge, as shown clearly in Figure 8.

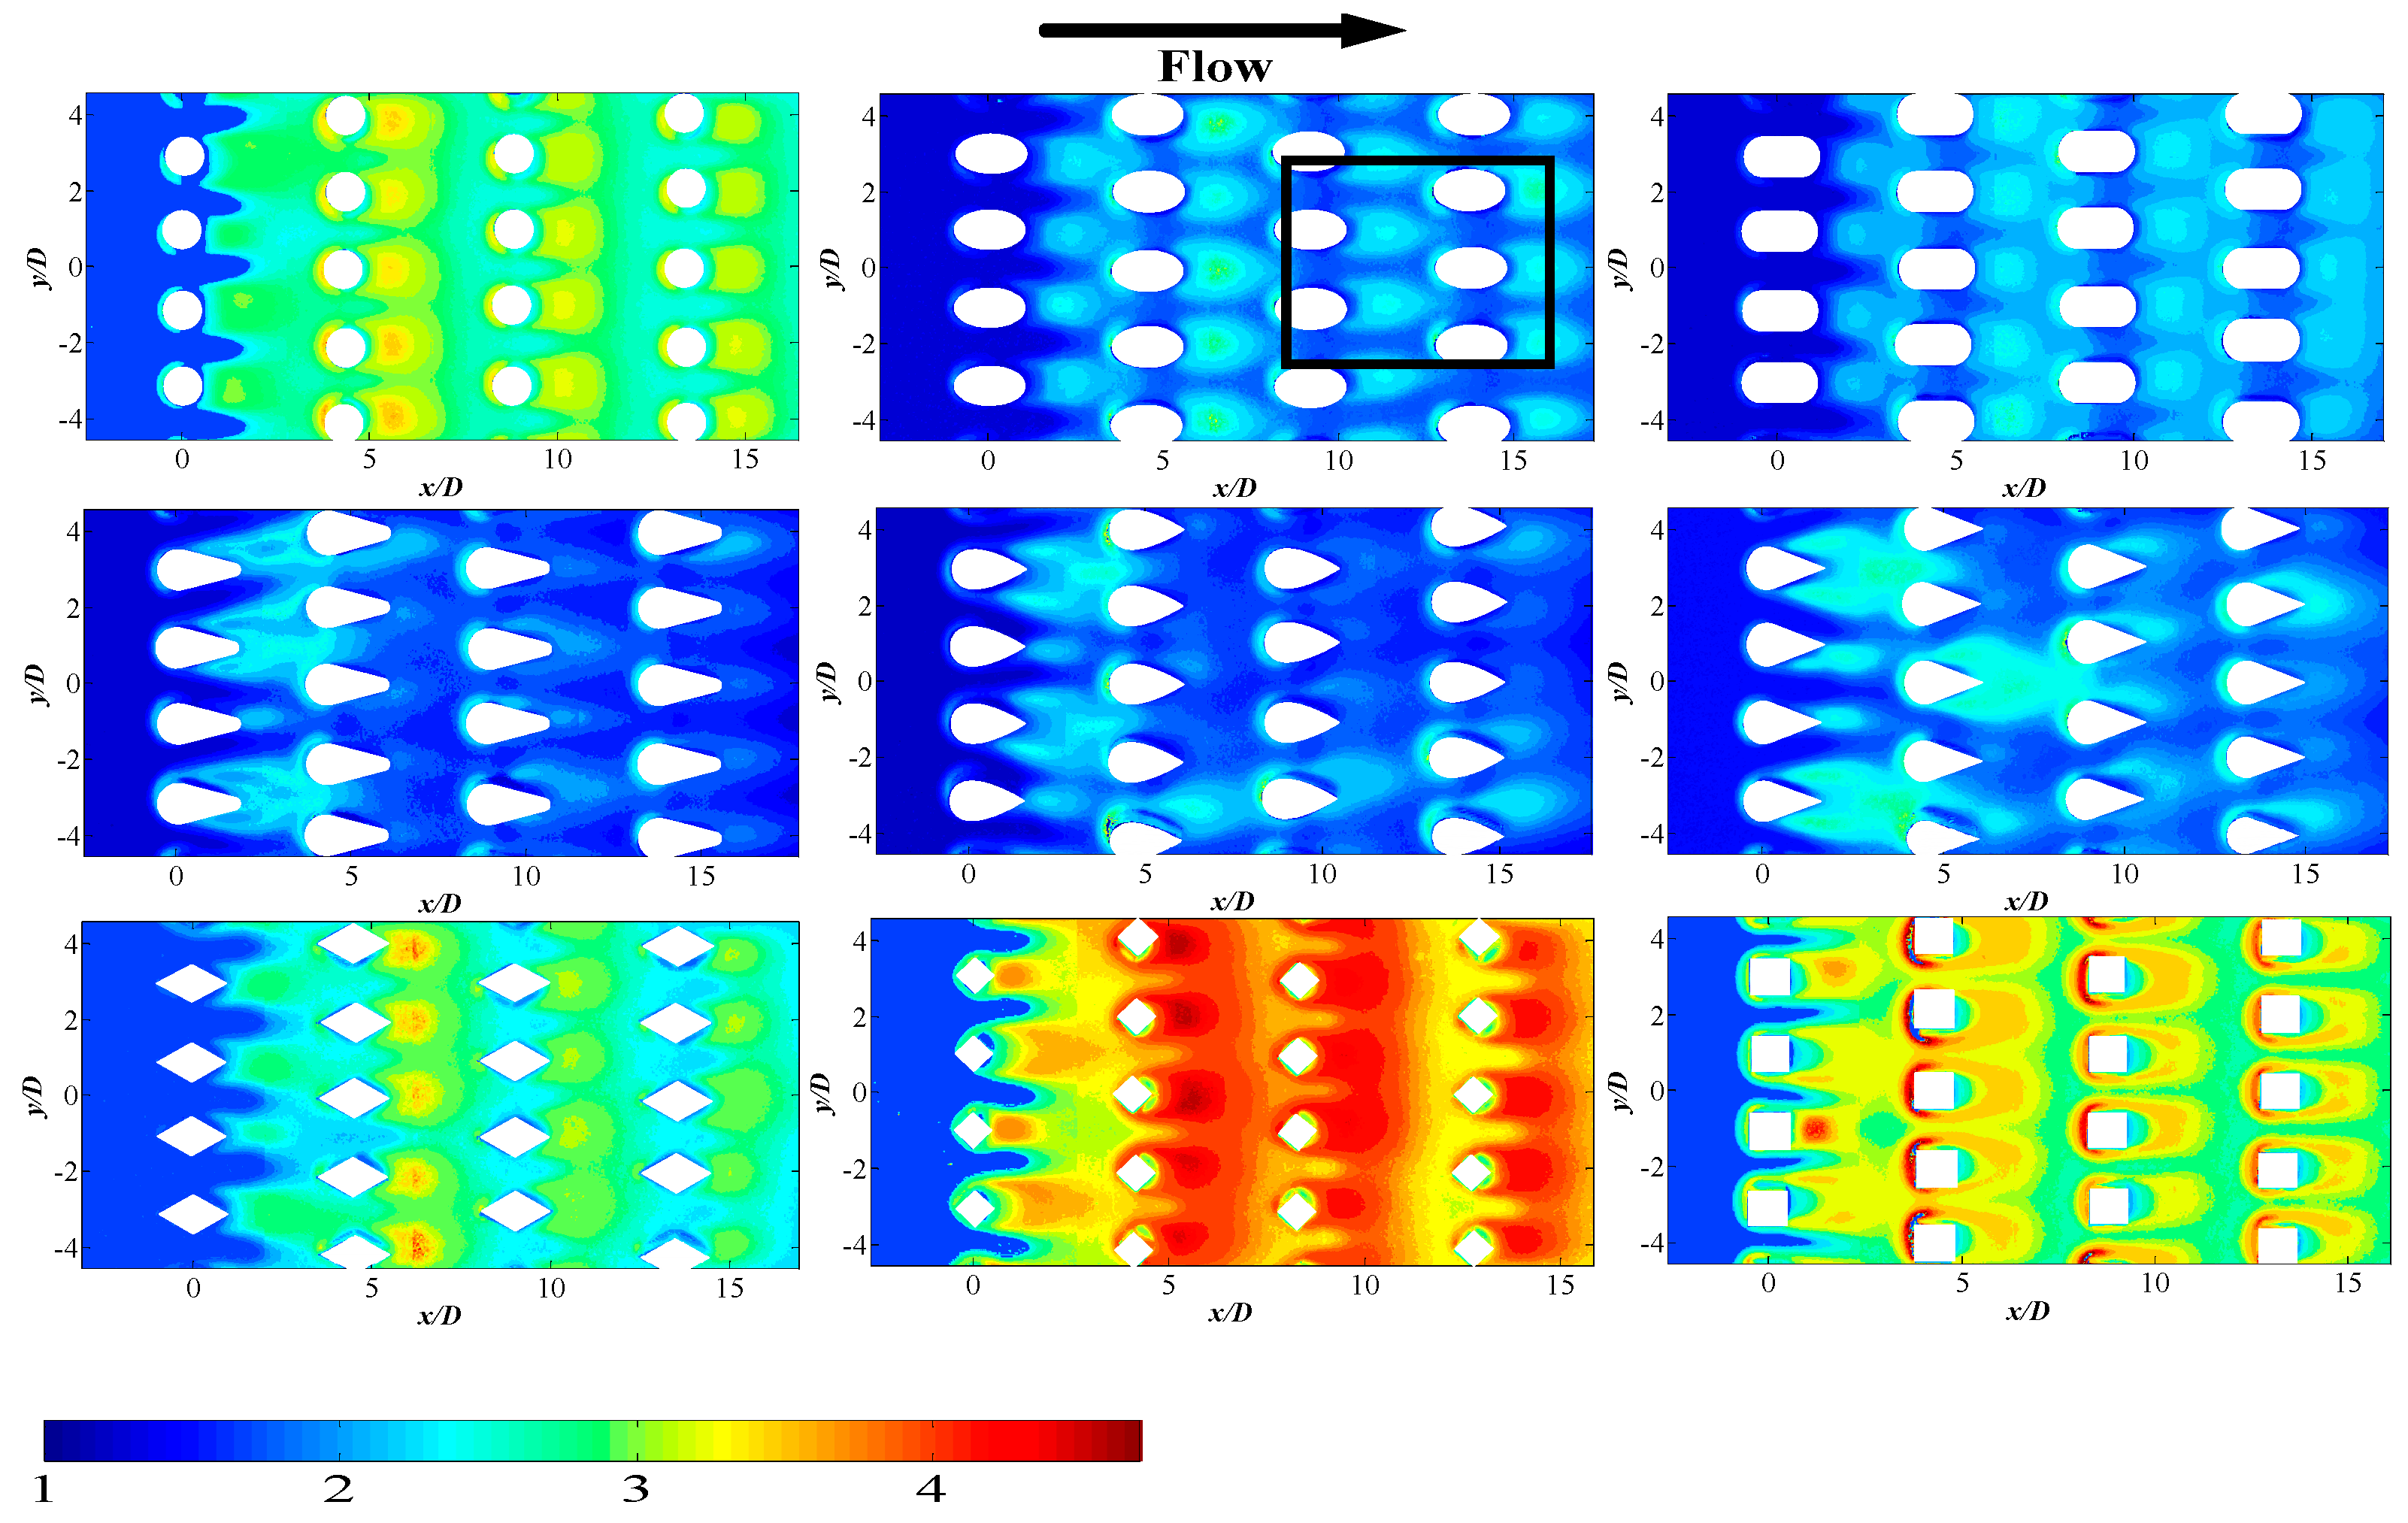
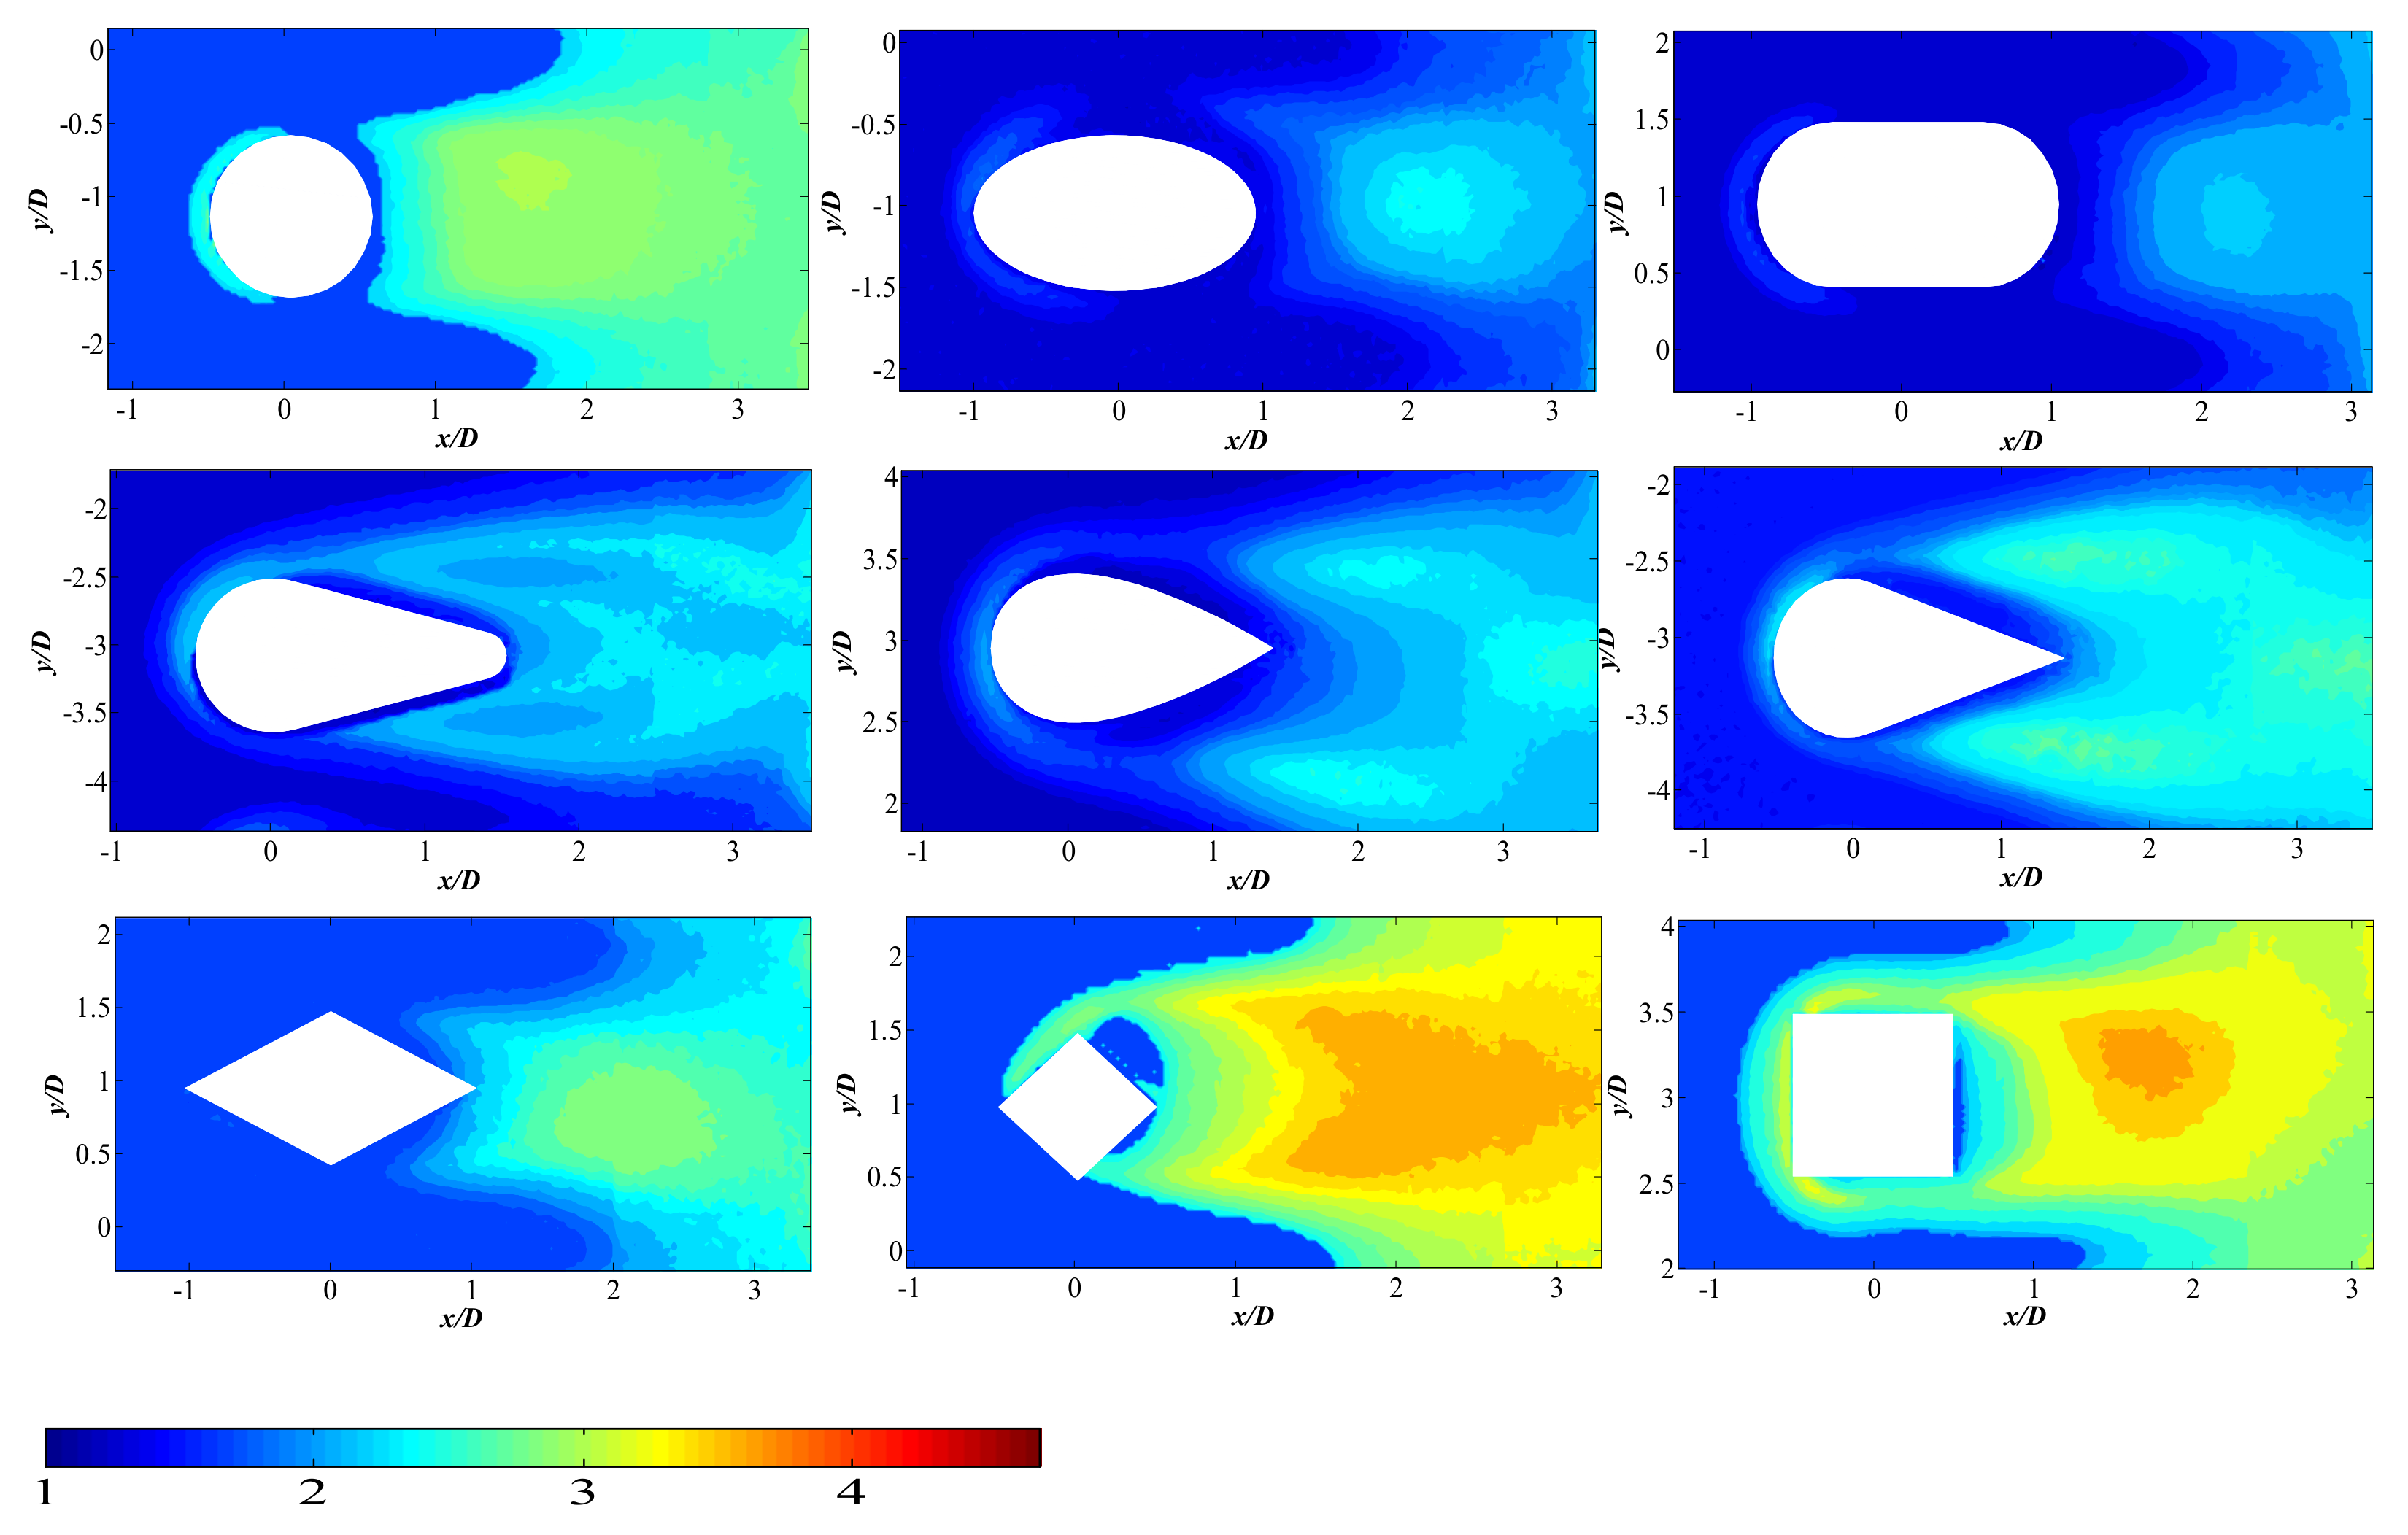
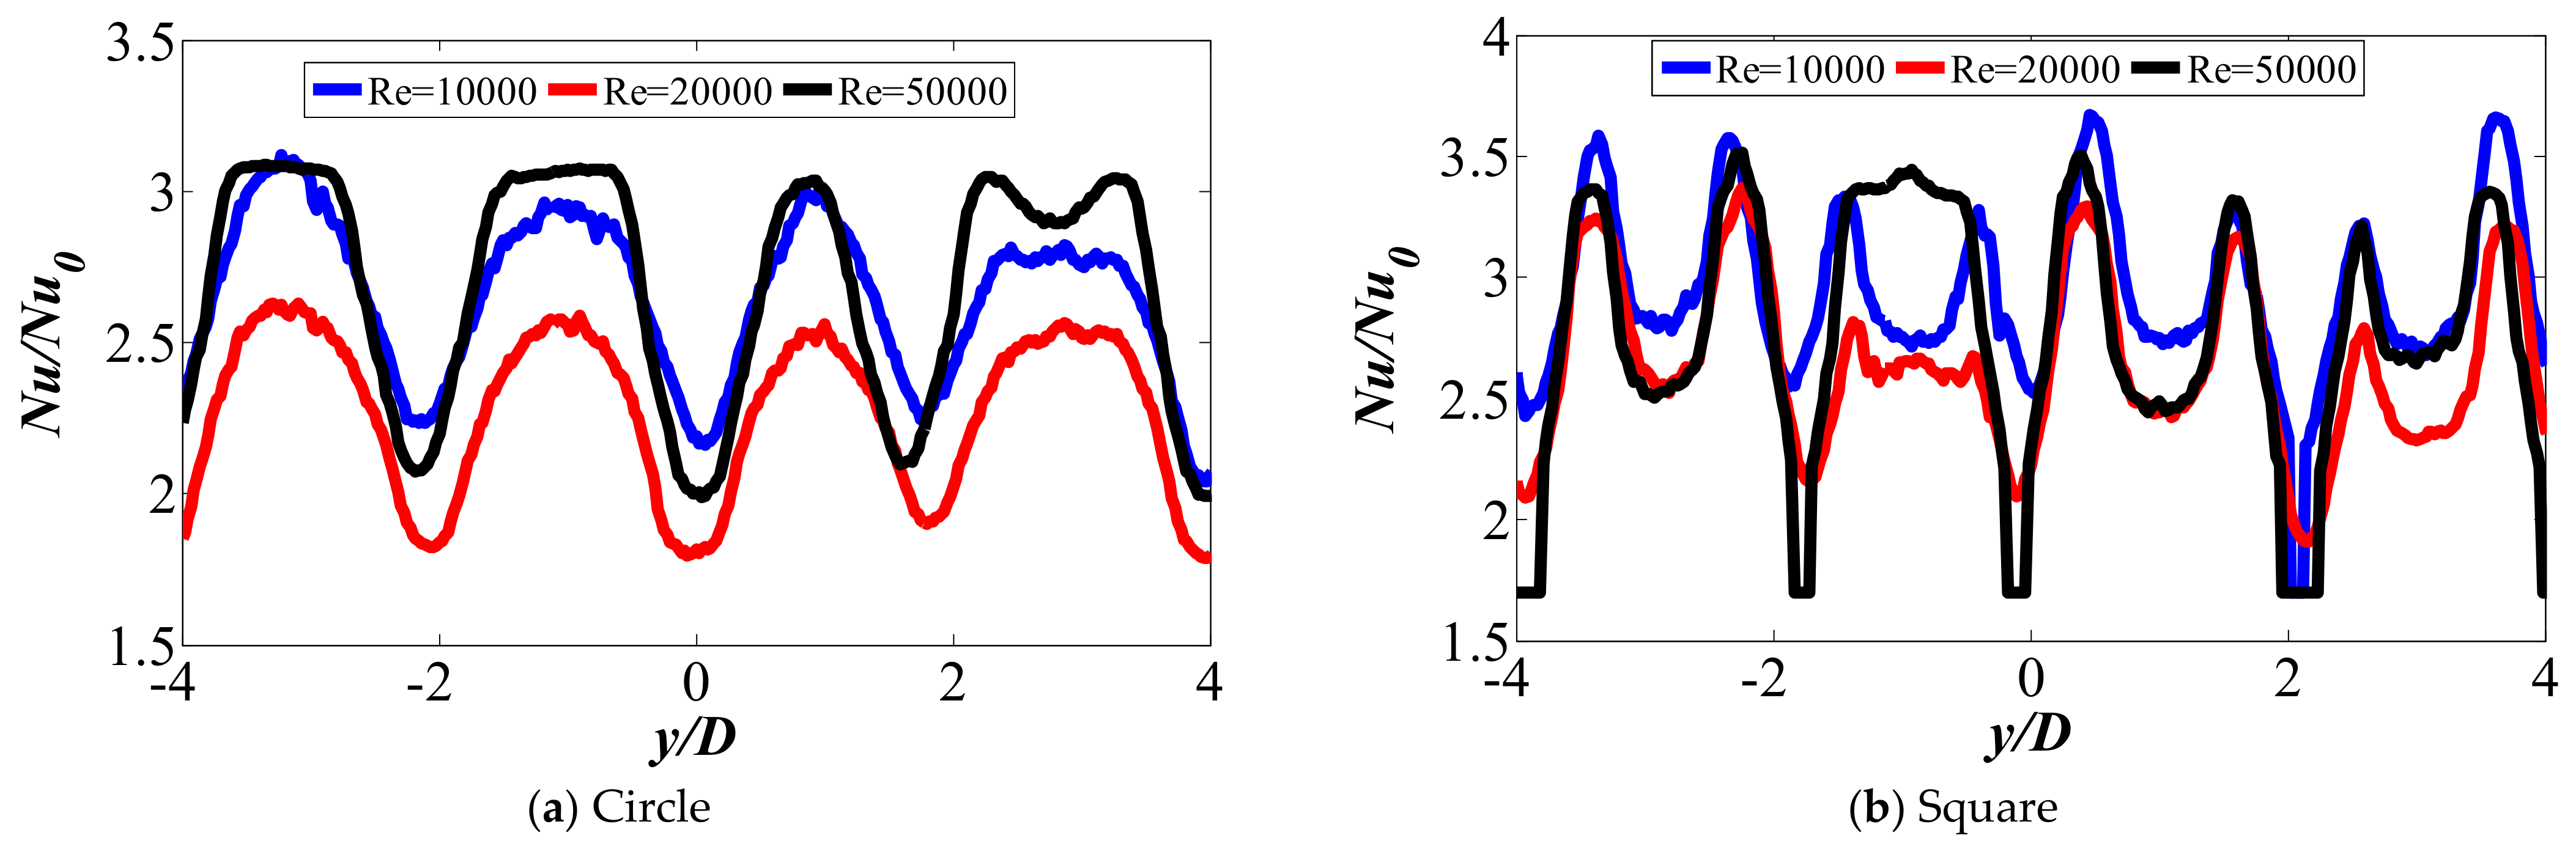
5.1.4. Effect of Re on Nu Distribution

Figure 9 indicates the local distribution of Nu/Nu0 at Re = 50,000 for all nine shapes. By comparing Figure 6 with Figure 9, it can be seen that, with the increase in Re, heat transfer enhancements of pin fins are decreased for all shapes studied. Additionally, for some pin fin shapes, the characteristics of Nu distribution change with the increase in Re, which means that the flow structures driving heat transfer enhancement vary with Re. Meanwhile, the phenomenon where flow and heat transfer are fully developed downstream the 3rd row is more obvious.
For quadrangle shapes, the shapes of Nu distribution contour do not change much, only their values. However, for roundness shapes, the change is apparent. For the Circle pin fin, the downstream high-heat-transfer regions become closer to the upstream pin fins. This conclusion shows a good agreement with previous studies [27,28]. Moreover, the area of high-heat-transfer regions downstream pin fin rows is much smaller at a high Re. In Figure 9, the high Nu regions of the Circle pin fin only occupy about half the area between the two rows. This means that the size of shedding vortex responsible for this local heat transfer enhancement becomes smaller with the increase in Re. For the Ellipse and Oblong shapes, the high Nu regions are away from downstream rows, unlike in Figure 6, when there is low Re. The recirculation region shrank, as well as the low Nu regions.
The heat transfer distribution around a single pin fin in Row 1 is also shown in Figure 10 for all nine shapes. By comparing Figure 7 with Figure 10, it can clearly be seen that high Nu regions upstream pin fins are not apparent, nor have they disappeared. For the Circle pin fin, the slender high-heat-transfer region also does not remain for a long time. This indicates that the horseshoe vortex becomes weak or even disappears when Re increases. Meanwhile, for Circle pin fins, the border between the low- and high-heat-transfer region changes from flat to curved, and looks more like that downstream quadrangle-shape pin fin. This means that heat transfer on both sides in the shear layer regions is growing stronger, which indicates that the shear layer unsteadiness contributes more to heat transfer enhancement for Circle pin fins as Re increases. For streamline shapes, the high Nu regions on both sides, in the shear layer and downstream, become more clearly separated as Re increases. Our high-space-resolution measurement makes it possible to locate the shear layer on both sides, along with the corresponding high Nu regions for streamline pin fins. This verifies that small-scale shear layer unsteadiness is the main flow mechanism driving heat transfer enhancement in this situation. For quadrangle shapes, high Nu regions on the sides and downstream connect, which means that small-scale unsteadiness in shear layer and large-scale fluctuation downstream are equally important for heat transfer enhancement. However, if we examine Nu distribution for Square pin fins in Figure 6 and Figure 9, it becomes easy to find the shrink in the downstream high Nu region and enlargement of high Nu region in the shear layer. It is reasonable to believe that small-scale unsteadiness in the shear layer is becomes more important for heat transfer enhancement as Re increases for all shapes.
The spanwise heat transfer distributions at x/D = 1 are shown in Figure 11 for Circle and Square pin fin at different Reynolds numbers. For Square pin fin, the distribution of Nu along y direction does not change much as Re increases, with peaks on both sides of pin fins in the shear layer regions and valleys downstream of pin fins. However, for the Circle pin fin, Nu has peaks downstream of pin fins for low Re. As Re increases to 50,000, Nu on both sides starts to increase. This verifies our previous discussion about small-scale unsteadiness in the shear layer, and its increasing importance for heat transfer enhancement as Re increases.

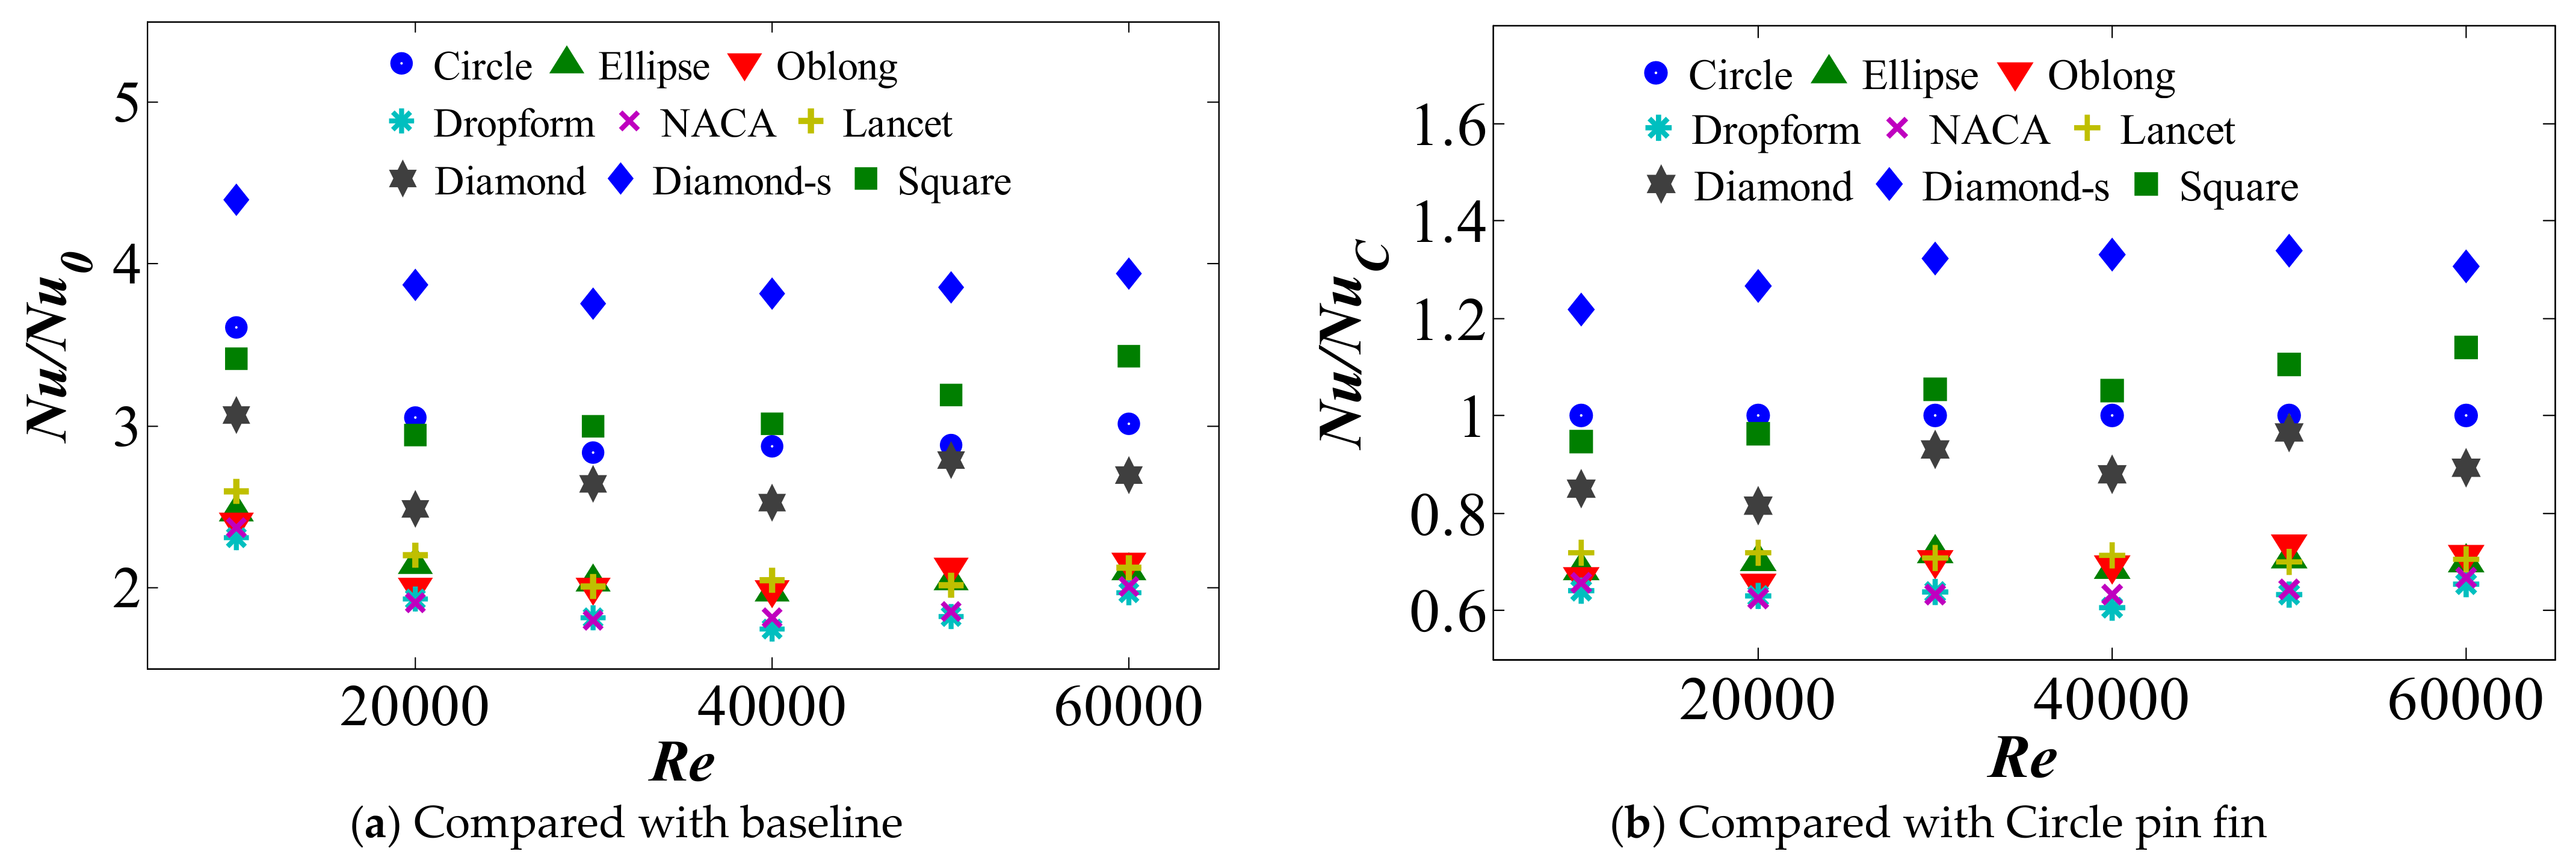
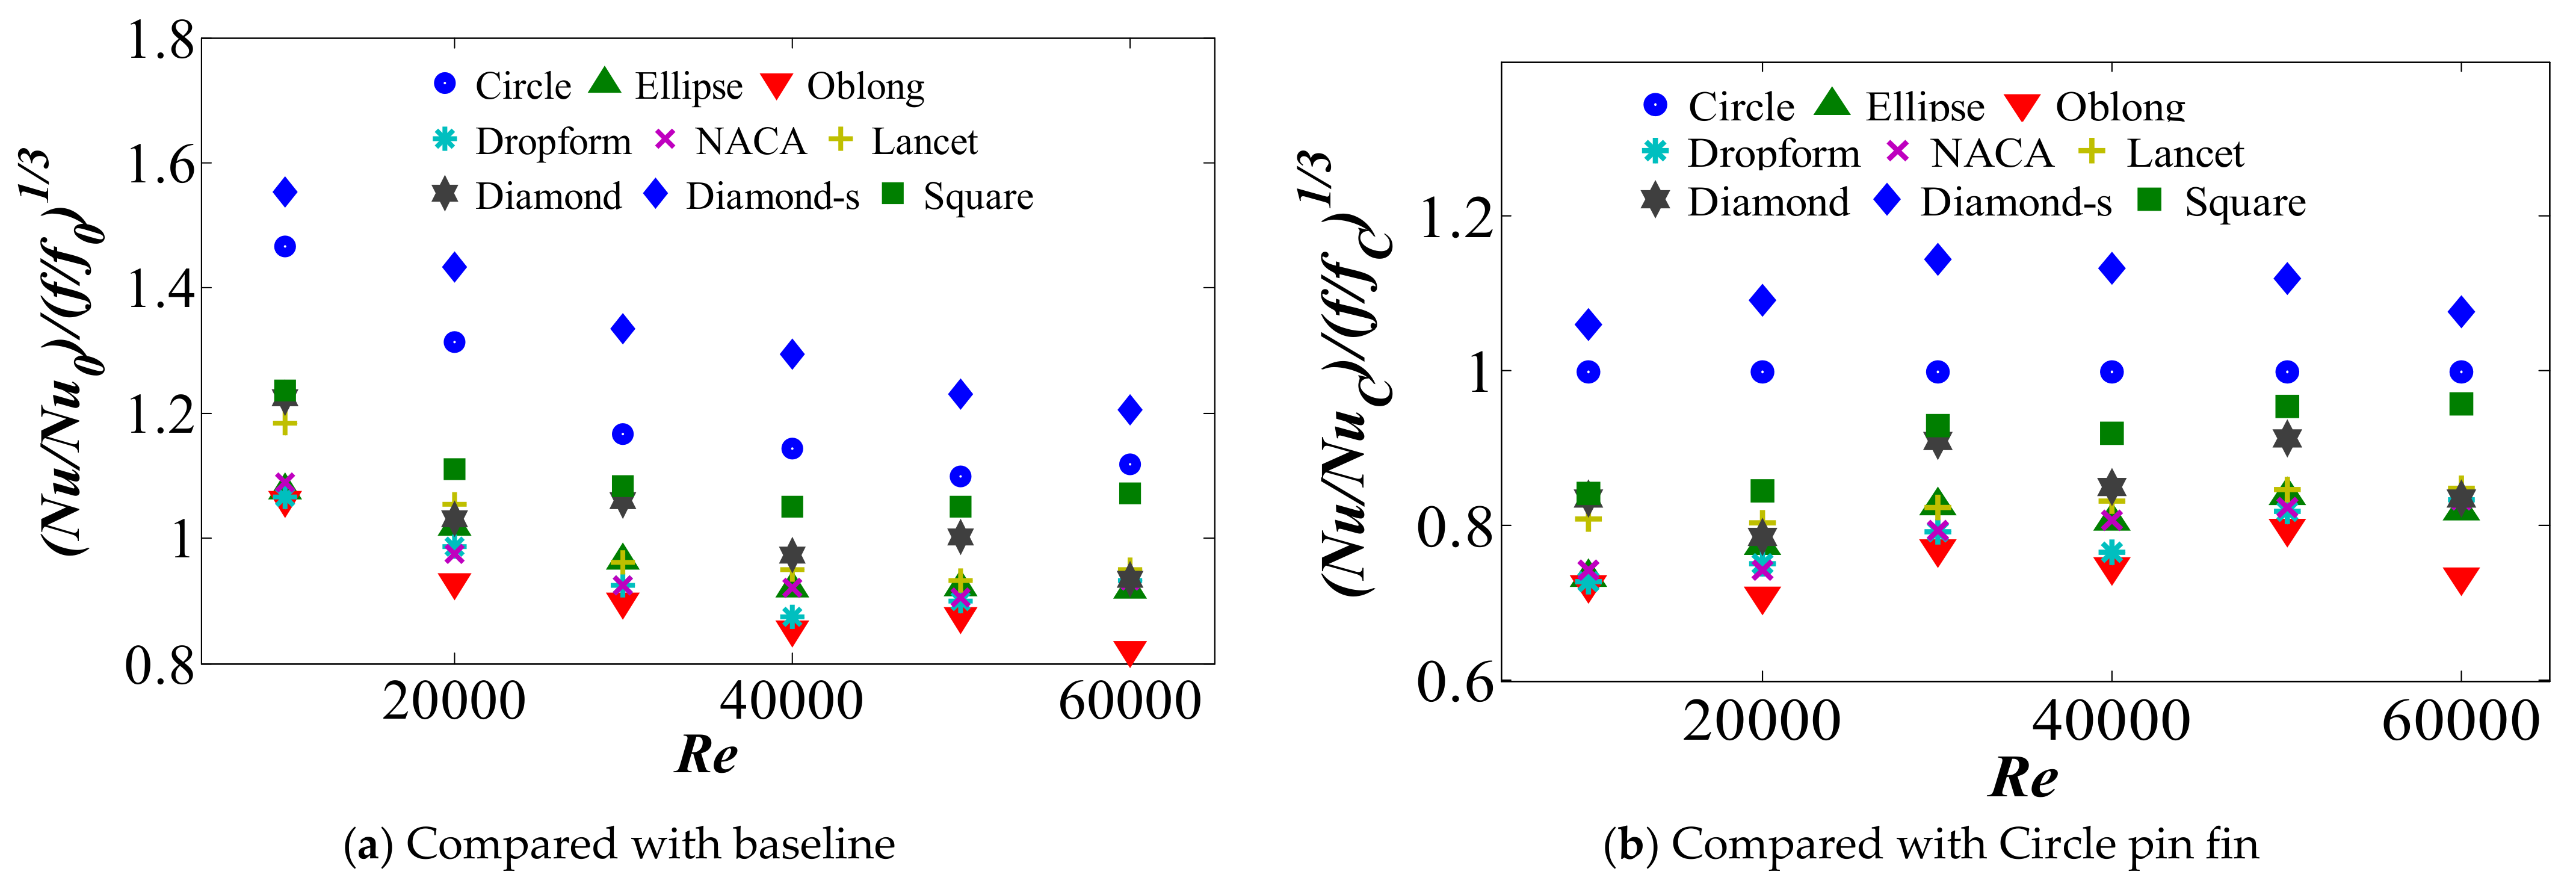
5.2. Averaged Heat Transfer on the Endwall and Overall Thermal Performance

Figure 12a depicts the average heat transfer enhancement (Nu/Nu0) of all the pin fins. The Nu-averaged region is chosen from the fully developed region downstream Row 3 (the black frame region in Figure 9). It can be clearly seen that the heat transfer enhancement decreases when Re increases from 10,000 to 30,000. After that, the Nu/Nu0 values of all nine pin fins become almost constant when Re > 30,000. A comparison of eight sets of pin fins with Circle pin fin (Nu/NuC) is also shown in Figure 12b.
The heat transfer enhancement of quadrangle shape is the highest. The heat transfer augmentation values of Diamond-s and Square pin fins are top two pin fin arrays. They are about 30% and 10% higher than that of the Circle pin fin, respectively. The roundness shape is in the middle level of these three shape types, but the Circle pin fin is outstanding. This is not only much better than Ellipse and Oblong, but also 10% higher than the Diamond pin fin. The heat transfer augmentation of the streamline shapes is almost at its lowest in all sets. However, the Lancet pin fin is clearly better than Dropform and NACA. At some Re rates, it is even a little better than Ellipse and Oblong pin fins.
A comparison of the friction factors of different pin fins is shown in Figure 13. The baseline is the experiment data of the smooth channel. The friction factor is as important as Nu. Generally, a larger heat transfer enhancement always accompanies a high pressure drop. The friction factors of Diamond-s and Square are about 60% and 50% higher than that of the Circle pin fin. Regarding Dropform and NACA, their values are only half of the Circle pin fin. The higher-pressure drop will require a higher pumping power. The aim is to obtain a better heat transfer enhancement with a lower pressure cost. By comparing Figure 12 and Figure 13, it can be seen that large Nusselt numbers correspond to large friction factors. However, there are some special cases. The pressure loss of Circle pin fins is lower than that of Diamond pin fins, but its heat transfer augmentation is higher than that for Diamond. Similarly, the Nusselt numbers of Oblong and Lancet are quite close, but Lancet has lower friction factors.
The overall thermal performances of all nine pin fin shapes are shown in Figure 14. The overall thermal performance is defined as (Nu/Nu0)/(f/f0)1/3, which is introduced by Gee and Webb [29]. This is a non-dimensional parameter that could represent the heat transfer enhancement for the cost of pressure loss. The overall thermal performance declines with the increase in Reynolds number. The traditional Circle pin fin is the second best in this experiment. This demonstrates that this widely used shape is reasonable. Although it is not the best, the casting technique is mature enough to form circle pin fins in gas turbine airfoil. Expecting the Circle pin fin, the other two roundness shapes are not good enough. The overall thermal performance of Oblong is the worst. Although the Diamond-s pin fins have the highest Nusselt numbers and friction factors, in terms of overall thermal performance, they are still the best of all the pin fins. If Diamond-s shape can be manufactured well, it is a promising alternative cross-section to Circle pin fins. Its Nusselt numbers and overall thermal performance are more than 20% higher than those of Circle the pin fins. The overall thermal performances of the streamline shapes are only better than that of Ellipse and Oblong. If the pressure drop needs to be controlled at a low level, Lancet shape is a good option. Its pressure loss is close to other streamline-shape pin fins, but it can achieve a much higher heat transfer enhancement and thermal performance than other streamline shapes.

6. Conclusions

This paper is focused on the heat transfer distribution and friction factor characteristics of different pin fin shapes. Nine shapes are involved, and the experiment is conducted under different Re rates. The local distribution of Nu is obtained with a high space resolution. This could reflect heat transfer and the related flow mechanism around pin fin arrays with different shapes. The averaged results are also compared. Overall, several conclusions can be drawn from this study:
(1)
For the nine types of pin fins tested in the experiment, the flow and heat transfer are generally fully developed downstream the 3rd row. Heat transfer varies substantially with pin fin shapes. The heat transfer enhancement of Diamond-s is the highest, while that of Circle pin fin is the second highest, and that of NACA and Dropform is the lowest. Overall, the heat transfer enhancement of quadrangle shape is the highest, the roundness shape is in the middle and that of the streamline shape is the lowest.
(2)
The characteristics of Nusselt number distribution and related flow mechanism varies substantially with pin fin shapes. At a low Re, for roundness shapes, dominant heat transfer enhancement downstream of the pin fin is caused by large vortex shedding and the related cross-stream velocity fluctuations. For quadrangle and streamline shapes, shear layer unsteadiness on both sides plays a more important role in heat transfer enhancement. The shear layer unsteadiness contributes more to heat transfer enhancement for Circle pin fins as Re increases. Small-scale unsteadiness in the shear layer becomes more important to heat transfer enhancement as Re increases for all shapes.
(3)
Large Nusselt numbers correspond to high friction factors. Although Diamond-s pin fin has both the highest Nusselt numbers and friction factors, in terms of overall thermal performance, it is still the best of all the pin fins. The pressure loss of Circle pin fins is lower than Diamond pin fins, but its heat transfer augmentation is higher than Diamond.

Author Contributions

Data curation, J.D.; Formal analysis, J.X.; Funding acquisition, J.L. and J.W.; Investigation, J.X. and J.D.; Supervision, J.W.; Writing—original draft, J.X.; Writing—review & editing, K.Z., J.L. and J.W. All authors have read and agreed to the published version of the manuscript.

Funding

This research was funded by National Natural Science Foundation of China.

Acknowledgments

The work is supported by the National Natural Science Foundation of China (51776153, 52076167) and the National Science and Technology Major Project (2017-III-0003-0027).

Conflicts of Interest

The authors declare no conflict of interest.

Nomenclature

Dnpin fin nominal diameter
Dhchannel hydraulic diameter [4 H*W/2(H+W)]
ffriction factor
f0baseline friction factor
fCfriction factor of Circle pin fin
hheat transfer coefficient
Hpin fin or channel height
kthermal conductivity of air
kPlexithermal conductivity of Plexiglass
lpin fin length
Ltest channel length
ΔPpressure drop
qcondconduction heat flux
qconvconvection heat flux
qtotaltotal input power
qradradiation heat flux
Sspanwise pitch
ththickness of the foil heater
tPlexithickness of the Plexiglass plate that supports the steel plate
Tbbulk temperature
Textexternal wall temperature
Thfoil heater temperature
Tininlet plane temperature
Toutoutlet plane temperature
Tptemperature of the surrounding non-heated wall
Twtest surface temperature
ubulk velocity
Xstreamwise pitch
NuNusselt number
Nu0baseline Nusselt number
NuCNusselt number of Circle pin fin
Wchannel weight
PrPrandtl number
ReReynolds number
εwliquid crystal emissivity
εpnon-heated wall emissivity
νkinematic viscosity
ρfluid density
σStefan–Boltzmann constant.

References

  1. Han, J.-C.; Dutta, S.; Ekkad, S. Gas Turbine Heat Transfer and Cooling Technology, 2nd ed.; CRC Press: New York, NY, USA, 2012. [Google Scholar] [CrossRef]
  2. Han, J.-C. Advanced Cooling in Gas Turbines 2016 Max Jakob Memorial Award Paper. J. Heat Transf. 2018, 140. [Google Scholar] [CrossRef]
  3. Rao, Y.; Xu, Y.; Wan, C. An experimental and numerical study of flow and heat transfer in channels with pin fin-dimple and pin fin arrays. Exp. Therm. Fluid Sci. 2012, 38, 237–247. [Google Scholar] [CrossRef]
  4. Ma, Y.; Yan, H.; Hooman, K.; Xie, G. Enhanced heat transfer in a pyramidal lattice sandwich panel by introducing pin-fins/protrusions/dimples. Int. J. Therm. Sci. 2020, 156, 106468. [Google Scholar] [CrossRef]
  5. Chang, S.W.; Lees, A. Endwall heat transfer and pressure drop in scale-roughened pin-fin channels. Int. J. Therm. Sci. 2010, 49, 702–713. [Google Scholar] [CrossRef]
  6. Xie, G.; Sundén, B.; Utriainen, E.; Wang, L. Computational analysis of pin-fin arrays effects on internal heat transfer enhance-ment of a blade tip wall. J. Heat Transf. 2010, 132, 031901. [Google Scholar] [CrossRef]
  7. Rao, Y. Jet Impingement Heat Transfer in Narrow Channels with Different Pin Fin Configurations on Target Surfaces. J. Heat Transf. 2018, 140, 072201. [Google Scholar] [CrossRef]
  8. Huang, S.-C.; Wang, C.-C.; Liu, Y.-H. Heat transfer measurement in a rotating cooling channel with staggered and inline pin-fin arrays using liquid crystal and stroboscopy. Int. J. Heat Mass Transf. 2017, 115, 364–376. [Google Scholar] [CrossRef]
  9. Lawson, S.A.; Thrift, A.A.; Thole, K.; Kohli, A. Heat transfer from multiple row arrays of low aspect ratio pin fins. Int. J. Heat Mass Transf. 2011, 54, 4099–4109. [Google Scholar] [CrossRef] [Green Version]
  10. Lyall, M.E.; Thrift, A.A.; Thole, K.; Kohli, A. Heat Transfer from Low Aspect Ratio Pin Fins. J. Turbomach. 2011, 133, 011001. [Google Scholar] [CrossRef] [Green Version]
  11. Lau, S.C.; Kim, Y.S.; Han, J.C. Effects of Fin Configuration and Entrance Length on Local Endwall Heat/Mass Transfer in a Pin Fin Channel. In Turbo Expo: Power for Land, Sea, and Air; ASME Paper; 85-WA/HT-62; American Society of Mechanical Engineers: Houston, TX, USA, 1985. [Google Scholar]
  12. Armstrong, J.; Winstanley, D. A Review of Staggered Array Pin Fin Heat Transfer for Turbine Cooling Applications. J. Turbomach. 1988, 110, 94–103. [Google Scholar] [CrossRef]
  13. Chyu, M.K.; Siw, S.C.; Moon, H.K. Effects of Height-to-Diameter Ratio of Pin Element on Heat Transfer from Staggeredpin-Fin Arrays. In Turbo Expo: Power for Land, Sea, and Air; American Society of Mechanical Engineers: Orlando, FL, USA, 2009; pp. 705–713. [Google Scholar]
  14. Chang, S.W.; Liou, T.-M.; Lee, T.-H. Heat Transfer of a Rotating Rectangular Channel with a Diamond-Shaped Pin-Fin Array at High Rotation Numbers. J. Turbomach. 2013, 135, 041007. [Google Scholar] [CrossRef]
  15. Pandit, J.; Thompson, M.; Ekkad, S.V.; Huxtable, S.T. Effect of pin fin to channel height ratio and pin fin geometry on heat transfer performance for flow in rectangular channels. Int. J. Heat Mass Transf. 2014, 77, 359–368. [Google Scholar] [CrossRef]
  16. Kirsch, K.L.; Ostanek, J.K.; Thole, K.A. Comparison of Pin Surface Heat Transfer in Arrays of Oblong and Cylindrical Pin Fins. J. Turbomach. 2013, 136, 041015. [Google Scholar] [CrossRef]
  17. Uzol, O.; Camci, C. Elliptical Pin Fins as an Alternative to Circular Pin Fins for Gas Turbine Blade Cooling Applications: Part 1—Endwall Heat Transfer and Total Pressure Loss Characteristics. In Turbo Expo: Power for Land, Sea, and Air; American Society of Mechanical Engineers: New Orleans, LA, USA, 2001; p. V003T01A056. [Google Scholar] [CrossRef] [Green Version]
  18. Sahiti, N.; Lemouedda, A.; Stojkovic, D.; Durst, F.; Franz, E. Performance comparison of pin fin in-duct flow arrays with vari-ous pin cross-sections. Appl. Therm. Eng. 2006, 26, 1176–1192. [Google Scholar] [CrossRef]
  19. Jia, Y.; Xia, G.; Li, Y.; Ma, D.; Cai, B. Heat transfer and fluid flow characteristics of combined microchannel with cone-shaped micro pin fins. Int. Commun. Heat Mass Transf. 2018, 92, 78–89. [Google Scholar] [CrossRef]
  20. Kirsch, K.; Thole, K.A. Pressure loss and heat transfer performance for additively and conventionally manufactured pin fin arrays. Int. J. Heat Mass Transf. 2017, 108, 2502–2513. [Google Scholar] [CrossRef] [Green Version]
  21. Zhang, L.; Yin, J.; Moon, H.K. Airfoil for Turbomachine and Airfoil Cooling Method. U.S. Patent 10,208,606, 19 February 2019. [Google Scholar]
  22. Jacobs, N.E. Tests of Six Symmetrical Airfoils in the Variable Density Wind Tunnel, NACA Report, Washington, USA, July, 1931, Volume 385. Available online: https://ntrs.nasa.gov/api/citations/19930081229/downloads/19930081229.pdf (accessed on 12 August 2021).
  23. Mayo, I.; Arts, T.; El-Habib, A.; Parres, B. Two-Dimensional Heat Transfer Distribution of a Rotating Ribbed Channel at Dif-ferent Reynolds Numbers. J. Turbomach. 2015, 137. [Google Scholar] [CrossRef]
  24. Kline, S.J.; McClintock, F. Describing Uncertainties in Single-Sample Experiments. Mech. Eng. 1953, 75, 3–8. [Google Scholar]
  25. Kirsch, K.L.; Ostanek, J.K.; Thole, K.A.; Kaufman, E. Row Removal Heat Transfer Study for Pin Fin Arrays. In Turbo Expo: Power for Land, Sea, and Air; American Society of Mechanical Engineers: New York, NY, USA, 2014; pp. 2014–25348. [Google Scholar] [CrossRef] [Green Version]
  26. Duan, J.; Zhang, K.; Xu, J.; Lei, J.; Wu, J. The Flow Field Characteristic Correlated with Heat Transfer Performance in a Wide Channel With Staggered Circular Pin Fins. In Turbo Expo: Power for Land, Sea, and Air; American Society of Mechanical Engineers: New York, NY, USA, 2020; pp. 2020–16177. [Google Scholar] [CrossRef]
  27. Ames, F.E.; Dvorak, L.A. The Influence of Reynolds Number and Row Position on Surface Pressure Distributions in Staggered Pin Fin Arrays. In Turbo Expo: Power for Land, Sea, and Air; American Society of Mechanical Engineers: New York, NY, USA, 2006; pp. 149–159. [Google Scholar] [CrossRef]
  28. Ostanek, J.K.; Thole, K.A. Flowfield Measurements in a Single Row of Low Aspect Ratio Pin Fins. J. Turbomach. 2012, 134, 051034. [Google Scholar] [CrossRef]
  29. Gee, D.L.; Webb, R.L. Forced convection heat transfer in helically rib-roughened tubes. Int. J. Heat Mass Transf. 1980, 23, 1127–1136. [Google Scholar] [CrossRef]
Figure 1. Sketch of heat transfer experimental facilities.
Crystals 11 00977 g001
Figure 2. Pin fin sets.
Crystals 11 00977 g002
Figure 3. Comparison of baseline Nu0 with empirical data.
Crystals 11 00977 g003
Figure 4. Comparison of baseline f0 with empirical data.
Crystals 11 00977 g004
Figure 5. Local distribution of Nu/Nu0 for Circle pin fins, Re = 10,000.
Crystals 11 00977 g005
Figure 6. Local distribution of Nu/Nu0 on endwall with nine different pin fins, Re = 10,000.
Crystals 11 00977 g006
Figure 7. Nu/Nu0 distribution comparison, Row1, Re = 10,000.
Crystals 11 00977 g007
Figure 8. Laterally averaged heat transfer enhancement comparison at Re = 10,000.
Crystals 11 00977 g008
Figure 9. Local distribution of Nu/Nu0 on endwall with nine different pin fins, Re = 50,000.
Crystals 11 00977 g009
Figure 10. Nu/Nu0 distribution comparison, Row1, Re = 50,000.
Crystals 11 00977 g010
Figure 11. Spanwise heat transfer enhancement of Circle and Square pin fin at x/D = 1.
Crystals 11 00977 g011
Figure 12. Heat transfer enhancement of different pin fins.
Crystals 11 00977 g012
Figure 13. Friction factor comparison of different pin fins.
Crystals 11 00977 g013
Figure 14. Overall thermal performance comparison.
Crystals 11 00977 g014
Publisher’s Note: MDPI stays neutral with regard to jurisdictional claims in published maps and institutional affiliations.

