Article

Interfacial Stabilities, Electronic Properties and Interfacial Fracture Mechanism of 6H-SiC Reinforced Copper Matrix Studied by the First Principles Method

1
Institute of New Materials, Guangdong Academy of Sciences, Guangzhou 510651, China
2
Guangdong Provincial Key Laboratory of Metal Toughening Technology and Application, Guangzhou 510651, China
3
Key Laboratory of Cluster Science of Ministry of Education, Beijing Institute of Technology, School of Chemistry and Chemical Engineering, Beijing 100081, China
4
School of Chemistry and Environmental Engineering, Sichuan University of Science and Engineering, Zigong 643000, China
*
Authors to whom correspondence should be addressed.
Crystals 2022, 12(1), 51; https://doi.org/10.3390/cryst12010051
Submission received: 29 November 2021 / Revised: 25 December 2021 / Accepted: 27 December 2021 / Published: 30 December 2021

Abstract

:
The interfacial mechanics and electrical properties of SiC reinforced copper matrix composites were studied via the first principles method. The work of adhesion (Wad) and the interfacial energies were calculated to evaluate the stabilities of the SiC/Cu interfacial models. The carbon terminated (CT)-SiC/Cu interfaces were predicted to be more stable than those of the silicon terminated (ST)-SiC/Cu from the results of the Wad and interfacial energies. The interfacial electron properties of SiC/Cu were studied via charge density distribution, charge density difference, electron localized functions and partial density of the state. Covalent C–Cu bonds were formed based on the results of electron properties, which further explained the fact that the interfaces of the CT-SiC/Cu are more stable than those of the ST-SiC/Cu. The interfacial mechanics of the SiC/Cu were investigated via the interfacial fracture toughness and ultimate tensile stress, and the results indicate that both CT- and ST-SiC/Cu interfaces are hard to fracture. The ultimate tensile stress of the CT-SiC/Cu is nearly 23 GPa, which is smaller than those of the ST-SiC/Cu of 25 GPa. The strains corresponding to their ultimate tensile stresses of the CT- and ST-SiC/Cu are about 0.28 and 0.26, respectively. The higher strains of CT-SiC/Cu indicate their stronger plastic properties on the interfaces of the composites.

1. Introduction

Copper metal composites have been extensively utilized in electronic technology [1], transportation [2] and aerospace fields [3]. Although copper metal composites have high electrical conductivity, their lesser hardness and strength limit their further applications. Therefore, copper alloy and copper matrix composites (CMCs) have been designed to improve their hardness and strength properties. However, as the reinforcement phase has been introduced into the Cu matrix, the hardness and strength of the coper materials have been enhanced [4,5]. Moreover, the reinforcements are the key factor enhancing the mechanical properties for the CMCs without serious loss of the thermal and electrical properties of the matrix. To date, reinforced phases including many types of ceramic materials, such as carbides (TiC and WC) [6,7], oxides (Al2O3, Y2O3) [8,9], and ceramics (Ti3AlC2, AlN) [10,11] have been employed to enhance the hardness and strength of the CMCs. Besides the ceramics discussed above, iron [12] and steel [13,14] have been applied as reinforcements for the copper matrix, not only for their high strength but also for the availability and low cost of the iron powder and iron-based materials. Nevertheless, carbon materials such as diamond [15], graphite [16], carbon nanotubes (CNTs) [17] and graphene nano-sheets (GNSs) [18] have been developed as reinforcements. Because of the expensive price of CNTs, diamond and GNSs, and the poor machinability of diamond and carbon materials, these carbon materials are still limited in the application as reinforcements.
Among these reinforcements, SiC is a potential and premium reinforcement for the Cu matrix due to their special properties, which include great hardness and high strength, excellent resistance during oxidation and corrosion, a low coefficient of thermal expansion and high heating transfer capabilities [19,20]. SiC/Cu composites have aroused interest in their properties for improving, electrical [21] and thermal conductivity [22], hardness [23], wear resistance [24], and frictional properties [25,26]. However, many experiments studied on SiC/Cu composites by adding the different content of SiC into the matrix copper. For example, Nalin Somani et al. found that wear resistance capacity was enhanced, and the coefficient of friction was reduced in SiC/Cu, mainly due to the reinforcement by SiC [27]. Rado, et al. found that the Si atom diffuses into the copper matrix and a layer of carbon forms to stop interfacial bonding [28]. According to Jarząbek et al., SiC decomposed to Si and C in contact with copper during the sintering process [29]. Zhang, L. et al. studied SiCp reinforced copper alloy composites, and found that CuSi5, CuSi3 and C were formed in the interfacial reactions; the products were confirmed by XRD tests [30]. Chen, G.Q. et al. found that layered interfacial products consisted of SiC particles, a Cu-Si layer, a polycrystalline C layer and the Cu-Si matrix, but no CuSi3 product was detected in these reacted regions [31]. Strojny-Nędza A, et al. studied SiC/Cu composites using spark plasma sintering, and Cu-SiC-Cu systems were obtained after processing. They found that the copper reacts with the silicon carbide (6H-SiC type) during the process of annealing at high temperature [32]. According to the above, SiC/Cu interfacial investigations are crucial to the properties of the SiC/Cu composites.
In addition to the experiential investigation of the SiC/Cu composites, many theoretical studies have been performed on SiC/Cu composites by molecular dynamics. Zhou Y.G. et al. studied the mechanical behaviors of nanocrystalline SiC/Cu composites via molecular dynamics (MD) simulations and found that high strength and acceptable plasticity of metal matrix composites (MMC) could be obtained by adding a reinforcement to work at the nanoscale [33]. Xiong, Y.N. et al. studied defects generated by cooling of SiC/Cu composites by molecular dynamics and found that during cooling from a higher temperature the magnitudes of thermal residual stresses are higher, and more defects appear in the metal matrix [34]. Much research has studied the interfaces and interfacial electronic properties, via first principles, of TiC/Cu [35], TiB2/Cu [36] and WC/Cu [37] copper matrix composites. The microelectronic properties of the interfacial atoms of SiC/Cu have not been studied by the first principles method. The mechanism of the SiC reinforced Cu matrix at the micro level, especially for electron properties, are not clear.
Hexagonal polytopes (4H and 6H-SiC) are used [38] due to their unique material properties, such as high breakdown voltages, low leakage currents, large thermal conductivities and so on [39]. 6H-SiC has anisotropy of the more than 4.5 electron Hall mobility factor at the normal temperature [40]. Therefore, due to the high electron Hall mobility and premium properties of 6H-SiC, we choose silicon carbide (6H-SiC) as our reinforcement for copper matrix composites.
In this theoretical study, interfacial properties such as interfacial interaction, stabilities of the heterogeneous interface of the SiC/Cu matrix composites were studied via the first principles method. Moreover, according to the interfacial properties of SiC/Cu, the work of adhesion, interfacial energies and ultimate tensile stress were also studied to determine interactions between the SiC particle phase and copper matrix.

2. Computational Details

To construct the 6H-SiC/Cu heterogeneous interfacial models, (0001) and (111) crystal surfaces were utilized to build the SiC, Cu slab and SiC/Cu composites models, respectively. The convergences of the Cu and SiC slabs were tested for acquiring suitable atomic layers to meet the interior features of SiC and Cu bulks. Moreover, along the c axis direction for the SiC and Cu surface slab, a 15 Å vacuum layer was added to eliminate the interactions between the surface atoms. In addition, for the sake of considering all possibilities of the SiC/Cu interfaces, different ways of stacking Cu, the interior structures of SiC and different atomic terminations (carbon terminated (CT) and silicon terminated (ST)) at the surfaces were involved. Therefore, there are 18 types of SiC/Cu models displayed in Figure 1. The stacking patterns of the Cu atoms in the Cu slabs, along with the SiC surface, i.e., “HCP”, “MT” and “OT” stacking patterns were involved, in which the “HCP” stacking pattern means the interfacial Cu atoms were placed on top of the first layer of SiC atoms; “MT” stacking means the interfacial Cu atoms reside on top of the connection midpoint of the first layer SiC atoms, and “OT” stacking means the interfacial Cu atoms reside on top of the second layer SiC atoms. Moreover, owing to the interior structure of the SiC, there are three different structurers connected with the interfacial Cu slab atoms, viz. “(a)” “(b)” and “(c)”. The “(a)” of the 6H-SiC refers to the interfacial atoms C or Si (terminated) residing atop the midpoint of the atomic connection of the first layer of Cu atoms; “(b)” is the inverse of structure “(a)”, and “(c)” means that the interfacial C or Si atoms are connected on top of the first layer of Cu atoms. In general, three different Cu stacking sequences (HCP, OT and MT), three combined modes of SiC ((a), (b) and (c)) and two terminated Si and C atoms of the SiC slab at the surfaces, were taken into account.
All calculations were based on the periodic boundary conditions and plane wave basis set carried out by the Cambridge Serial Total Energy Package Code (CASTEP) [41,42]. Perdew-Burker-Enzerhof (PBE) functional generalized gradient approximation (GGA) [43] was performed to manage the exchange-correlation interactions. Moreover, the Monkhorst-Pack k-point grid [44] 11 × 11 × 1 was sampled with the Brillouin zone for the SiC/Cu, Cu and SiC slab, respectively. The Broyden-Fletcher-Goldfarb-Shanno (BFGS) [45] algorithm was applied to relax the atomic structures to reach the ground state. An energy of 500 eV was chosen as the expansion in reciprocal space for cut-off energy of the plane wave. The total energy tolerance, maximum force tolerance and maximal displacement calculating convergent parameters were performed by 1.0 × 10⁻⁵ eV/atom, 0.03 eV/Å and 1.0 × 10⁻⁵ Å, respectively. Valence electrons of 3s23p2, 2s22p2 and 3s23p63d24s2 were considered for the Si, C and Cu atom pseudopotentials. In addition, for all 6H-SiC/Cu interfacial models, 18 atoms were included during the processing of calculations.

3. Results and Discussion

3.1. Bulk Properties

The fcc-Cu and 6H-SiC cells were optimized via the GGA-PBE method [46] to evaluate the proper parameters. Our calculated and reported cell parameters are listed in Table 1. 6H-SiC belongs to the P63mc space group and its cell parameters are a = b = 3.095 Å, c = 15.185 Å, α = β = 90°, γ = 120°, respectively. After optimization of the 6H-SiC cell, our calculated 6H-SiC cell parameters are a = b = 3.085 Å, c = 15.123 Å, α = β = 90°, γ = 120°; close to the reported values in Table 1.

3.2. The Convergent Tests of the 6H-SiC(0001) and Cu(111) Slab

The layer thickness was initially determined by testing the change of the layer distances, until optimization of SiC(0001) and the Cu(111) slab reached convergence at the proper atomic layers. On the one hand, the results of the calculation might be inaccurate if atomic layers were too low. On the other hand, much time and resources would be spent if the atomic layers were too large. Therefore, in order to acquire the approximate properties of the bulk for the slab interior, the proper atomic layers of the slabs need to be pretested initially. Δij is applied to determine the layer thickness of the slab as defined in Equation (1). In Equation (1), where d i j refers to the spacing between the neighboring i and j layers of the crystal before relaxation, and d i j is the spacing between the neighboring i and j layers after relaxation. The calculated convergent results are listed in Table 2, in which the CT and the ST of the 6H-SiC slabs achieved convergence with the tiny Δ i j values above 11 (for CT Δ 34 is −0.97%, for ST Δ 34 is −0.18%) SiC and 7 ( Δ 23 is 0.72%) Cu layer thickness.
Specifically, the calculated Δ i j values for all ST-6H-SiC layer thicknesses (most Δ i j are lower than absolute value |0.5%|) are much lower than those of the CT-6H-SiC layer thickness, which shows that the former are more inclined to be convergent than those of the latter. In addition, it can be seen that after 11 atomic layers of the ST-6H-SiC layer slab, the Δ i j values are gradually reduced and the properties of the interior layers tended to reach those of the bulk materials. Nevertheless, with a layer thickness of CT-6H-SiC above nine (for nine layer thickness their Δ 23 and Δ 34 are, respectively, 2.28% and −1.56%), the interior slab properties are similar to the properties of the 6H-SiC bulk, with subtle difference of the Δ i j values. A similar situation happens with the Cu(111) slab when the layer thickness is greater than seven. Therefore, eleven and seven atomic layer thicknesses of SiC and Cu were chosen to construct the SiC/Cu interfacial models.
Δ i j = d i j d i j d i j × 100 %

3.3. Interfacial and Surface Energy

3.3.1. 6H-SiC(0001) Surface Energy

Due to the hard directive detection of the 6H-SiC/Cu interfacial structure, simulative calculation is a useful method to analyze the interfacial structure details of the composites. The Si and C chemical potentials need to be considered when the 6H-SiC(0001) slab surface energies are studied, because of polarization of the SiC surfaces slab caused by these two types of atoms. As a result, the 6H-SiC(0001) surface plane can be divided into two components viz., the ST and CT surfaces. The surface energy ( γ s ) can be defined as:
γ s = ( E slab N Si μ Si slab N C μ C slab + P V T S ) / 2 A
where E slab refers to the total energy of the relaxed surface structure, μ Si slab and μ B slab represent the chemical potentials of Si and C atoms, N S i and N C are the number of the Si and C atoms in the corresponding slab, and A is the surface area of the interfacial model. Moreover, the pattern PV and TS can be neglected at the specific pressure and 0 K. When 6H-SiC bulk and SiC(0001) slabs were fully relaxed, they both reached the equilibrium state. In Equations (3) and (4), Δ H SiC stands for the heat formation of the bulk SiC, μ SiC bulk , μ SiC slab , μ Si bulk and μ C bulk refer to the chemical potential of the 6H-SiC bulk, SiC(0001) slab, Si bulk and C bulk, respectively. However, the Δ H SiC obtained in this study is −0.325 eV/until per cell. Equation (5) is acquired by substituting Equations (3) and (4) into Equation (2).
μ SiC slab = μ Si slab + μ C slab
μ SiC bulk = μ Ti bulk + μ C bulk + Δ H SiC
γ s = [ E slab N C μ SiC bulk + ( N C N Si ) μ Si bulk ] / 2 A
Because the chemical potential of each element in the bulk is lower than that in the slab, the difference of the chemical potential for each element ( Δ μ ) can be expressed by the following inequalities:
Δ μ Si = μ Si slab μ Si bulk 0
Δ μ C = μ C slab μ C bulk 0
Δ H SiC μ Ti slab μ Ti bulk 0
The ST and CT-6H-SiC(0001) surface energies were calculated over the entire range of Si chemical potentials. Compared with previous studies, our calculated 6H-SiC(0001) surface energies were, respectively, 2.553–2.878 J⋅m−2 (ST) and 7.367–7.692 J⋅m−2 (CT) (see in Figure 2), which are a little lower than the reported values of 3.22 J⋅m−2 (ST) and 7.82 J⋅m−2 (CT) [50]. In addition, the reported 4H-SiC(0001) surface values were 2.899–3.535 J⋅m−2 for Si-terminated and 7.783–8.426 J⋅m−2 [55] for C-terminated. Other reported results are 2.86–3.52 for Si-terminated and 7.92–8.59 for C-terminated [56], which are very close to our calculated results.

3.3.2. Surface Energy of Cu(111)

The surface energy of Cu(111) has been studied in many previous works, and values are displayed in Table 3. Compared with these surface energies, a Cu(111) surface energy of 1.39 J·m−2 was calculated in this work, which is close to the reported values of 1.32 J·m−2 [29], 1.36 J·m−2 [30] and 1.40 J·m−2 [57], but higher than the previously reported results (1.2 J·m−2 and 2.07 J·m−2) [29,58].

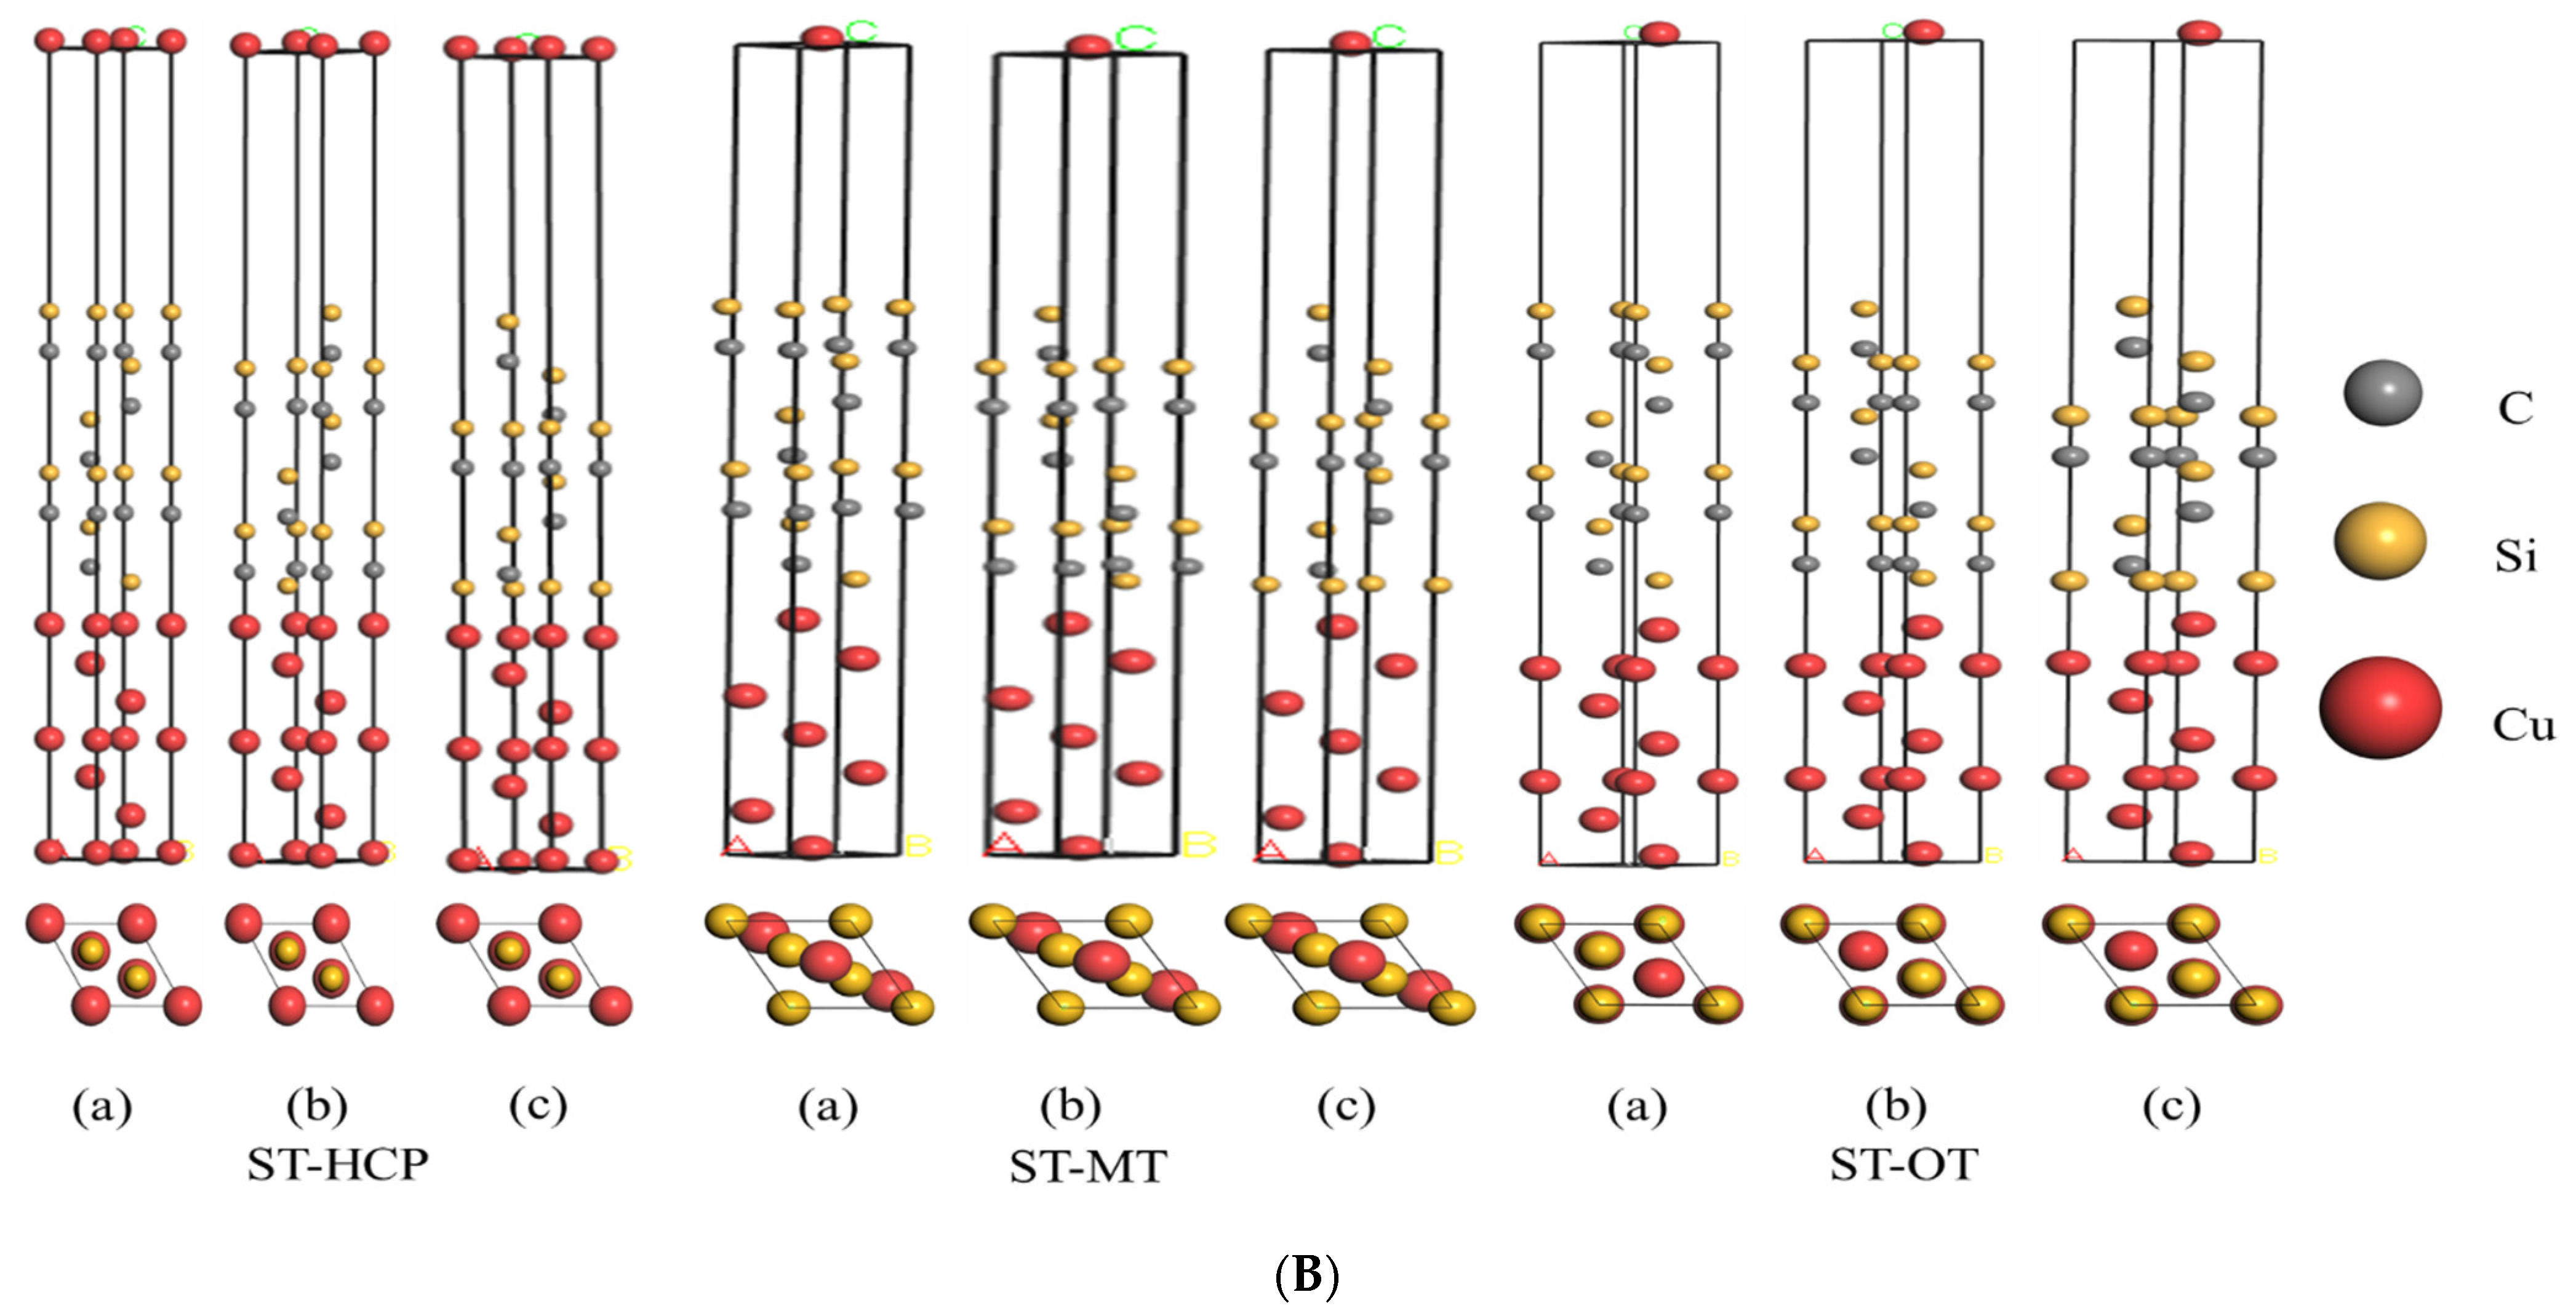
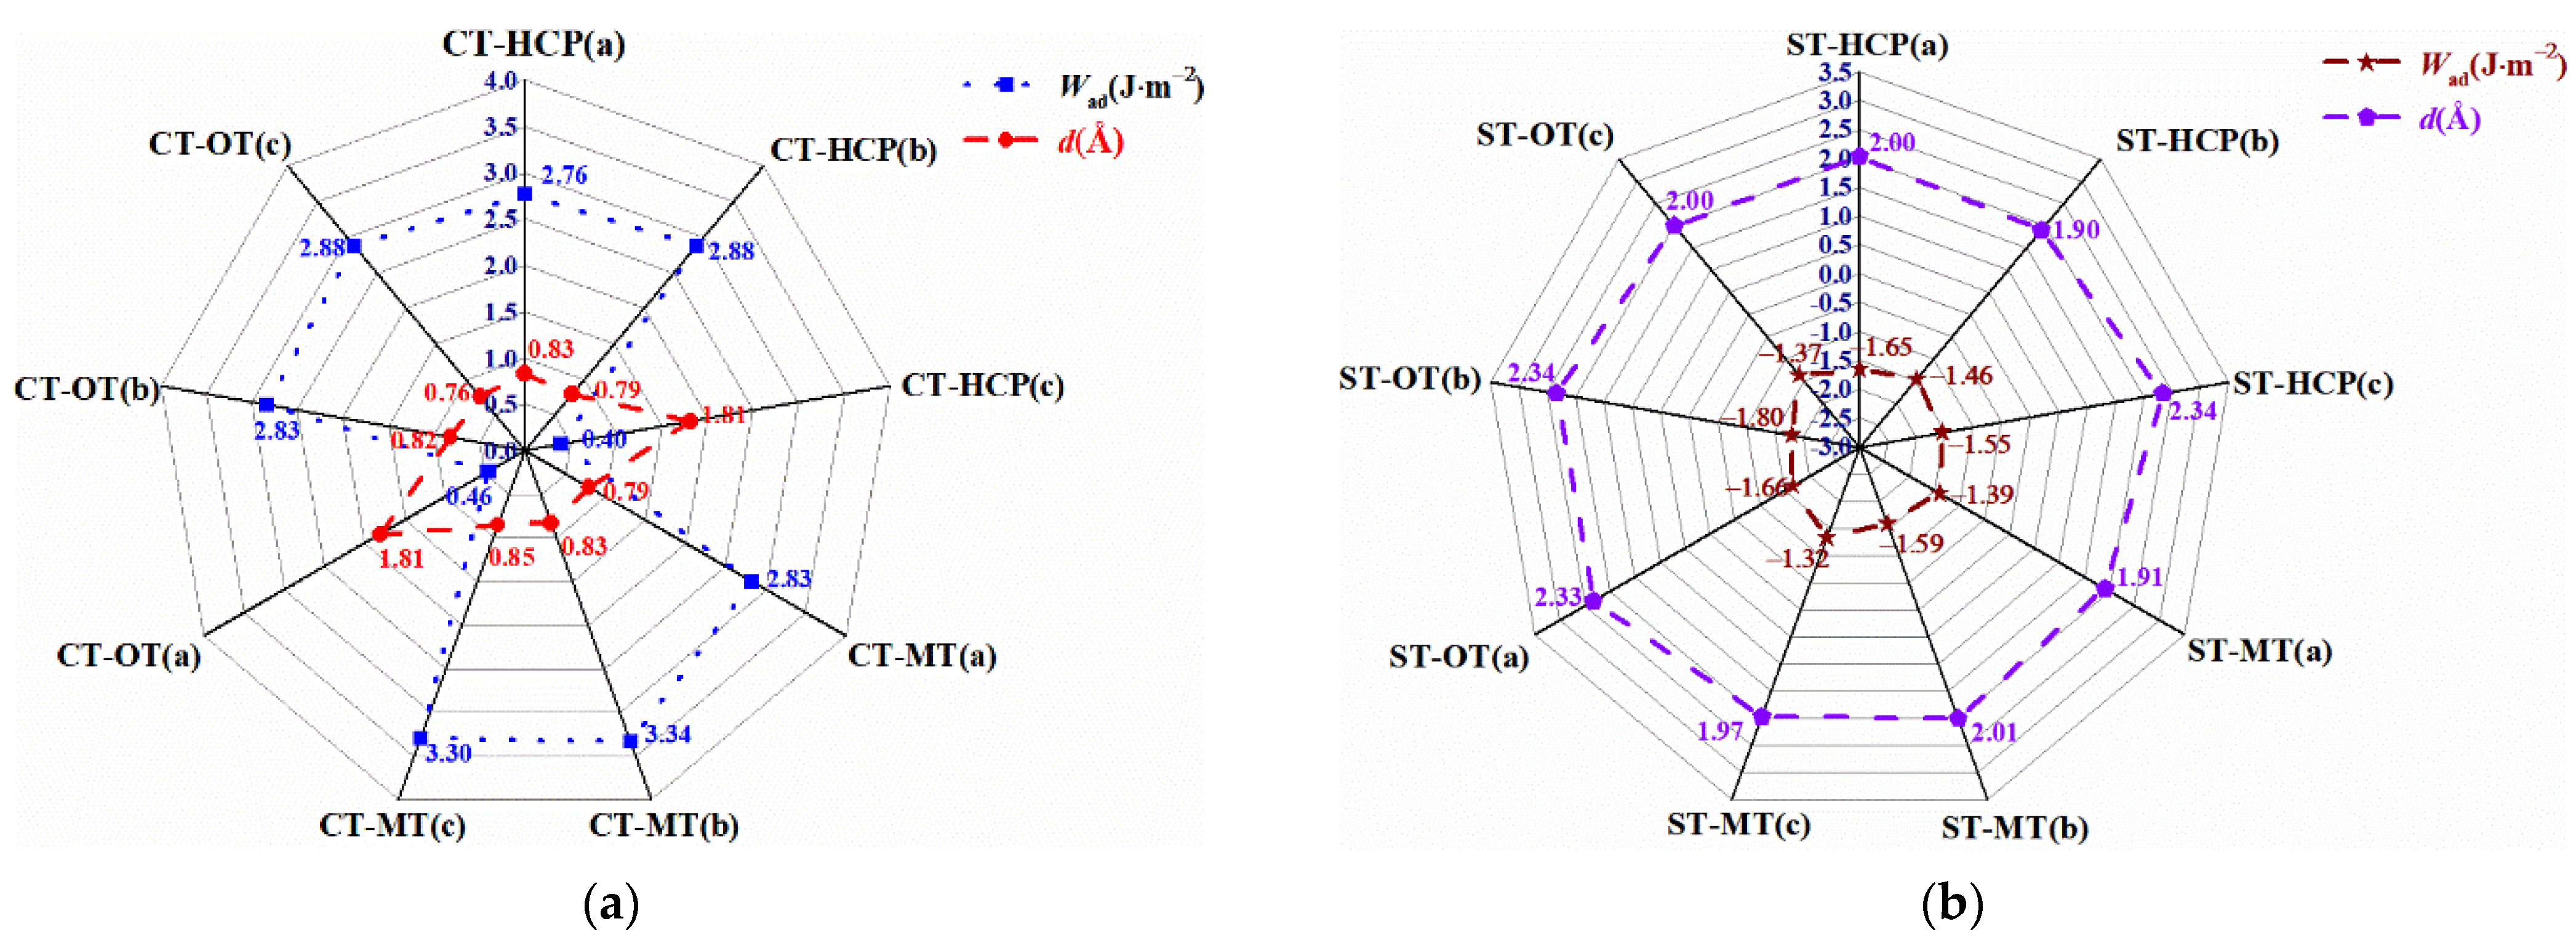
3.3.3. Work of Adhesion (Wad) and Interfacial Distance

The work of adhesion (Wad) was utilized to evaluate the stabilities of the heterogeneous interfaces, which can be expressed as the work of separation when heterogeneous interfaces are divided into the two free independent parts. 1Wad can be defined as:
W ad = ( E SiC / Cu total E SiC slab E Cu slab ) / A = ( E SiC slab + E Cu slab E Si / Cu total ) / A
where E Si / Cu total , E SiC slab and E Cu slab represent the total energy of the SiC(0001)/Cu(111) composites, the total energy of the relaxed individual separated SiC(0001) and Cu(111) slabs in identical supercells, respectively. A represents the area of the interfacial surface of the SiC(0001)/Cu(111) composites.
In Figure 3a, all Wad values are positive and vary from 0.4 J·m−2 to 3.34 J·m−2. Among the CT-6H-SiC(0001)/Cu(111) interfacial models, CT-MT(b) (3.34 J·m−2) and CT-HCP(c) (0.40 J·m−2) have the largest and the smallest Wad, while for other interfacial models, the Wad values are between these two extremes. The opposite situation occurred at the ST-6H-SiC(0001)/Cu(111) interfaces. In Figure 3b, Wad of the ST-6H-SiC(0001)/Cu(111) interfaces are all negative and vary from −1.80 J·m−2 to −1.32 J·m−2. The stabilities of the CT-6H-SiC(0001)/Cu(111) interfaces are stronger than those of the ST-6H-SiC(0001)/Cu(111) due to the strong interactions of the CT-6H-SiC(0001)/Cu(111) (Wad are positive) and the weak interactions of the ST-6H-SiC(0001)/Cu(111) (Wad are negative).
In addition, interfacial distances of CT-6H-SiC(0001)/Cu(111) are larger than those of the ST-6H-SiC(0001)/Cu(111) in Figure 3a,b, and the average distance of the former is only 0.85 Å contrasting with the large average distance 2.0 Å of the latter. Specifically, the most unstable interface CT-HCP(c) (0.4 J·m−2) has the largest interfacial distance of 1.81 Å, and ST-OT(b) has the largest interfacial distance (2.34 Å) corresponding to its lowest Wad value (−1.81 J·m−2).

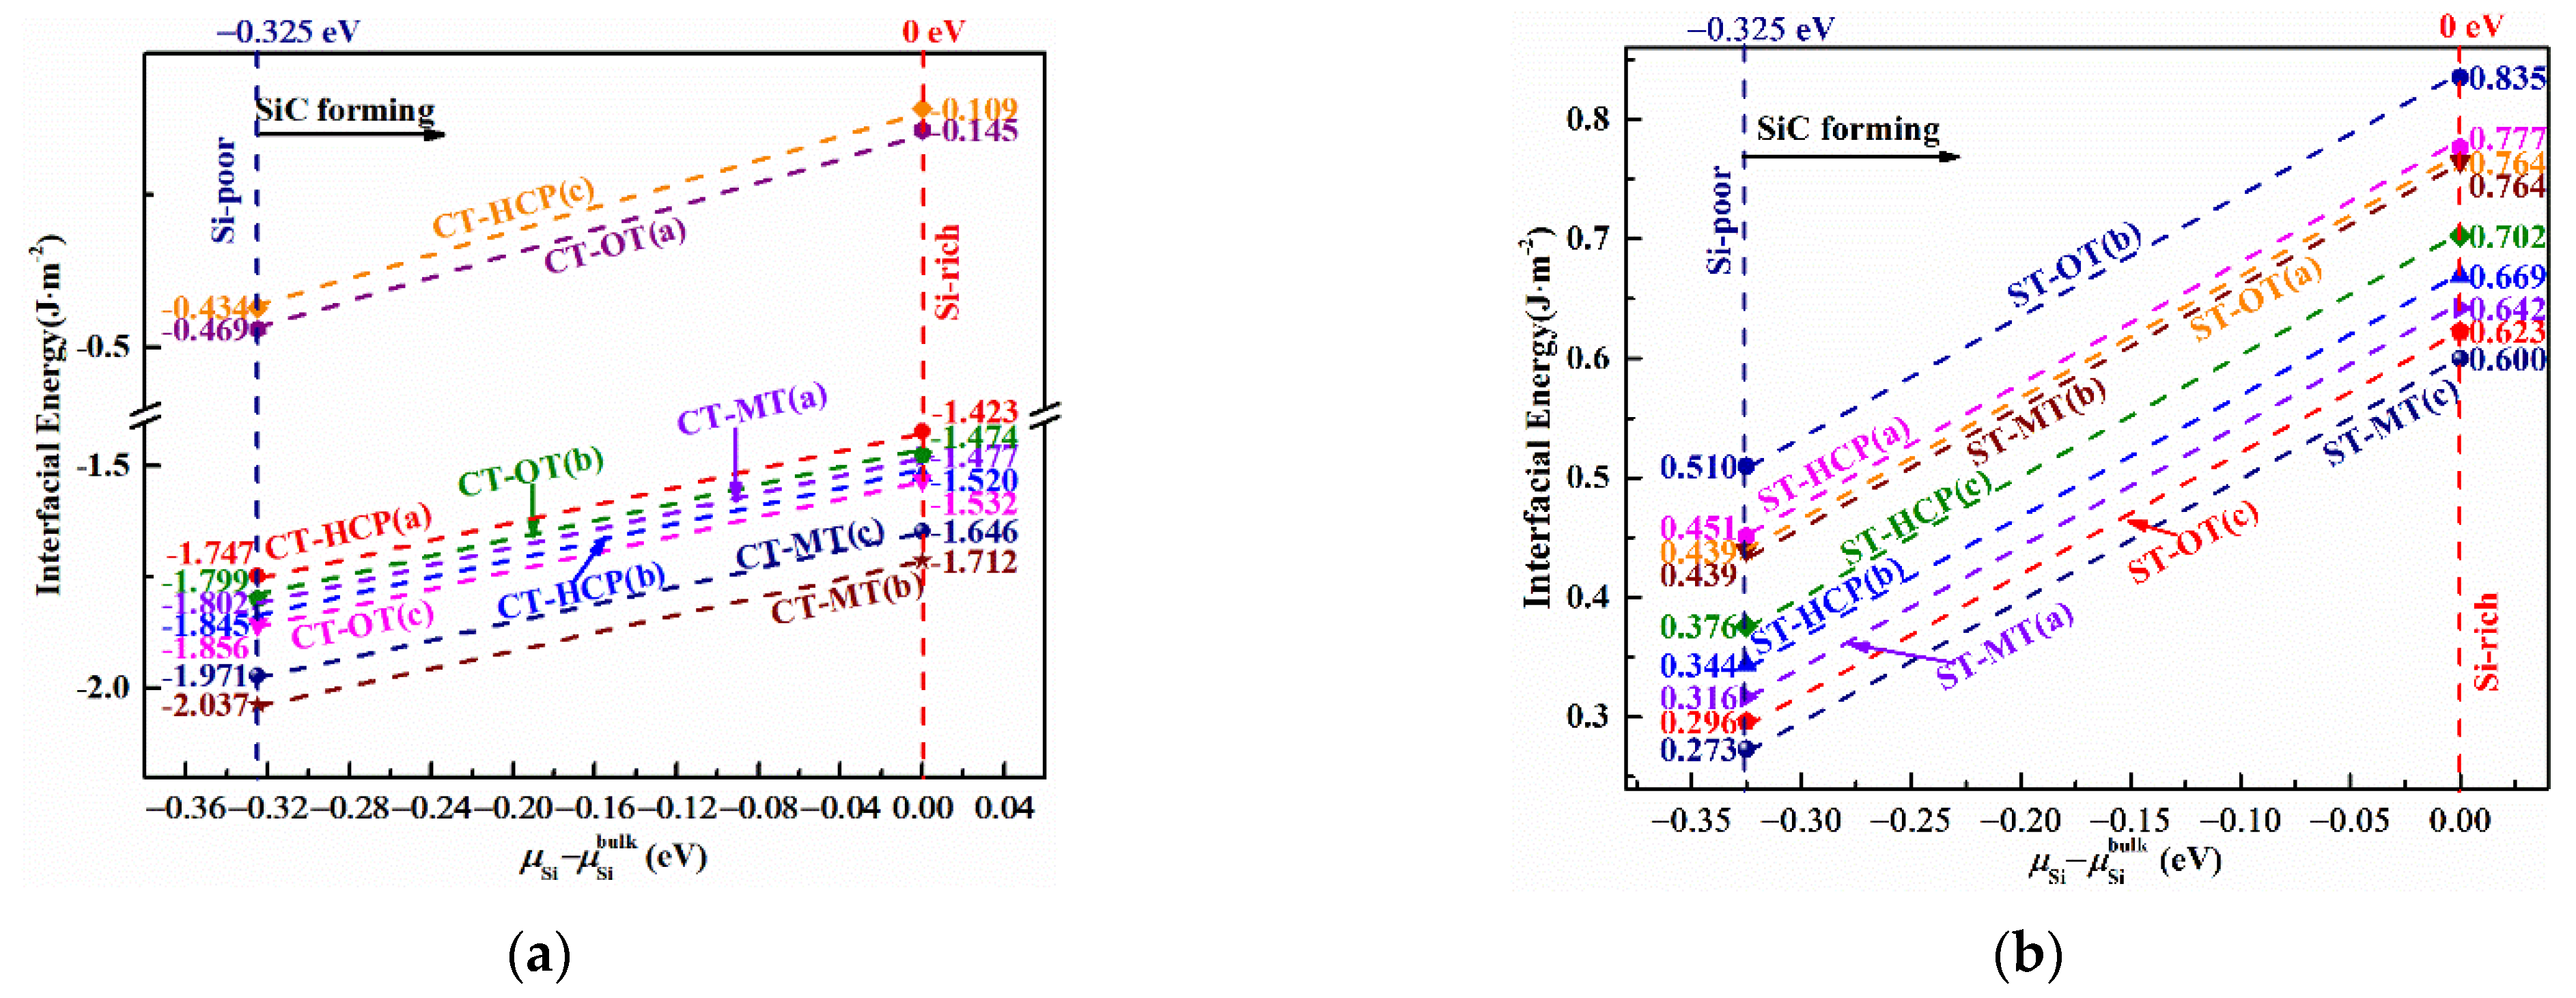
3.3.4. H-SiC(0001)/Cu(111) Interfacial Energies

The stabilities of the heterogeneous interfaces can be evaluated via interfacial energies. However, the assessment format of the interfacial energy is different with the work of adhesion; the larger of the interfacial energies, the weaker of the interface stabilities. The interfacial energy can be defined in the following equation for the 6H-Si(0001)/Cu(111) composite models:
γ i n t = γ Cu ( 111 ) + γ SiC ( 0001 ) W ad
where γ i n t , γ Cu ( 111 ) , γ SiC ( 0001 ) and W ad represent the interfacial energy of the 6H-SiC(0001)/Cu(111), surface energy of the Cu(111), surface energy of the 6H-SiC(0001) and work of adhesion of the 6H-SiC(0001)/Cu(111), respectively.
According to Figure 4a, all CT-6H-SiC(0001)/Cu(111) interfacial energies are negative, contrasting with the positive interfacial energies of the ST-6H-SiC(0001)/Cu(111), which further ensures that the CT-6H-SiC(0001)/Cu(111) interfaces are more stable than those of the ST-6H-SiC(0001)/Cu(111) interfaces. Specifically, the CT-MT(b) has the lowest interfacial energy (−1.712 J·m−2~−2.037 J·m−2) and the highest Wad (3.34 J·m−2), being the most stable interface among all CT-6H-SiC(0001)/Cu(111) interfacial models. In the same way, the largest interfacial energy (0.510~0.835 J·m−2) and lowest Wad values (−1.81 J·m−2) of the ST-OT(b) has the weakest stable interface among the ST-6H-SiC(0001)/Cu(111) interfacial models. In general, the sequence of the 6H-SiC(0001)/Cu(111) interfacial energies from the large to the small corresponds to the sequence of the Wad from the small to the large, which means the results obtained via these two methods are consistent.

4. Interfacial Atom Electronic Properties of the 6H-SiC(0001)/Cu(111) Composites

The electronic properties of the 6H-SiC(0001)/Cu(111) interfacial atoms were analyzed by charge density distribution, charge density difference and electron localized function methods. Based on these methods, the charge density distribution considers the total electron state of each atom, the charge density difference considers the charge communications between two neighboring atoms, and the electron localized function takes account of the atom bonding state. Furthermore, the partial density of state (PDOS) of the 6H-SiC(0001)/Cu(111) interfacial atoms were analyzed by their atomic orbital electron densities. Among all 6H-SiC(0001)/Cu(111) interfacial models, six of them (CT-HCP(a), CT-MT(a), CT-OT(a), ST-HCP(a), ST-MT(a) and ST-OT(a)) were studied; other calculated models cab been seen in Figure S1 to Figure S6, respectively (see in Supplementary Materials).

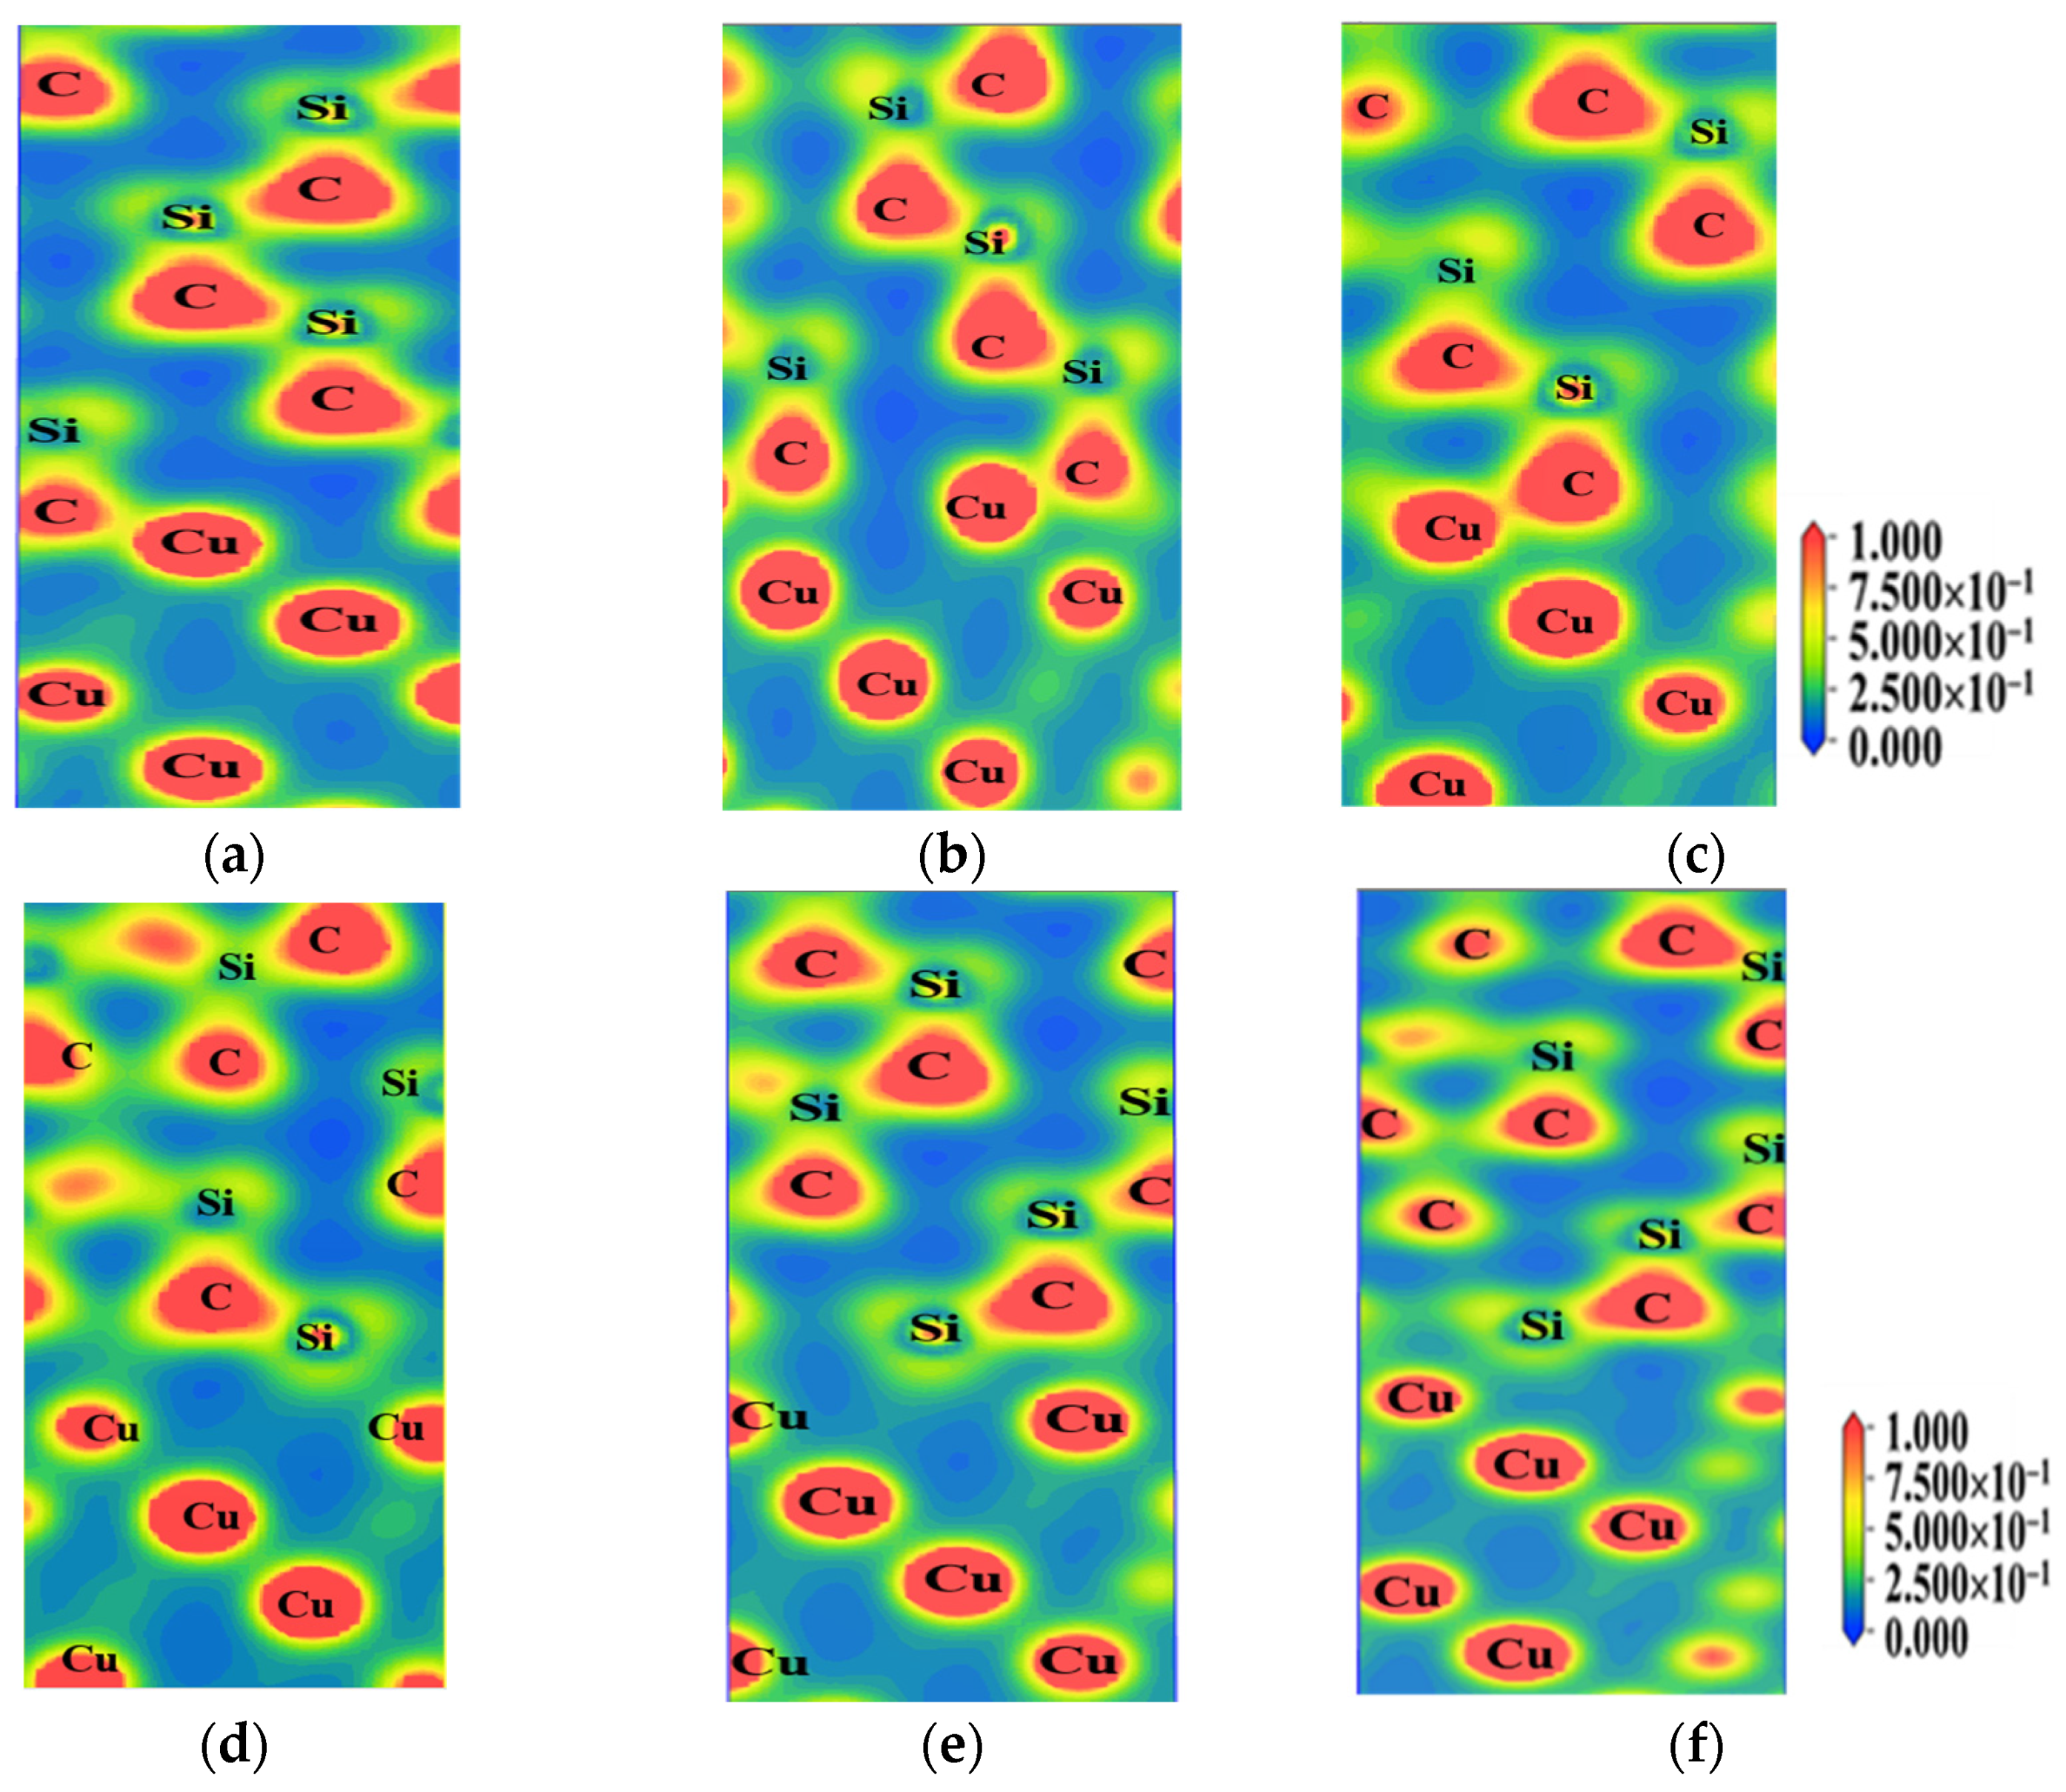
4.1. The Charge Density Distributions of the 6H-SiC(0001)/Cu(111) Interfacial Atoms

As shown in Figure 5a–c, abundant charges assembled between the interfacial C and Cu atoms, which indicates that the strong interactions happened at these interfaces. However, in Figure 5c–e, fewer charges distributed among the interfacial Si and Cu atoms, which reveals that weak interactions take place between these two atoms at the interfaces. Compared with CT-6H-SiC(0001)/Cu(111) and ST-6H-SiC(0001)/Cu(111) interfacial charge distribution, it is noted that the charges are inclined to accumulated on CT (6H-SiC(0001)/Cu(111) interfacial atoms than ton hose of the ST (6H-SiC(0001)/Cu(111), which shows that the interactions between the Cu and C atoms are stronger than those between Cu and Si atoms.

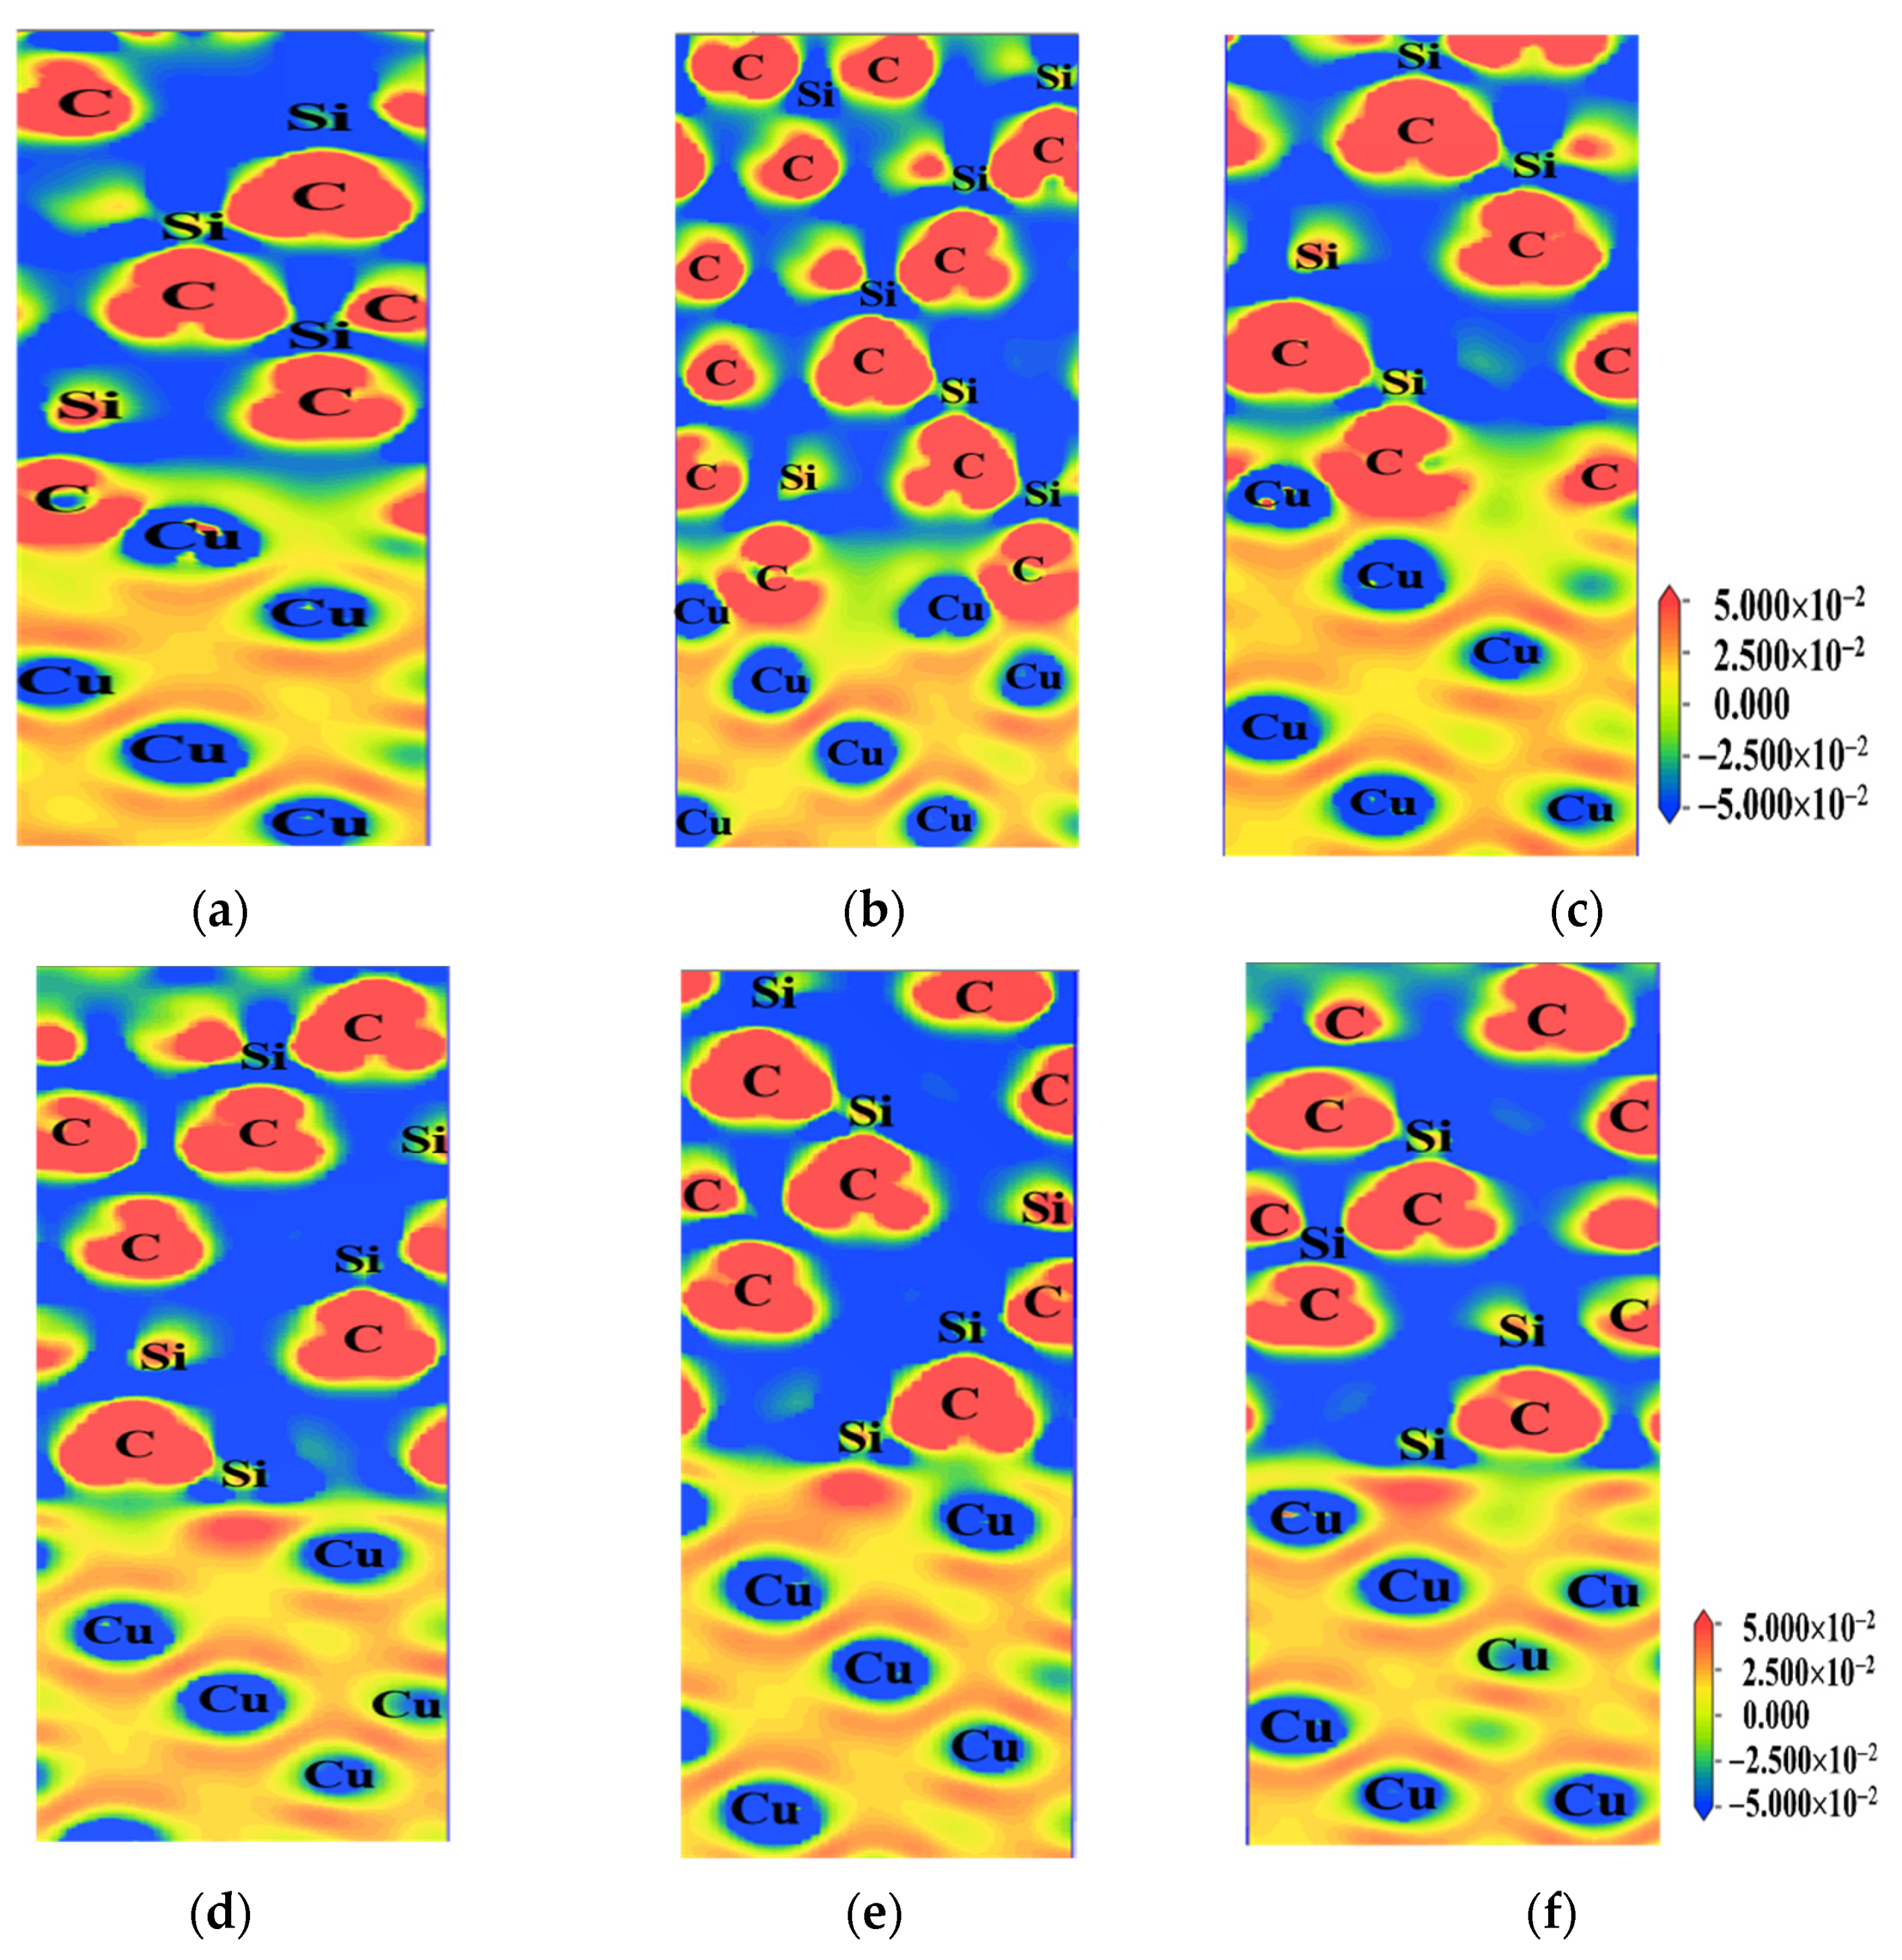
4.2. Charge Density Difference of Interfacial Atoms of the 6H-SiC(0001)/Cu(111) Interfacial Atoms

Charge density difference was applied to evaluate the charge communications between two atoms, as defined in Equation (12):
Δ ρ = ρ total ρ Cu ( 111 ) ρ SiC ( 0001 )
where the ρtotal is the total charge density of the 6H-SiC(0001)/Cu(111) interface, and ρCu(111) and ρSiC(0001) refer to the charge densities of isolated Cu(111) and SiC(0001) slab, respectively. In Figure 6, the blue color regions around Si and C atoms of the 6H-SiC indicate that few charge communications are found in these regions. Conversely, the intertwined yellow and red colors surrounding the Cu atoms reveal that strong electron communications take place among the interior Cu atoms. The interfacial atom Cu, Si and C obviously interact by their charge communications, and the color difference between the interfacial Cu and C atoms are more apparent than those of the interfacial Cu and Si atoms, implying that charge communication occurring between Cu and C atoms are stronger than those between Cu and Si atoms.

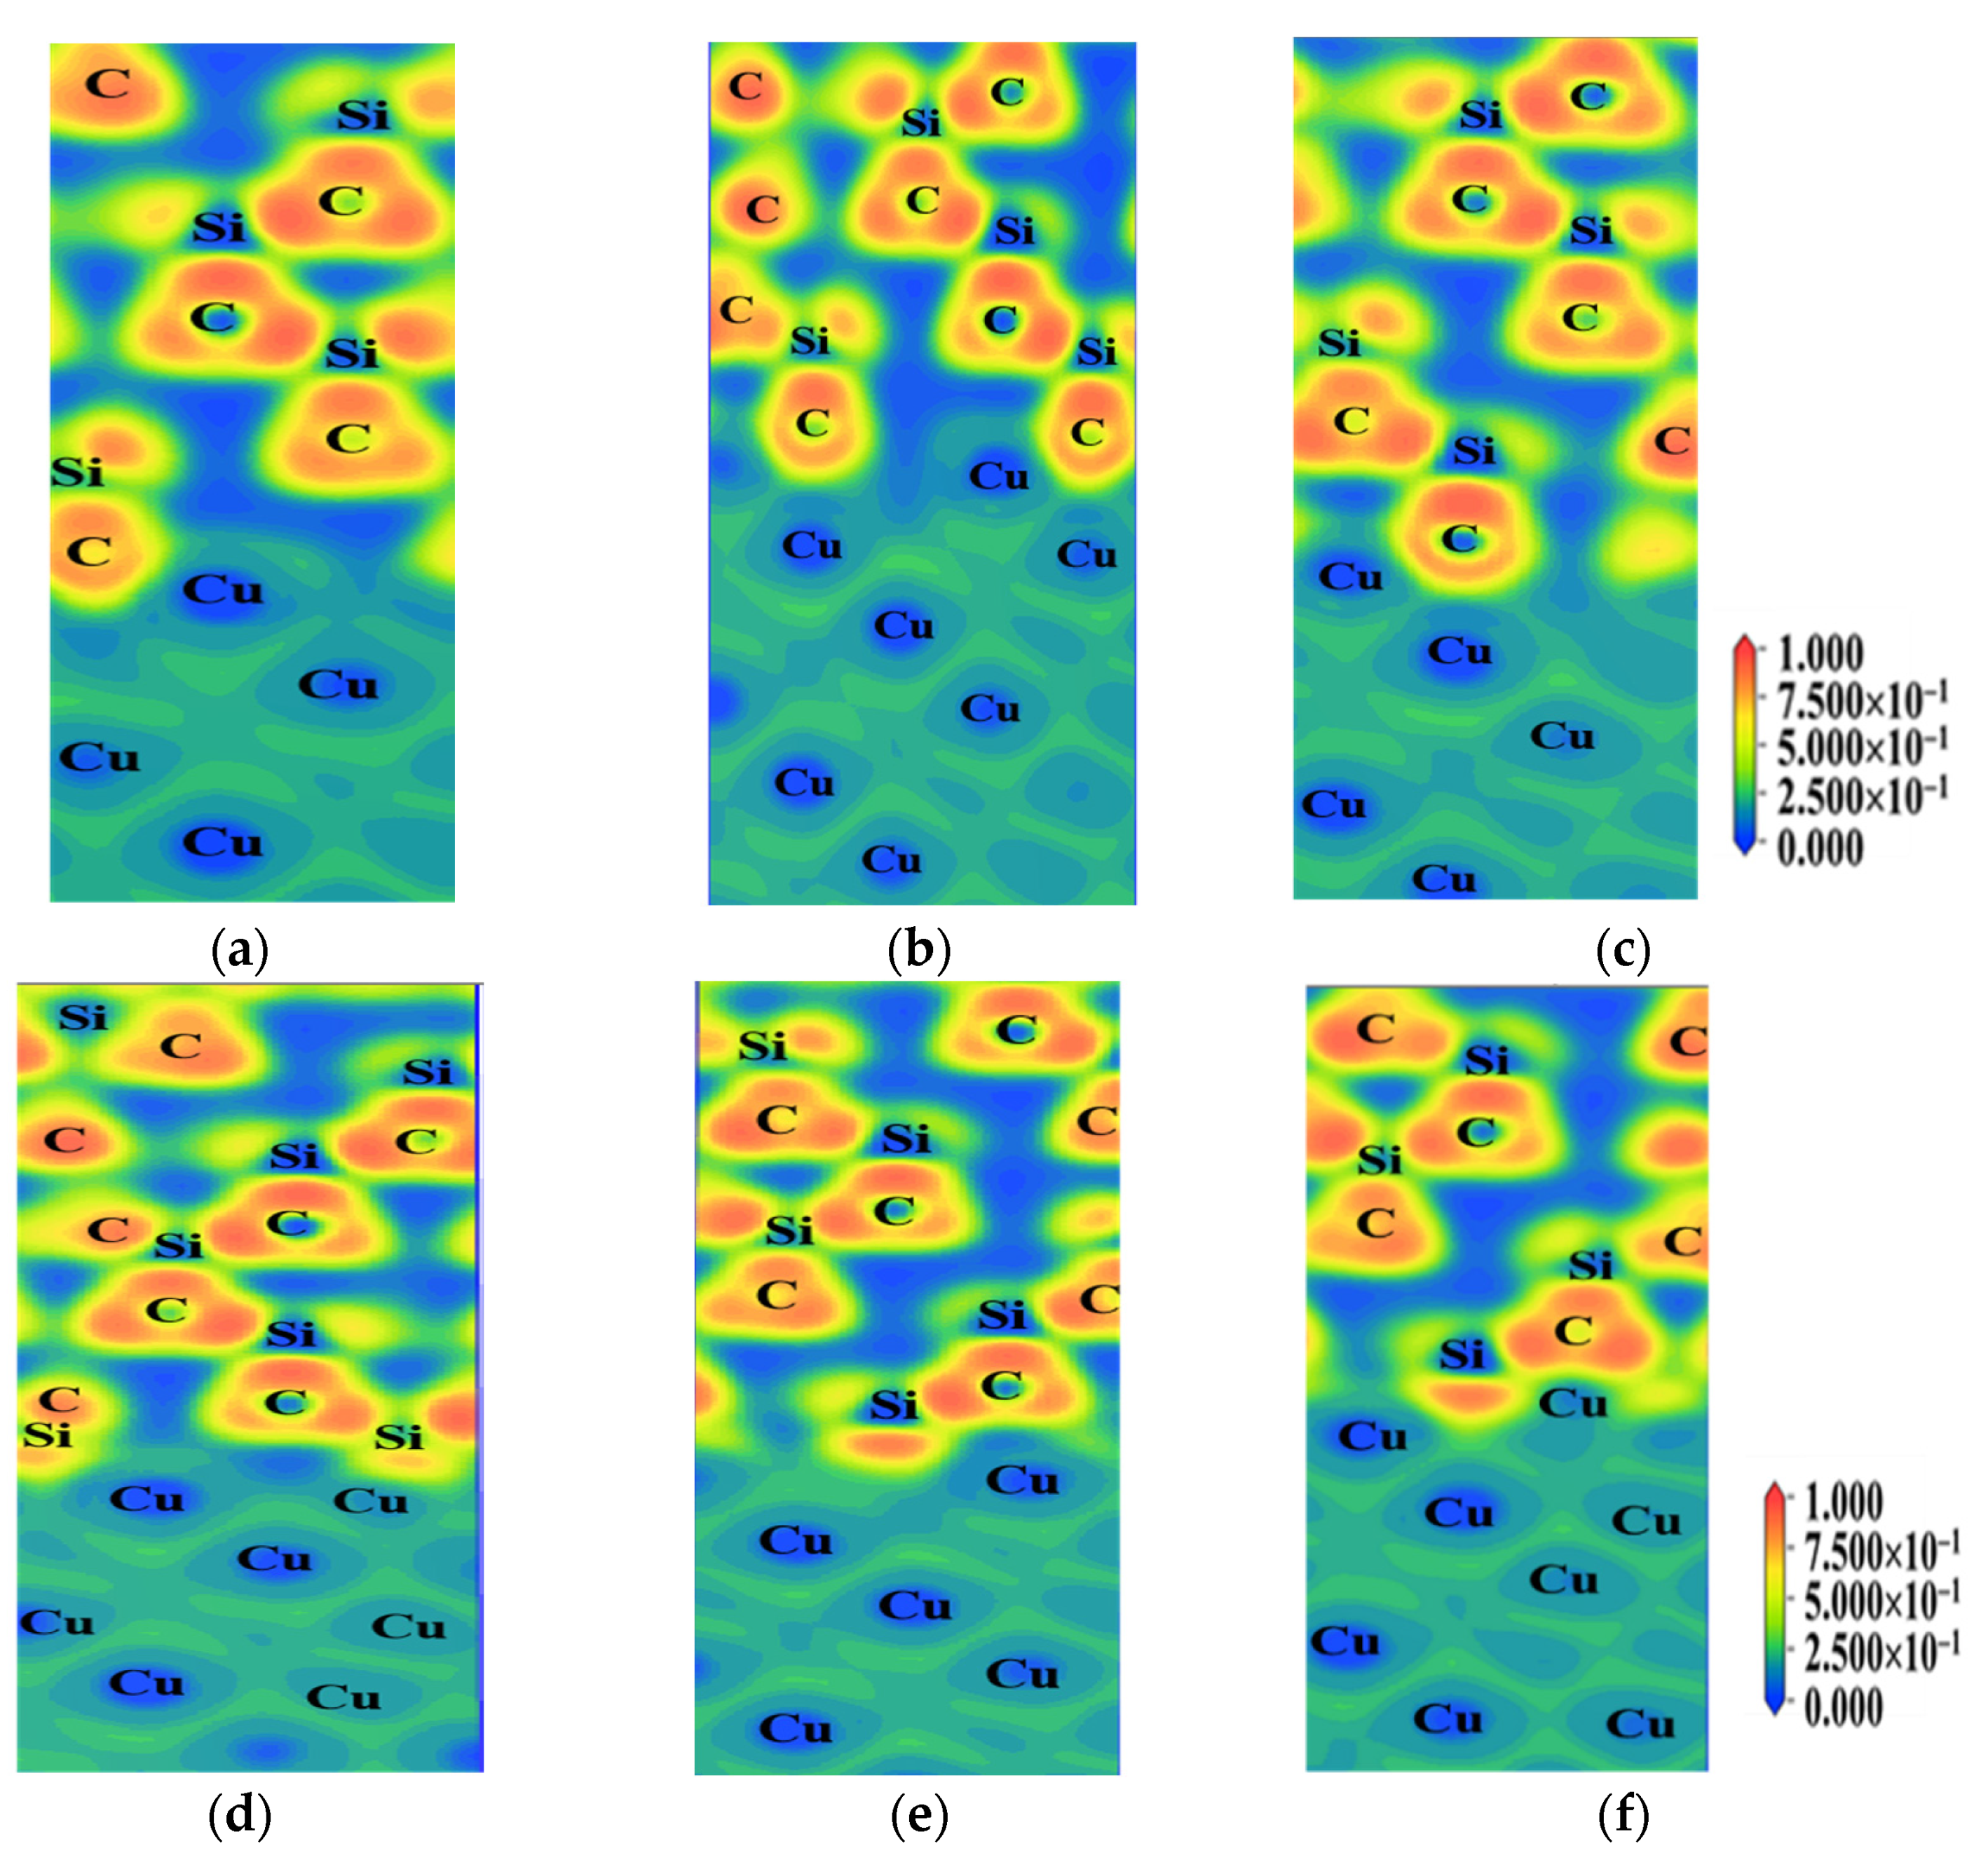
4.3. Electron Localization Function (ELF) of 6H-SiC(0001)/Cu(111) Interfacial Atoms

ELF is dimensionless and its values are between 0 and 1, evaluating the electron localized or unlocalized state between the two atoms. When the ELF equal to 1, t the electrons between two atoms are fully localized. If ELF = 0, the electrons are totally unlocalized. If ELF is equal to the median value (0.5), the atoms are surrounded by homogeneous electron gases [60]. In Figure 7, the dark green color among the Cu atoms of the six models reveals that abundant free electrons exist in the Cu interior. For the interior SiC of the six models, the red color between Si and C atoms shows that strong covalent bonds form between the two atoms. The color between the interfacial Cu, C and Si atoms is quite different from those of their interior, showing that bonding state of the interfacial atoms are different from those of the interior atoms.

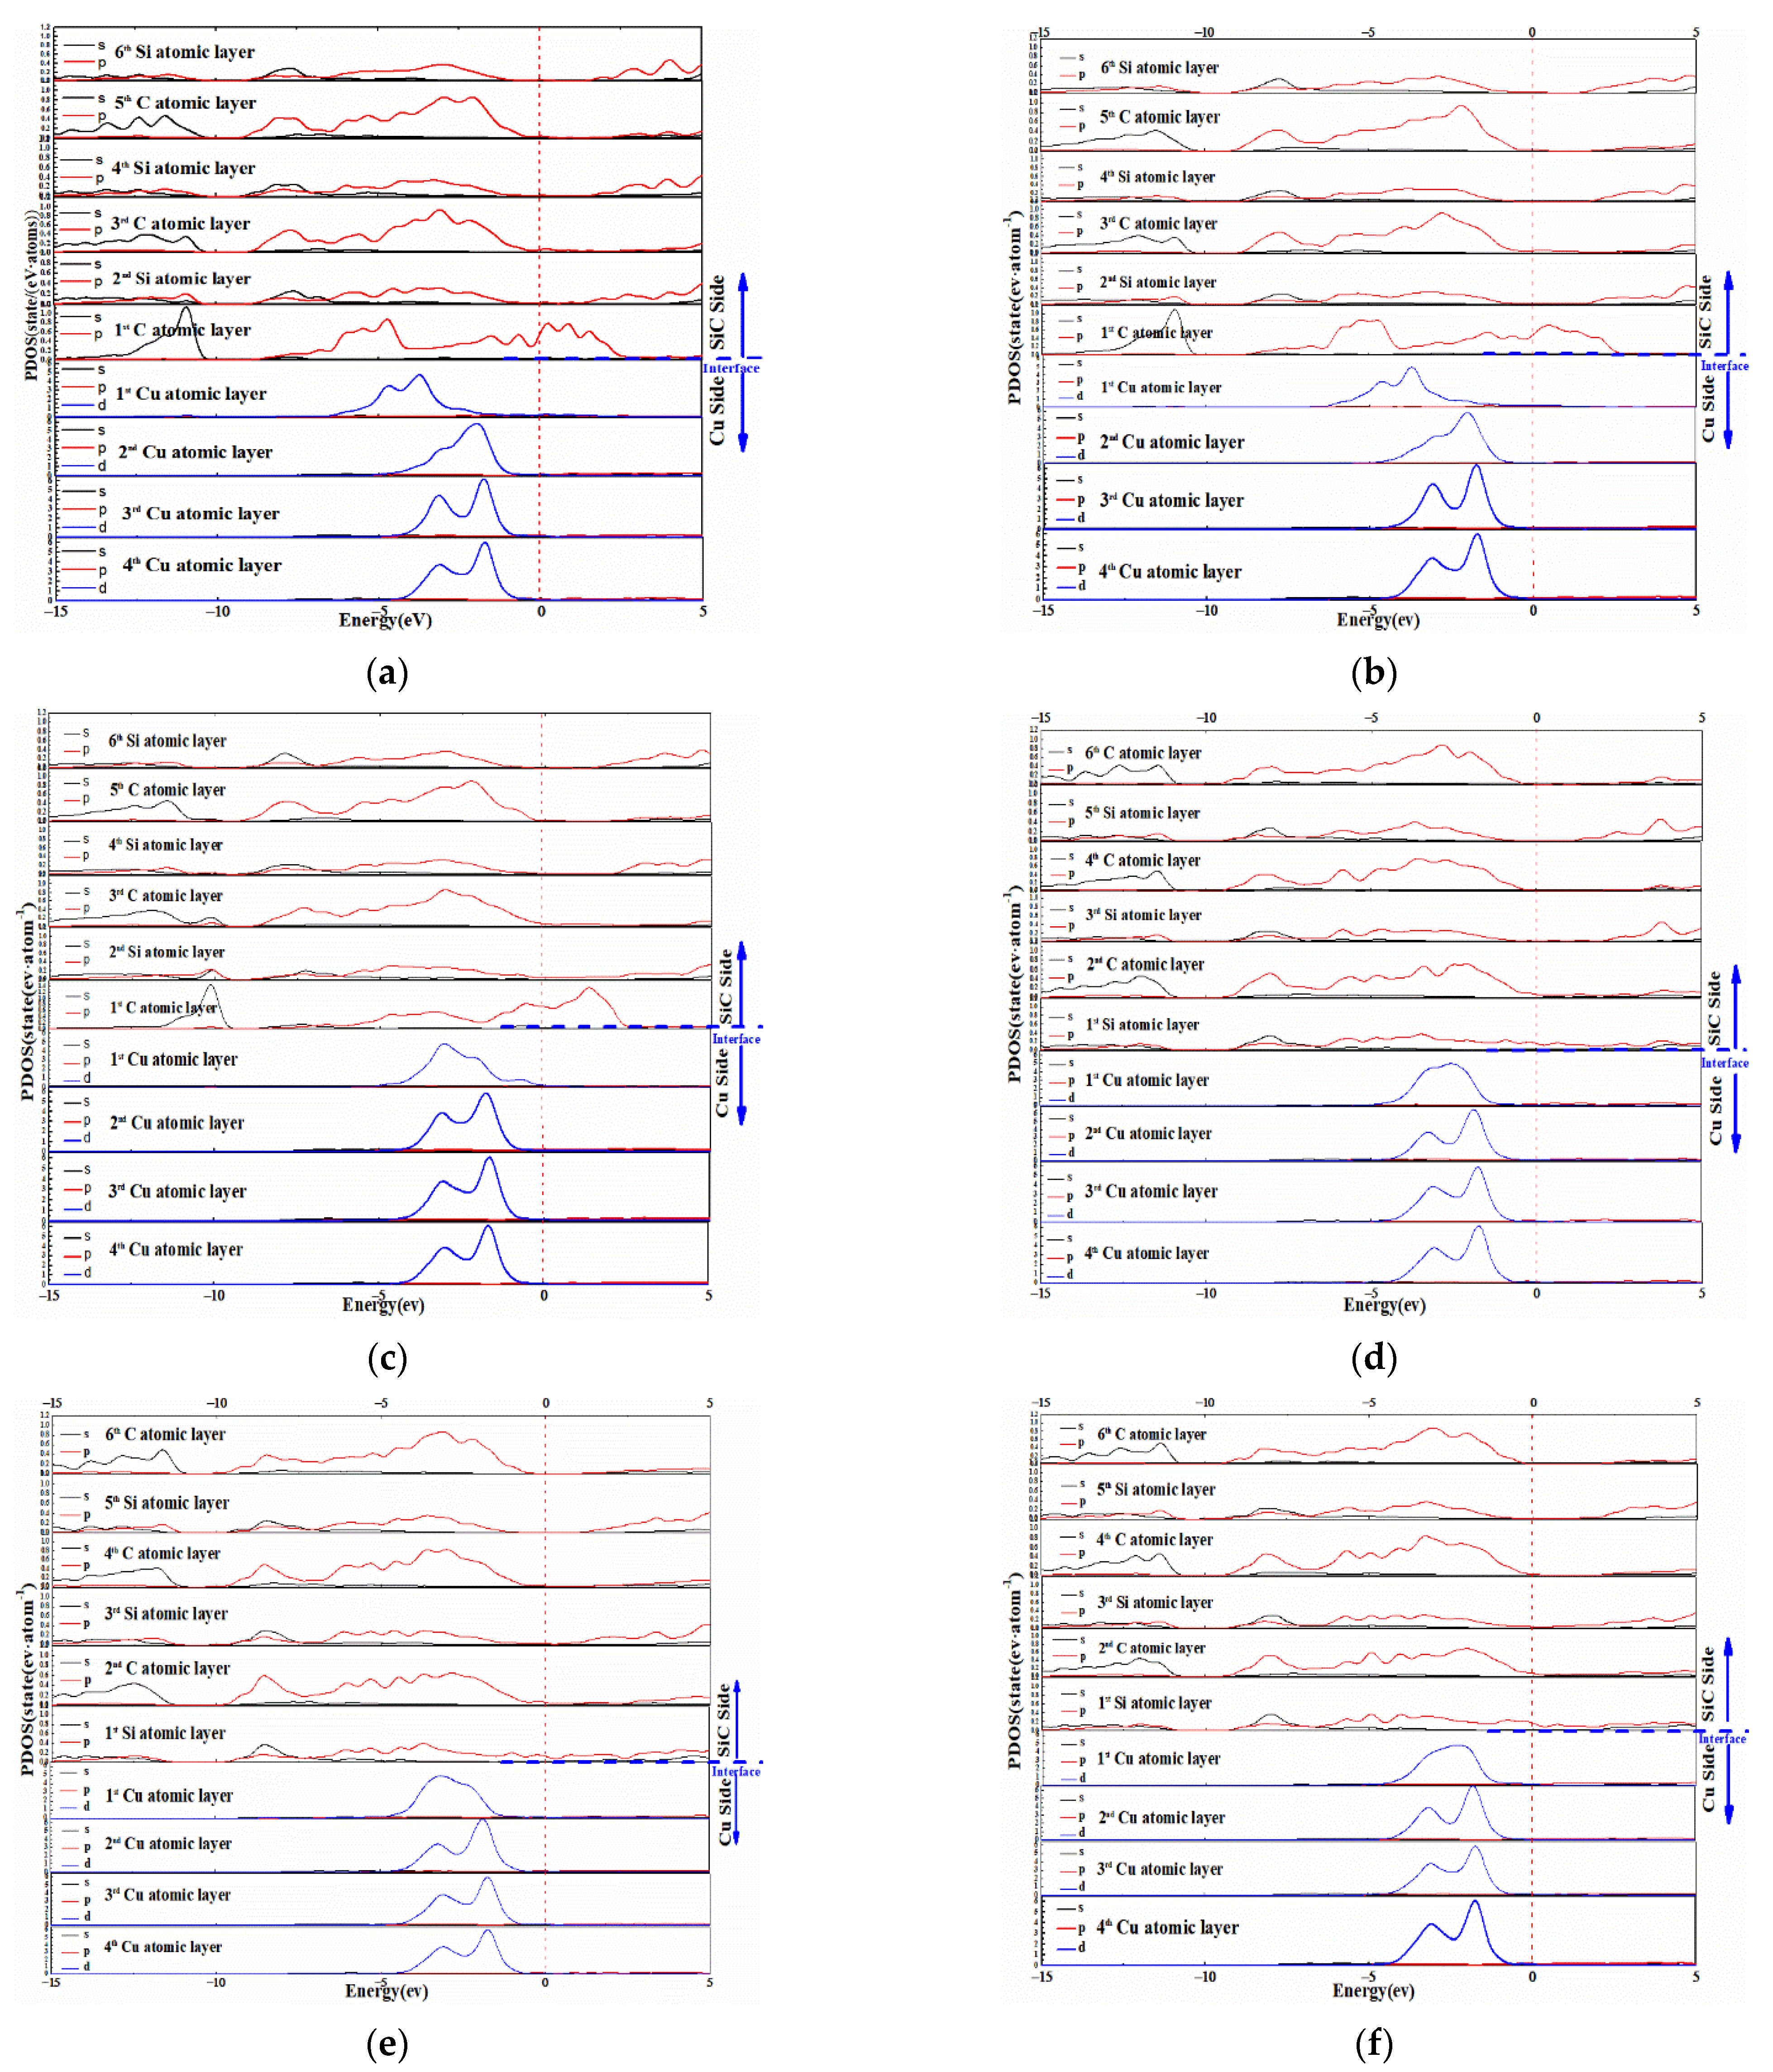
4.4. The Partial Density of State (PDOS) of 6H-SiC(0001)/Cu(111) Interfacial Atoms

The partial density of state (PDOS) was applied to determine features of the bonding states and electronic structures of the interfacial atoms. Six 6H-SiC(0001)/Cu(111) interfacial models were utilized to analyze the interfacial atom bonding states, and their PDOS results displayed in Figure 8. PDOS of the other models can be seen in Figure S7 to Figure S8. In Figure 8a–c, the PODS of the first C layer atom are different with those of their interior C layer atoms. For instance, a sharp peak appears at −10.9 eV for s-orbital electrons of the 1st C atoms in CT-HCP(a) and CT-MT(a) implying that the electrons belonging to the s-orbit of the first C atom are larger than those of the interior C atoms. Moreover, the similar intensity electron of the s-orbit for CT-OT(a) appears as a sharp peak at −10.1 eV in contrast to CT-HCP(a) and CT-MT(a).
The p-orbital charges of the first C atom pass through the Fermi energy level, which shows that the electrons are unlocalized between the interfacial C and Cu atoms. In comparison with the PDOS of interfacial and interior Cu atoms, the two peaks appeared at −1.51 eV and −1.99 eV for interior Cu atoms but were at −3.74 eV and −4.69 eV for the first Cu atom for CT-HCP(a) (Figure 8a). The transformed differences of these two peaks are −2.7 eV and −2.23 eV, which shows that the energies decreased more than those of the interior Cu atoms. In addition, the d-p orbital hybrid formed via the d-orbital electrons of the first Cu atom along with the p-orbital electrons of the first C atoms, which leads to a C–Cu covalent bond formatted. The intensities of the two peaks decreased nearly 0.91 eV/atom and 1.45 eV/atom for the first Cu atom, contrasting with those of the interior Cu atoms. A similar result was obtained for CT-MT(a) and CT-OT(a), respectively.
The curves of the PDOS of the ST-6H-SiC(0001)/Cu(111) are different from those of the CT-6H-SiC(0001)/Cu(111). Taking ST-HCP(a) for instance (Figure 8d), although the p-orbital electrons pass through the Fermi energy level, only feeble intension of the p-orbital electrons occurs around the Fermi energy level. In contrast to the s-orbital and p-orbital electrons of the interior Si atoms, subtle changes happened to those of the interfacial Si atoms, which implies that the p-orbital electrons of the interfacial Si atoms are less influenced by d-orbital electrons of the interfacial Cu atoms. Moreover, the line shape of the first Cu d-orbit is not the same as the that of the CT-HCP(a), nor of its interior Cu atoms. In comparison with the interior Cu d-orbit, the line shape of the interfacial Cu d-orbit has a wider and broad peak, which formed by the two peaks (same as the interior line shape of the Cu d-orbital) move to each other and finally combined to a single broad peak. Therefore, the interactions between interfacial Si and Cu atoms are quite different than those of the C and Cu atoms, i.e., the type bond between Si and Cu atoms is different from the bond which formed between Cu and C atoms. Moreover, the bond formed between interfacial Si and Cu in ST-HCP(a) is similar in ST-MT(a) and ST-OT(a). The PDOS of other CT-6H-SiC(0001)/Cu(111) and ST-6H-SiC(0001)/Cu(111) interfacial models had similar results to those obtained by CT-HCP(a) and ST-HCP(a), and they can be seen in Figures S7 to S8.

5. Interfacial Mechanical Properties

5.1. Interfacial Elastic Properties of 6H-SiC(0001)/Cu(111) Interfaces

The elastic energy of an homogenous substance is a constant, while for heterogeneous materials it is quite different [61,62,63]. For 6H-SiC(0001)/Cu(111) heterogeneous interfaces, the fracture toughness tends to occur at the interface. Therefore, the interfacial fracture toughness was evaluated via elastic energy as defined in Equation (12) [64]. In Equation (12), G1 and G2 refer to the shear modulus of SiC and fcc-Cu bulk, D1 and D2 represent the diameters of the atoms at the interface and ν2 is the Poisson’s ratio of bulk fcc-Cu. The specific interfacial elastic values of 6H-SiC(0001)/Cu(111) are displayed in Table 4, where the interfacial elastic energies of the CT-6H-SiC(0001)/Cu(111) are higher than those of corresponding ST-6H- SiC(0001)/Cu(111). According to the Table 4, the interfacial stabilities of CT-6H-SiC(0001)/Cu(111) are more stable than those of the ST-6H-SiC(0001)/Cu(111).
γ es = G 1 G 2 ( D 1 + D 2 ) | D 1 D 2 | 2 π D 2 ( G 1 + G 2 ) ( 1 + ν 2 ) [ ln [ D 2 2 | D 1 D 2 | ] + 1 ]
The assumed interfacial elastic energies are not consistent with the sequence of Wad and γ (interfacial energies), e.g., ST-MT(c) has the largest Wad (−1.32 J·m−2) and lowest interfacial energy (0.273–0.600 J·m−2), but its interfacial elastic energies (2.84 J·m−2) are neither the highest nor the lowest among the ST-6H-SiC(0001)/Cu(111) interfaces, which is mainly due to the complicated circumstance of the interfaces, such as the diameter of the interfacial atoms, the occupation of the interfacial atoms and the work of adhesion of the interfaces. Similar results were acquired for CT-6H-SiC(0001)/Cu(111) interfaces. Therefore, it can be noted that the elastic energies of 6H-SiC(0001)/Cu(111) interfaces influenced by different atomic termination (CT or ST) are stronger than those of stacking modes (HCP, MT, OT for Cu stacking and (a), (b), (c) for SiC interior structures). Specifically, the elastic energies of CT-6H-SiC(0001)/Cu(111) interfaces are about 2 J·m−2 larger than those of the ST-6H-SiC(0001)/Cu(111) interfaces. In addition, comparing the same atom terminated interfaces (CT or ST-6H-SiC(0001)/Cu(111)), the difference of the elastic energies are no more than 1 J·m−2, e.g., the difference of the highest (CT-OT(a)) and the smallest (CT-OT(c) elastic energy of CT-6H-SiC(0001)/Cu(111) is 0.87 J·m−2 (the difference of ST-6H-SiC(0001)/Cu(111) is 0.9 J·m−2).

5.2. Interfacial Fracture Toughness of the 6H-SiC(0001)/Cu(111)

The generation of the stress transferred depending on the interfaces is ascribed to the ductile matrix to brittle reinforcement of the composites. The energy released from the crack tip zone is the same as the energy required to form the crack area and is a necessary condition for brittle fracture under the static condition.
The bulk and the interface of the composite fractures can be estimated according to the Griffith theory.
G bulk = 2 γ s
G i n t = γ s 1 + γ s 2 γ s 12 γ e s  
Therefore, the work of fracture at interface for composites can be defined in Equations (13) and (14), where γ s refers to the energy of bulks, γ s 1 represents the surface energy of the one part, γ s 2 refers to the surface energy of the other part, γ s 12 is the interfacial energy before the heterogeneous interfaces fractured into two faces and γ e s represents the interfacial elastic energy, respectively. Because the works of adhesion are closely related the surface energies γ Cu ( 111 ) , γ SiC ( 0001 ) and interfacial energies γ i n t ( W ad = γ Cu ( 111 ) + γ SiC ( 0001 ) γ i n t ) Equation (15) is obtained via substituting the Equation (10) into the Equation (14), which can be expressed as:
G i n t = W ad γ e s
In Equation (14), the negative sign of γ e s indicates that before the interface breaking into two free surfaces the system sustaining elastic energy. Before the interface fractured into two free surfaces, which requires G bulk > G i n t , when the interface trend to fracture into two free surfaces, which demands G bulk gradually approaches G i n t ( G bulk = G i n t ), and for absolutely fractures of the interface, which requests G i n t > G bulk . Therefore, it could be noted that when SiC/Cu interface fractured, the separated two parts are interior Cu matrix and SiC particles, respectively.
According to the Equation (13), G Cu ( 111 ) = 2 γ Cu ( 111 ) . Therefore, the value of G Cu ( 111 ) at 2.78 J·m−2, is twice the Cu(111) slab surface energy(1.39 J·m−2). However, due to the polar surface of the SiC(0001) slab, its fractures G SiC ( 0001 ) are more complex. The G SiC ( 0001 ) can be obtained from the sum of the γ SiC ( 0001 ) - Si (ST-6H-SiC(0001) surface energies) and γ SiC ( 0001 ) - C (CT-6H-SiC(0001) surface energies), which represent the Si-terminated surface energy of the SiC(0001) and the C-terminated surfaces energy of the SiC(0001), respectively. Thus, the value of the G SiC ( 0001 ) can be obtained via the surface energy of the SiC(0001). It can be noted that there are two region of surface energies with chemical potential of the Si atom from the poor side to the rich side. So, the works of fractures G SiC ( 0001 ) is equal to the sum of the C-terminated SiC(0001) surface energies (in Figure 2 which is 7.692 J·m−2 ) and the Si-terminated SiC(0001) surface energies (in Figure 2 which is 2.553 J·m−2) on the poor side of the Si chemical potential (the value of G SiC ( 0001 ) is 10.245 J·m−2). Similarly, the same G SiC ( 0001 ) value 10.245 J·m−2 can be acquired on the rich side of the Si chemical potential, the C-terminated SiC(0001) surface energies and the Si-terminated SiC(0001) which are, respectively, 7.367 J·m−2 and 2.878 J·m−2. Table 5 shows fracture values of all SiC/Cu interfacial models obtained via Equation (14). According to the results in the Table 5, it can be noted that all G i n t values are negative (the values vary from −5.32 J·m−2 (ST-OT(b)) to −1.49 J·m−2 (CT-MT(b)) and are smaller than their corresponding G bulk ( G bulk = γ SiC = 10.245 J·m−2 or G bulk = 2 γ Cu (2.78 J·m−2) values. In general, based on discussion of the G bulk and G i n t mentioned above, it can be noted that the interfaces of all 6H-SiC(0001)/Cu(111) are hard to fracture.

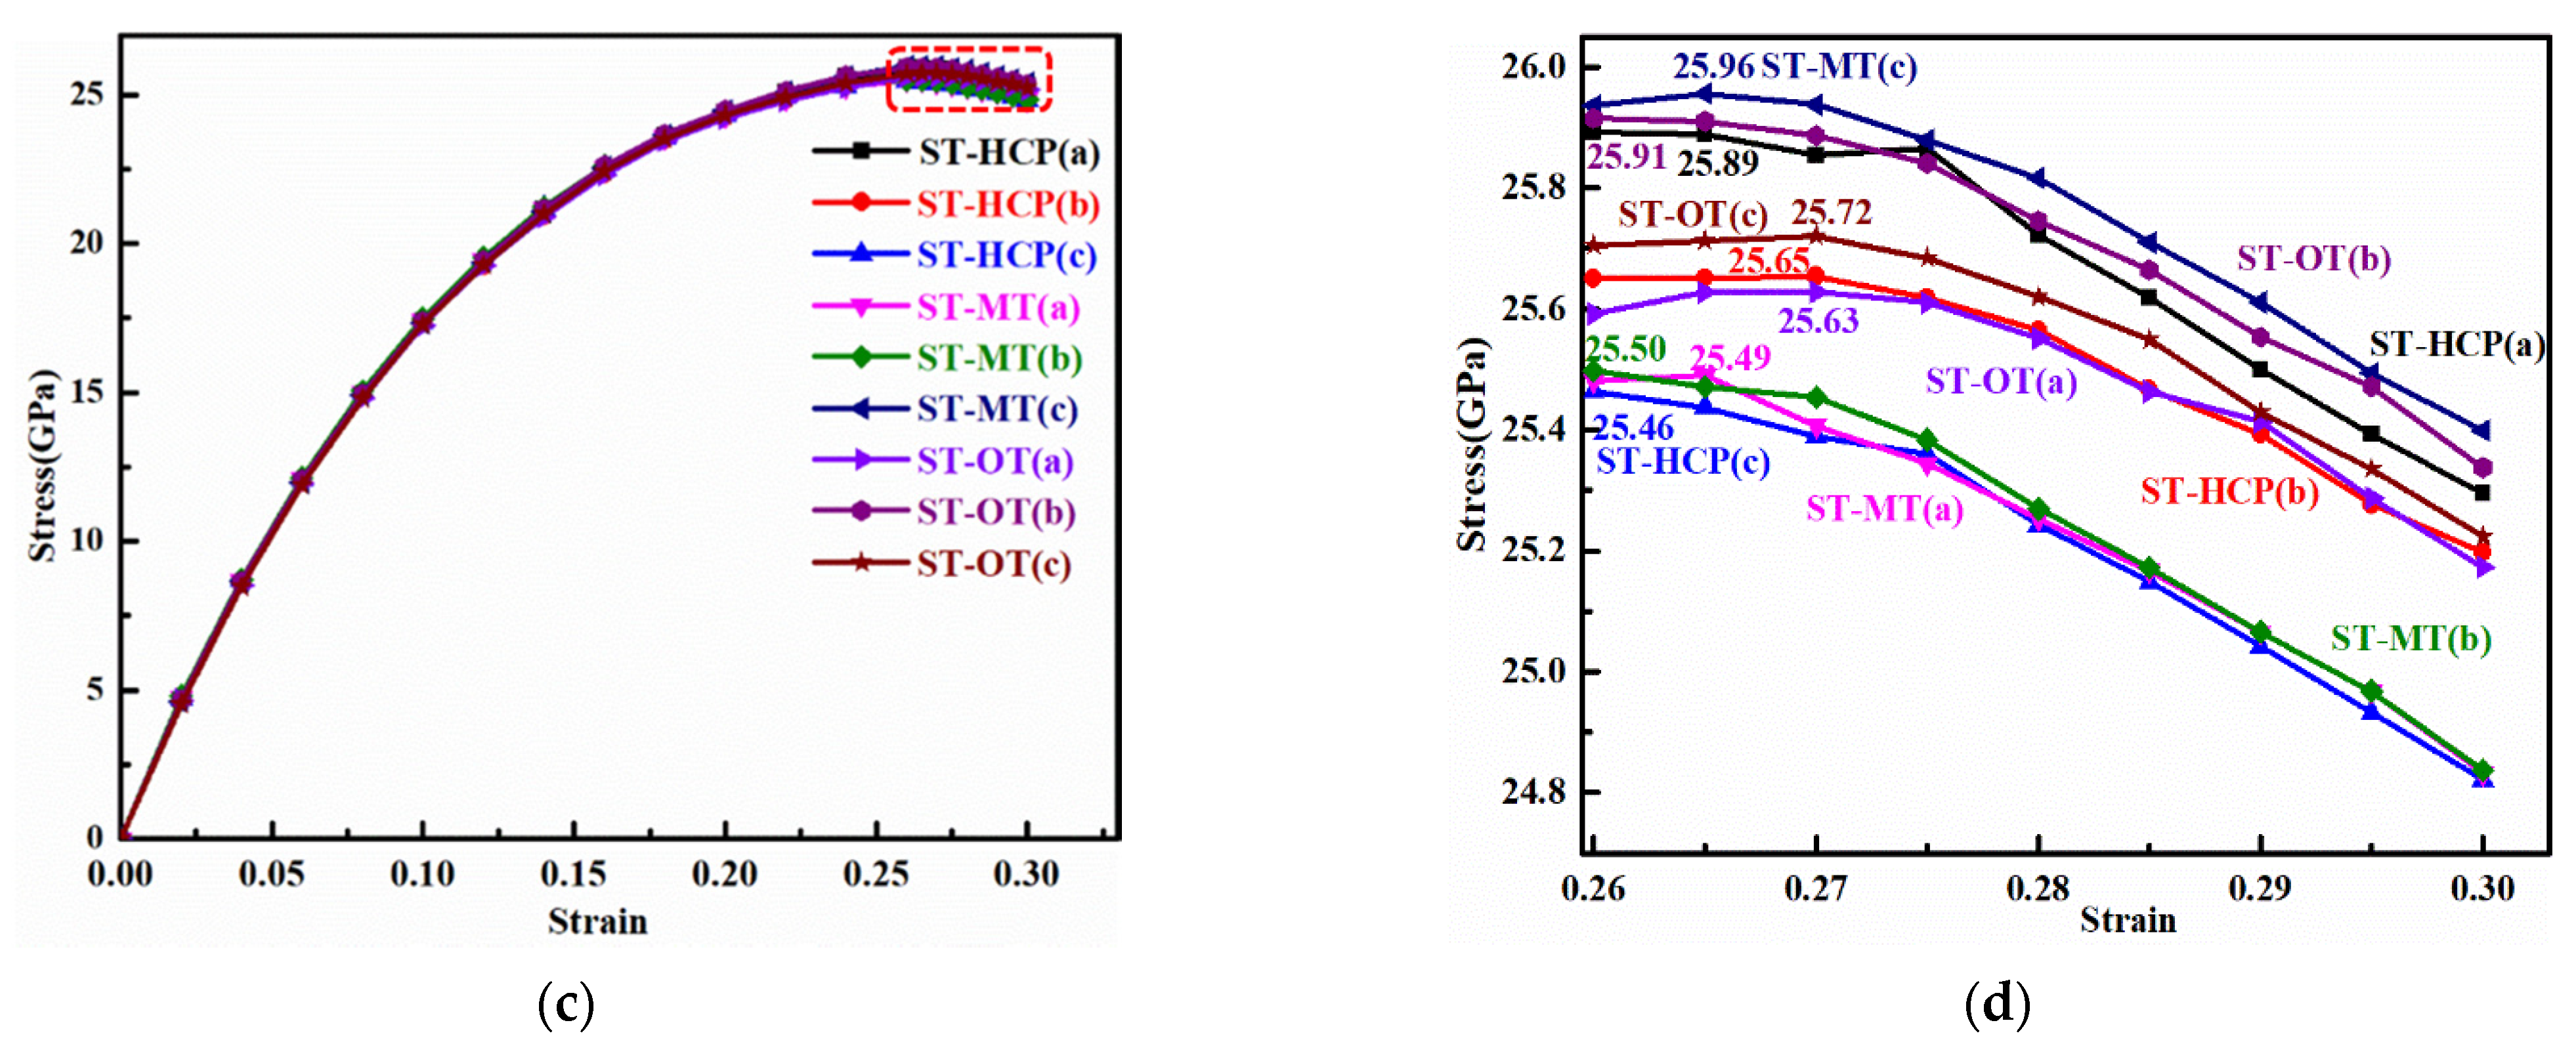
6. Ultimate Tensile Strength

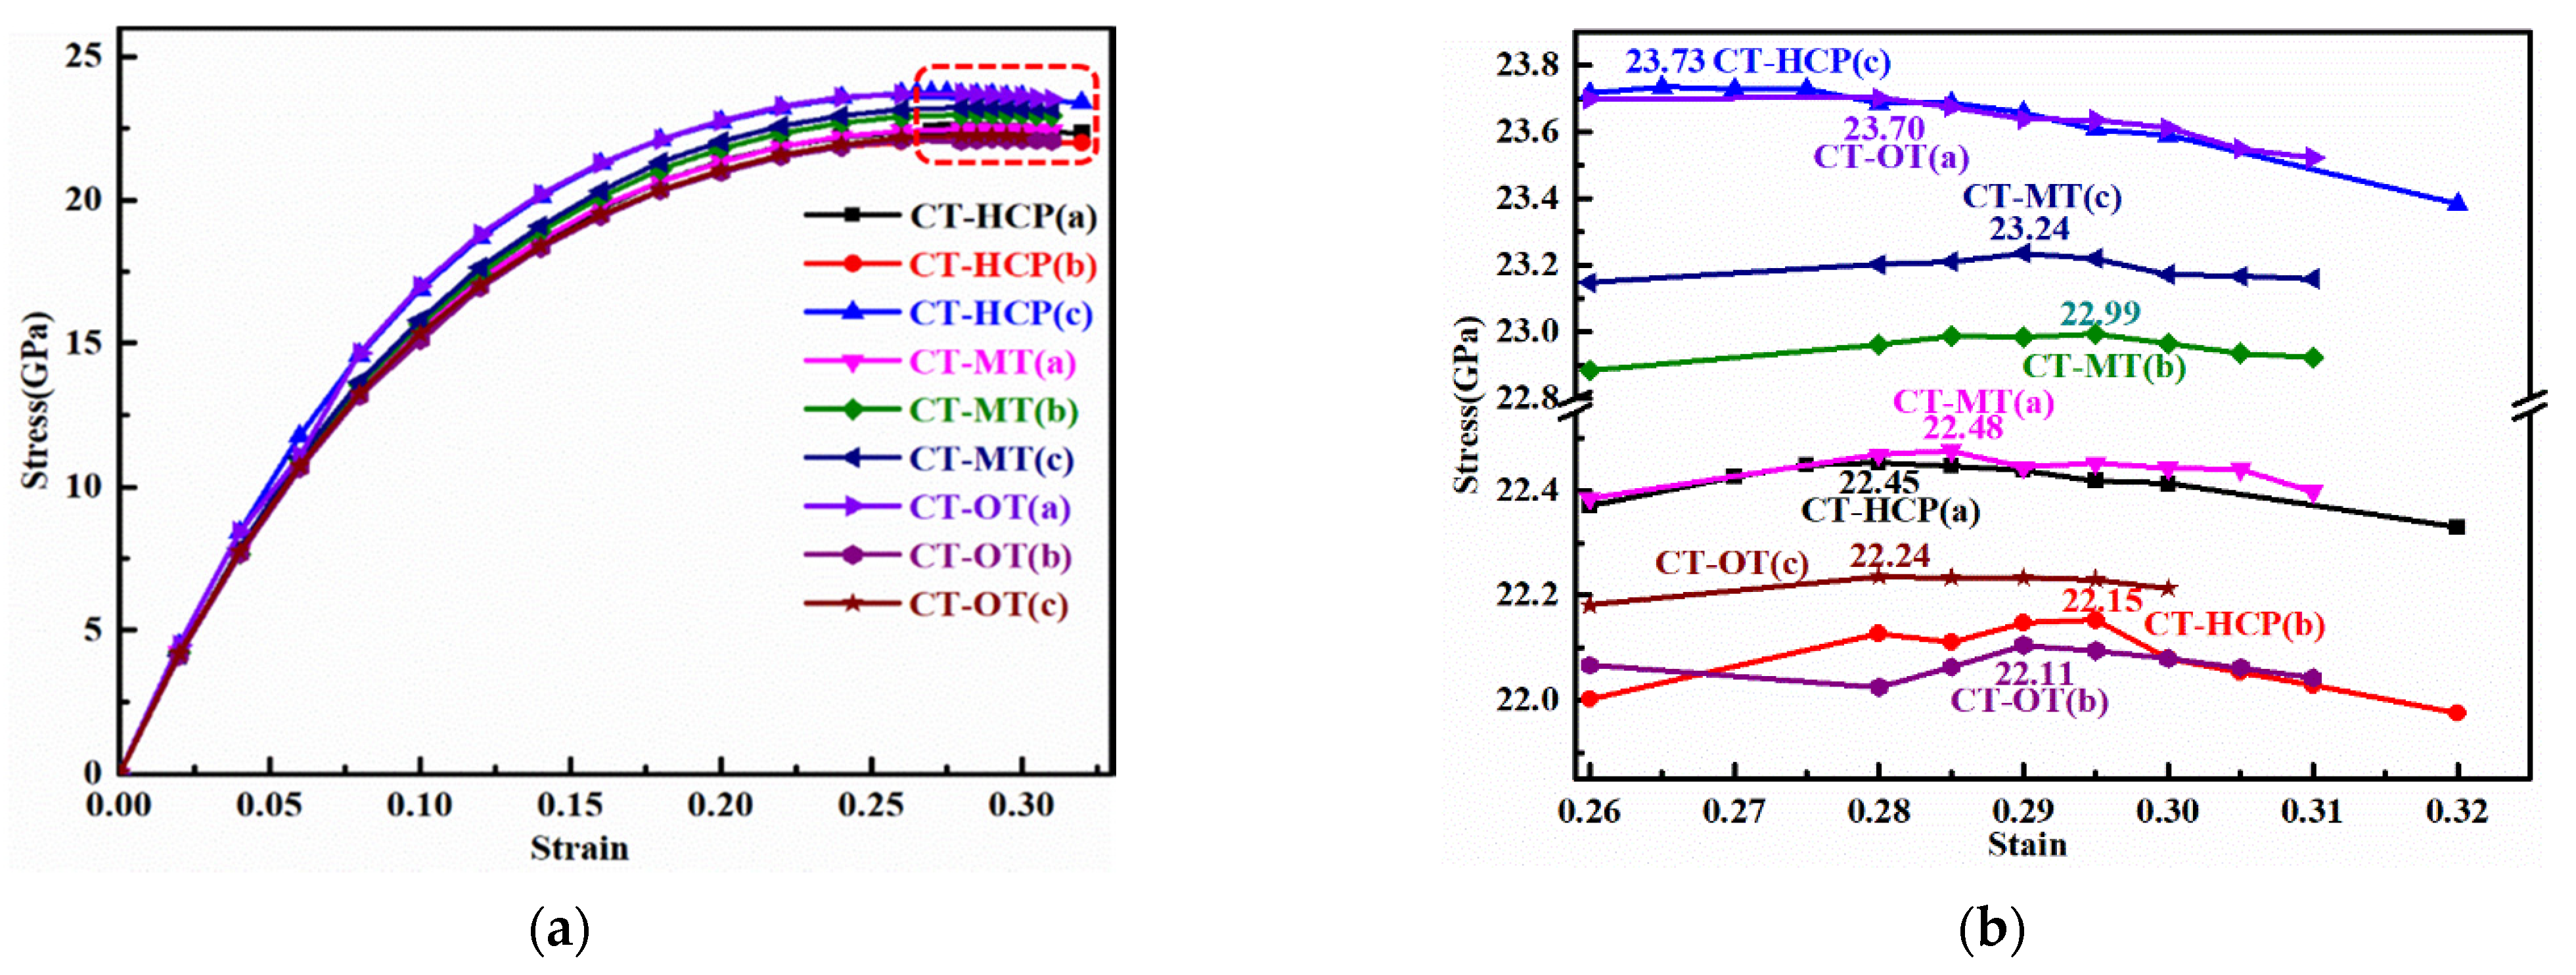
The Ultimate Tensile Stress and Strains of the 6H-SiC(0001)/Cu(111) Interfaces

As strain increases along the c directions of the models, the ultimate tensile stress of the various 6H-SiC(0001)/Cu(111) models can occur under different ultimate strains. Therefore, to determine the ultimate tensile strength of the 6H-SiC(0001)/Cu(111) interfacial models, a 0.02 strain step is performed in the c directions to reach the ultimate tensile stress of the 6H-SiC(0001)/Cu(111) interfaces. In order to obtain the relationships of the strain and ultimate tensile stress, stress vs. strain were plotted to acquire the variation trend of the stress. The normal strain can be expressed by Equation (16) [64] in terms of engineering strain.
ε tensile = ( l l 0 ) / l 0
where l0 and l refer to the primary cell length and the deformed cell length, respectively. The engineering strain yield maintains the interfacial supercell model in a quasi-static way. The ultimate tensile stress of the C-terminated and Si-terminated 6H-SiC(0001)/Cu(111) can be obtained via a plot of the stress vs. strain as in in Figure 9. Figure 9a,c shows all strains which from 0 to 0.32, and at the highest stress a 0.005 strain step was added to confirm the ultimate tensile stress. Figure 9b,c shows enlarged graphs which are marked red squares in Figure 9a,c respectively.
According to the Figure 9, the plotted strain vs. stress of CT-6H-SiC(0001)/Cu(111) can be distinguished by their color point lines (Figure 9a). However, the plotted strain vs. stress of ST-6H-SiC(0001)/Cu(111) have the same variation trend which leads to all colored lines overlapping (Figure 9c). The ultimate tensile stress for CT-6H-SiC(0001)/Cu(111) interfaces are nearly at 23 GPa (varying from 22.11 GPa (CT-OT(b) to 23. 73 GPa (CT-HCP(c)) and their corresponding stains are different from 0.26 (CT-HCP(c)) to 0.295 (CT-HCP(b)). In addition, the ultimate tensile stress for ST-6H-SiC(0001)/Cu(111) in Figure 9d is about 25.5 GPa (the lowest is 25.46 GPa (ST-HCP(c) and the highest is 25.96 GPa (ST-MT(c)). The strain corresponding to the ultimate tensile stress with the small differences for ST-6H-SiC(0001)/Cu(111) interfaces are respectively from 0.26 to 0.27. In comparison with the ultimate tensile stress of the ST-6H-SiC(0001)/Cu(111), the CT-6H-SiC(0001)/Cu(111) have higher ultimate tensile stress values. The strains at the ultimate tensile stress are equal to or higher than 0.28 (excepting for CT-HCP(c) (0.265)) for most of the CT-6H-SiC(0001)/Cu(111) interfaces. The strains corresponding to the ultimate tensile stress of CT-6H-SiC(0001)/Cu(111) interfaces are larger than those of the highest strain corresponding to the ultimate tensile stress 0.27 of the ST-6H-SiC(0001)/Cu(111) interfaces. The higher strain of the CT-6H-SiC(0001)/Cu(111) interfaces indicate that they have better plastic properties, which are ascribed to the C–Cu formed at the interfaces, i.e., the plastic properties have been enhanced by SiC reinforcement of the copper matrix, mainly due to covalent carbide formed at the interfaces.

7. Conclusions

SiC/Cu matrix composites were systematically investigated via first principles. The stable properties, electronic properties and ultimate tensile strength of 6H-SiC(0001)/Cu(111) interfaces were studied and the main results are summarized: below.
(1) The work adhesion and interfacial energies indicate that the CT-SiC(0001)/Cu(111) interfaces are more stable than the ST-SiC(0001)/Cu(111) interfaces.
(2) The charge density distribution, charge density difference, electron localization function and PDOS were calculated to investigate the electronic properties of 6H-SiC(0001)/Cu(111), and the results indicate that covalent C–Cu bonds are formed at the CT-6H-SiC(0001)/Cu(111) interfaces, while less interactions between the Si and Cu atoms of ST-6H-SiC(0001)/Cu(111) interfaces indicate that the valence bonds between them are weak.
(3) The ultimate tensile strains of 6H-SiC(0001)/Cu(111) were estimated. The ultimate tensile stresses were about 23 GPa and 25 GPa for the CT-6H-SiC(0001)/Cu(111) interfaces and the ST-6H SiC(0001)/Cu(111) interfaces, respectively. Moreover, the strains corresponding to ultimate tensile strength were mostly higher than 0.28 and 0.26 for the CT-6H-SiC(0001)/Cu(111) and for ST-6H-SiC(0001)/Cu(111), respectively.

Supplementary Materials

The following supporting information can be downloaded at: https://www.mdpi.com/article/10.3390/cryst12010051/s1, Figure S1: The charge density distribution of the interfacial atoms of all “(b)” type of 6H-SiC(0001)/Cu(111) interfacial models along (211) interfaces (eV/Å3); Figure S2: The charge density distribution of the interfacial atoms of all “(c)” type of 6H-SiC(0001)/Cu(111) interfacial models along (211) interfaces (eV/Å3); Figure S3: The charge density difference of the interfacial atoms of all “(b)” type of 6H-SiC(0001)/Cu(111) interfacial models along (211) interface (eV/Å3); Figure S4: The charge density difference of the interfacial atoms of all “(c)” type of 6H-SiC(0001)/Cu(111) interfacial models along (211) interface (eV/Å3); Figure S5: The electron localization function of the interfacial atoms of all “(b)” type of 6H-SiC(0001)/Cu(111) interfacial models along (211) interface (eV/Å3); Figure S6: The electron localization function of the interfacial atoms of all “(c)” type of 6H-SiC(0001)/Cu(111) interfacial models along (211) interface (eV/Å3); Figure S7: The partial density of state of the interfacial atoms of all “(b)” type of 6H-SiC(0001)/Cu(111) interfacial models; Figure S8: The partial density of state of the interfacial atoms of all “(c)” type of 6H-SiC(0001)/Cu(111) interfacial models.

Author Contributions

Formal analysis, C.Y.; methodology, Y.X.; investigation, Y.S.; resources, X.L.; data curation, J.H.; writing—original draft preparation, Y.S.; writing—review and editing, S.Z.; visualization, Y.S.; supervision, K.Z.; funding acquisition, Y.S., Y.X. and X.D. All authors have read and agreed to the published version of the manuscript.

Funding

This research were funded by [Guangdong Academy of Sciences] grant number [2021GDASYL-20210103099, 2021GDASYL-20210103102, 2020GDASYL-20200302017]; [Guangzhou Science and Technology Project] grant number [202102020844]; [Guangdong Province Key Area R and D Program] grant number [2019B010940001]; [Sichuan University of Science and Engineering] grant number [2017RCL44]; [Open Project Program of Chemical Synthesis and Pollution Control Key Laboratory of Sichuan Province] grant number [CSPC202011].

Institutional Review Board Statement

Not applicable.

Informed Consent Statement

Not applicable.

Data Availability Statement

The data that support the findings of this study are available from the corresponding author upon reasonable request.

Acknowledgments

The authors appreciate the financial support from the Guangdong Academy of Science (Grant No. 2021GDASYL-20210103099), (Grant No. 2021GDASYL-20210103102), (Grant No. 2020GDASYL-20200302017), Guangdong Province Key Area R and D Program (2019B010940001), Guangzhou Science and Technology Project (202102020844), Sichuan University of Science and Engineering (2017RCL44) and the Open Project Program of Chemical Synthesis and Pollution Control Key Laboratory of Sichuan Province (Grant No. CSPC202011).

Conflicts of Interest

The authors declare no conflict of interest.

References

  1. Wang, Y.L.; Zhuo, L.C.; Yin, E.-H. Progress, challenges and potentials/trends of tungsten-copper (W–Cu) composites/pseudo-alloys: Fabrication, regulation and application. Int. J. Refract. Met. H 2021, 100, 105648. [Google Scholar] [CrossRef]
  2. Jadhav, T.; Shivanand, H.K. Investigation on mechanical and tribological properties of Boron Carbide and CNT reinforced Copper based composites. Int. J. Adv. Res. Ideas Innov. Technol. 2019, 5, 1849–1854. [Google Scholar]
  3. Franczak, A.; Baczewska, J.K. Copper matrix composites reinforced with titanium nitride particles synthesized by mechanical alloying and spark plasma sintering. Metall. Foundry. Eng. 2017, 43, 97–105. [Google Scholar] [CrossRef] [Green Version]
  4. Chen, X.F.; Tao, J.M.; Yi, J.H.; Liu, Y.C.; Bao, R.; Li, C.J.; Tan, S.L.; You, X. Enhancing the strength of carbon nanotubes reinforced copper matrix composites by optimizing the interface structure and dispersion uniformity. Diam. Relat. Mater. 2018, 88, 74–84. [Google Scholar] [CrossRef]
  5. Sobhani, M.; Mirhabibi, A.; Arabi, H.; Brydson, R.D. Effects of in situ formation of TiB2 particles on age hardening behavior of Cu–1 wt% Ti–1 wt% TiB2. Mater. Sci. Eng. A 2013, 577, 16–22. [Google Scholar] [CrossRef]
  6. Xiang, S.Q.; Du, X.J.; Liang, Y.H.; Zhou, M.C.; Zhang, X.F. Optimizing phase interface of titanium carbide-einforced copper matrix composites fabricated by electropulsing-assisted flash sintering. Mater. Sci. Eng. A 2021, 819, 141506. [Google Scholar] [CrossRef]
  7. Cabezas-Villa, J.; Olmos, L.; Vergara-Hernández, H.; Jiménez, O.; Garnica, P.; Bouvard, D.; Flores, M. Constrained sintering and wear properties of Cu−WC composite coatings. Trans. Nonferrous Met. Soc. China 2017, 27, 2214–2224. [Google Scholar] [CrossRef]
  8. Kang, H.K. Microstructure and electrical conductivity of high volume Al2O3-reinforced copper matrix composites produced by plasma spray. Surf. Coat. Technol. 2005, 190, 448–452. [Google Scholar] [CrossRef]
  9. Qin, Y.Q.; Tian, Y.; Zhuang, Y.; Luo, L.M.; Zan, X.; Wu, Y.C. Effects of solid–liquid doping and spark plasma sintering on the microstructure and mechanical properties of Y2O3-doped copper matrix composites. Vacuum 2021, 192, 110436. [Google Scholar] [CrossRef]
  10. Grieseler, R.; Camargo, M.K.; Hopfeld, M.; Schmidt, U.; Bund, A.; Schaaf, P. Copper-MAX-phase composite coatings obtained by electro-co-deposition: A promising material for electrical contacts. Surf. Coat. Technol. 2017, 321, 219–228. [Google Scholar] [CrossRef]
  11. Ramírez-Vinasco, D.; León-Patiño, C.A.; Nanko, M.; Aguilar-Reyes, E.A. Consolidation behaviour of Cu/AlN composites by pulse electric current sintering of copper-coated aluminum nitride precursors. Powder Technol. 2021, 377, 723–732. [Google Scholar] [CrossRef]
  12. Zhou, H.; Yao, P.; Xiao, Y.; Fan, K.; Zhang, Z.; Gong, T.; Zhao, L.; Deng, M.; Liu, C.; Ling, P. Friction and wear maps of copper metal matrix composites with different iron volume content. Tribol. International. 2019, 132, 199–210. [Google Scholar] [CrossRef]
  13. Alaneme, K.K.; Odoni, B.U. Mechanical properties, wear and corrosion behavior of copper matrix composites reinforced with steel machining chips. Eng. Sci. Technol. Int. J. 2016, 19, 1593–1599. [Google Scholar] [CrossRef] [Green Version]
  14. Mousa, S.; Atta, M.; Abd-Elhady, A.A.; Abu-Sinna, A.; Bafakeeh, O.; Sallam, H.E.M. Mechanical and Bond Behavior of an Advanced Quranic Metal-Matrix Composite Material (QMMC). In Proceedings of the ASME 2019 14th International Manufacturing Science and Engineering Conference, Processes; Materials, Erie, PA, USA, 10–14 June 2019; Volume 2. V002T03A084. [Google Scholar] [CrossRef]
  15. Dai, S.G.; Li, J.W.; Lu, N.X. Research progress of diamond/copper composites with high thermal conductivity. Diam. Relat. Mater. 2020, 108, 107993. [Google Scholar] [CrossRef]
  16. Jang, J.H.; Park, H.K.; Lee, J.H.; Lim, J.W.; Oh, I.H. Effect of volume fraction and unidirectional orientation controlled graphite on thermal properties of graphite/copper composites. Compos. B Eng. 2020, 183, 107735. [Google Scholar] [CrossRef]
  17. Chen, L.; Hou, Z.C.; Liu, Y.F.; Luan, C.; Zhu, L.; Li, W.Z. High strength and high ductility copper matrix composite reinforced by graded distribution of carbon nanotubes. Compos. Part A 2020, 138, 106063. [Google Scholar] [CrossRef]
  18. Si, X.Y.; Li, M.; Chen, F.Y.; Eklund, P.; Xue, J.M.; Huang, F.; Du, S.Y.; Huang, Q. Effect of carbide interlayers on the microstructure and properties of graphene-nanoplatelet-reinforced copper matrix composites. Mater. Sci. Eng. A 2017, 708, 311–318. [Google Scholar] [CrossRef]
  19. Gupta, A.; Ghosh, T.; Jacob, C. The influence of diluent gas composition and temperature on SiC nanopowder formation by CVD. J. Mater Sci. 2007, 42, 5142–5146. [Google Scholar] [CrossRef]
  20. Meng, G.; Cui, Z.; Zhang, L.; Phillipp, F. Growth and characterization of nanostructured β-SiC via carbothermal reduction of SiO2 xerogels containing carbon nanoparticles. J. Cryst. Growth 2000, 209, 801–806. [Google Scholar] [CrossRef]
  21. Feng, J.; Liang, S.H.; Guo, X.H.; Zhang, Y.; Song, K.X. Electrical conductivity anisotropy of copper matrix composites reinforced with SiC whiskers. Nanotechnol. Rev. 2019, 8, 285–292. [Google Scholar] [CrossRef]
  22. Asgharzadeh, H.; Eslami, S. Effect of reduced graphene oxide nanoplatelets content on the mechanical and electrical properties of copper matrix composite. J. Alloy. Compd. 2019, 806, 553–565. [Google Scholar] [CrossRef]
  23. Dhokey, N.B.; Paretkar, R.K. Study of wear mechanisms in copper-based SiCp (20% by volume) reinforced composite. Wear 2008, 265, 117–133. [Google Scholar] [CrossRef]
  24. Brendel, A.; Woltersdorf, J.; Pippel, E.; Bolt, H. Titanium as coupling agent in SiC fibre reinforced copper matrix composites. Mater. Chem. Phys. 2005, 91, 116–123. [Google Scholar] [CrossRef]
  25. Luo, X.; Yang, Y.Q.; Liu, Y.C.; Ma, Z.J.; Yuan, M.N.; Chen, Y. The fabrication and property of SiC fiber reinforced copper matrix composites. Mater. Sci. Eng. A 2007, 459, 244–250. [Google Scholar] [CrossRef]
  26. Akbarpour, M.R.; Salahi, E.; Hesari, F.A.; Yoon, E.Y.; Kim, H.S.; Simchi, A. Microstructural development and mechanical properties of nanostructured copper reinforced with SiC nanoparticles. Mater. Sci. Eng. A 2013, 568, 33–39. [Google Scholar] [CrossRef]
  27. Somani, N.; Tyagi, Y.; Kumar, P.; Srivastava, V.; Bhowmick, H. Enhanced tribological properties of SiC reinforced copper metal matrix composites. Mater. Res. Express 2018, 6, 016549. [Google Scholar] [CrossRef]
  28. Rado, C.; Drevet, B.; Eustathopoulos, N. The role of compound formation in reactive wetting: The Cu/SiC system. Acta Mater. 2000, 48, 4483–4491. [Google Scholar] [CrossRef]
  29. Jarząbek, D.M.; Milczarek, M.; Wojciechowski, T.; Dziekoński, C.; Chmielewski, M. The effect of metal coatings on the interfacial bonding strength of ceramics to copper in sintered Cu-SiC composites. Ceram. Int. 2017, 43, 5283–5291. [Google Scholar] [CrossRef]
  30. Zhang, L.; Qu, X.; Duan, B.; He, X.; Ren, S.; Qin, M. Microstructure and thermo-mechanical properties of pressure less infiltrated SiCp/Cu composites. Compos. Sci. Technol. 2008, 68, 2731–2738. [Google Scholar] [CrossRef]
  31. Chen, G.; Yang, W.; Dong, R.; Hussain, M.; Wu, G. Interfacial microstructure and its effect on thermal conductivity of SiCp/Cu composites. Mater Des. 2014, 63, 109–114. [Google Scholar] [CrossRef]
  32. Strojny-Nędza, A.; Pietrzak, K.; Teodorczyk, M.; Basista, M.; Węglewski, W.; Chmielewski, M. Influence of Material Coating on the Heat Transfer in A Layered Cu-SiC-Cu system. Arch. Metall. Mater. 2017, 62, 1311–1314. [Google Scholar] [CrossRef] [Green Version]
  33. Zhou, Y.G.; Hu, M. Mechanical behaviors of nanocrystalline Cu/SiC composites: An atomistic investigation. Comput. Mater. Sci. 2017, 129, 129–136. [Google Scholar] [CrossRef] [Green Version]
  34. Xiong, Y.; Hu, W.; Shu, Y.; Luo, X.; Zhang, Z.; He, J.; Yin, C.; Zheng, K. Atomistic simulation on the generation of defects in Cu/SiC composites during cooling. J. Mater. Sci. Technol. 2021, accepted (in press). [Google Scholar]
  35. Zhang, K.; Zhan, Y.Z. Adhesion strength and stability of Cu(111)/TiC(111) interface in composite coatings by first principles study. Vacuum 2019, 165, 215–222. [Google Scholar] [CrossRef]
  36. Shu, Y.; Xiong, Y.N.; Luo, X.; Zhang, Z.B.; He, J.Z.; Yin, C.C.; Ding, X.Y.; Zhang, S.W.; Zheng, K.H. Adhesion strength, stability and electronic properties of TiB2 reinforced copper matrix composites: A first principles study. Phycia B 2022, 625C, 413457. [Google Scholar] [CrossRef]
  37. Wu, Z.; Pang, M.; Zhan, Y.; Shu, S.; Xiong, L.; Li, Z. The bonding characteristics of the Cu(111)/WC(0001) interface: An insight from first-principle calculations. Vacuum 2021, 191, 110218. [Google Scholar] [CrossRef]
  38. Kracica, M.; Mayes EL, H.; Tran, H.N.; Holland, A.S.; McCulloch, D.G.; Partridge, J.G. Rectifying electrical contacts to n-type 6H–SiC formed from energetically deposited carbon. Carbon 2016, 102, 141–144. [Google Scholar] [CrossRef]
  39. Smith, S.R.; Evwaraye, A.O.; Mitchel, W.C. Admittance Spectroscopy of 6H, 4H, and 15R Silicon Carbide. Phys. Stat. Sol. A 1997, 162, 227–238. [Google Scholar] [CrossRef]
  40. Schadt, M.; Pensl, G.; Devaty, R.P.; Choyke, W.J.; Stein, R.; Stephani, D. Anisotropy of the electron Hall mobility in 4H, 6H, and 15R silicon carbide. Appl. Phys. Lett. 1994, 65, 3120–3122. [Google Scholar] [CrossRef]
  41. Segall, M.D.; Lindan, P.J.D.; Probert, M.J.; Pickard, C.J.; Hasnip, P.J.; Clark, S.J.; Payne, M.C. First-principles simulation: Ideas, illustrations and the CASTEP code. J. Phys. Condens. Matter. 2002, 14, 2717–2744. [Google Scholar] [CrossRef]
  42. Clark, S.J.; Segall, M.D.; Pickard, C.J.; Hasnip, P.J.; Probert, M.J.; Refson, K.; Payne, M.C. First principles methods using CASTEP. Z. Für Krist. 2005, 220, 567–570. [Google Scholar] [CrossRef] [Green Version]
  43. Perdew, J.P.; Burke, K.; Wang, Y. Generalized gradient approximation for the exchange-correlation hole of a many-electron system. Phys. Rev. B 1996, 54, 16533–16539. [Google Scholar] [CrossRef] [Green Version]
  44. Monkhorst, H.J.; Pack, J.D. Special points for Brillouin-zone integrations. Phys. Rev. B 1976, 13, 5188–5192. [Google Scholar] [CrossRef]
  45. Fischer, T.H.; Almlof, J. General methods for geometry and wave function optimization. J. Phys. Chem. 1992, 96, 9768–9774. [Google Scholar] [CrossRef]
  46. Wu, Z.; Cohen, R.E. A More accurate generalized gradient approximation for solids. Phys. Rev. B 2006, 73, 235116. [Google Scholar] [CrossRef] [Green Version]
  47. Wu, Q.J.; Xie, J.P.; Wang, C.Q.; Li, L.B.; Wang, A.Q.; Mao, A.X. First-principles study of the structure properties of Al(111)/6H-SiC(0001) interfaces. Surf. Sci. 2018, 670, 1–7. [Google Scholar] [CrossRef]
  48. Wu, Q.J.; Xie, J.P.; Wang, A.Q.; Wang, C.Q.; Mao, A.X. Effects of vacancies at Al(1 1 1)/6H-SiC(0001) interfaces on deformation behavior: A first-principle study. Comput. Mater. Sci. 2019, 158, 110–116. [Google Scholar] [CrossRef]
  49. Yan, Y.L.; Men, B.Q.; Liu, G.S.; Zheng, H.W. Effect of vacancies on magnetic behaviors of Cu-doped 6H-SiC. Appl. Phys. A 2014, 117, 841–845. [Google Scholar] [CrossRef]
  50. Wang, C.Q.; Chang, D.H.; Jia, Y.; Xie, J.P. Electronic and mechanical properties of Al(100)/6H-SiC(0001) interfaces: A first-principles study. Mater. Res. Express 2019, 12, 126316. [Google Scholar] [CrossRef]
  51. Hong, M.H.; Samant, A.V.; Pirouz., P. Stacking fault energy of 6H-SiC and 4H-SiC single crystals. Philos. Mag. A 2000, 80, 919–935. [Google Scholar] [CrossRef]
  52. Du, J.L.; Wen, B.; Melnik, R.; Kawazoe, Y. Phase stability, elastic and electronic properties of Cu–Zr binary system intermetallic compounds: A first-principles study. J. Alloy. Comp. 2014, 588, 96–102. [Google Scholar] [CrossRef]
  53. Zhu, Y.D.; Yan, M.F.; Zhang, Y.X.; Zhang, C.S. First-principles investigation of structural, mechanical and electronic properties for Cu–Ti intermetallics. Comput. Mater. Sci. 2016, 123, 70–78. [Google Scholar] [CrossRef]
  54. Ellner, M.; Kolatschek, K.; Predel, B. On the partial atomic volume and the partial molar enthalpy of aluminium in some phases with Cu and Cu3Au structures. J. Less Common Met. 1991, 170, 171–184. [Google Scholar] [CrossRef]
  55. Xu, X.Y.; Wang, H.Y.; Zha, M.; Wang, C.; Yang, Z.Z.; Jiang, Q.C. Effects of Ti, Si, Mg and Cu additions on interfacial properties and electronic structure of Al(111)/4H-SiC(0001) interface: A first-principles study. Appl. Surf. Sci. 2018, 437, 103–109. [Google Scholar] [CrossRef]
  56. Guo, W.B.; Bian, W.S.; Xue, H.T.; Zhang, X.M. Promoting wetting of Mg on the SiC surfaces by addition of Al, Zn and Zr elements: A study via first-principle calculations. J. Magnes. Alloy 2021, (in press). [Google Scholar] [CrossRef]
  57. Zhang, W.; Smith, J.R.; Evans, A.G. The connection between ab initio calculations and interface adhesion measurements on metal/oxide systems: Ni/Al2O3 and Cu/Al2O3. Acta Mater. 2002, 50, 3803–3816. [Google Scholar] [CrossRef]
  58. Appelbaum, J.A.; Hamann, D.R. Electronic structure of the Cu (111) surface. Solid State Commun. 1978, 27, 881–883. [Google Scholar] [CrossRef]
  59. Zhao, G.L.; Smith, J.R.; Raynolds, J.; Srolovitz, D.J. First-principles study of the α-Al2O3(0001)/Cu(111) Interface. Interface Sci. 1996, 3, 289–302. [Google Scholar] [CrossRef] [Green Version]
  60. Matito, E.; Silvi, B.; Duran, M.; Solà, M. Electron localization function at the correlated level. J. Chem. Phys. 2006, 125, 24301. [Google Scholar] [CrossRef] [Green Version]
  61. Povstenko, Y.Z. Theoretical investigation of phenomena caused by heterogeneous surface tension in solids. J. Mech. Phys. Solids 1993, 41, 1499–1514. [Google Scholar] [CrossRef]
  62. Psakhie, S.G.; Shilko, E.V.; Grigoriev, A.S.; Astafurov, S.V.; Dimaki, A.V.; Smolin, A.Y. A mathematical model of particle-particle interaction for discrete element based modeling of deformation and fracture of heterogeneous elastic-plastic materials. Eng. Fract. Mech. 2014, 130, 96–115. [Google Scholar] [CrossRef]
  63. Wu, X.L.; Zhu, Z.T. Heterogeneous materials: A new class of materials with unprecedented mechanical properties. Mater. Res. Lett. 2017, 5, 527–532. [Google Scholar] [CrossRef]
  64. Li, Y.F.; Xiao, B.; Wang, G.L.; Sun, L.; Zheng, Q.L.; Liu, Z.W.; Gao, Y.M. Revealing the novel fracture mechanism of the interfaces of TiB2/Fe composite from a first principles investigation. Acta. Mater. 2018, 156, 228–244. [Google Scholar] [CrossRef]
Figure 1. 6H-SiC Reinforced Copper Matrix Composite Models: (A) Carbon-terminated (CT)-6H-SiC(0001)/Cu(111) interfacial models, (B) silicon-terminated (ST)-6H-SiC(0001)/Cu(111) interfacial models. The above graphs represent side views of the 6H-SiC(0001)/Cu(111). Under the side view graphs is a top view of the 6H-SiC(0001)/Cu(111).
Crystals 12 00051 g001aCrystals 12 00051 g001b
Figure 2. Surface energy of 6H-SiC(0001) with respect to Si chemical potential change.
Crystals 12 00051 g002
Figure 3. Interfacial distance and work of adhesions for 6H-SiC(0001)/Cu(111): (a) CT-6H-SiC(0001)/Cu(111) interfaces; (b) ST-6H-SiC(0001)/Cu(111) interfaces.
Crystals 12 00051 g003
Figure 4. Interfacial energy of the 6H-SiC/Cu composite models: (a) CT-6H-SiC(0001)/Cu(111) interfacial energies; (b) ST-6H-SiC(0001)/Cu(111) interfacial energy.
Crystals 12 00051 g004
Figure 5. Charge density distribution of the interfacial atoms of all “(a)” types of 6H-SiC(0001)/Cu(111) interfacial models along (211) interface (eV/Å3). (a) CT-HCP(a); (b) CT-MT(a); (c) CT-OT(a); (d) ST-HCP(a); (e) ST-MT(a); (f) ST-OT(a).
Crystals 12 00051 g005
Figure 6. Charge density difference of the interfacial atoms of all “(a)” types of 6H-SiC(0001)/Cu(111) interfacial models along (211) interface (eV/Å3). (a) CT-HCP(a); (b) CT-MT(a); (c) CT-OT(a); (d) ST-HCP(a); (e) ST-MT(a); (f) ST-OT(a).
Crystals 12 00051 g006
Figure 7. Electron localization function of the interfacial atoms of all “(a)” types of 6H-SiC(0001)/Cu(111) interfacial models along (211) interface (eV/Å3). (a) CT-HCP(a); (b) CT-MT(a); (c) CT-OT(a); (d) ST-HCP(a); (e) ST-MT(a); (f) ST-OT(a).
Crystals 12 00051 g007
Figure 8. Partial density of state of the interfacial atoms of all “(a)” types of 6H-SiC(0001)/Cu(111) interfacial models. (a) CT-HCP(a); (b) CT-MT(a); (c) CT-OT(a); (d) ST-HCP(a); (e) ST-MT(a); (f) ST-OT(a).
Crystals 12 00051 g008
Figure 9. Strain vs. stress of the 6H-SiC(0001)/Cu(111). (a) The profiles of tensile stress vs. engineering strain of the CT-6H-SiC(0001)/Cu(111), (b) partial enlargement of the tensile stress vs. engineering strain of the CT-6H-SiC(0001)/Cu(111) around the ultimate tensile strength, (c) the profiles of tensile stress vs. engineering strain of the ST-6H-SiC(0001)/Cu(111), (d) partial enlargement of the tensile stress vs. engineering strain of the ST-6H-SiC(0001)/Cu(111) around the ultimate tensile strength.
Crystals 12 00051 g009aCrystals 12 00051 g009b
Table 1. Simulated and experimental cell parameters of the 6H-SiC and Cu bulks.
BulksMethoda (Å)c (Å)Vo
6H-SiCGGA [this work]3.08515.123143.93
GGA [47]3.07815.114143.19
GGA [48]3.07915.110143.25
GGA [49]3.08115.117143.50
GGA [50]3.0915.17144.85
Exp. [51]3.0815.08143.05
GGA [this work]3.6283.62847.77
GGA [35]3.6273.62747.71
CuGGA [52]3.6363.63648.07
GGA [53]3.6313.63147.87
Exp. [54]3.6153.61547.24
Table 2. 6H-SiC(0001) and Cu(111) surface relaxations as a function of termination and slab thickness.
SurfacesInterlayer Slab   Thickness   ( n ) ,   Δ i j (%)
35791113
ST-6H-SiC(0001)Δ12−1.13−0.08−0.21−0.16−0.21−0.22
Δ23 1.340.090.03−0.10−0.16
Δ34 −0.19−0.19−0.18−0.30
Δ45 0.08−0.18−0.35
Δ56 −0.32−0.42
Δ67 −0.49
CT-6H-SiC(0001)Δ12−11.0−3.69−5.83−6.47−6.55−6.51
Δ23 5.072.332.282.572.20
Δ34 −1.10−1.56−0.97−1.49
Δ45 −0.37−0.37−0.24
Δ56 −0.09−0.55
Δ67 −0.18
Cu(111)Δ121.320.330.590.920.07−0.13
Δ23-0.680.721.041.010.85
Δ34- 0.891.320.531.05
Δ45- 1.080.720.88
Δ56- 0.740.79
Δ67 0.75
Table 3. Calculated surface energy of Cu(111).
EntrySurface Energy (J·m−2)
Cu(111)1.39 [this work]1.32 [35]1.36 [36]1.2 [58]1.40 [57]2.07 [59] (unrelaxed)
Table 4. The interfacial elastic energy of SiC(0001)/Cu(111).
EntryAtomic
Termination
G1 (GPa)G2 (GPa)D1 (×10−12m)D2 (×10−12m)ν2γes (J·m−2)
ST-6H
SiC(0001)/Cu(111)
ST-HCP(a)191.0078.73263.5361.50.2662.63
ST-MT(a)191.0078.73244.5359.60.2662.88
ST-OT(a)191.0078.73197.7357.50.2663.50
ST-HCP(b)191.0078.73246.3358.70.2662.84
ST-MT(b)191.0078.73238.13600.2662.98
ST-OT-(b)191.0078.73198.4359.20.2663.52
ST-HCP(c)191.0078.73198358.70.2663.51
ST-MT(c)191.0078.73247.83600.2662.84
ST-OT(c)191.0078.732603580.2662.60
CT-6H
SiC(0001)/Cu(111)
CT-HCP(a)191.0078.73120.83610.2664.80
CT-MT(a)191.0078.73122.5354.50.2664.63
CT-OT(a)191.0078.7393.4359.10.2665.49
CT-HCP(b)191.0078.73123.1353.70.2664.60
CT-MT(b)191.0078.73120.5362.10.2664.83
CT-OT(b)191.0078.73121.3360.80.2664.78
CT-HCP(c)191.0078.7393.5359.30.2665.49
CT-MT(c)191.0078.73121.8362.80.2664.81
CT-OT(c)191.0078.73121.2352.90.2664.62
Table 5. Interfacial fractural mechanism parameters for SiC2/Cu interfaces (J·m−2).
EntryInterfacesWadγesGintGSiC(0001)GCu(111)Gint > Gbulk
ST-6H-
SiC(0001)/Cu(111)
ST-HCP(a)−1.652.63−4.2810.252.78 (2.72 [36])No
ST-MT(a)−1.392.88−4.2710.252.78No
ST-OT(a)−1.663.50−5.1610.252.78No
ST-HCP(b)−1.462.84−4.310.252.78No
ST-MT(b)−1.592.98−4.5710.252.78No
ST-OT(b)−1.803.52−5.3210.252.78No
ST-HCP(c)−1.553.51−5.0610.252.78No
ST-MT(c)−1.322.84−4.1610.252.78No
ST-OT(c)−1.372.60−3.9710.252.78No
CT-6H-SiC(0001)/Cu(111)CT-HCP-a2.764.80−2.0410.252.78No
CT-MT-a2.834.63−1.8310.252.78No
CT-OT-a0.465.49−5.0310.252.78No
CT-HCP-b2.884.60−1.7210.252.78No
CT-MT-b3.344.83−1.4910.252.78No
CT-OT-b2.834.78−1.9510.252.78No
CT-HCP-c0.405.49−5.0910.252.78No
CT-MT-c3.304.81−1.5110.252.78No
CT-OT(c)2.884.62−1.7410.252.78No
Publisher’s Note: MDPI stays neutral with regard to jurisdictional claims in published maps and institutional affiliations.

