Article

Effects of Grain Boundary Angles on Initial Deformation of 304 Austenitic Stainless Steel under Nanoindentation: A Molecular Dynamics Simulation

State Key Laboratory for Mechanical Behavior of Materials, Xi’an Jiaotong University, Xi’an 710049, China
*
Authors to whom correspondence should be addressed.
Crystals 2022, 12(1), 58; https://doi.org/10.3390/cryst12010058
Submission received: 17 December 2021 / Revised: 29 December 2021 / Accepted: 29 December 2021 / Published: 1 January 2022

Abstract

:
Nitrogen-containing 0Cr19Ni10 (304 NG) austenitic stainless steel plays a significant role in Generation IV reactor pressure vessels. The structure and properties of 304 NG are heavily influenced by the grain boundaries (GBs), especially the initial mechanical response and dislocation evolutions. Hence, in this paper, we carried out molecular dynamics (MD) simulations to investigate the effects of the GB angles on the initial deformation of 304 models under nanoindentation. It is found that the GB angle has great effects on the mechanical properties of 304 NG. With the GB angles changing from 90° to 150°, the values of Young’s modulus and maximum shear stress first decrease and then increase due to decreasing of the interaction among the GBs and the grain interiors (GIs) and the smoother shape of GBs. The hardening region slope decreases rapidly result from the GB angles changing the grain size on the both sides, which fully fits the Hall–Petch relationship. After the dislocations reaching the GBs along the slip system, the dislocation piles-up on the GBs at first, and then GBs serve as a source of dislocation and emit dislocation to free surface with the depth of nanoindentation increasing. This work provides a better understanding on the angle effects of GBs in materials.

Graphical Abstract

1. Introduction

As a widely used structural material, 304 austenitic stainless steel has received extensive attention deriving from its excellent comprehensive properties [1,2,3]. In particular, nitrogen-containing 0Cr19Ni10 (304 NG) austenitic stainless steel combines both the high strength level of 304 and the resistance to intergranular corrosion [4,5] of 304 L. Compared with the traditional 0Cr18Ni10Ti (321) stainless steel, 304 NG has the advantages of corrosion resistance [6], no titanium nitride inclusions, and no need for solution treatment after assembly and welding [1,2,7]. Hence, it is a perfect material for the internal components of nuclear reactors [8] and has been proposed for new Generation IV reactor pressure vessels [9].
Recently, numerous studies have been performed on the properties of 304 austenitic stainless steel, including the mechanical properties, corrosion resistance, and so on [10,11,12,13]. Hong et al. [14] found the Cu content and ageing treatment highly affect the microstructural and mechanical corrosion properties of SUS 304 austenitic stainless steel. When the Cu content increases, the number of retained delta-ferrite decreases, the ultimate tensile strength first decreases and then increases, the α’-martensite is suppressed, and the pitting potential decreases. Wang et al. [15] investigated the nano-structural evolutions and mechanical properties of 304 austenitic stainless steel during the rolling deformation. They found that the rolling deformation has great effects on hardness and strength but weak influence on the ductility. Thi et al. [16] studied the effect of strain-induced martensitic transformation local distribution on fracture behaviors of 304 austenitic stainless steel during dynamic loading condition and clarified the mechanism for improved fracture-mechanical characteristics. In addition, some researchers are dedicated to using molecular dynamics (MD) nanoindentation as an effective means to study the microstructure evolution and mechanism of materials during deformations. Luu et al. [17] studied the effect of the optimal choice of parameters on MD nanoindentation with typical body-centered cubic and face-centered cubic materials and provided guidance for MD nanoindentation. AlMotasem et al. [18] investigate the dominant cause of plastic deformation of the ferrite and austenite phase by MD nanoindentation. They found a local softening/hardening at the boundaries. Qu et al. [19] studied the atomistic deformation processes of embeddedtwin boundaries in model. The hardening mechanisms (by introducing nano-scale TBs), the theoretical indentation model (Johnson’s theoretical indentation model), and the dislocation nucleation (TBs as dislocation sources) were analyzed. Talasi et al. [20] investigated mechanical properties of Fe bicrystals with the spherical shape indenter. They found the dislocation nucleation and transition of deformation mode leads to the loading drop and also that GBs affects the elastic modulus, maximum shear stress, and hardness of the Fe bicrystal.
Although researchers have conducted a large number of experiments and simulations, much work still needs to be done on the quantitative analysis of GBs on 304 austenitic stainless steel. Thus, in this work, MD simulation of nanoindentation is carried out to investigate the effects of the GB angles on initial deformation of 304 NG. We constructed the MD models of 304 austenitic stainless steel with different GBs angles, performed nanoindentation simulations on different models, and carefully analyzed the nucleation and evolution of dislocations inside the corresponding samples.

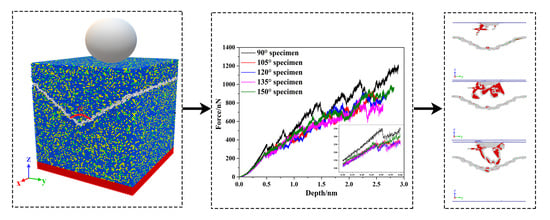
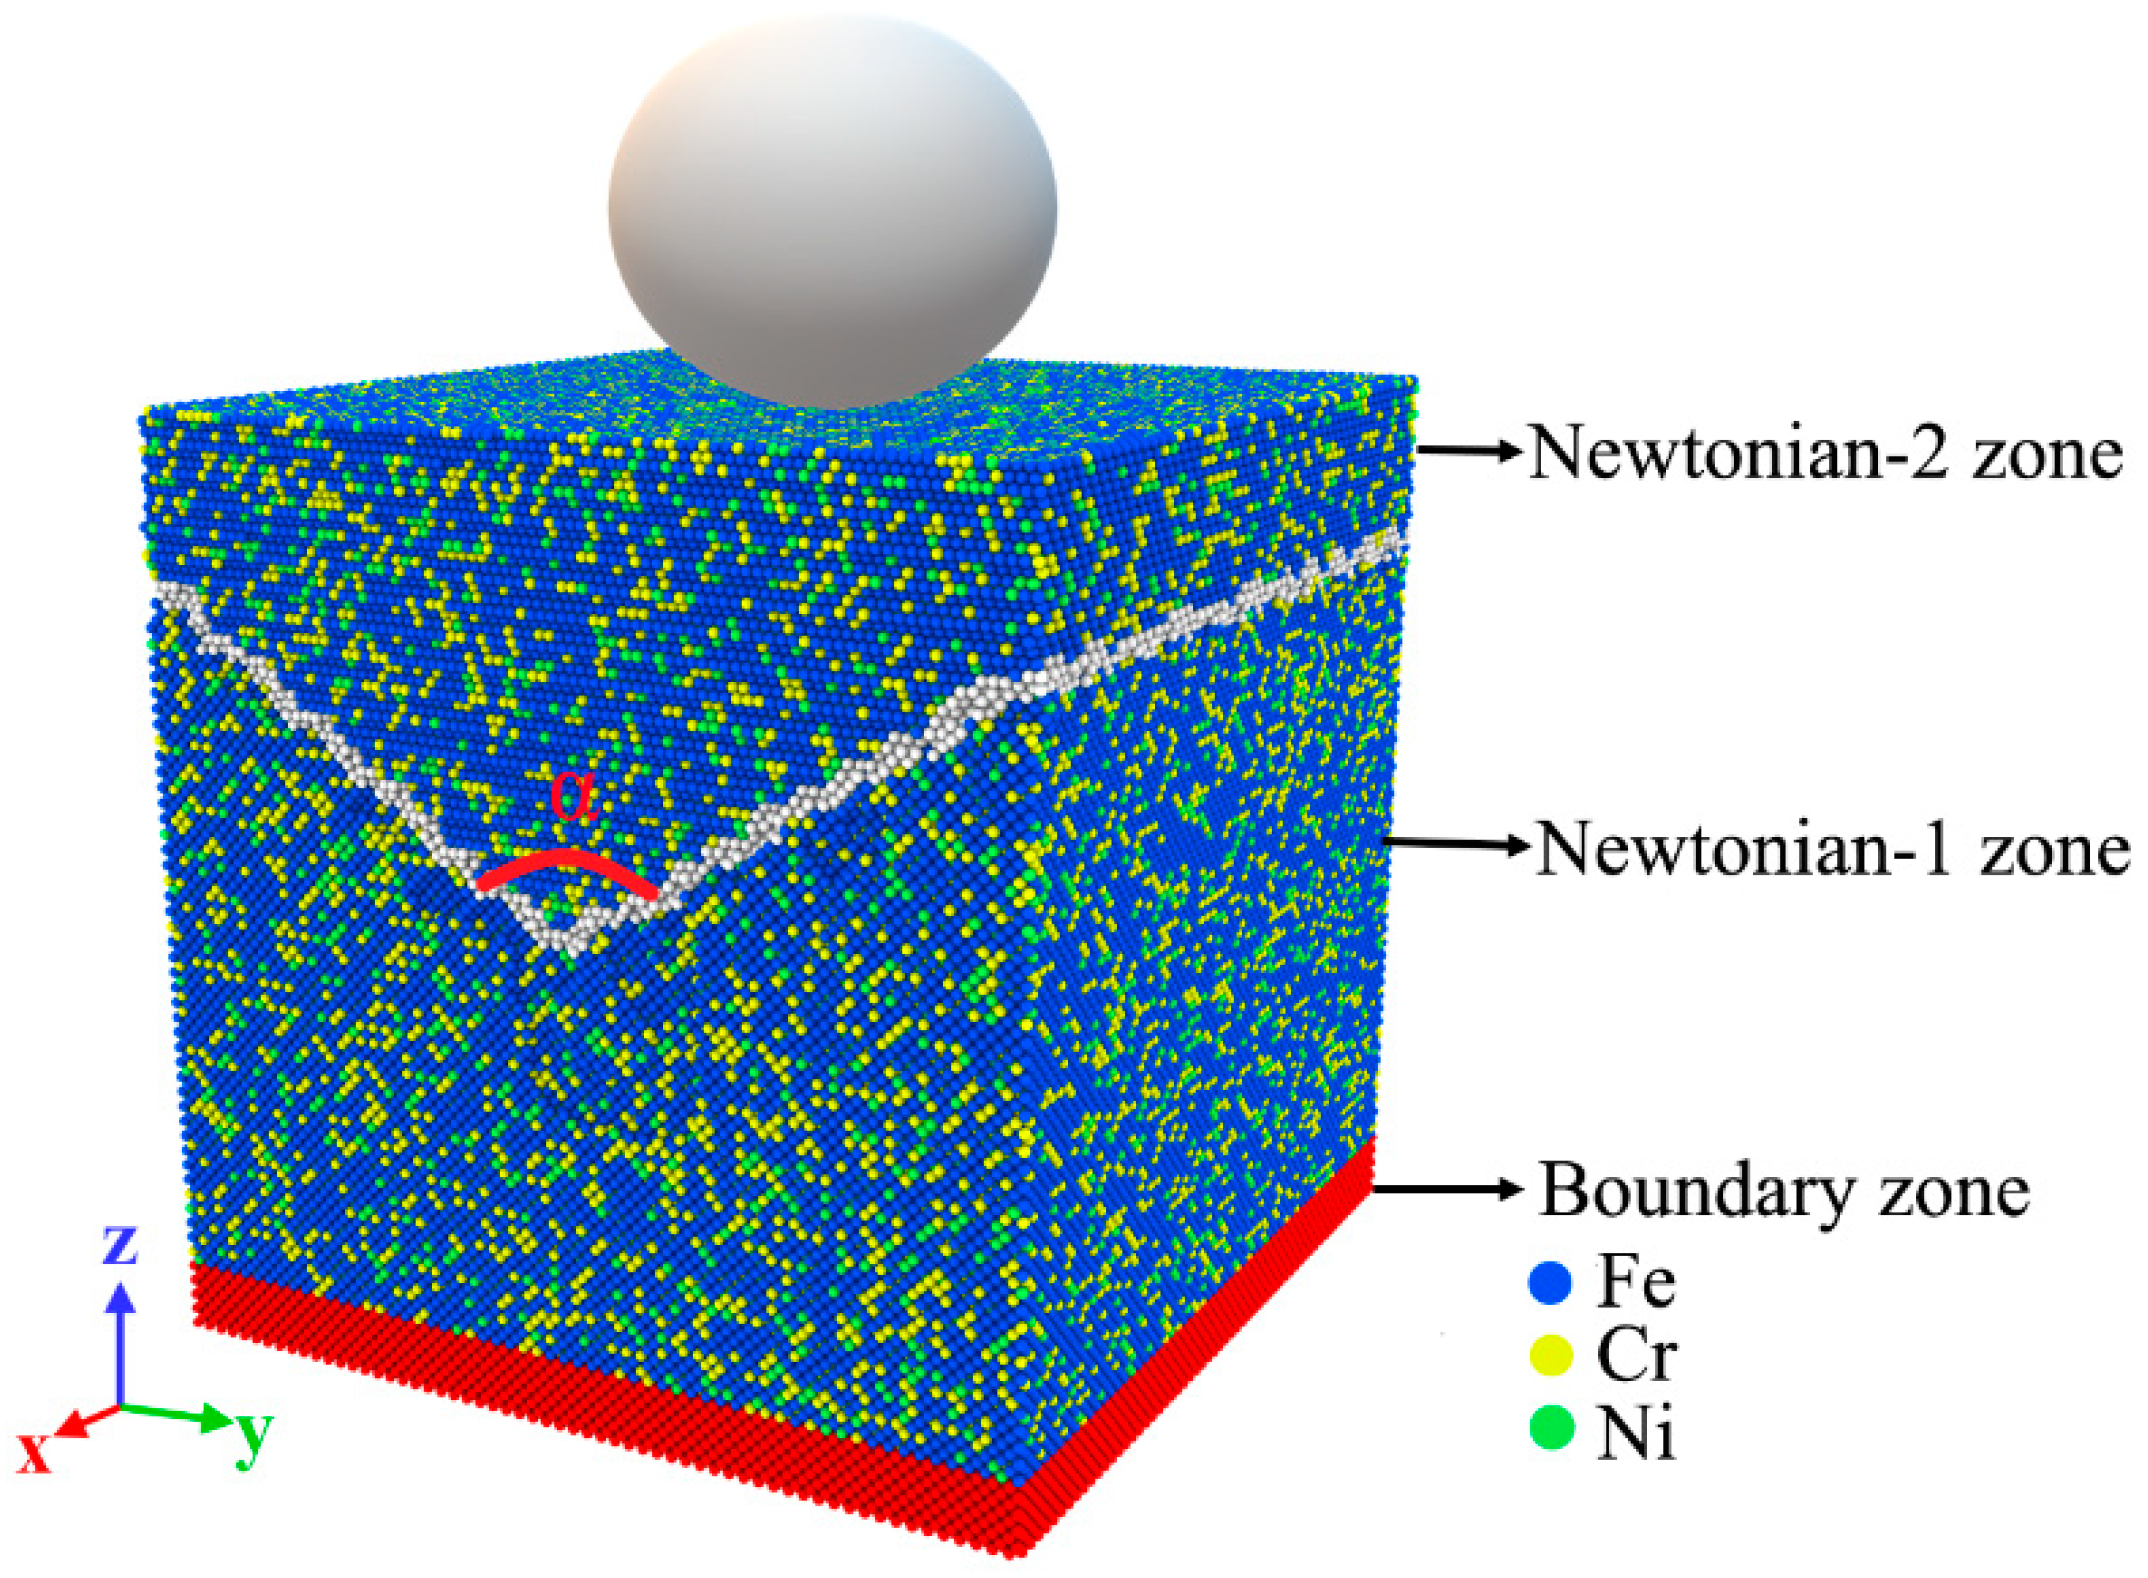
2. Simulation Methods

All work was performed by large-scale atomic/molecular massively parallel simulation (LAMMPS) [21]. The initial atomic configuration of the 304 sample is shown in Figure 1. To explore the effects of the GB angles on initial deformation of 304, we built five different samples with different GB angles α (90°, 105°, 120°, 135°, and 150°) for simulation.
As shown in Figure 1, there are different alloy elements and GB angles in the initial sample. The blue atoms represent iron (Fe) atoms, the yellow atoms represent chromium (Cr) atoms, and the green atoms represent nickel (Ni) atoms. The atom fraction of Fe is 70.35%, Cr is 20.22%, and Ni is 9.43%, based on the experimental elemental mass fraction of 304 NG. The size of the initial sample is 60 a × 60 a × 60 a, where a = 3.562 Å is the lattice of FeCrNi alloy. In the X and Y directions is a periodic boundary condition, however, in the Z direction is a non-periodic and shrink-wrapped with a minimum value boundary condition.
There are ten layers of atoms near the bottom, which is fixed as boundary zone (the layers with red balls). The boundary zone is to prevent the 304 NG substrate from moving during the nanoindentation process. The motion of the remaining atoms is divided into Newtonian-1 zone and Newtonian-2 zone, which follow classical Newton’s second law [22]. In the Newtonian-1 zone, the X, Y, and Z axes are [11 2 ¯ ], [ 1 ¯ 10], and [111] crystal orientation, respectively. In the Newtonian-2 zone, the X, Y, and Z axes are [100], [ 0 10], and [001] crystal orientation, respectively. The nucleation and propagation of dislocations during the nanoindentation process are both performed in the Newtonian-2 zone.
The nanoindentation MD simulations are carried out with a radius of 4 nm virtual spherical indenter, which is positioned above the 304 sample. The virtual spherical indenter moves downwards along Z-axis at a constant velocity of 10 m/s with about 3 nm nanoindentation depth, smaller than the radius of the virtual spherical indenter. The spherical indenter exerts a force of magnitude
F ( r ) = K   ( R r ) 2
on each atom, where K is the specified force constant (in this work, K is set to be 100 eV / Å 3 ), r is the distance from the atom to the center of the virtual spherical indenter, and R is the virtual spherical indenter radius of 4 nm.
The widely used embedded-atom method (EAM) potentials [23,24] developed by Bonny et al. [25] was used to define the interactions of the Fe-Cr-Ni atoms. The EAM potentials have been widely used to study the defects and their evolution in FCC metallic systems [26,27]. In EAM potentials, the interaction of pairwise atoms depends on both electron density and the inter-atoms distance. The equations of the potential are:
U = U e m + E p a i r = i = 1 N F ( ρ i ) + i = 1 N 1 j = i + 1 N U ( r i j )  
ρ i = j = 1 N φ j ( r i j )
where U is total energy, i and j symbolize pairs of atoms of the metallic system, F is the embedding function, which relies on ρ i , and ρ i is the averaged atomic electron density. The expression U   ( r i j ) is an electrostatic pair potential, in which r i j is the interatomic distance.
The Verlet algorithm [28] was used to integrate the equation of motion to accurately obtain the position and velocity of the particles. Before nanoindentation, we first made the metallic system relaxed by energy minimization. The isothermal-isobaric (NPT) ensemble was then imposed to release the stress to zero in all directions [29] for 50 picoseconds (ps). After NPT relaxation, the canonical (NVT) ensemble using Nose–Hoover thermostat [30] was used to optimize the metallic system for 50 ps. It is worth noting that all of the above steps were carried out at 300 K and the timesteps was 1 fs. During the nanoindentation process, the NVT ensemble was applied to control the Newtonian zone at a constant temperature, 300 K. The micro-canonical (NVE) ensemble was applied at the boundary zone. The dislocation extraction algorithm (DXA) was a better way to understand the dislocation evolution during the deformation process under nanoindentation, which was proposed by Stukowski and Albe [31,32]. The common neighbor analysis (CNA) [33] method and assign color method were applied to analyze a local organizational structure and coloring. The detailed assign color scheme can be found in other papers. The software Open Visualization Tool (OVITO) [34] was used for visualizing the atomic configurations, which version is 3.6.0.

3. Results and Discussion

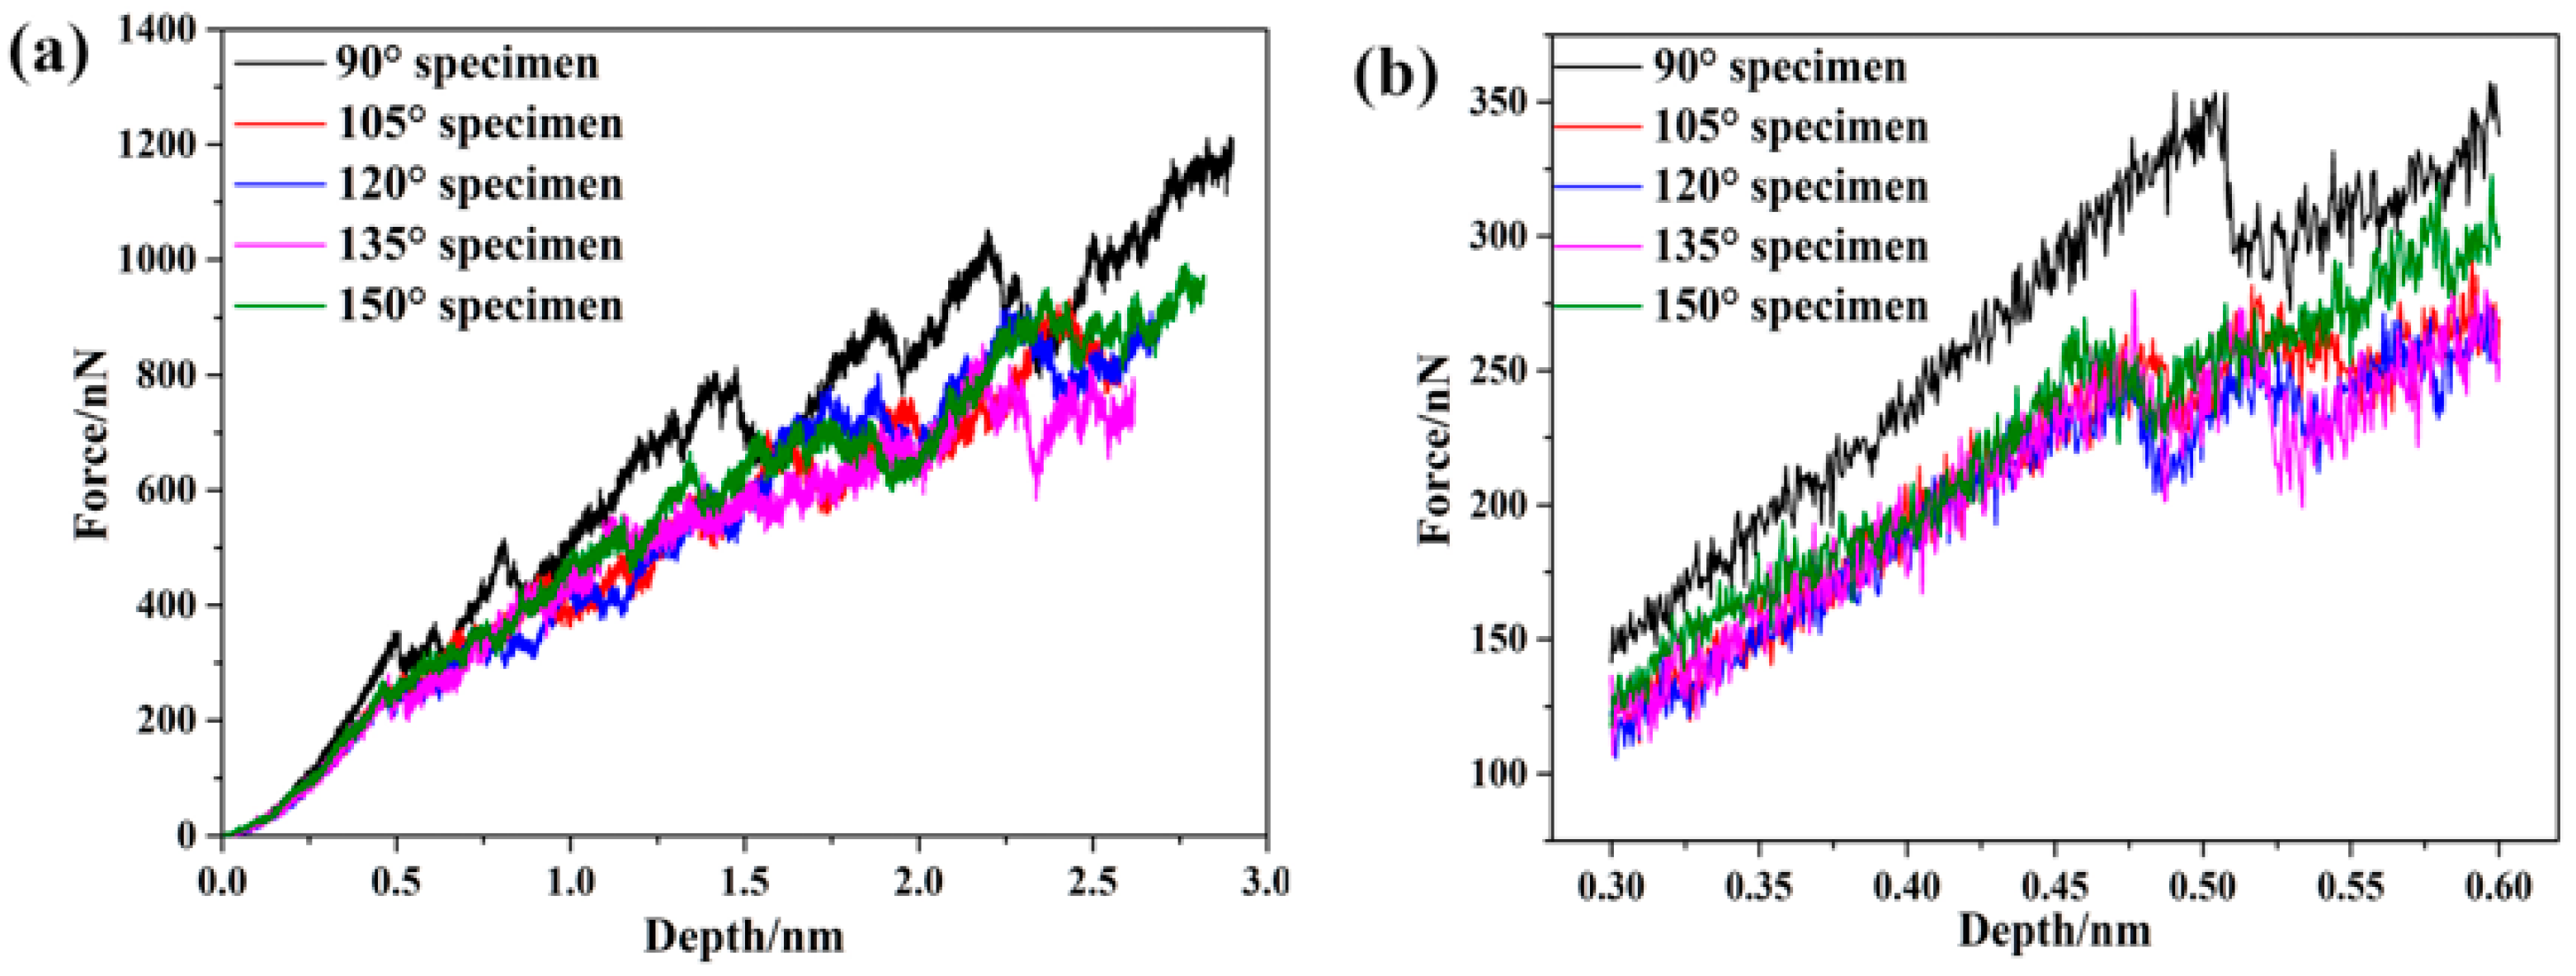
3.1. The Force and Depth Curves of Nanoindentation

The typical nanoindentation force-depth (P-h) curves of all 304 samples are shown in Figure 2. We can see from Figure 2 that the P-h curve of the 90° sample is obviously higher than other samples, indicating that the angle of GBs significantly has great influence on the mechanical properties. In general, the P-h curves of all samples exhibit two stages: elastic and plastic deformation stages. In the elastic deformation stage, the loading force increases with the rise of nanoindentation depth and the loading force of the 90° sample is higher than for other samples. With the increase of GB angle, the nanoindentation depth of the yielding point decreases correspondingly (the nanoindentation depth of yielding is 5.04 Å, 4.82 Å, 4.68 Å, 4.65 Å, and 4.56 Å, respectively). However, the corresponding load force decreases first—the 120° sample is the lowest—and then increases (the corresponding yielding force is 353.42 nN, 255.08 nN, 246.91 nN, 259.76 nN, and 266.17 nN, respectively). Both the yielding depth and yielding force are affected by the GB angle in the elastic deformation stage. In the plastic deformation stage, the load force at the same nanoindentation depth is obviously a discrepancy, as shown in Figure 2. Thus, the GB angles affect the entire nanoindentation process, including the dislocation nucleation at the end of the elastic deformation stage and the multiplication, interaction, and the pile-up of dislocations at the plastic deformation stage.
After the nanoindentation depth reaches the yielding point, the atoms under the virtual spherical indenter leave the lattice position and collapse, then the nucleation embryo of dislocation appears and aggregates to form dislocation lines. The internal energy is released. Therefore, there is a tendency for the load to decrease slightly and then increase, as shown in Figure 2b. The multiplication of dislocation, pile-up, interaction, and dislocation jog occur in the sample with the increase of nanoindentation depth. The propagation and interaction of dislocation in the sample lead to a change in the energy in the system. When the dislocation slip is blocked, the new dislocation will form at the original nanoindentation location. The macroscopic performance is that in the P-h curve, the load force fluctuates, but the overall load force shows an upward trend. Fu et al. [35] report on the effects of interface and hetero-twin interface on mechanical properties. The slip of the stacking fault releases the internal stress, resulting in insignificant strengthening.
As noted above, the GBs in a sample can dramatically affect the mechanical properties of the material. To better understand the effects of GBs in the sample, we carefully examined the dislocation at the nanoindentation depth of yielding for all samples. We analyzed the internal structure of the sample by the DXA method and then obtained the generation of internal defects in the material. A summary of the dislocation initial stage for the different samples is presented in Figure 3. The atoms in perfect FCC lattice structures are removed for clarity.
As shown in Figure 3, a few nucleation embryos have aggregated to form a dislocation line. The slip system of FCC metal materials is the <110> {111} system. In Figure 3, the initial dislocation will expand from subsurface to free surface in the <111> {112} slip system. We observed that the shape of initial dislocation varied for all samples. This is one of the manifestations of the interaction between the GBs and GIs. Meyersm et al. [36] and Benson et al. [37] researched the interaction of GBs and GIs in the elastic deformation stage. The GBs integrate the separated grains together. During the deformation process, the GBs transmit the force between the grains, but they also adjust the deformation of the grains on both sides. There are three factors that affect the interaction between GBs and GIs: stress difference, microplastic deformation of GBs, and continuous GB structure. When the microplastic deformation occurs on the GBs, the stress in GIs is released and the threshold stress of dislocation nucleation, aggregation, and expansion was not reached. This explains the reason for the change trend of the yield point and yield stress of all samples in P-h curves. First, for the GB angle from 90° to 120°, the vertical distance between the nucleation point and the GBs increased, thus the interaction of GBs and the dislocation point in GIs decreased, and the yielding force and the first drop point also decreased, as shown in Figure 2. At the GB angle from 120° to 150°, because the distance between the GBs and the dislocation nucleation point was far enough, the interaction can be almost neglected. At the same time, the GBs angle became larger, the integrity of the grains under the indenter improved, and, at the macroscopic level, the yield strength and yield depth increased.

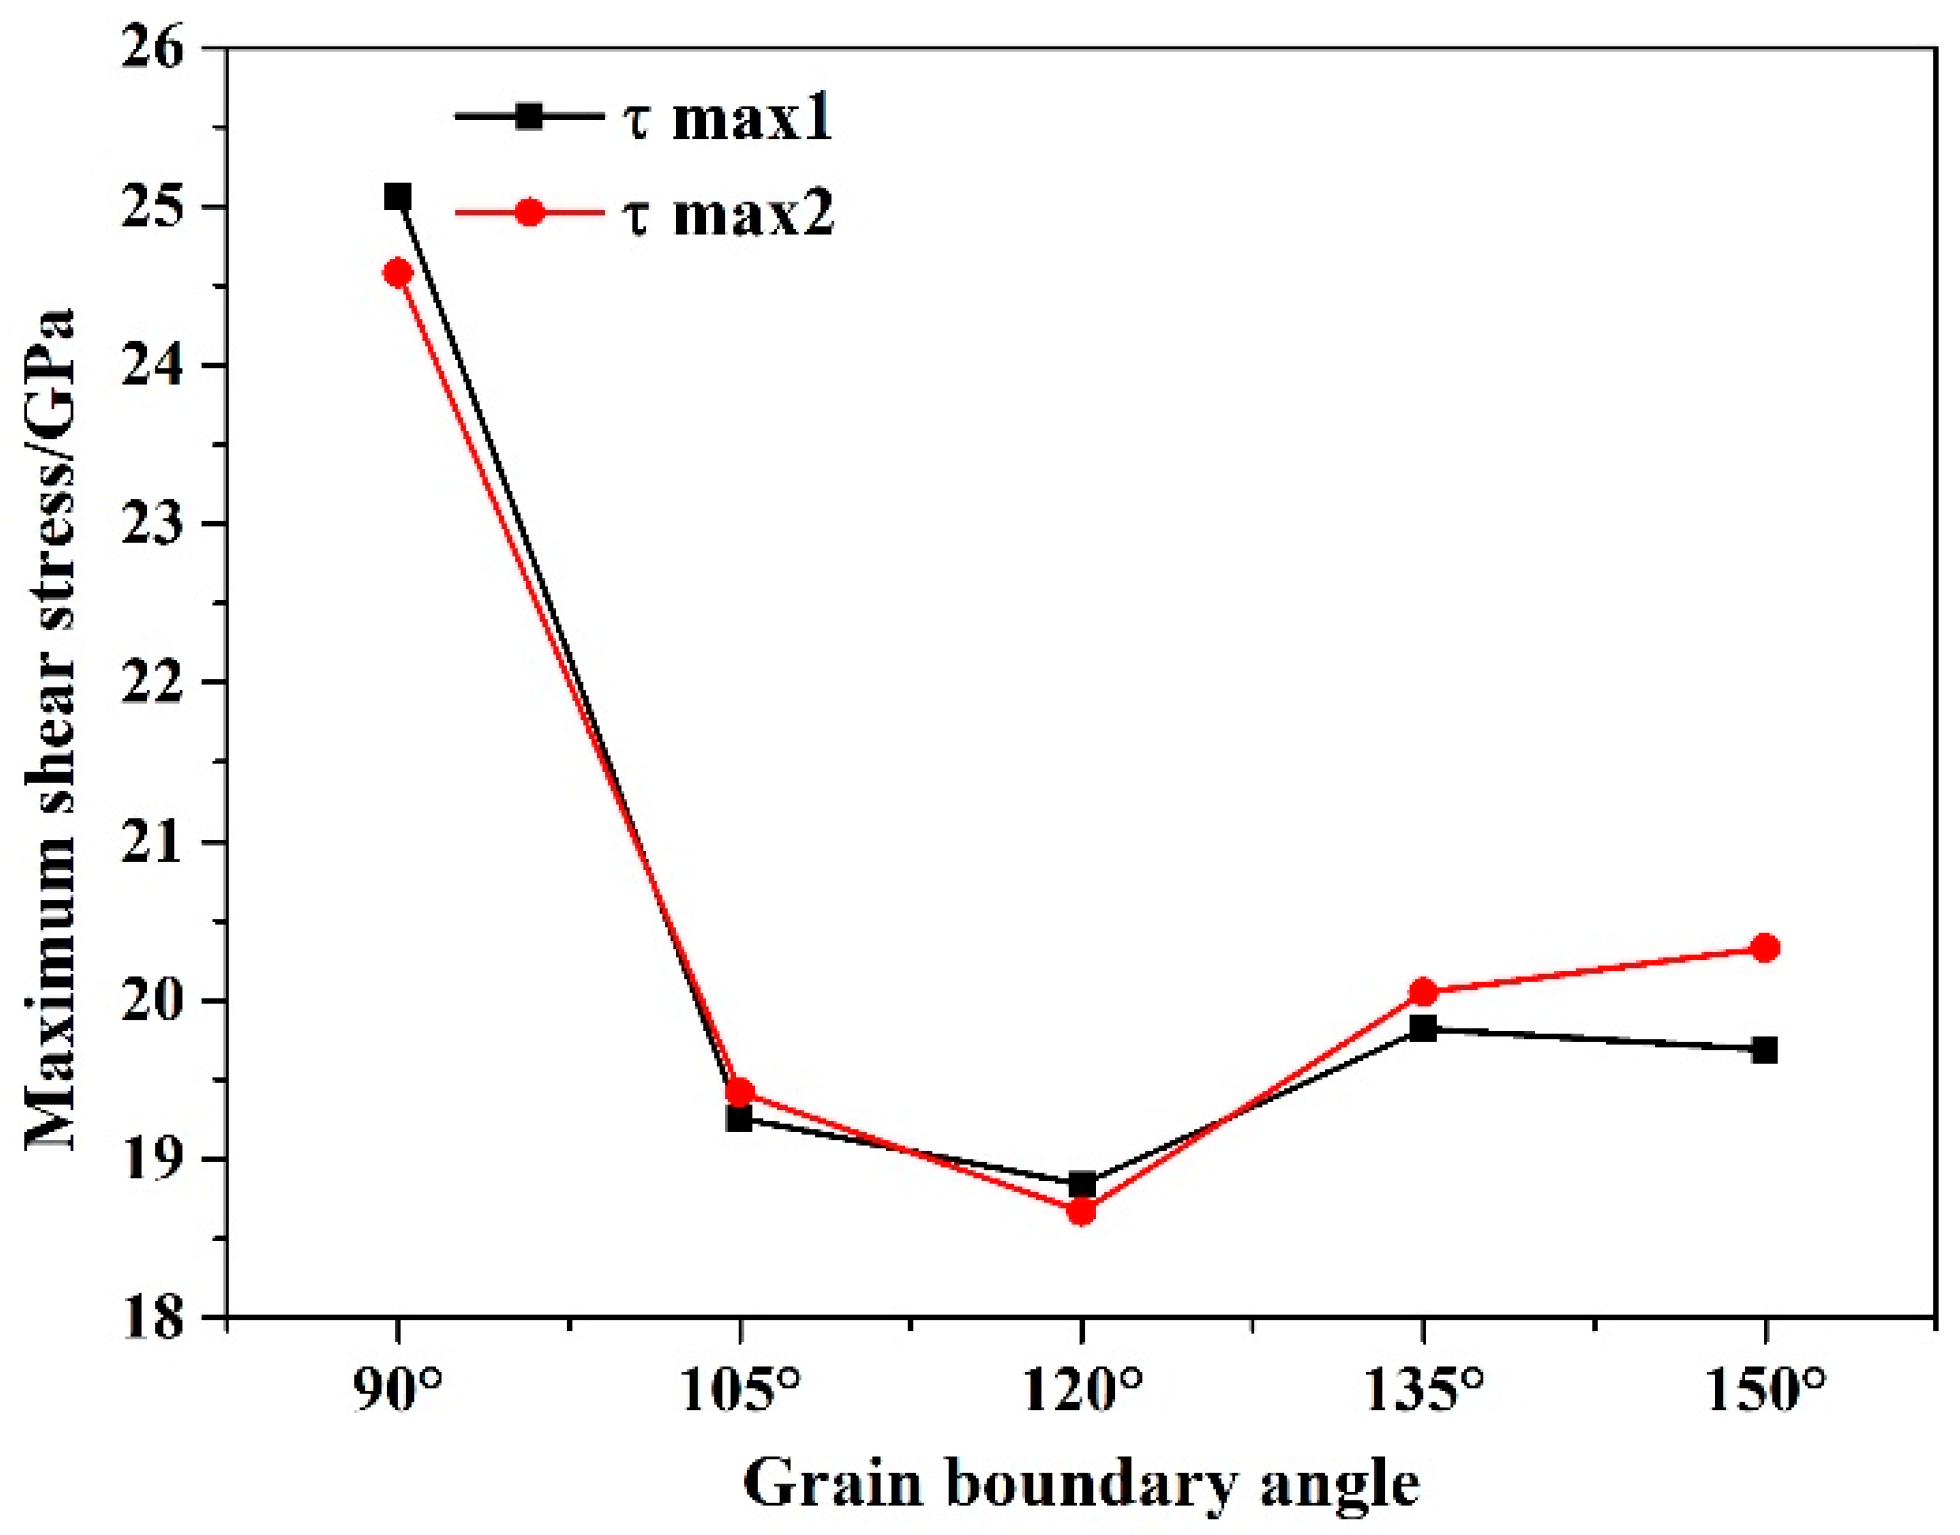
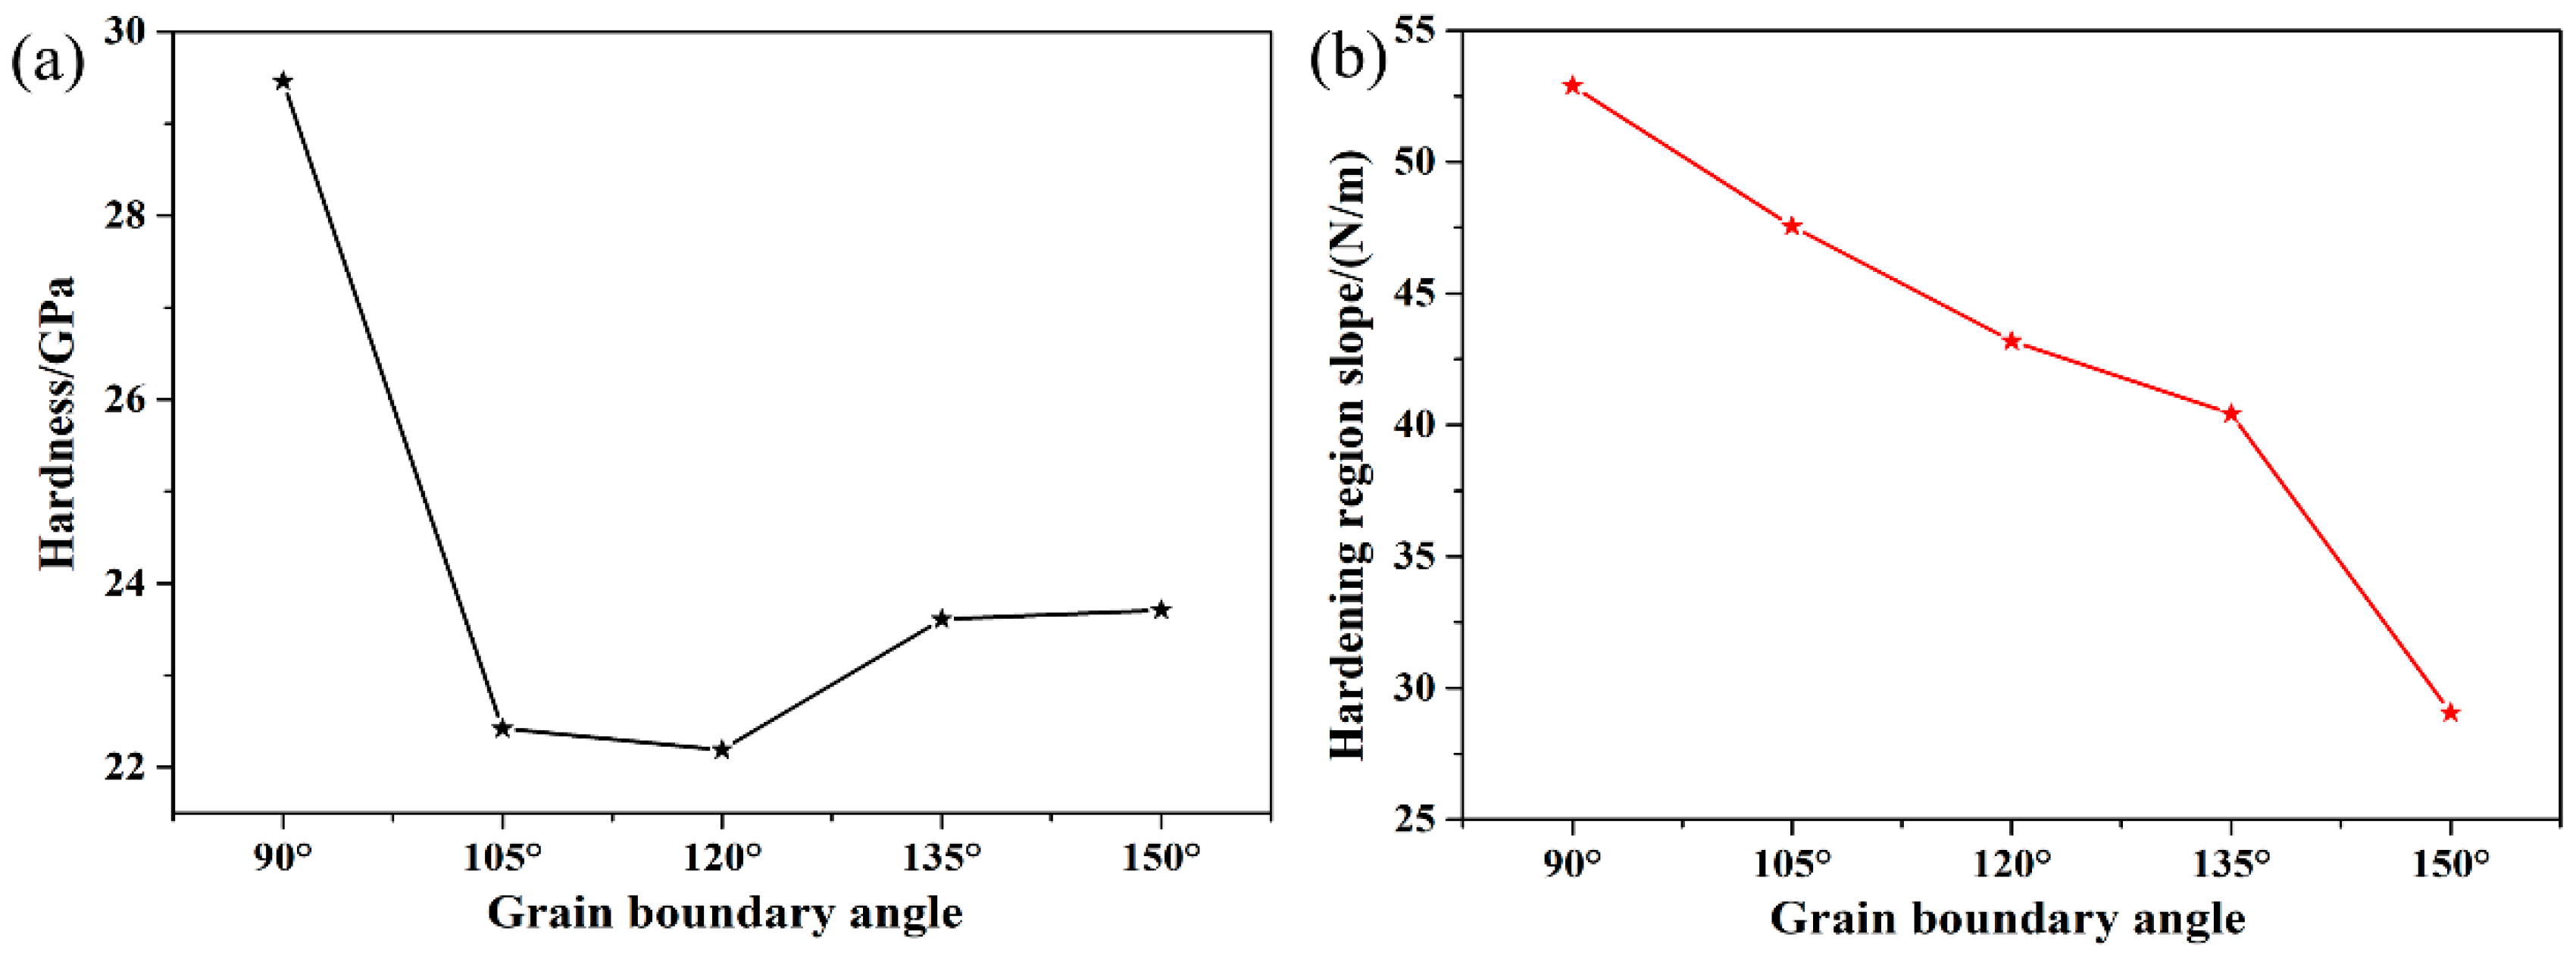
3.2. The Typical Mechanical Parameters of Nanoindentation

As we all know, the Hertz solution [38] is an analysis for elasticity near the contact patch. During the process of nanoindentation, when the nanoindentation depth is shallow, the sample has completely elastic contact. As the nanoindentation depth increases, the inside of the material begins to yield, and plastic deformation occurs. When the nanoindentation depth reaches a certain value, the contact patch shows complete plastic deformation. There are two modes to calculate Young’s modulus, by total nanoindentation depth and contact radius. Hertz found that the relation among the radius of contact patch a, the load force P, the radius of virtual spherical indenter R, and the elastic parameter of the contacting materials Er can be expressed as:
a 3 = 3 4   P R E r
1 E r = 1 v s 2 E s + 1 v i 2 E i
where E s and E i are Young’s modulus for sample and indenter, respectively; v i   and v s are the Poisson’s ratio for sample and indenter, respectively. By fitting Equation (4), we can calculate Young’s modulus of sample for each nanoindentation distance. These results are shown in Table 1. Another method, before the first load force drops, the relation between the load force P and the nanoindentation depth h is described as:
P = 4 3   E r   R 1 / 2   h 3 / 2
All the fitted values of E r by Equations (5) and (6) are shown in Table 1.
Figure 4 shows that the Young’s modulus of nanoindentation simulation varies with the GB angle. First, Young’s modulus is calculated by combining the contact radius with total nanoindentation depth. From Table 1 and Figure 4, we can see that the GB angle in the sample increased from 90° to 150°, and Young’s modulus first decreased and then increased, which is the same as the yielding force. Young’s modulus is mainly determined by the stress in GIs. With the angle of GBs increasing, the vertical distance between the nucleation point and the GBs increased, resulting in the internal stress not releasing smoothly. The internal stress is larger when the angle of GBs increases. Thus, Young’s modulus decreases with the GB angle from 90° to 120°. Moreover, Young’s modulus of the material is affected by the shape of the GBs. With a GB angle from 120° to 150°, the shape of GBs tends to be flat. The grains on both sides of the GBs shows similar force, so the stress fluctuations at GBs are small, and therefore Young’s modulus increases.
As for a spherical indenter, the value of the maximum primary shear stress is estimated to be 0.31 P m a x , where P m a x is the maximum pressure. This maximum shear stress value is obtained by calculating the radial and tangential stress components along the axis of symmetry. Combined with the elastic contact theory and Equation (6), it can be shown that this maximum shear stress is described as:
τ m a x = 0.31   P m a x = 0.31 × ( 6   F   E r 2 π 3   R 2 ) 1 / 3
According to the precise contact area, we can obtain another way to calculate the maximum shear stress. This way is described as:
τ m a x = 0.31   P m a x = 0.465 × P π   a 2
All these maximum shear stress values which calculate by Equations (7) and (8) are shown in Table 1 and Figure 5. These values are approximate, within a very small margin of error.
The maximum shear stress fitted by Equations (7) and (8) is approximate. For all samples, the fitting maximum shear stress is also approximate. It shows that the maximum shear stress is insensitive to the GB angle in the sample. The ideal shear strength of FCC FeCrNi alloy is approximately 178 GPa [39]. According to the theoretical shear strength of the material, the maximum shear stress value is approximately G / 2 π , where G is the ideal shear strength. Hence, the ideal shear stress value is approximately 28.34 GPa. The maximum shear stress fitted is smaller than theoretical shear stress. This is because the presence of GBs increases the number of internal defects in the sample. These maximum shear stresses by Equations (7) and (8) agree well with experimental data.
There are two contact area concepts: the Brinell contact area and the Meyer contact area [40,41]. In this work, the Meyer contact area is used to compute the hardness of the 304 NG sample. Based on the Hertzian theory, we know that contact pressure is the response of the sample in the direction of load. The mean contact pressure between the contact surface of the indenter and nanoindentation is equal to the ratio of force to the projected area of the nanoindentation. Hence, the hardness is described as:
H = P S = P π   ( 2 R h c )   h c
where P is the load force, R is the radius of sphere indenter, and h c is the nanoindentation depth. All hardness values at the yielding point of the sample are shown in Table 1.
From Figure 6a, we can see that the trend of hardness at yielding is the same as yielding force, likely Young’s modulus and maximum shear stress. However, at the angle of GB from 105° to 150°, the value of the hardness at the yielding point is approximate. In addition to the interaction between the GBs and GIs, the hardening region slope affects the hardness at the yielding point. With the angle of GBs increasing, the hardening effect is weaker. From Figure 6b, we found that the GBs in the sample had an obvious effect on the hardening region slope. With the angle of GBs increasing in the sample, the hardening region slope decreases rapidly. Strengthening by grain size reduction has always been an effective means to improve the strength of polycrystalline materials. The smaller the crystal grains, the higher the strength of the material, which is the Hall–Petch relationship [42]. In this work, it means that the crystal grains, in the Newtonian-2 zone, are getting larger with the increase of the GB angle in the sample. This is why the hardness region slope is significantly reduced. The larger the crystal grains, the smaller the strengthening effect.

3.3. The Effect of GBs on the Dislocation Slip

To understand the effect of GBs on dislocation slip, we examined the dislocation for the 120° sample at the nanoindentation depth h = 22 Å by the DXA method. Figure 7 shows the dislocation and the Burgers vectors of dislocation in the 120° sample. All atoms in the sample are removed for clarity. In Figure 7, the red line represents other dislocation, the blue line represents Perfect dislocation, the green line represents Shockley dislocation, the pink line represents Stair-rod dislocation, the yellow line represents Hirth dislocation, and the cyan line represents Frank dislocation. Compared with Figure 3c, at a nanoindentation depth of 22 Å, we find that more Shockley dislocations are emitted in different directions along [01 1 ¯ ] and [10 1 ¯ ] slip directions, and the most dislocation slip to the GBs. The expansion and reaction of dislocations are shown in the figure, especially at the points A, B, C, and D. These computations for dislocation in α-Fe have been reported by Kumar et al. [43]. During the nanoindentation process, there are active and less active slip system families.
Reaction at point A: The 1/6 dislocation formed by the reaction at point A is like a stair rod, pressed on (1 1 ¯ 1) and ( 1 ¯ 11) plane, making the two Shockley splits difficult to move, and when the two Shockley dislocations are combined, it is called Lomer–Cottrell lock, or L–C lock [44]. It plays a significant role in the work hardening of FCC crystal materials.
Reaction at point B: The reaction of Shockley partial dislocations can form Stair-rod dislocations or Hirth dislocations.
At point C, the Shockley dislocation spreads rapidly on the (001) plane. In addition, we have also noticed that a large number of Shockley dislocations extend to the grain boundary.
At point D, these Shockley dislocations are generated at the GBs and extend to the interior of block 1 along a certain direction.
Figure 8 shows the dislocation for all samples at nanoindentation h = 22 Å. Compared to all samples, we can see that the glide direction of dislocations are mainly in the horizontal direction and the direction perpendicular to the GBs for the 90° sample. As the GB angle increases, all the glide directions are gradually inclined to approach the direction perpendicular to the GBs. The distance at the perpendicular direction is shortest from the GBs to dislocation lines. In this direction, the internal stress can rapidly release. In the 135°and 150° samples, the glide direction of dislocation is more inclined to slip along the perpendicular to the GBs at a short distance between the dislocation and GBs. Moreover, the larger GB angle means the grain (Newtonian-2 zone) is larger and the dislocation density is smaller in GIs. The interaction of dislocation in GIs, like dislocation jog, crossing of dislocation, dislocation tangle, pile-up of dislocation, and so on, are reduced during the nanoindentation process. Correspondingly, the hardening region slope of the sample are reduced. This is also consistent with the Hall–Petch relationship.
According to the study by Zaefferer [45], there are four situations when the dislocation line arrives at the GBs: the dislocations directly transmit to the GBs, the dislocations transmit to the GBs and leaves residual dislocations on the boundary, and the dislocation cannot transmit to the GBs. From Figure 8, we can see that the dislocation pile-up is on the boundaries at the initial deformation stage of all samples, which shows the great capacity of GBs to accommodate dislocations. This is one reason that the GB angle in the sample has a significant effect on the mechanical properties of the material. From Figure 8b–d, we observe that the GBs serve as a source of dislocation and emit dislocation to free surface when the depth of nanoindentation increases.

4. Conclusions

In this work, MD of nanoindentation has been carried out on 304 samples with different GB angles to investigate the effect of GB angles on initial deformation of 304 NG and explain the related mechanisms. We fit four parameters (Young’s modulus, the maximum shear stress, the hardness at the yielding point, and the slope of hardness region) to explore the effect of GB angles on the mechanical properties of 304 samples.
The GB angle affects the entire process of nanoindentation. At the initial elastic stage, with the GBs angle from 90° to 120°, the Young’s modulus and maximum shear stress decrease. For the GB angle from 120° to 150°, the Young’s modulus and maximum shear stress increase due to the interaction of GBs and the dislocation nucleation in GIs. The hardening region slope is affected by the grain size, with the GB angle from 90° to 150°, the grain is increasing so the hardening effect decreases, which fits the Hall–Petch relationship.
At the dislocation slip stage, with the GB angle from 90° to 150°, the direction of dislocation slip tends to be perpendicular to the GBs. This is because that the vertical distance between the GBs and the dislocation in GIs is shorter and the internal stress of GIs release is convenient. Finally, when the dislocations slip to the GBs, the dislocation piles up on the GBs at first and then GBs serve as a source of dislocation and emit dislocation to free surface with increasing depth of nanoindentation.

Author Contributions

Formal analysis, W.P.; Funding acquisition, K.S.; Investigation, L.Y. and X.L.; Project administration, K.S.; Resources, X.L.; Supervision, K.S. and L.Z.; Writing—original draft, L.Y.; Writing—review & editing, W.P. All authors have read and agreed to the published version of the manuscript.

Funding

The authors appreciate the financial support from the National Natural Science Foundation of China (Grant No. 52075417 and No. 51475359).

Institutional Review Board Statement

Not applicable.

Informed Consent Statement

Not applicable.

Conflicts of Interest

The authors declare no conflict of interest.

References

  1. Wu, X.; Liu, Y.; Sun, Y.; Dai, N.; Li, J.; Jiang, Y. A discussion on evaluation criteria for crevice corrosion of various stainless steels. J. Mater. Sci. Technol. 2021, 64, 29–37. [Google Scholar] [CrossRef]
  2. Sun, H.; Yang, H.; Wang, M.; Giron-Palomares, B.; Zhou, Z.; Zhang, L.; Zhang, G. The corrosion and stress corrosion cracking behavior of a novel alumina-forming austenitic stainless steel in supercritical water. J. Nucl. Mater. 2017, 484, 339–346. [Google Scholar] [CrossRef]
  3. Takakuwa, O.; Soyama, H. Effect of residual stress on the corrosion behavior of austenitic stainless steel. Adv. Chem. Eng. Sci. 2015, 5, 62–71. [Google Scholar] [CrossRef] [Green Version]
  4. Ziemniak, S.; Hanson, M. Zinc treatment effects on corrosion behavior of 304 stainless steel in high temperature, hydrogenated water. Corros. Sci. 2006, 48, 2525–2546. [Google Scholar] [CrossRef] [Green Version]
  5. Hu, S.; Mao, Y.; Liu, X.; Han, E.-H.; Hänninen, H. Intergranular corrosion behavior of low-chromium ferritic stainless steel without Cr-carbide precipitation after aging. Corros. Sci. 2020, 166, 108420. [Google Scholar] [CrossRef]
  6. Nair, A.P.; Arafat, S.; Farhan; Vincent, S. Corrosion characteristics of zinc coated SS304 stainless steel. Mater. Today Proc. 2020, 28, 1210–1215. [Google Scholar] [CrossRef]
  7. Cheng, M.; He, P.; Lei, L.; Tan, X.; Wang, X.; Sun, Y.; Li, J.; Jiang, Y. Comparative studies on microstructure evolution and corrosion resistance of 304 and a newly developed high Mn and N austenitic stainless steel welded joints. Corros. Sci. 2021, 183, 109338. [Google Scholar] [CrossRef]
  8. Natesan, K.; Majumdar, S.; Shankar, P.S.; Shah, V.N. Preliminary Materials Selection Issues for the Next Generation Nuclear Plant Reactor Pressure Vessel; OSTI.GOV: Argonne, IL, USA, 2007.
  9. Špirit, Z.; Chocholoušek, M.; Šíma, M. Influence of mechanical stress at high temperatures on the properties of steels intended for the manufacture of fuel cladding for generation IV reactors. Solid State Phenom. 2017, 270, 246–252. [Google Scholar] [CrossRef]
  10. Luo, Q.; Chen, Y.; Liu, S. The studies on the corrosion behaviors of 316NG and 304 NG nitrogen-containing stainless steels made in China. Procedia Eng. 2012, 27, 1560–1567. [Google Scholar] [CrossRef] [Green Version]
  11. Wei, Y.-J.; Xia, D.-H.; Song, S.-Z. Detection of SCC of 304 NG stainless steel in an acidic NaCl solution using electrochemical noise based on chaos and wavelet analysis. Russ. J. Electrochem. 2016, 52, 560–575. [Google Scholar] [CrossRef]
  12. Bruchhausen, M.; Dundulis, G.; McLennan, A.; Arrieta, S.; Austin, T.; Cicero, R.; Chitty, W.-J.; Doremus, L.; Ernestova, M.; Grybenas, A.; et al. Characterization of austenitic stainless steels with regard to environmentally as-sisted fatigue in simulated light water reactor conditions. Metals 2021, 11, 307. [Google Scholar] [CrossRef]
  13. Tan, J.; Zhang, Z.; Zheng, H.; Wang, X.; Gao, J.; Wu, X.; Han, E.-H.; Yang, S.; Huang, P. Corrosion fatigue model of austenitic stainless steels used in pressurized water reactor nuclear power plants. J. Nucl. Mater. 2020, 541, 152407. [Google Scholar] [CrossRef]
  14. Hong, I.T.; Koo, C.H. Antibacterial properties, corrosion resistance and mechanical properties of Cu-modified SUS 304 stainless steel. Mater. Sci. Eng. A 2005, 393, 213–222. [Google Scholar] [CrossRef]
  15. Wang, K.; Song, Y.; La, P.; Wei, F.; Ma, F.; Sheng, J.; Shi, Y.; Guo, X.; Li, Z. Effect of rolling deformation on nanograins and mechanical properties of exceptional nano/microcrystalline 304 stainless steel. Steel Res. Int. 2018, 89, 1700490. [Google Scholar] [CrossRef]
  16. Thi, P.H.; Takeshi, I. An evaluation of fracture properties of type-304 austenitic stainless steel at high deformation rate using the small punch test. Int. J. Mech. Sci. 2018, 144, 249–261. [Google Scholar]
  17. Luu, H.-T.; Dang, S.-L.; Hoang, T.-V.; Gunkelmann, N. Molecular dynamics simulation of nanoindentation in Al and Fe: On the influence of system characteristics. Appl. Surf. Sci. 2021, 551, 149221. [Google Scholar] [CrossRef]
  18. AlMotasem, A.T.; Posselt, M.; Bergstrom, J. Nanoindentation and nanoscratching of a ferrite/austenite iron bi-crystal: An at-omistic study. Tribol. Int. 2018, 127, 231–239. [Google Scholar] [CrossRef]
  19. Qu, S.; Zhou, H. Hardening by twin boundary during nanoindentation in nanocrystals. Nanotechnology 2010, 21, 335704. [Google Scholar] [CrossRef]
  20. Talaei, M.; Nouri, N.; Ziaei-Rad, S. Grain boundary effects on nanoindentation of Fe bicrystal using molecular dynamic. Mech. Mater. 2016, 102, 97–107. [Google Scholar] [CrossRef]
  21. Faken, D.; Jónsson, H. Systematic analysis of local atomic structure combined with 3D computer graphics. Comput. Mater. Sci. 1994, 2, 279–286. [Google Scholar] [CrossRef]
  22. Plimpton, S. Fast parallel algorithms for short-range molecular dynamics. J. Comput. Phys. 1995, 117, 1–19. [Google Scholar] [CrossRef] [Green Version]
  23. Daw, M.S. Model of metallic cohesion: The embedded-atom method. Phys. Rev. B 1989, 39, 7441–7452. [Google Scholar] [CrossRef]
  24. Johnson, R.A. Alloy models with the embedded-atom method. Phys. Rev. B 1989, 39, 12554–12559. [Google Scholar] [CrossRef]
  25. Bonny, G.; Terentyev, D.; Pasianot, R.C.; Poncé, S.; Bakaev, A. Interatomic potential to study plasticity in stainless steels: The FeNiCr model alloy. Model. Simul. Mater. Sci. Eng. 2011, 19, 085008. [Google Scholar] [CrossRef]
  26. Andoh, C.N.; Gyeabour, A.A.I.; Banini, G.K. Molecular dynamics simulation of mechanical deformation of austenitic stainless steels (Fe-Ni-Cr alloys) at supercritical water conditions. J. Appl. Sci. Technol. 2017, 22, 1–13. [Google Scholar]
  27. Haslam, A.J.; Phillpot, S.R.; Wolf, D. Mechanisms of grain growth in nanocrystalline fcc metals by molecular-dynamics simulation. Mater. Sci. Eng. A 2001, 318, 293–312. [Google Scholar] [CrossRef]
  28. Voter, A.F. A method for accelerating the molecular dynamics simulation of infrequent events. J. Chem. Phys. 1997, 106, 4665–4677. [Google Scholar] [CrossRef]
  29. Tuckerman, M.E.; Alejandre, J.; Lopez-Rendon, R.; Jochim, A.L.; Martyna, G.J. A Liouville-operator derived measure-preserving integrator for molecular dynamics simulations in the isothermal–isobaric ensemble. J. Phys. A Math. Gen. 2006, 39, 5629–5651. [Google Scholar] [CrossRef]
  30. Evans, D.J.; Holian, B.L. The Nose–Hoover thermostat. J. Chem. Phys. 1985, 83, 4069. [Google Scholar] [CrossRef]
  31. Stukowski, A.; Bulatov, V.V.; Arsenlis, A. Automated identification and indexing of dislocations in crystal interfaces. Model. Simul. Mater. Sci. Eng. 2012, 20, 085007. [Google Scholar] [CrossRef]
  32. Stukowski, A.; Albe, K. Extracting dislocations and non-dislocation crystal defects from atomistic simulation data. Model. Simul. Mater. Sci. Eng. 2010, 18, 085001. [Google Scholar] [CrossRef]
  33. Tsuzuki, H.; Branicio, P.S.; Rino, J.P. Structural characterization of deformed crystals by analysis of common atomic neighborhood. Comput. Phys. Com. 2007, 177, 518–523. [Google Scholar] [CrossRef]
  34. Stukowski, A. Visualization and analysis of atomistic simulation data with OVITO–the Open Visualization Tool. Model. Simul. Mater. Sci. Eng. 2010, 18, 015012. [Google Scholar] [CrossRef]
  35. Fu, T.; Peng, X.; Weng, S.; Zhao, Y.; Gao, F.; Deng, L.; Wang, Z. Molecular dynamics simulation of effects of twin interfaces on Cu/Ni multilayers. Mater. Sci. Eng. A 2016, 658, 1–7. [Google Scholar] [CrossRef]
  36. Meyersm, M.A.; Ashworth, E. A model for the effect of grain size on the yield stress of metals. Philos. Mag. A 1982, 46, 737–759. [Google Scholar] [CrossRef]
  37. Benson, D.J.; Fu, H.H.; Meyers, M.A. On the effect of grain size on yield stress: Extension into nanocrystalline domain. Mater. Sci. Eng. A 2001, 319, 854–861. [Google Scholar] [CrossRef]
  38. Machado, M.; Moreira, P.; Flores, P.; Lankarani, H.M. Compliant contact force models in multibody dynamics: Evolution of the Hertz contact theory. Mech. Mach. Theory 2012, 53, 99–121. [Google Scholar] [CrossRef]
  39. Gupta, R.K.; Darling, K.S.; Raman, R.K.S.; Ravi, K.R.; Koch, C.C.; Murty, B.S.; Scattergood, R.O. Synthesis, characterization and mechanical behaviour of an in situ consolidated nanocrystalline FeCrNi alloy. J. Mater. Sci. 2011, 47, 1562–1566. [Google Scholar] [CrossRef]
  40. Ng, T.; Pandurangan, V.; Li, H. Multiscale modeling of nanoindentation in copper thin films via the concurrent coupling of the meshless Hermite–Cloud method with molecular dynamics. Appl. Surf. Sci. 2011, 257, 10613–10620. [Google Scholar] [CrossRef]
  41. Guillonneau, G.; Wheeler, J.; Wehrs, J.; Philippe, L.; Baral, P.; Höppel, H.W.; Göken, M.; Michler, J. Determination of the true projected contact area by in situ indentation testing—ERRATUM. J. Mater. Res. 2019, 34, 4086. [Google Scholar] [CrossRef]
  42. De las Cuevas, F.; Reis, M.; Ferraiuolo, A.; Pratolongo, G.; Karjalainen, L.P.; Alkorta, J.; Gil Sevillano, J. Hall-Petch relationship of a TWIP steel. Key Eng. Mater. 2010, 867, 147–152. [Google Scholar] [CrossRef]
  43. Kumar, N.N.; Tewari, R.; Durgaprasad, P.V.; Dutta, B.K.; Dey, G.K. Active slip systems in bcc iron during nanoindentation: A molecular dynamics study. Comput. Mater. Sci. 2013, 77, 260–263. [Google Scholar] [CrossRef]
  44. Cottrell, A.H. Theory of brittle fracture in steel and similar metals. Trans. Met. Soc. AIME 1958, 212, 192–203. [Google Scholar]
  45. Zaefferer, S.; Kuo, J.-C.; Zhao, Z.; Winning, M.; Raabe, D. On the influence of the grain boundary misorientation on the plastic deformation of aluminum bicrystals. Acta Mater. 2003, 51, 4719–4735. [Google Scholar] [CrossRef]
Figure 1. Snapshot of the nanoindentation sample. The blue atoms represent Fe atoms; the yellow atoms represent Cr atoms; the green atoms represent Ni atoms; the red atoms represent boundary atoms; the white atoms represent GB atoms.
Crystals 12 00058 g001
Figure 2. (a) Force-depth curves of different samples. Inset picture (b) is the close-up view of curves at nanoindentation depth from 0.3 to 0.6 nm.
Crystals 12 00058 g002
Figure 3. Snapshot of dislocation initial stage for all samples: (a) 90° sample; (b) 105° sample; (c) 120° sample; (d) 135° sample; (e) 150° sample.
Crystals 12 00058 g003
Figure 4. Young’s modulus for nanoindentation simulation.
Crystals 12 00058 g004
Figure 5. The maximum shear stress for nanoindentation simulation.
Crystals 12 00058 g005
Figure 6. The hardness parameter for nanoindentation simulation. (a) Hardness at yielding point; (b) hardening region slope.
Crystals 12 00058 g006
Figure 7. When The dislocations and their Burgers vectors in the 120° specimen when the nanoindentation depth is 2.2 nm.
Crystals 12 00058 g007
Figure 8. Snapshot of dislocation for all samples at nanoindentation h = 22 Å: (a) 90° sample; (b) 105° sample; (c) 120° sample; (d) 135° sample; (e) 150° sample; (f) schematic of dislocation pile-up at GBs.
Crystals 12 00058 g008
Table 1. Calculated parameters of all samples.
Parameters90° Sample105° Sample120° Sample135° Sample150° Sample
Young’s modulus by Equations (4) and (5) (GPa)351.52279.89273.61288.39293.53
Young’s modulus by Equation (6) (GPa)340.41286.22266.46296.53308.59
Maximum shear stress by Equation (7) (GPa)25.0619.2618.8419.8219.96
Maximum shears tress by Equation (8) (GPa)24.5819.4218.6720.0520.33
Hardness at yielding point (GPa)29.4622.4222.1923.6123.71
Hardness region slope (N/m)52.8947.5543.1940.4229.06
Publisher’s Note: MDPI stays neutral with regard to jurisdictional claims in published maps and institutional affiliations.

