Article

Heterogeneous Ice Growth in Micron-Sized Water Droplets Due to Spontaneous Freezing

by
Niloofar Esmaeildoost
1,
Olof Jönsson
1,
Trevor A. McQueen
2,†,
Marjorie Ladd-Parada
3,
Hartawan Laksmono
4,‡,
Ne-Te Duane Loh
5,6 and
Jonas A. Sellberg
1,*
1
Biomedical and X-ray Physics, Department of Applied Physics, AlbaNova University Center, KTH Royal Institute of Technology, S-106 91 Stockholm, Sweden
2
Department of Chemistry, Stanford University, Stanford, CA 94305, USA
3
Department of Physics, AlbaNova University Center, Stockholm University, S-106 91 Stockholm, Sweden
4
PULSE Institute, SLAC National Accelerator Laboratory, 2575 Sand Hill Road, Menlo Park, CA 94025, USA
5
Department of Physics, National University of Singapore, Singapore 117551, Singapore
6
Department of Biological Sciences, National University of Singapore, Singapore 117558, Singapore
*
Author to whom correspondence should be addressed.
Current address: Neptune Fluid Flow Systems, 2641 Osprey Vista Way, Room 150 (Neptune Lab), Knoxville, TN 37920-4395, USA.
Current address: KLA-Tencor, Three Technology Drivem, Milpitas, CA 95035, USA.
Crystals 2022, 12(1), 65; https://doi.org/10.3390/cryst12010065
Submission received: 30 November 2021 / Revised: 18 December 2021 / Accepted: 29 December 2021 / Published: 4 January 2022
(This article belongs to the Special Issue Time Resolved Crystallography)

Abstract

:
Understanding how ice nucleates and grows into larger crystals is of crucial importance for many research fields. The purpose of this study was to shed light on the phase and structure of ice once a nucleus is formed inside a metastable water droplet. Wide-angle X-ray scattering (WAXS) was performed on micron-sized droplets evaporatively cooled to temperatures where homogeneous nucleation occurs. We found that for our weak hits ice grows more cubic compared to the strong hits that are completely hexagonal. Due to efficient heat removal caused by evaporation, we propose that the cubicity of ice at the vicinity of the droplet’s surface is higher than for ice formed within the bulk of the droplet. Moreover, the Bragg peaks were classified based on their geometrical shapes and positions in reciprocal space, which showed that ice grows heterogeneously with a significant population of peaks indicative of truncation rods and crystal defects. Frequent occurrences of the (100) reflection with extended in-planar structure suggested that large planar ice crystals form at the droplet surface, then fracture into smaller domains to accommodate to the curvature of the droplets. Planar faulting due to misaligned domains would explain the increased cubicity close to the droplet surface.

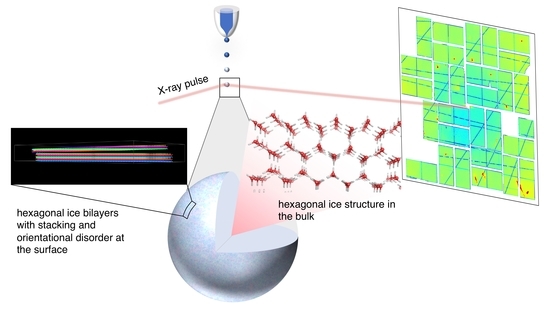
Graphical Abstract

1. Introduction

Our climate system relies heavily on the understanding of water and ice and the transition between these two phases [1,2]. Water and ice are significant heat drains or sources due to their considerable specific and latent heat and have a major impact on the climate when it comes to clouds [3,4,5]. This is because clouds are responsible, not only to cool Earth by reflecting solar radiation, but also to warm Earth by absorbing and re-emitting IR radiation back toward Earth. Formation of ice crystals in the Earth’s atmosphere strongly affects the properties of clouds and their impact on climate [6,7]. Therefore a thorough knowledge of the phase and structure of ice is required, where one of the most pressing issues has been the question of which phase of ice nucleates in micrometer-sized supercooled cloud droplets as a function of temperature.
It is predicted that all macroscopic ice crystals start from critical-sized nuclei that increase with temperature but are as small as 1 nm in diameter upon deep supercooling [8,9]. These nuclei are theorized to start from a five-membered ring of H-bonded water molecules rather than the hexagonal or cubic six-membered rings [9,10]. The nuclei are then expected to grow into larger crystals of cubic ice, until the crystal gets large enough that the latent heat of fusion builds up and anneals the ice crystal into hexagonal ice [11,12,13,14]. Based on previous studies on supercooled nanometer-sized droplets [15,16,17], there is a consistent tendency toward cubic ice structure below the “homogeneous nucleation temperature” of ∼232 K [18]. The extremely low nucleation temperatures, efficient heat removal, and rapid freezing (∼1 μs) in nanodroplets are responsible for the recurrent preference of cubic ice growth [15,19,20]. However, in microdroplets, a high fraction of cubic ice is only seen in oil emulsions with efficient heat removal [21], and aqueous solutions that reduce the nucleation temperature [22,23]. Nevertheless, it is often believed that cubic ice initially forms at homogeneous nucleation temperatures and then anneals to a hexagonal structure due to the rapid latent heat release and slow heat removal. Structural defects, especially migration of vacancies, are expected to play an important role in the annealing process [24]. Vacancies, interstitials and dislocations normal to the interface have been predicted to be frequently occurring during ice growth, with a minimum dislocation density that increases linearly with growth velocity [25]. When ice was deposited on a cryogenically cooled Pt(111) substrate, spiral growth around screw dislocations determined whether the structure of ice was cubic or hexagonal [26].
During the past decade, research has shown that most samples of cubic ice do not have a fully developed cubic crystal structure, but can instead be described as stacking-disordered forms of ice I [21,27,28,29,30,31,32]. This phase of ice consists of both hexagonal and cubic lattices building up layers that are randomly stacked, so that adding another lattice layer to the crystal will have a characteristic probability of being either hexagonal or cubic ice [27,33]. Thus, it is a phase with 2D translational order, but is disordered in the direction of stacking layers. The probability of adding a cubic layer is often defined as the cubicity of the phase. Depending on nucleation temperature and cooling rate, cubicity often ranges between 0–50% for microdroplets [30], whereas nanodroplets with lower nucleation temperatures and faster freezing have shown cubicity up to ∼80% [15]. Cubic ice prepared from ice II has shown a comparable cubicity of 50–80% [30]. Recently, in two separate research studies, scientists could successfully prepare samples that were almost completely cubic without stacking defects [34,35]. The produced cubic ice in these studies were made using two different methods. One by annealing ice XVII which leads to a nearly perfect cubic ice with a cubicity of about 95% [34] and the other by degassing hydrogen from the high-pressure form of hydrogen hydrate that gives 100% cubicity [35]. In order to model memory effects between layers, several independent stacking probabilities are required [30].
The complex landscape of ice crystal morphology has been well studied since Nakaya characterized snow crystals (i.e., single ice crystals growing from vapor) as a function of temperature and supersaturation [36]. As the ice crystals grow in droplets, the process of ice crystal multiplication starts to happen. Atmospheric scientists found that when clouds of water droplets freeze under certain conditions, they produce far more ice crystals than the number of initial water droplets [37,38,39,40,41]. This happens when the droplets freeze fast enough so as to form a complete shell of ice around the remaining water droplet, thus trapping some of the water inside the shell [38,42]. When this water begins to freeze, it expands, and thus puts pressure on the ice shell, until finally the frozen droplet shatters into pieces [11,12,43,44]. This process produces pillars of ice that extends from the droplet and expels splinters of ice from the tips [44].
In this paper, we have analyzed X-ray diffraction patterns of ice from microdroplets that were collected at the Linac Coherent Light Source (LCLS) at SLAC National Accelerator Laboratory. The aim of this work is to study the phase and the structure of ice formed in evaporatively cooled water droplets with negligible effects from the substrate. The coherent illumination of the droplets revealed strong heterogeneity in the crystal growth among individual droplets. For weak X-ray hits, a higher cubicity was observed in the ice structure that otherwise was completely hexagonal. Moreover, the statistics of the Bragg peaks were investigated through their position and shape in reciprocal space to get further insight into the heterogeneity and orientation of the crystals.

2. Methods

2.1. Experiment

The experiment was performed at LCLS by collecting X-ray diffraction patterns from evaporatively cooled water droplets (PURELAB Ultra Genetic, resistivity 18.2 MΩcm at 298 K) in vacuo upon deep supercooling (Figure 1a). We used the ultrabright hard X-ray laser pulses (∼5 × 10 11 photon/pulse at 120 Hz) with a photon energy of 9.4 keV and a duration of 50 fs to study the initial stages of ice nucleation from water droplets with a diameter of 12 μm and a velocity of 10.35 m/s generated by a gas-dynamic virtual nozzle [45] (GDVN). The cooling rates of the droplets were estimated to be on the order of 10 3 10 4 K/s prior to crystallization, resulting in nucleation rates on the order of 10 11 10 13 cm−3/s [46] at nucleation temperatures of 228–231 K. The droplet temperature was calculated through Knudsen theory of evaporation [47,48] with recent experimental heat capacity data [49] that increased the temperature calibration slightly (approximately +1 K) from the original estimates ( 227 1 + 2 230 1 + 2 K) [46,47].
The single-pulse diffraction patterns at LCLS were recorded with the Cornell-SLAC pixel array detector [50] located 139 mm downstream of the X-ray interaction region where the X-rays were focused to ∼10 μm2. Between 2 × 10 5 and 1 × 10 6 shots were recorded at each distance from the nozzle tip (12.4, 21.4, 30.6, 40.4, 45.6 and 50.6 mm), corresponding to a measurement point with a given travel time and nucleation temperature. For this work, we only used the data far from the nozzle tip (40.4, 45.6 and 50.6 mm) where spontaneous freezing had occurred and the droplets were at least partially crystallized. The travel times (3.91, 4.41 and 4.89 ms, respectively) after the droplets had exited the nozzle orifice were calculated from the encoded distance and the droplet velocity, which was estimated through a least-squares best fit of experimentally determined droplet parameters after enforcing spatial overlap with synchrotron radiation data at known absolute temperature. Further details on experiment conditions are given in Refs. [46,47].

2.2. Data Analysis

The intensity of the X-ray diffraction was read out per analog-to-digital unit (ADU) and corrected for the dark signal, gain variations, the polarization dependence of the X-ray scattering, solid-angle differences and fluctuations in the average photon wavelength between X-ray pulses [47]. The momentum transfer (Q) of each pixel was calculated according to Q = 4 π sin ( θ / 2 ) / λ , where θ is the scattering angle of each pixel and λ is the wavelength of the X-ray beam. The radial profile was calculated through an angular average of all non-masked pixels that was then splined with 0.001 Å−1 resolution to account for the wavelength jitter by the X-ray beam. The length of a detector pixel is equal to 109.92 μm, which corresponds to a pixel length of about 0.002–0.004 Å−1 in reciprocal space.

2.2.1. Shot Selection

The corrected patterns were characterized as shots containing background scattering, diffuse scattering of pure liquid water or Bragg (and diffuse) scattering from ice (and water). The latter class, herein called “ice hits”, was defined by: (i) a maximum intensity of the radial profile above 20 ADU/pixel; (ii) a high gradient maximum in the radial profile, which detects the sharp intensity variation of Bragg peaks, in the radial profile after applying a (5 pixel wide) moving median filter; and (iii) visible Bragg peaks through visual inspection. The first criterion removed many weak hits of nanoscale water and ice particles that had been expelled from the original microdroplets, whereas the second and third criteria ensured that all ice hits probed at least partially crystalline water droplets. Only ice hits were kept for further analysis.

2.2.2. Ensemble Averaging and Data Segmentation

The ensemble average of all ice hits at each of the three measured distances was produced to generate a virtual X-ray powder diffraction pattern (Figure 1b–d). Figure 1e shows the radial profiles of these three virtual powder diffraction patterns together with the Bragg peak locations of hexagonal ice [51] named after their Miller indices. Two sub-ensembles were created, based on a threshold in maximum intensity of the radial profile of 50 ADU/pixel, denoted “strong hits” (≥50 ADU/pixel) and “weak hits” (<50 ADU/pixel). The corresponding radial profiles of each sub-ensemble were background-subtracted with a quartic (i.e., fourth order) polynomial at specific Q-positions far from Bragg peaks between 1.5–3.4 Å−1. The background-subtracted radial profiles are shown in Figure 2a,b, respectively. Hit and peak statistics for each sub-ensemble are given in Table 1.

2.2.3. Phase Composition and Cubicity

We estimated the phase composition and the cubicity in the weak hits using various combinations of hexagonal ice (Ih), cubic ice (Ic) and stacking-disordered ice (Isd). The degree of cubicity ( χ ), assuming memory effects between layers to first order, was defined as [21,27,29,30] χ = Φ h c / ( Φ h c + Φ c h ) , where Φ h c is the probability of a cubic layer to form over a hexagonal layer, and Φ c h is the probability of a hexagonal layer to form over a cubic layer.
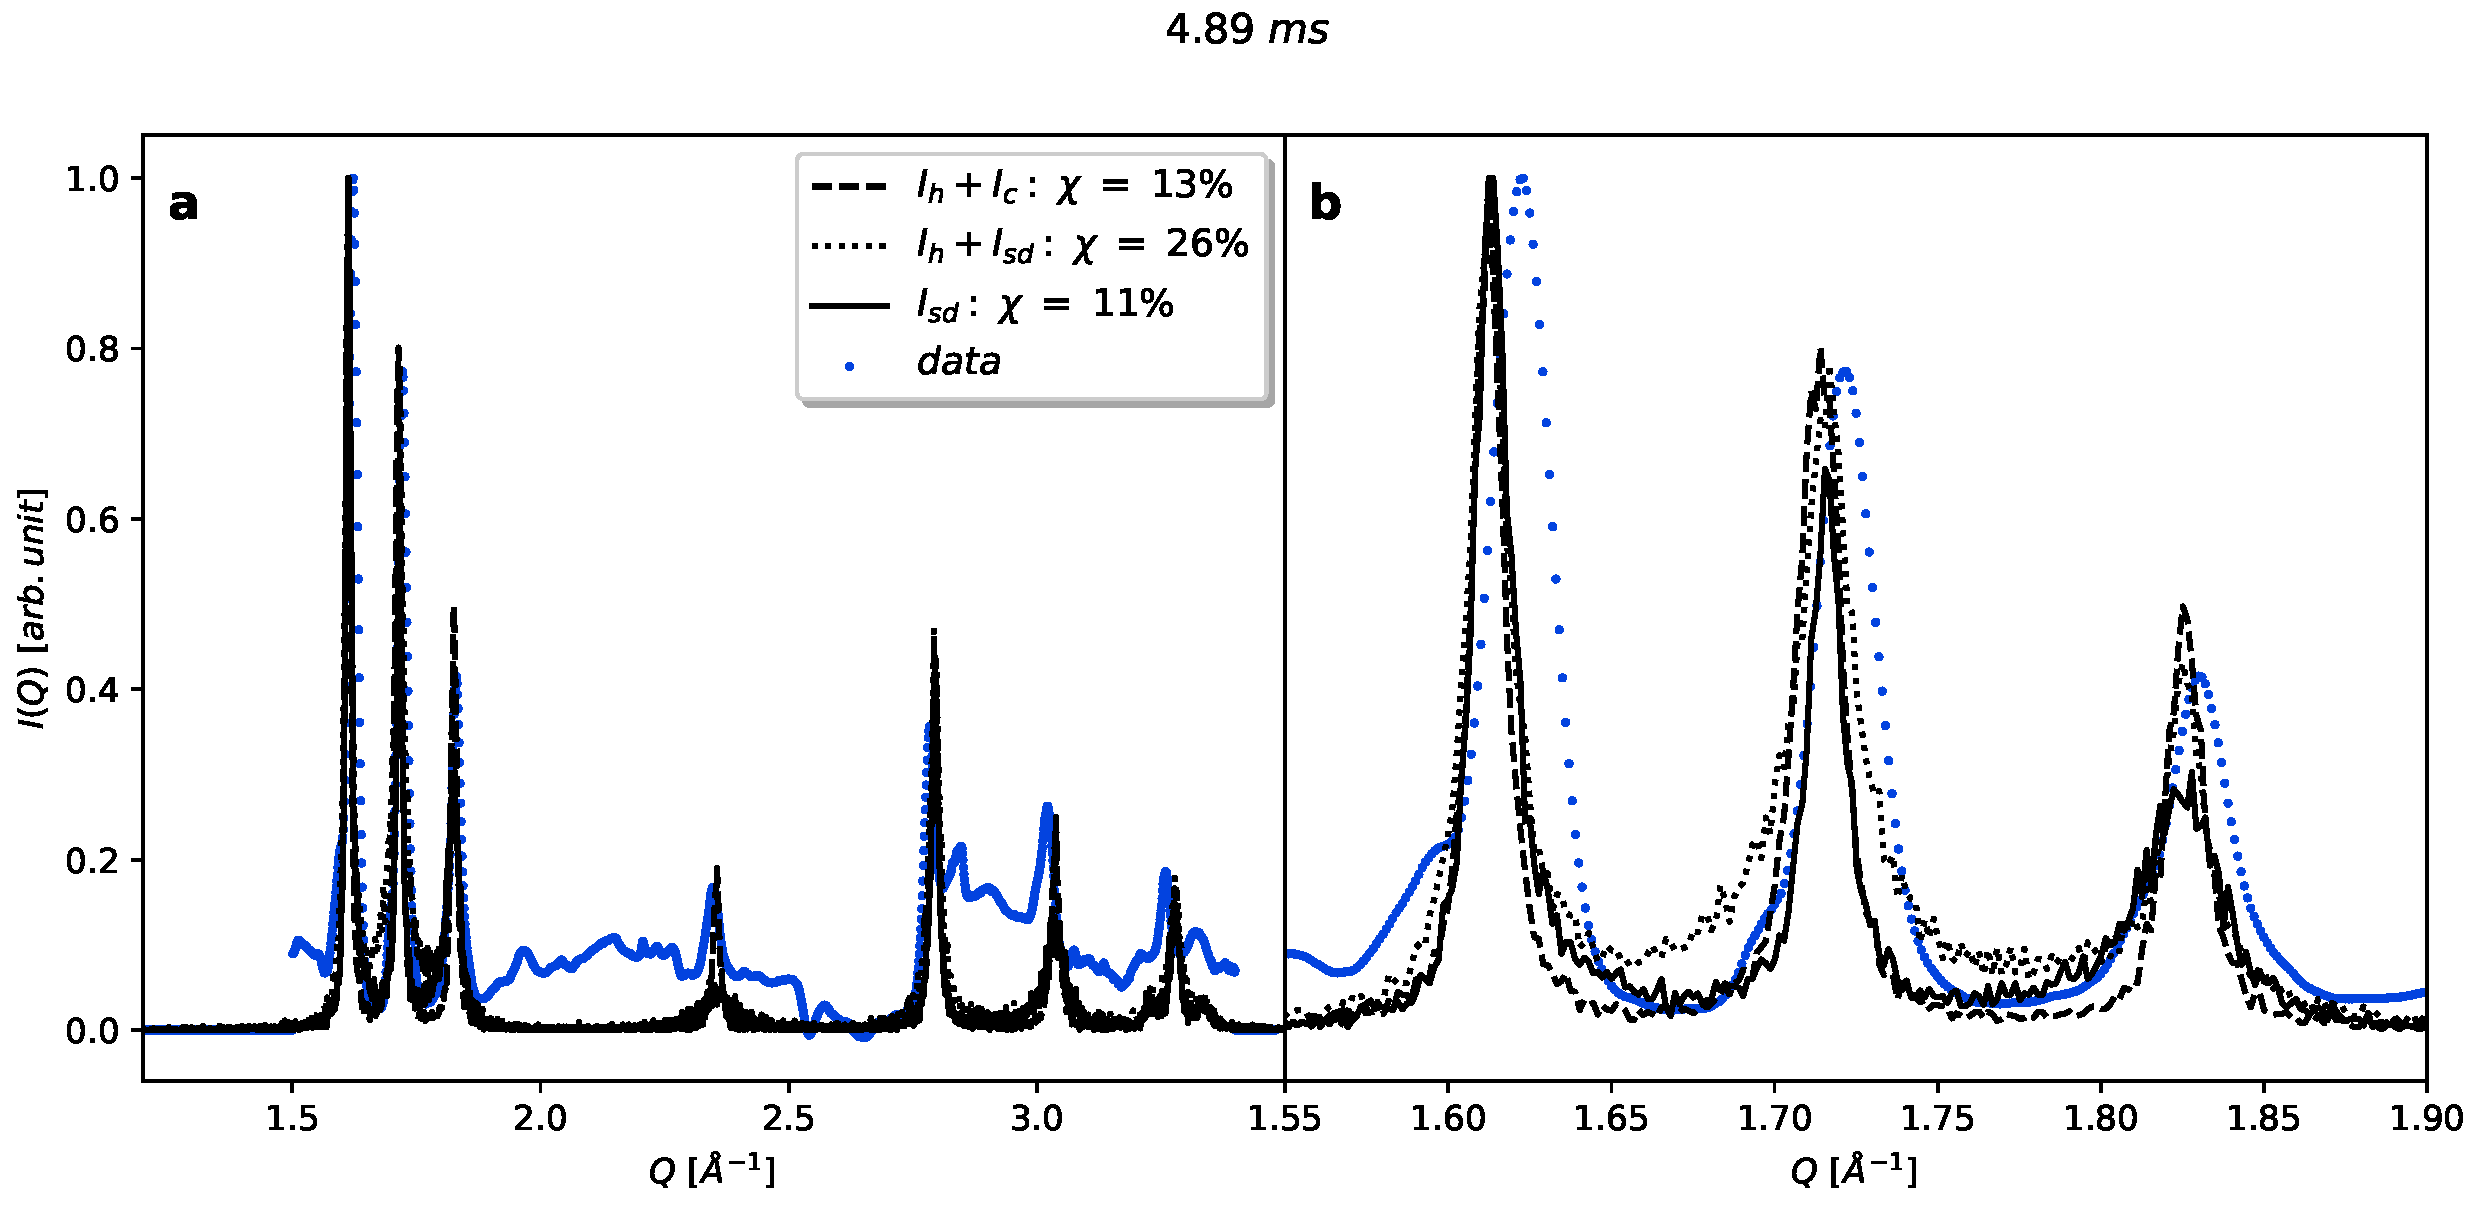
The small number of weak hits recorded at 3.91 ms and the severe peak shifts due to heating and overall residual background for the weak hits at all travel times made it difficult to perform a reliable maximum likelihood estimation. Instead, we estimated the cubicity at 4.41 ms and 4.89 ms by comparing the experimental data to simulated WAXS profiles of Isd with different values of χ ( Φ h c and Φ c h steps of 0.05). The simulated WAXS profiles were calculated using the FAULTS diffraction simulation software [52] following a similar procedure to that reported using DIFFaX [30], based on the probabilities of a cubic or a hexagonal stacking.
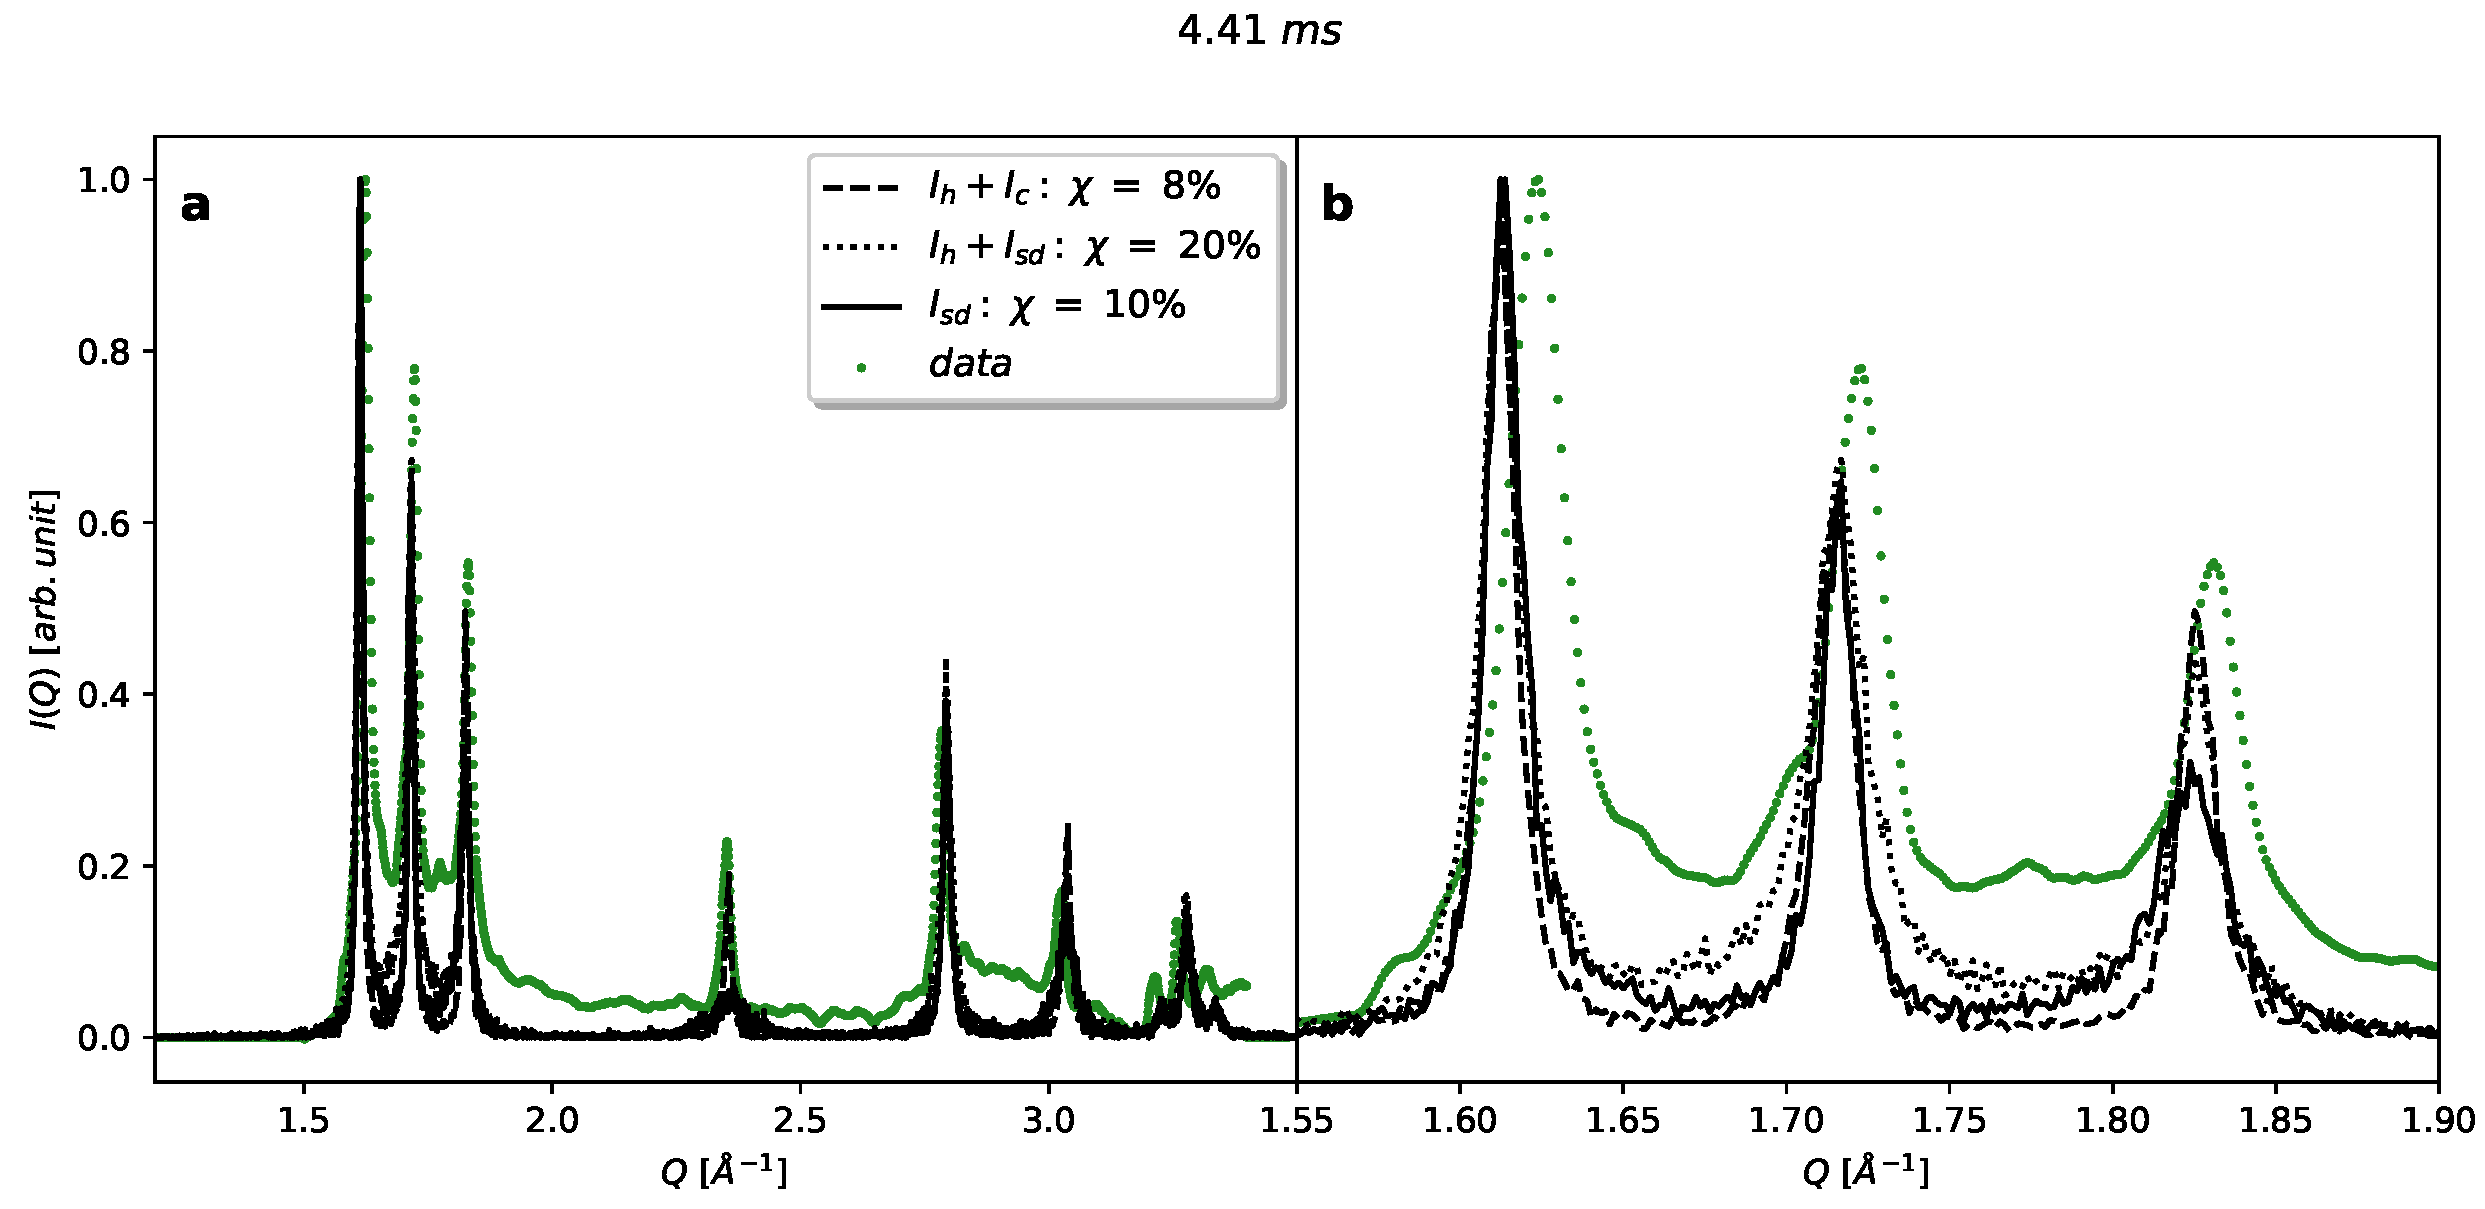
Since the selected Isd profiles significantly underestimated the (102) peak at Q = 2.35 Å−1, and particularly at 4.41 ms we did not observe the larger broadening of the (100), (002) and (101) peaks, we created a second model with a combination of Isd and the WAXS profile of pure Ih, which improved the overall agreement. The significance of stacking disorder was evaluated by creating a third model of phase-separated macroscopic phases of pure Ih and pure Ic, where the ratio of the phases was determined based on the experimental peak ratio of the (002) and (101) peaks at all travel times, similar to a Rietveld refinement applied to the maximum intensities of the two peaks. The resulting cubicity was calculated assuming Φ h c = 0 and Φ c h = 1 for Ih and Φ h c = 1 and Φ c h = 0 for Ic. The comparison of the three models with experimental data and their corresponding cubicity is shown in Appendix A.3.

2.2.4. Image Segmentation and Peak Finding

There has been a wide range of segmentation techniques suggested previously to find regions of interest (ROI) in a 2D image [53,54,55,56]. There is, however, no single standard segmentation technique that can deliver adequate results in all types of objectives. Thresholding is one of the popular techniques that is commonly used to find peaks in a 2D diffraction image that divides the image into two groups of pixels, one having values above the threshold and one group that are below the threshold. Depending on the background noise level and the average pixel value of the image, one can choose between different types of thresholds, such as global or local adaptive methods [57,58]. Here, we did the image segmentation in two steps, first using a global threshold on the entire diffraction pattern, second using a local threshold on each individual peak region to determine local maxima and contour detection.
Neighboring pixels (defined as vertical or horizontal nearest neighbors) above the global threshold were grouped together in connected regions and labeled based on their connectivity. Regions that had a smallest dimension of at least 10 pixels were considered a peak and the original diffraction intensities were cut out for each region. Smaller regions were excluded to minimize artificial peaks from outlier pixels and artifacts. The global threshold was set to twice the sum of the mean and standard deviation (s.d.) of the diffraction pattern. The local threshold was based on Otsu’s method [59,60], which was applied to each peak region subsequent to a Gaussian blur (1 s.d. = 1 pixel). The Gaussian blur acts as a low-pass filter and excludes single pixels and outliers. The selected sub-regions based on neighboring pixels above the local threshold were required to contain at least 10 pixels to be considered a local maxima. Contour detection was applied to the local maxima in each peak region that covered the largest fraction of the peak’s intensity. The found contour was the basis for calculating the sphericity (see Section 2.2.5). The choice of the exact contour of a continuous function is arbitrary. In order to evaluate the uniqueness of the contour, Otsu’s method was applied on both the original intensities and on the logarithm of the intensities, which resulted in a conservative and liberal estimate of the peak’s contour (Appendix A.2).

2.2.5. Peak Center of Mass and Sphericity

To calculate the center of mass of each peak region in Q space, the average position of all the pixels contained in the peak region weighted by their intensities (I) were determined from image moments in reciprocal space. This is equivalent to
Q x , c m = i N I i Q x , i i N I i ,
Q y , c m = j N I j Q y , j j N I j ,
where i and j are the indices of all N pixels in the peak region matrix, Q x , i = Q i cos ( ϕ i ) , Q y , i = Q i sin ( ϕ i ) , and ϕ i = atan2 ( y i , x i ) is the azimuth angle. This neglects the curvature of the Ewald sphere and is only valid in a small-angle X-ray scattering (SAXS) approximation for which Q z = 0 . Assuming a SAXS approximation, the total Q c m was then calculated through Q c m = Q x , c m 2 + Q y , c m 2 .
As a simple measure of peak shape, we use sphericity, which shows how much an object resembles the shape of a sphere [61]. In a 2D diffraction image, this measure refers to the circularity of the Bragg peaks (i.e., whether they are elongated or compressed) and can be defined through s = 4 π A P 2 , where A is the area of the peak inside the contour and P is the perimeter of the peak shape (i.e., length of contour). Each object can be assigned a sphericity value in a range from 0 to 1 where an object with a sphericity of 1 is recognized to be a perfect sphere (or disk in 2D) and a sphericity of 0 is perceived to be completely aspherical (or non-circular in 2D). We used a threshold of s > 0.7 (the approximate sphericity of a rectangle with aspect ratio 1:2) in both the conservative (linear intensity scale) and liberal (logarithmic intensity scale) contour to determine whether a peak is considered circular. To the contrary, we used a threshold of s < 0.3 (the approximate sphericity of a rectangle with aspect ratio 1:8.5) in either the conservative (linear intensity scale) or the liberal (logarithmic intensity scale) contour to determine whether a peak is considered non-circular. Peaks with several maxima or single peaks with neighboring peaks at Δ Q c m < 0.2 Å−1 were considered structured peaks.

3. Results

In order to assert the crystalline phase of the ice particles as a function of travel time, and specify which phase of ice has been formed during the freezing of the droplets, the single-shot ice diffraction images at a given travel time were summed incoherently into a virtual powder pattern and the radial profile of these patterns was computed. As it can be seen in Figure 1, the mean WAXS profile presents peaks that line up well with the hexagonal (Ih) Bragg peaks [51], which is an indication of the ice phase being mainly hexagonal. It is also clear that the WAXS profile at 3.91 ms contains a strong contribution of residual water scattering, as macroscopic amorphous ice is not expected to be formed at these nucleation temperatures and cooling rates. Looking more closely, the peak locations of our WAXS profiles are shifted compared to Ic recorded at 88 K [51]. This may be due to thermal expansion of the ice lattice [62], residual water background that skews the peak shape and shifts the peak positions, or deficiencies in our experimental approach, such as limited dynamic range of the detector or inaccurate Q calibration.
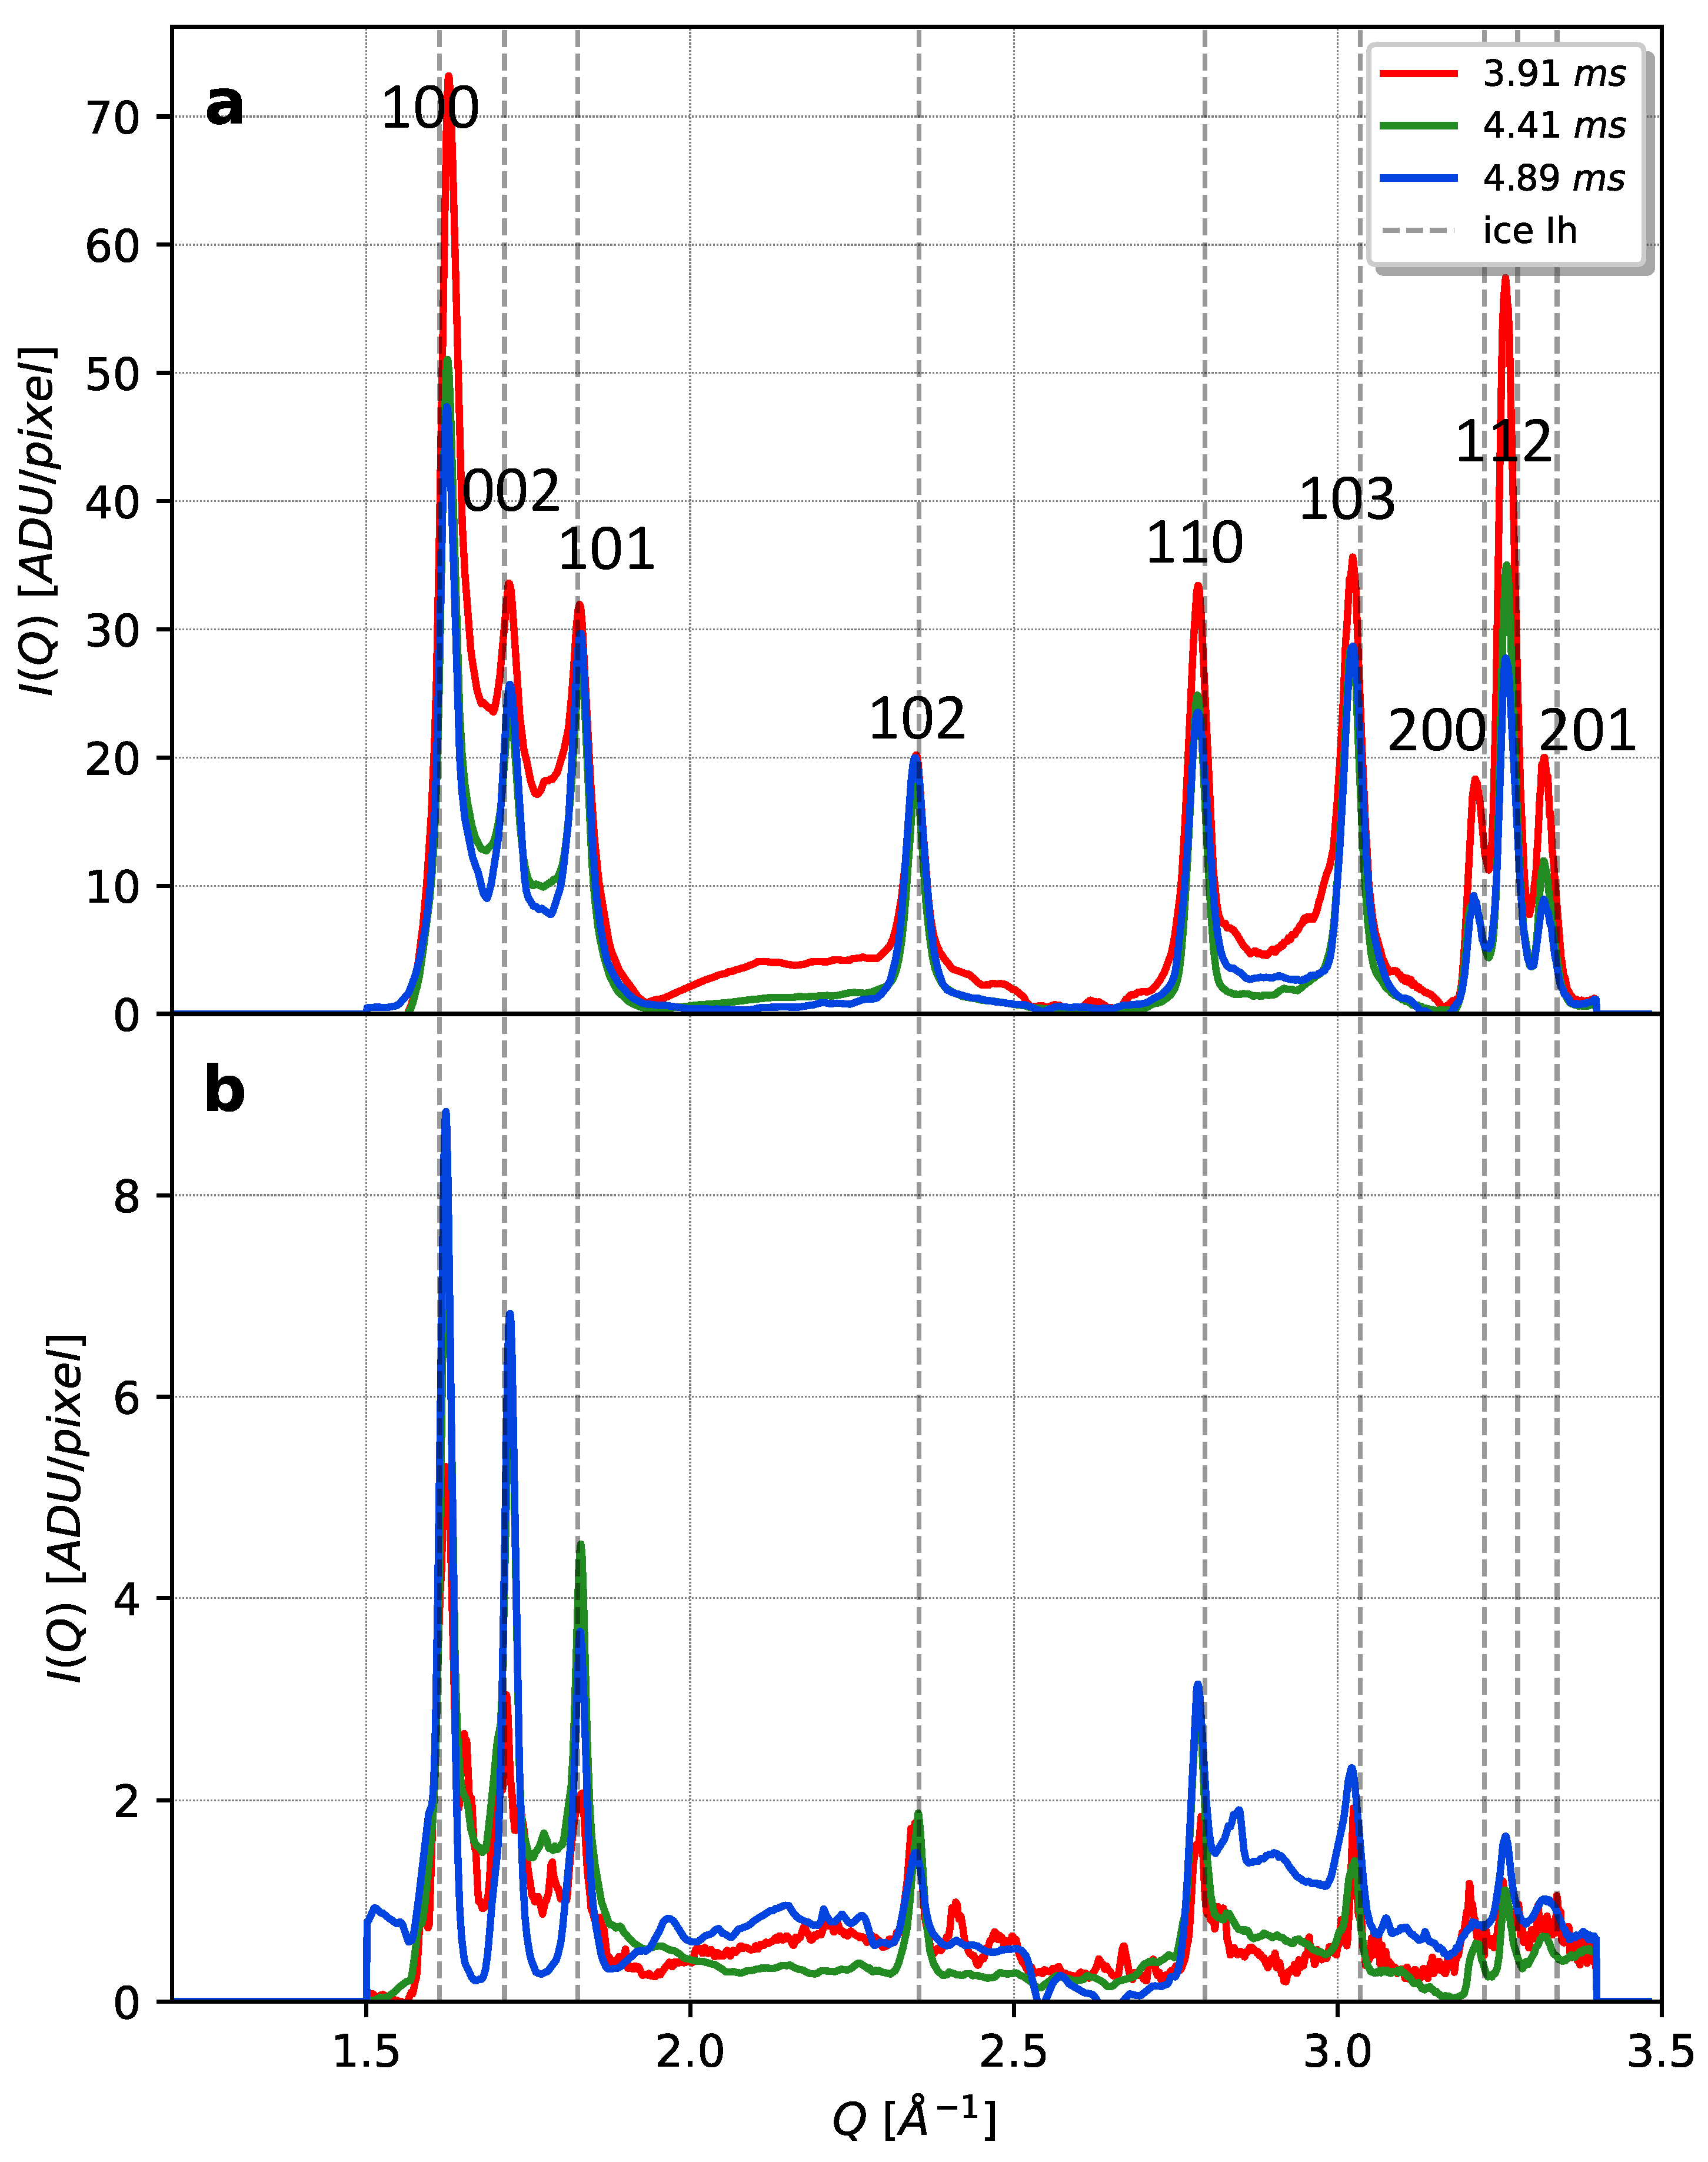
To investigate any intensity dependence and gain more accurate information about the exact peak locations, the radial profiles of two sub-ensembles were calculated based on a threshold of maximum intensity in the radial profile of 50 ADU/pixel, denoted weak (<50 ADU/pixel) and strong (≥50 ADU/pixel) hits. Both sub-ensembles were background-subtracted to minimize the effects of the water background on peak height and position. As shown in Figure 2a, the strong hits still appear completely hexagonal and remain hexagonal ice no matter what the travel time is from the nozzle. Based on the height of the (002) peak, which matches the location of the (111) peak for cubic ice (Figure A14) [30], the weak hits clearly have a larger cubic character than the strong hits. We estimate the cubicity ( χ ) using three different models (Section 2.2.3) to be 8–20% at 4.41 ms (Figure A12) and 11–26% at 4.89 ms (Figure A13). At 3.91 ms, the small number of hits and residual background limit us to estimating χ from the peak height of two phase-separated macroscopic phases to about 9% (Figure A11). The peak locations show a trend of shorter reciprocal distances than reference values [51], except for the (100) peak that is shifted to higher Q. As the (100) peak is located close to the rising edge of the water ring and differs quite significantly from half the reciprocal distance of the (200) peak, we expect it is still shifted despite background subtraction. Based on the peak location of the (200) peak, the hexagonal ice structure has an in-plane lattice spacing a = 4.518 Å at 3.91 ms and a = 4.520 Å at 4.41–4.89 ms, which agrees well with reference data at high temperature [62]. Based on a linear extrapolation of reference data between 227–273 K, the estimated lattice spacing corresponds to a temperature of 236 K at 3.91 ms and 256 K at 4.41–4.89 ms. Although increased temperature due to rapid latent heat release is expected, our peak position estimates do not have the precision to accurately determine the droplet temperature subsequent to nucleation.
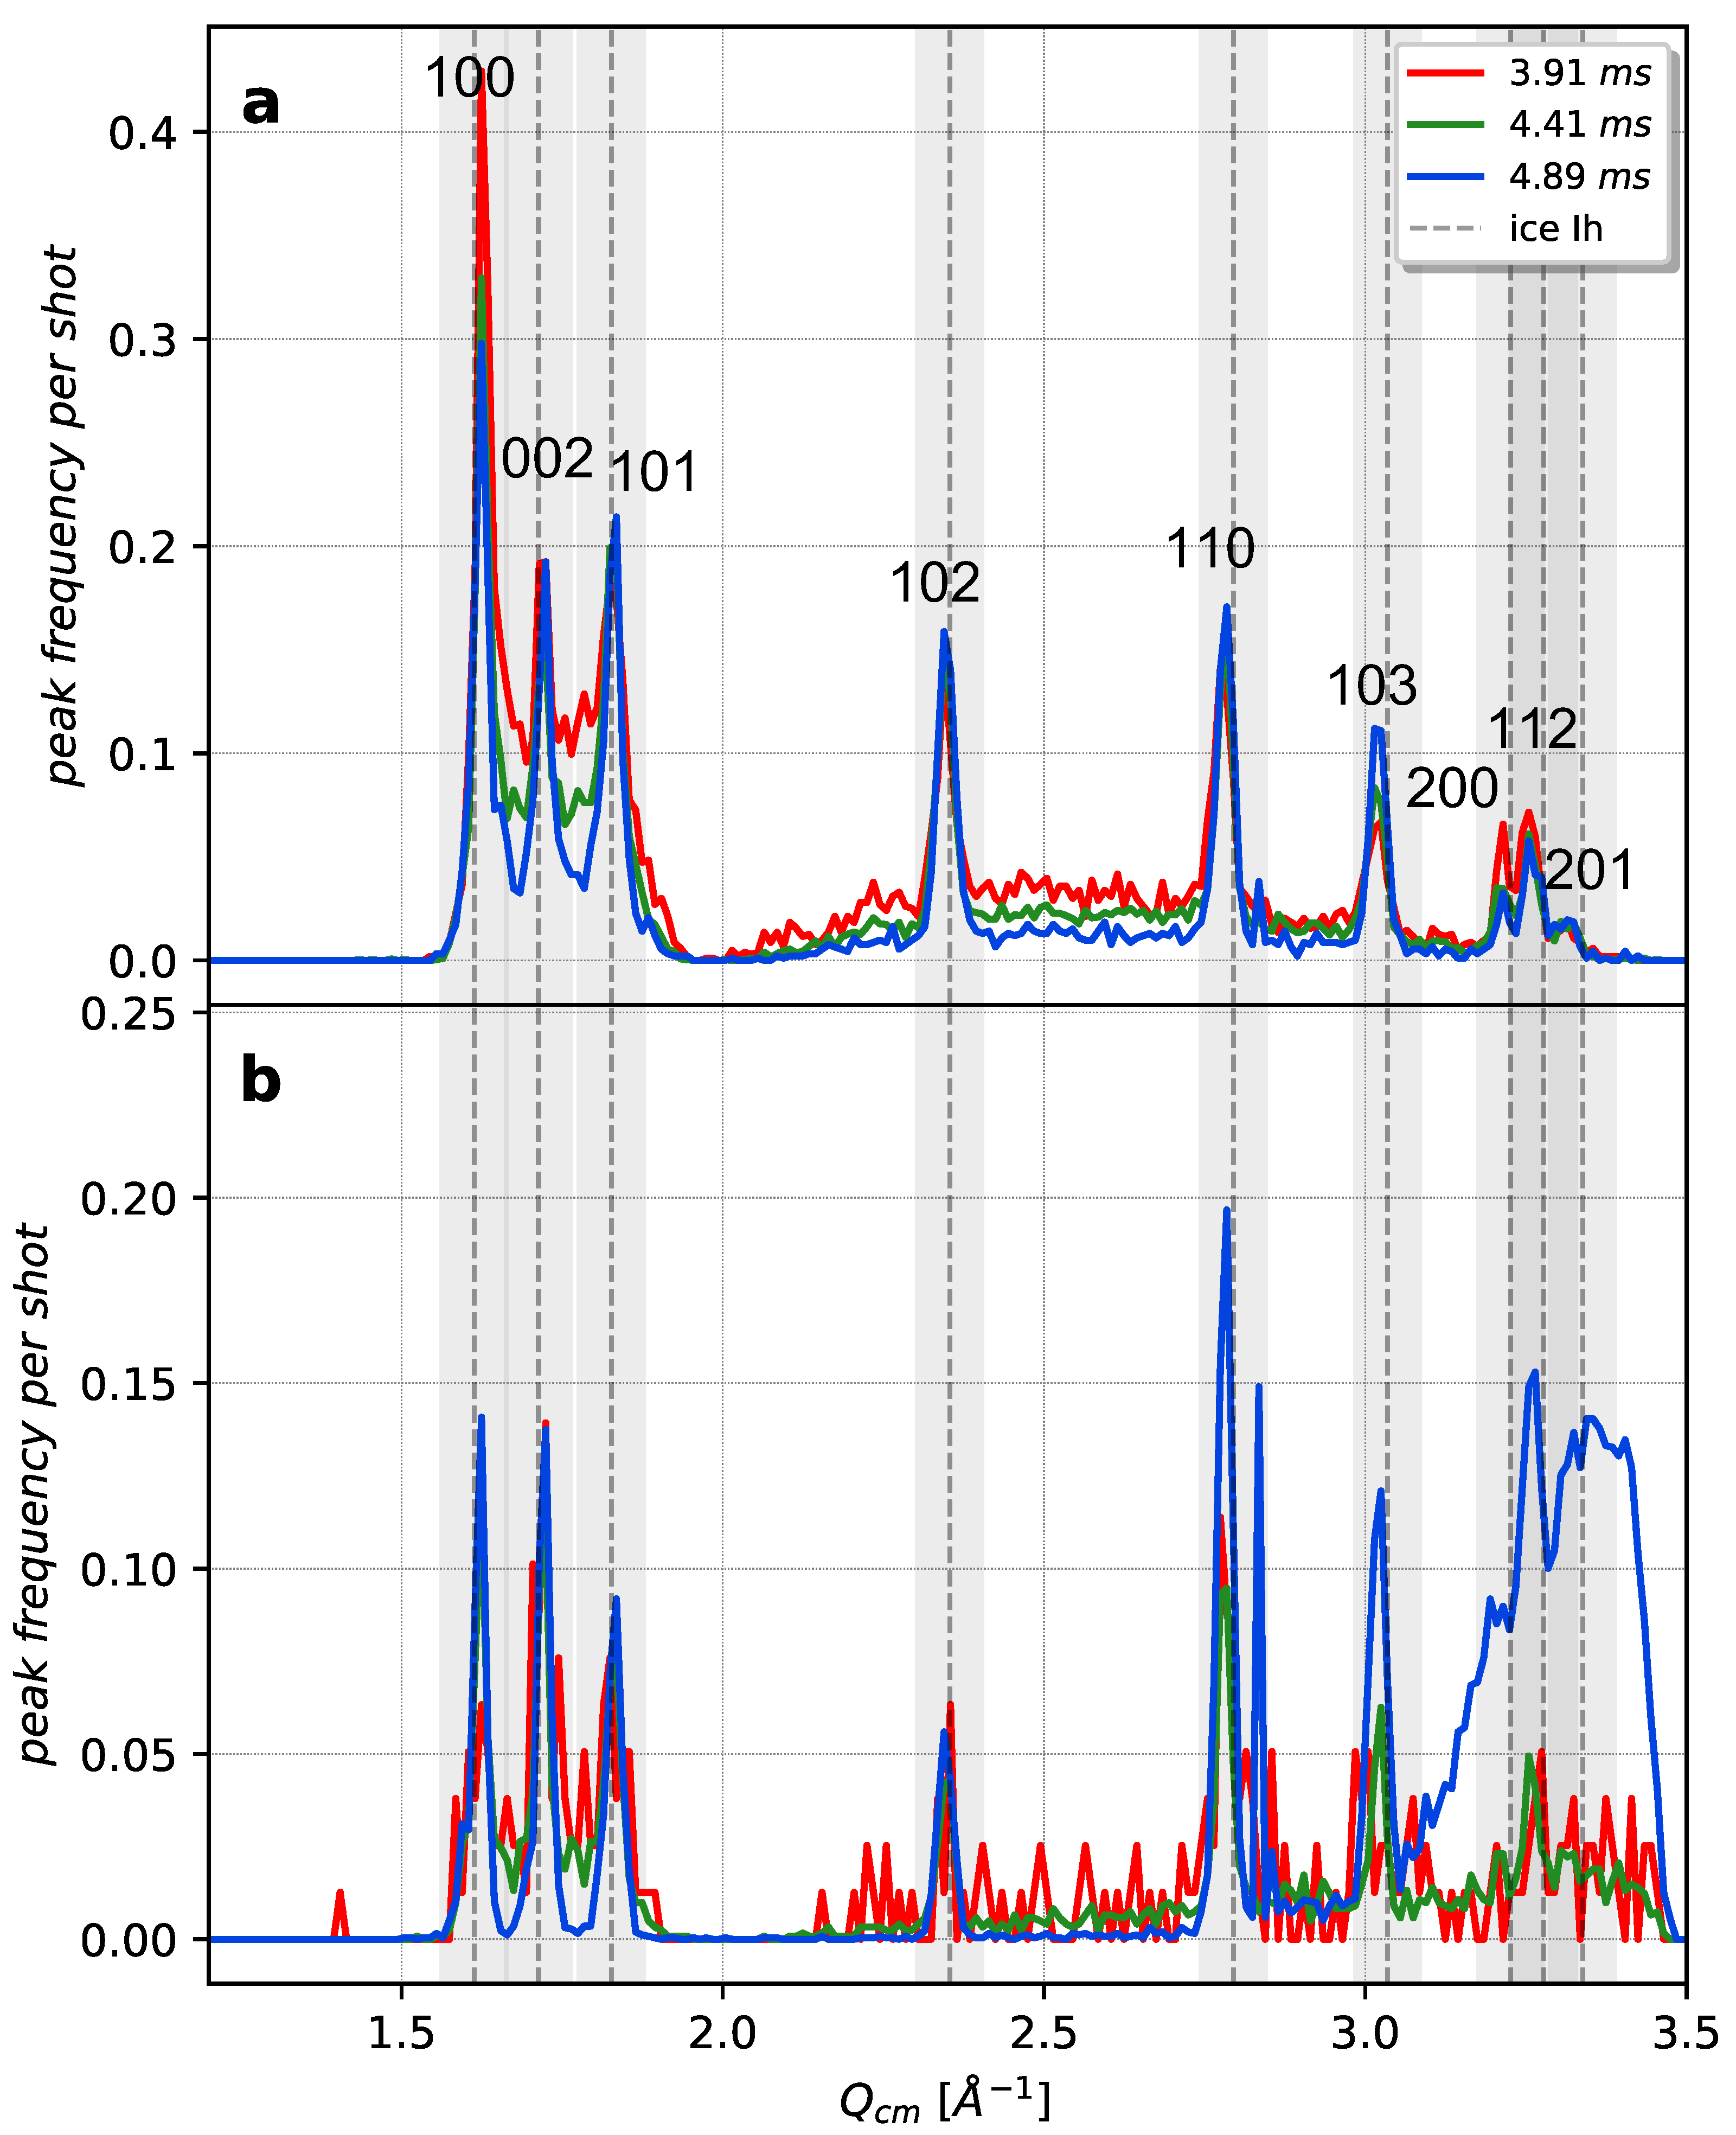
In Figure 3, the number of peaks having a Q c m at a certain position is depicted per shot-basis for weak (<50 ADU/pixel) and strong (≥50 ADU/pixel) hits. For the strong hits, the large majority of classified Bragg peaks have a Q c m close to an expected Bragg reflection, which suggests that our image segmentation algorithm is adequate. It is also more frequent for the Bragg peaks to occur at the same location as the hexagonal ice Bragg peaks than for weak hits, meaning that for the strong hits we most likely have a larger proportion of hexagonal ice structure than for the weak hits or significantly higher number of crystallites than one per shot in the X-ray interaction region for all three travel times. We note that especially for strong hits at 3.91 ms, the (100) peak is the most frequently occurring peak, despite having 6 locations in 3D reciprocal space (compare to e.g., (101) having 12 locations in ice Ih and (111) having 8 locations in ice Ic), suggesting an orientational preference of the X-ray beam along the (001) direction. This is supported by a strong (200) peak, although the solid angle covered by the detector at Q = 3.2 Å−1 is very limited. For the weak hits at 4.89 ms there is a broad distribution of peaks around 3.0–3.5 Å−1, which suggests that the peak-finding algorithm fails at too low intensities. The Q-dependent corrections will amplify noise and background scattering at high Q where the signal-to noise ratio (SNR) is low, which results in peak artifacts. We therefore limit our peak-by-peak analysis to the (100), (002) and (101) peaks for weak hits.
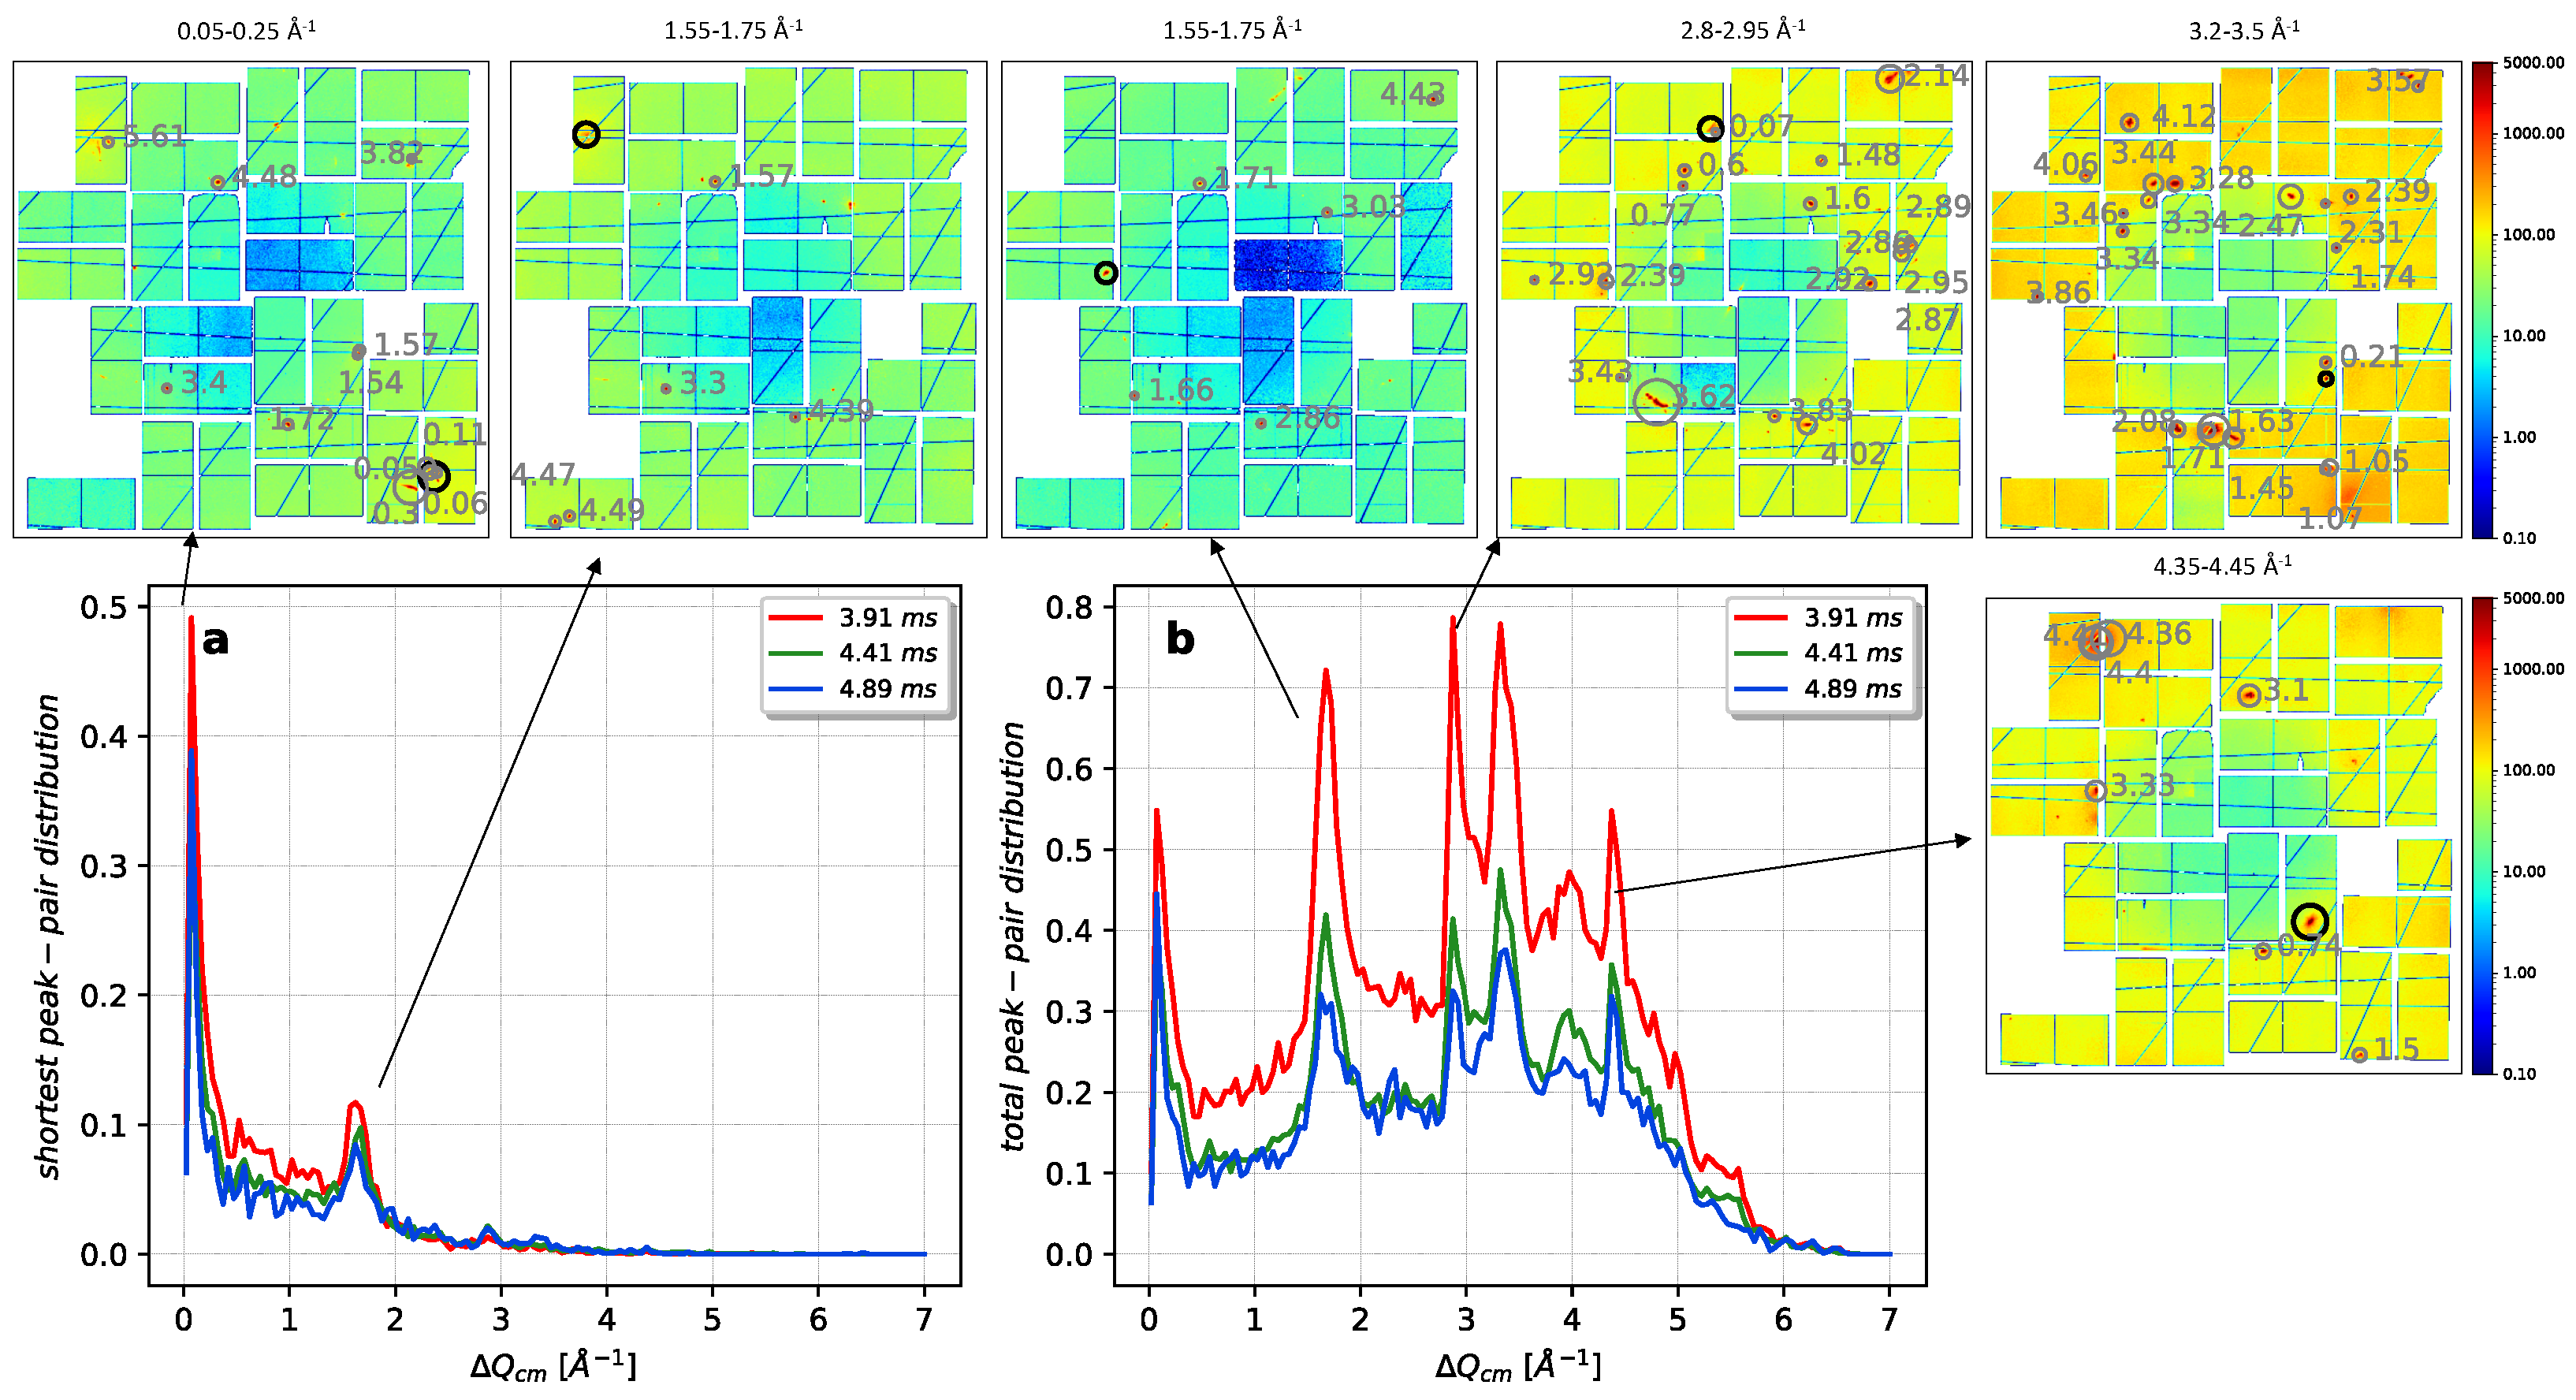
The distribution of a pair of peaks in a shot for a given reciprocal distance as well as the minimum reciprocal distance to the nearest peak are shown for the strong hits in Figure 4. It can be seen from the figures that some specific reciprocal distances are more abundant than others as we see sharp maxima in the distribution functions. It is apparent that a large population of the peaks in each shot on average are located at a Δ Q c m distance of 1.55–1.75, 2.8–2.95, 3.2–3.5 and 4.35–4.45 Å−1 from each other. These maxima can represent the correlations between the reflection planes within a lattice or between different lattices within the same droplet. The latter is statistically unlikely unless there is a preferred orientation between the crystal lattices. The spacing between the correlations hints to how the crystal is oriented in real space. As the in-plane structure of ice I has 3-fold rotational symmetry [30], 6-fold symmetry is expected for the (100) reflection plane. The diffraction pattern with a peak correlation at Δ Q c m of 1.55–1.75 Å−1 in Figure 4 clearly shows this 6-folded symmetry, which suggests that diffraction patterns in the correlation maxima have an increased probability of probing the in-plane structure.
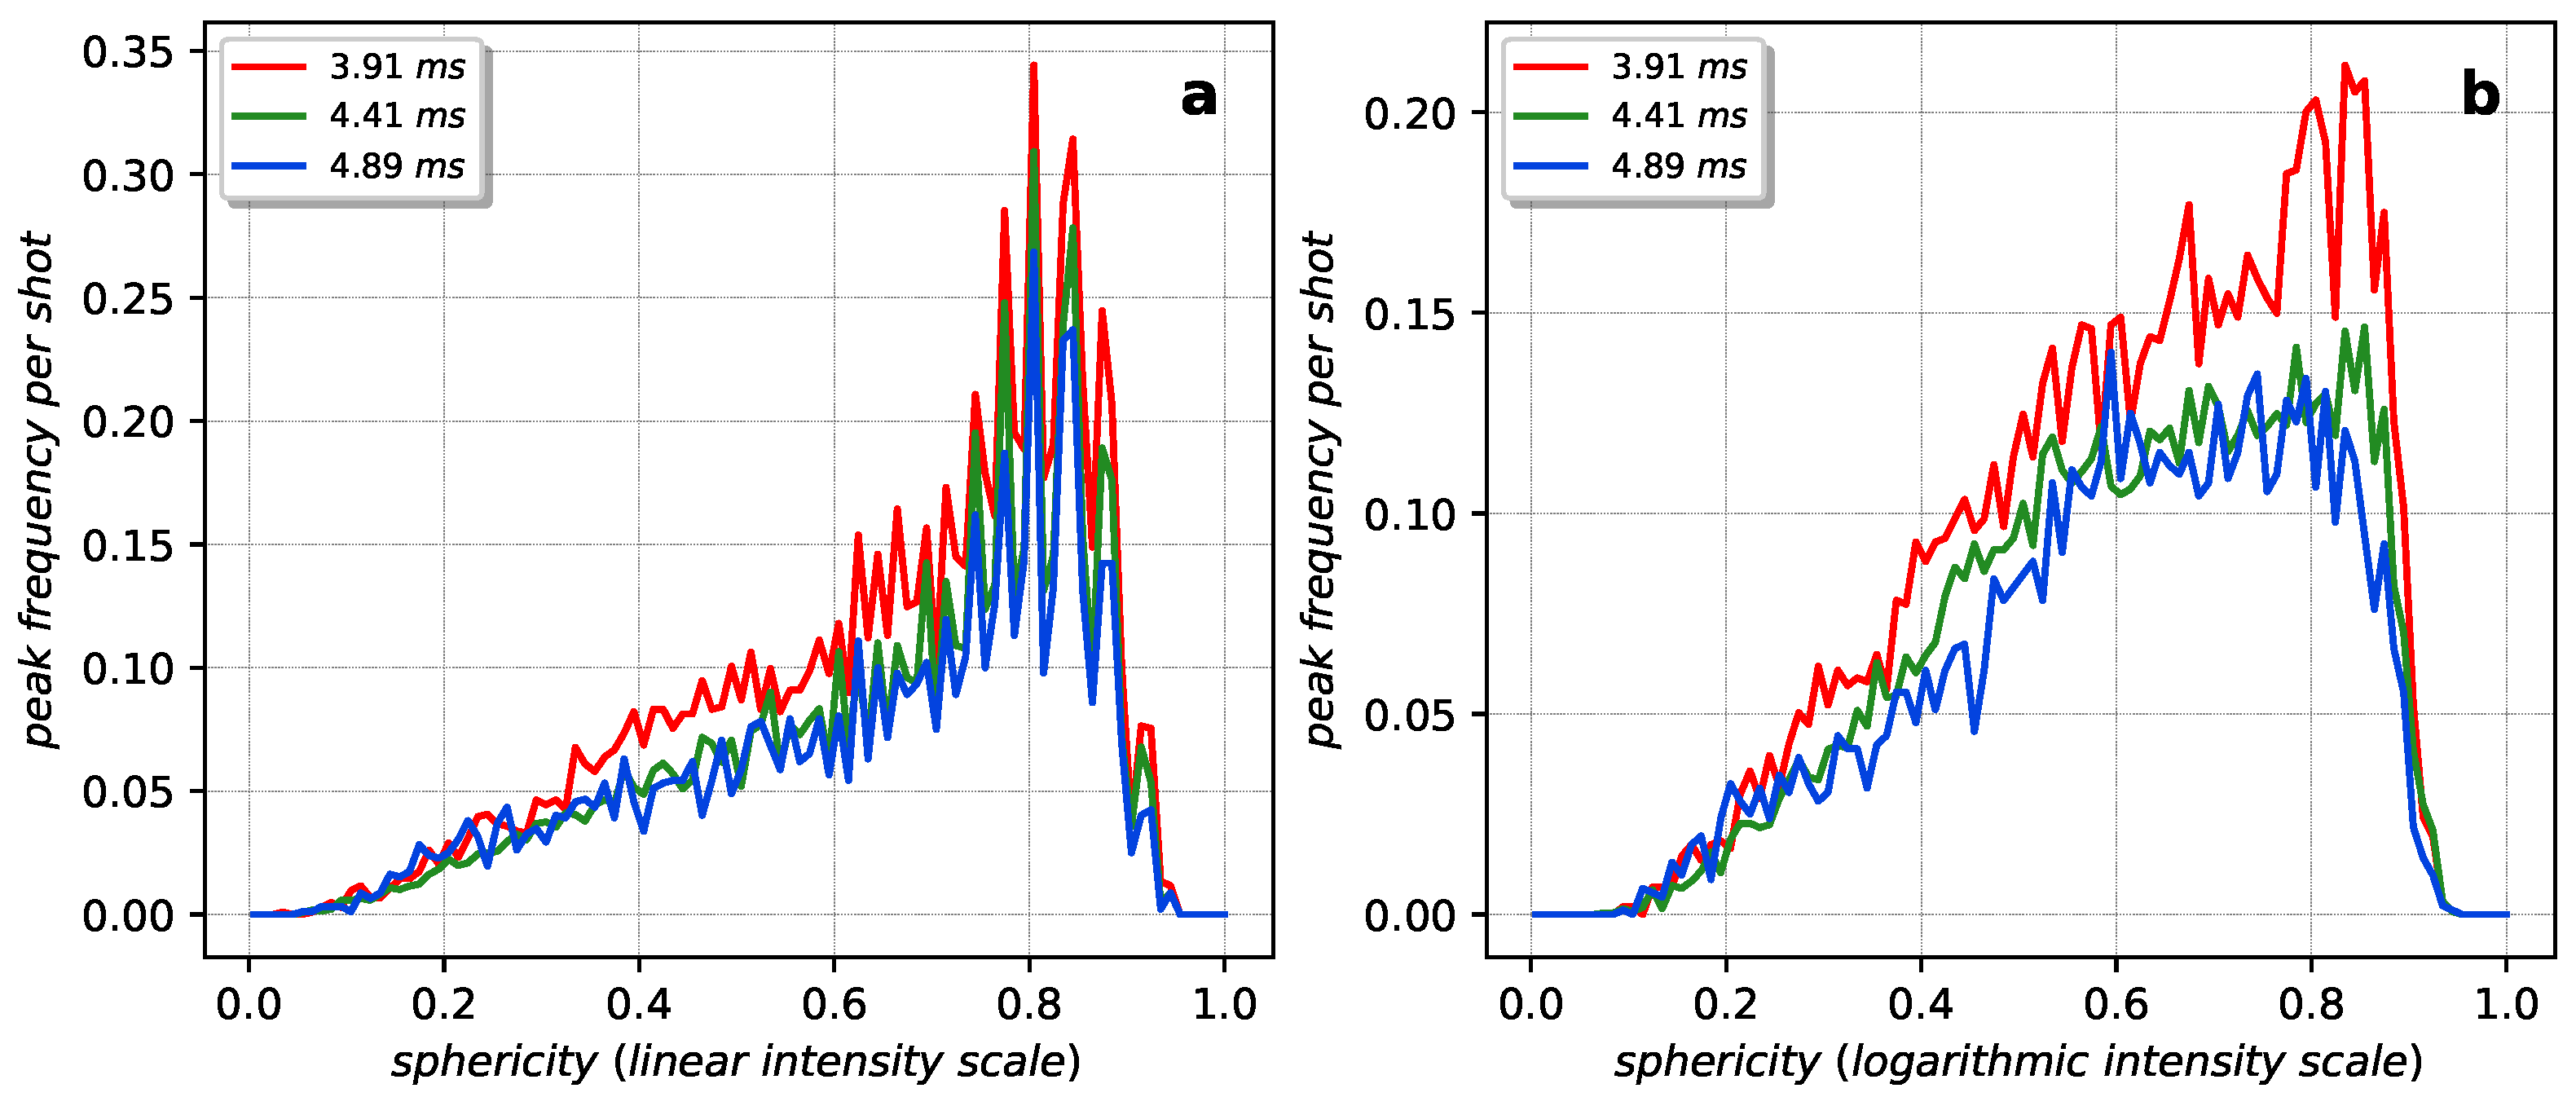
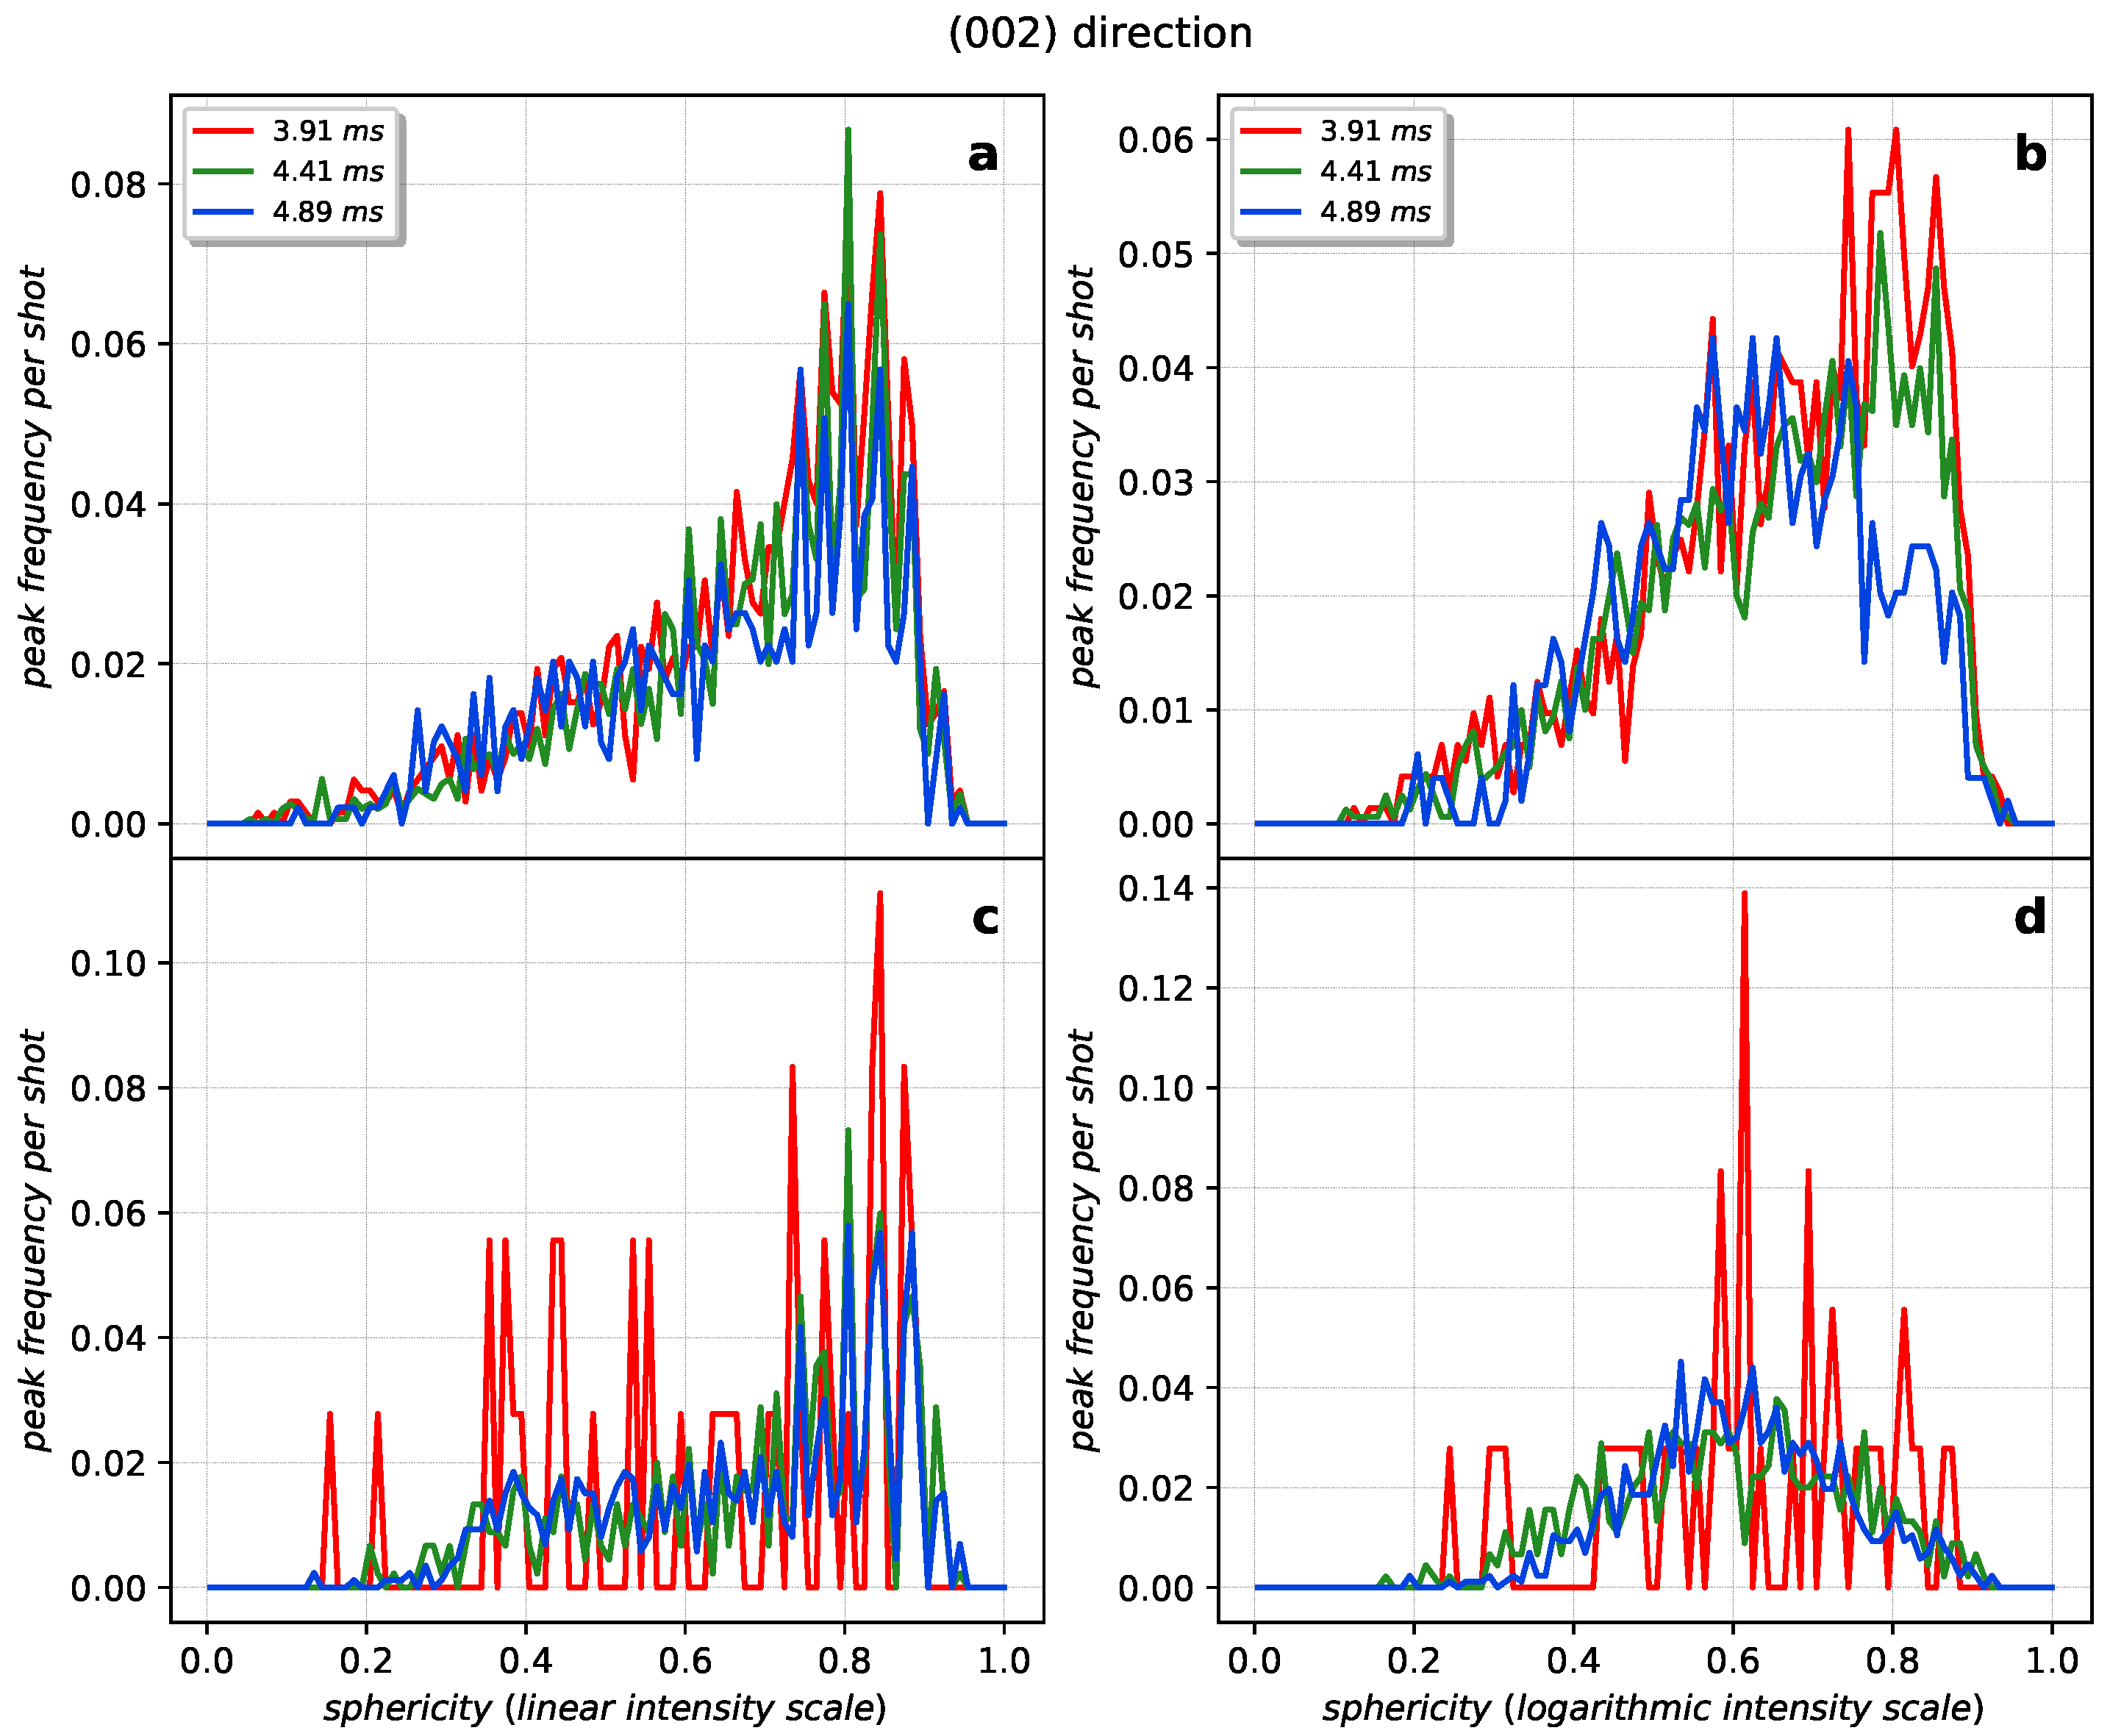
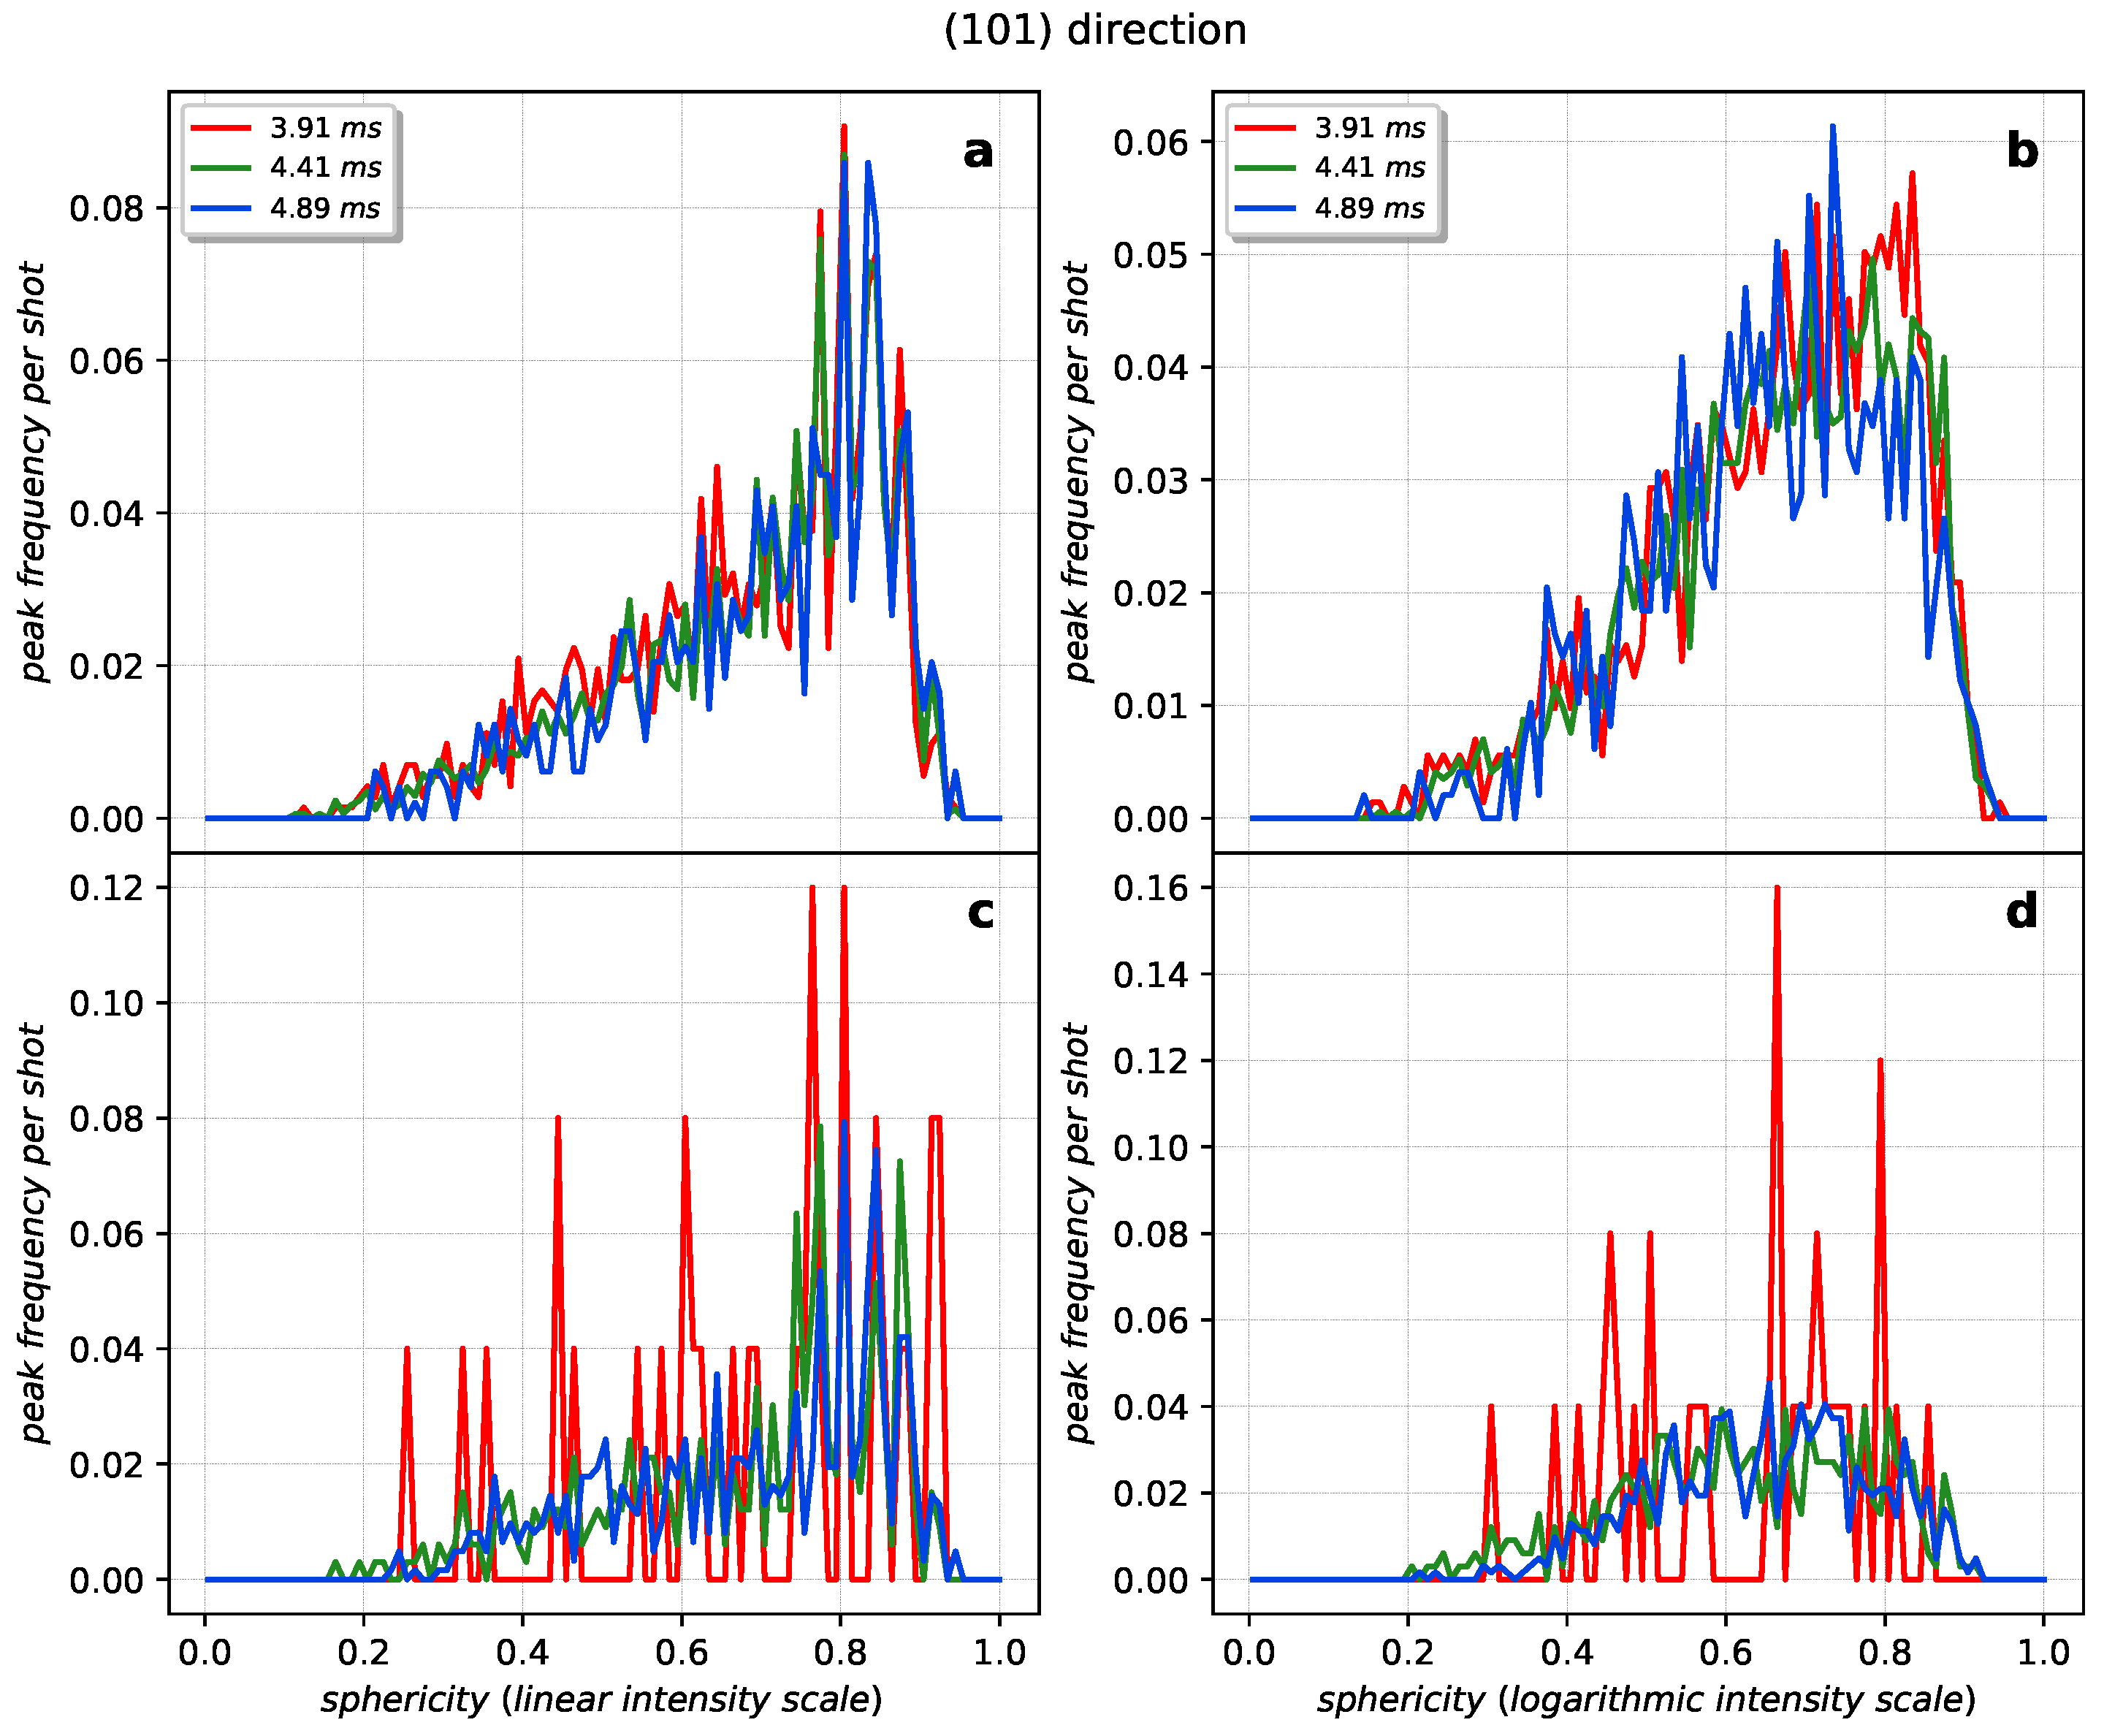
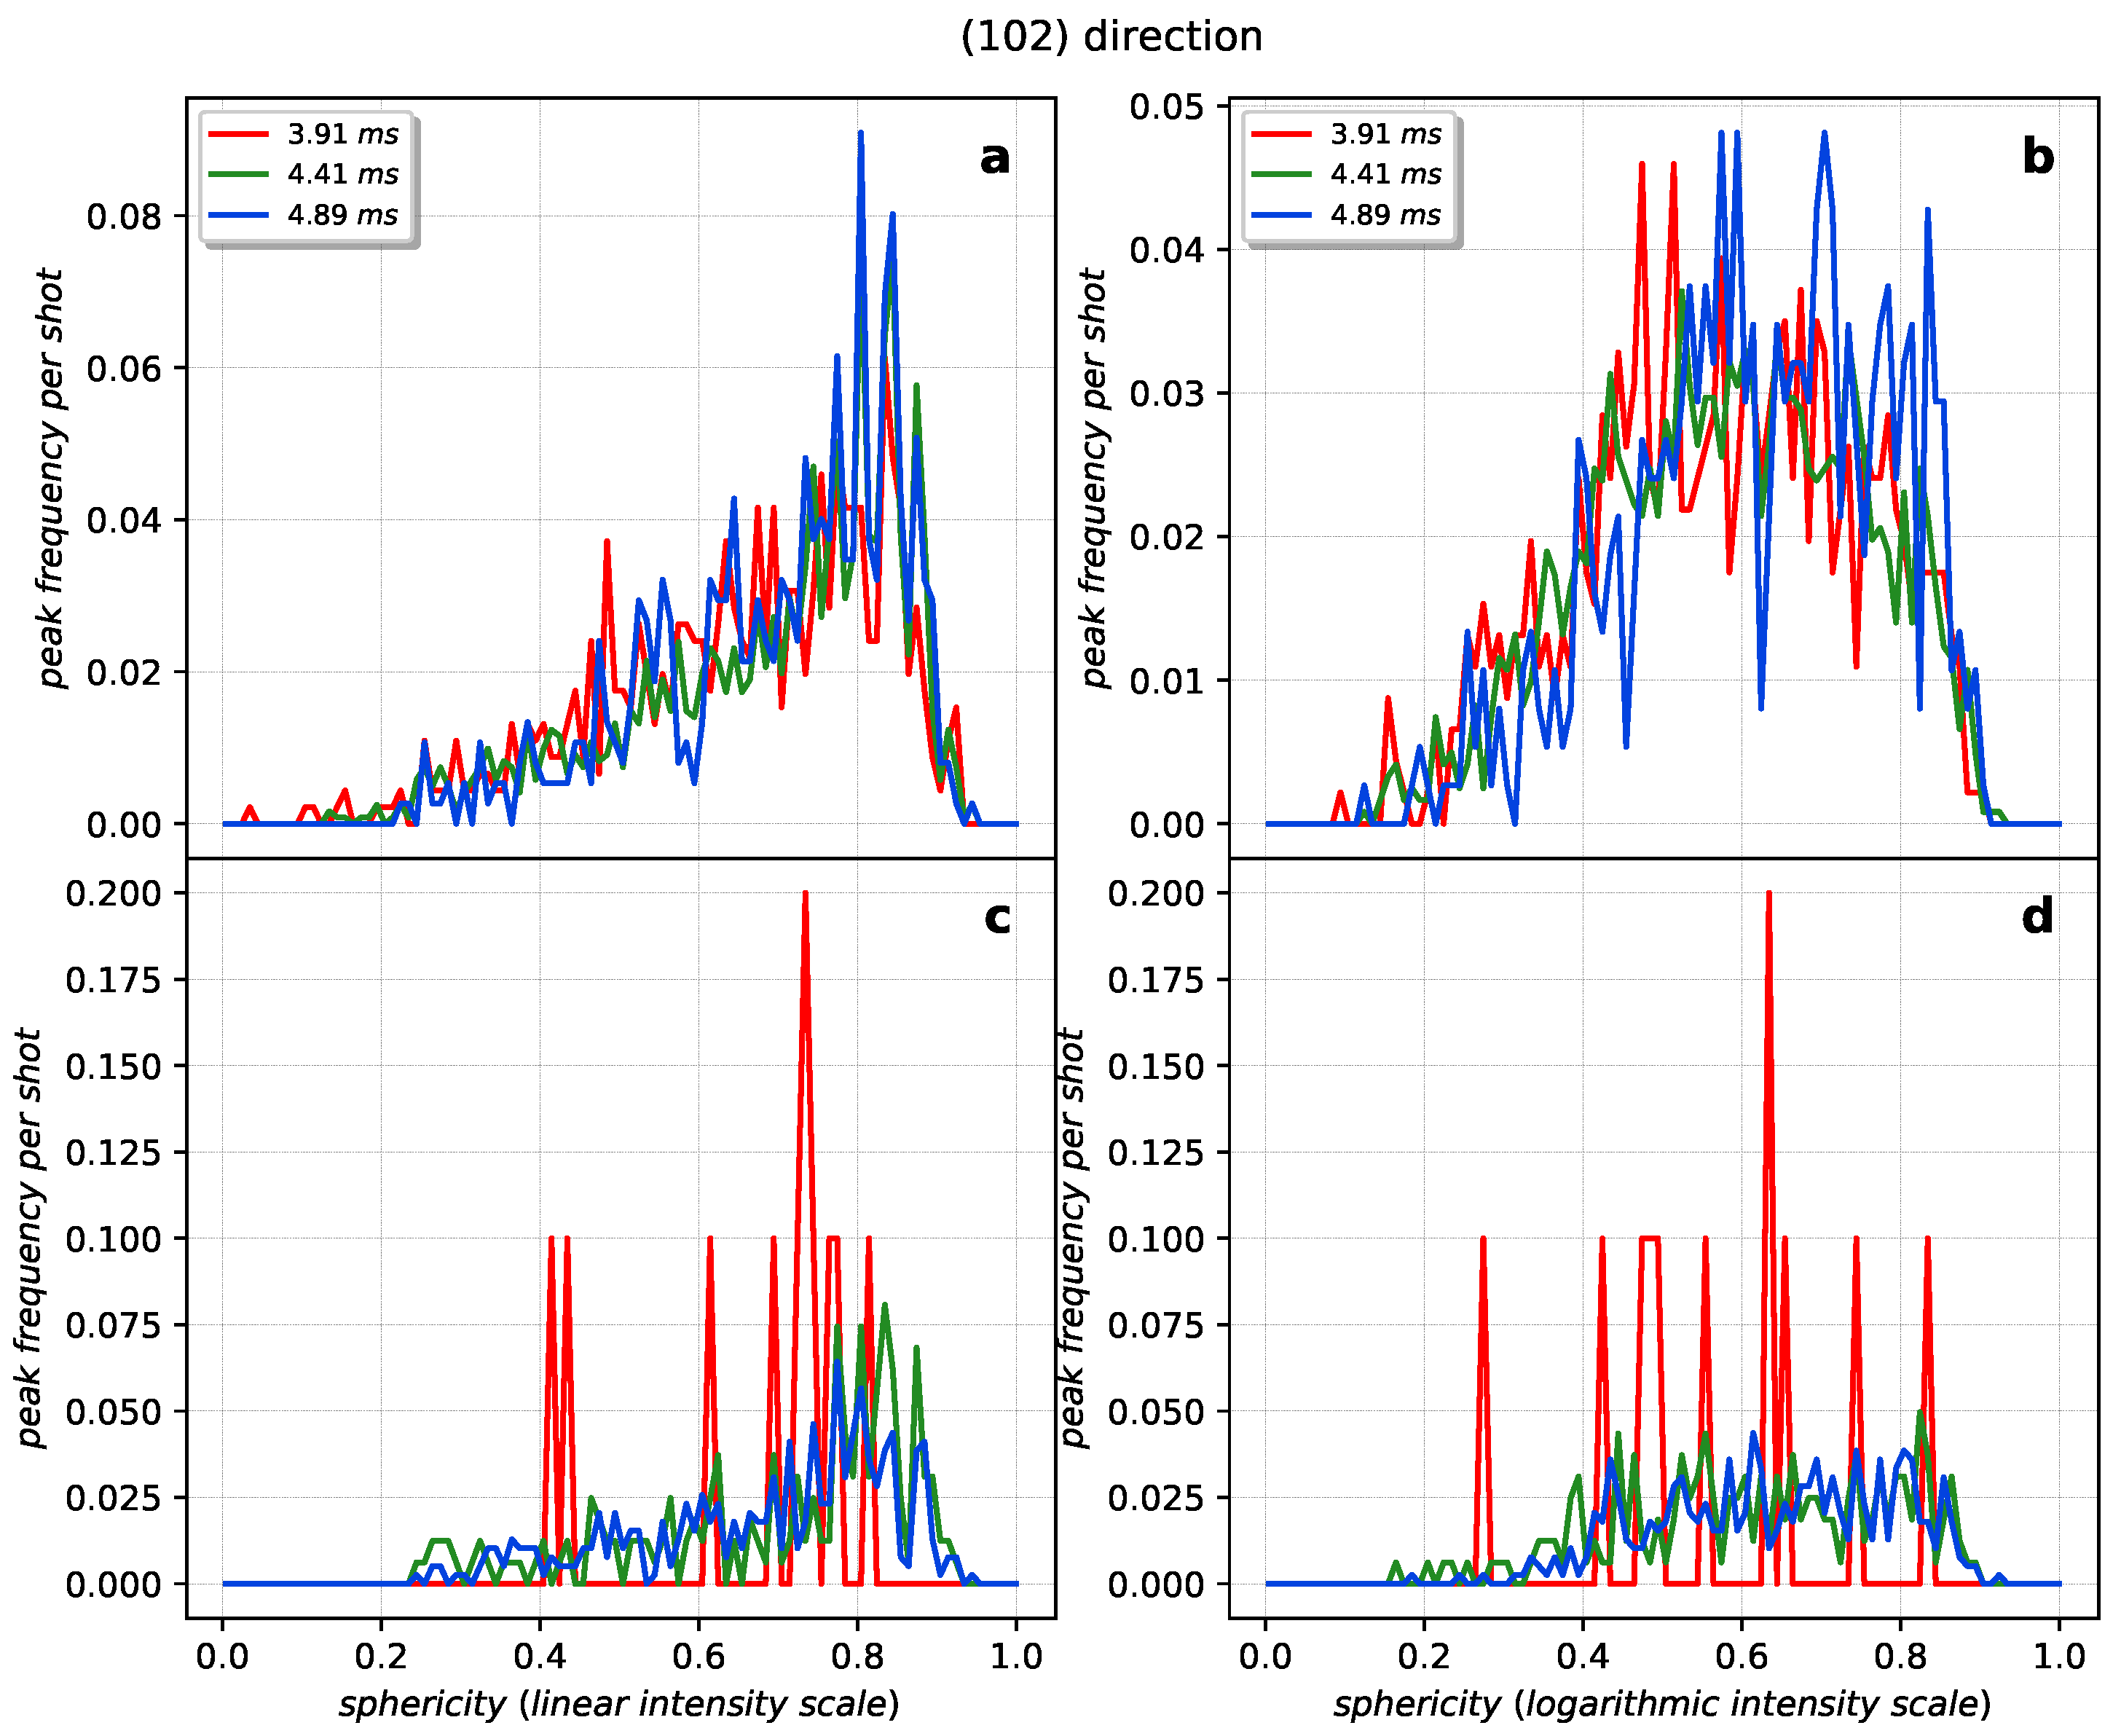
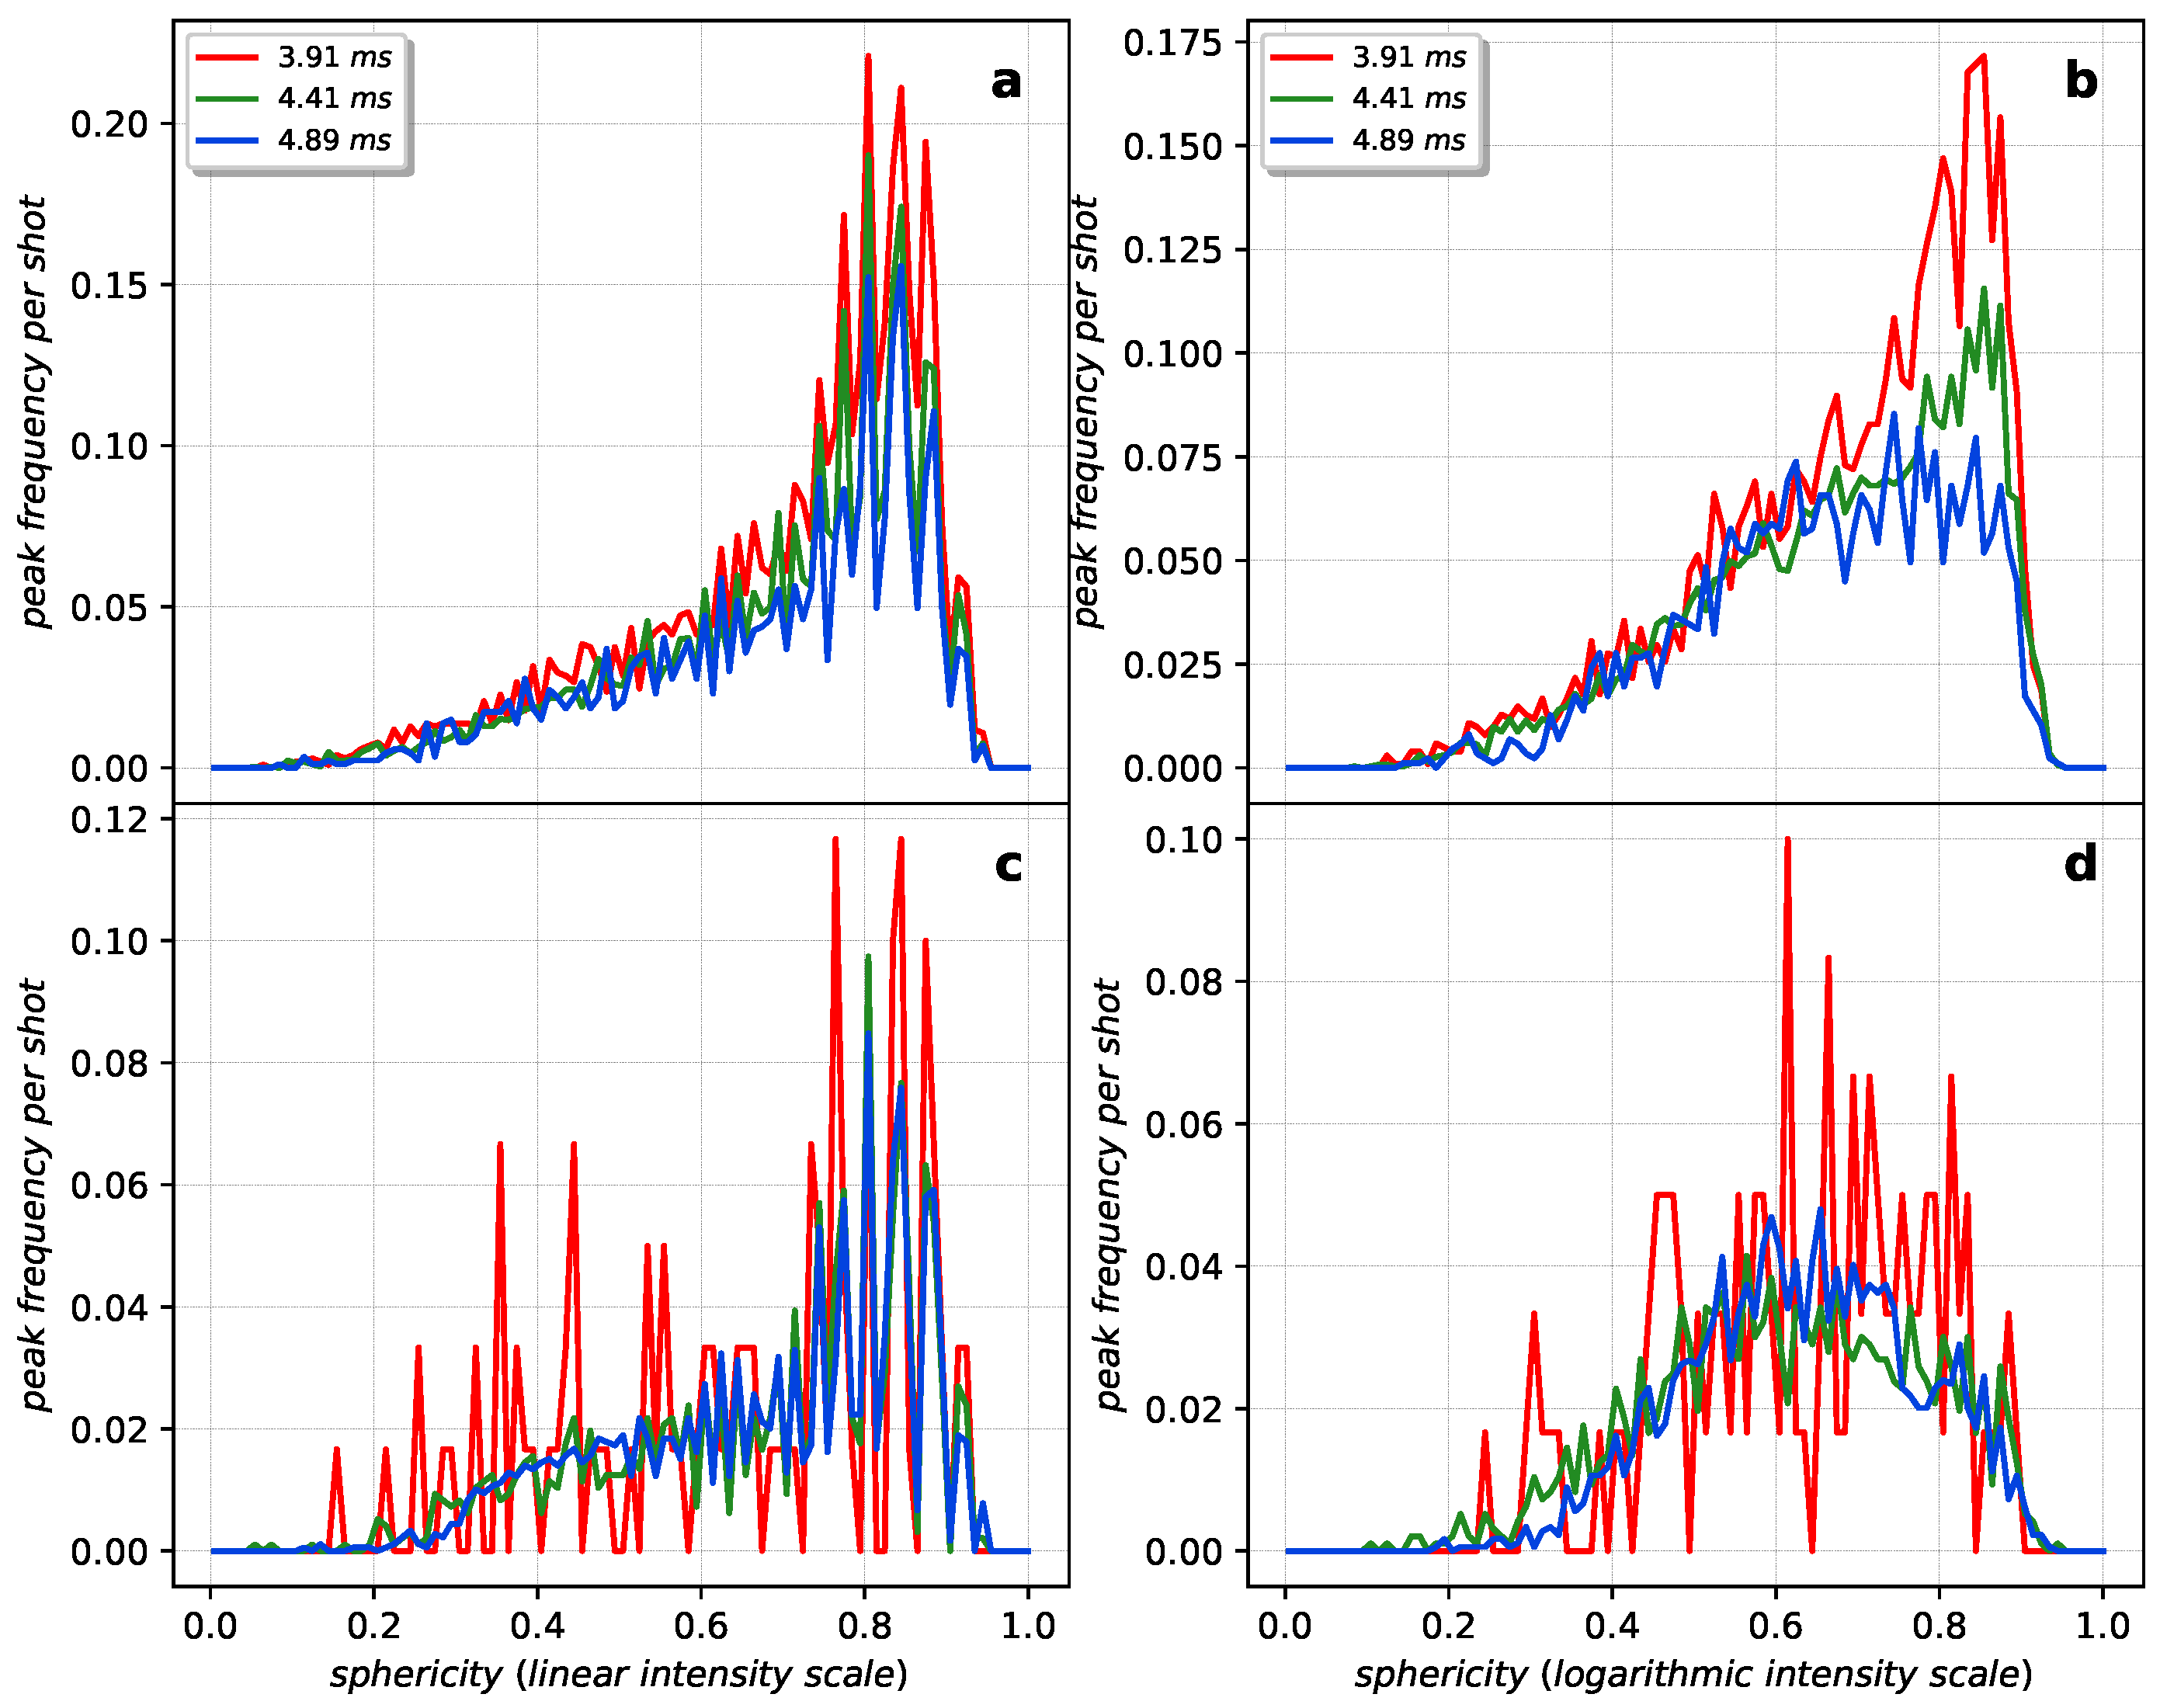
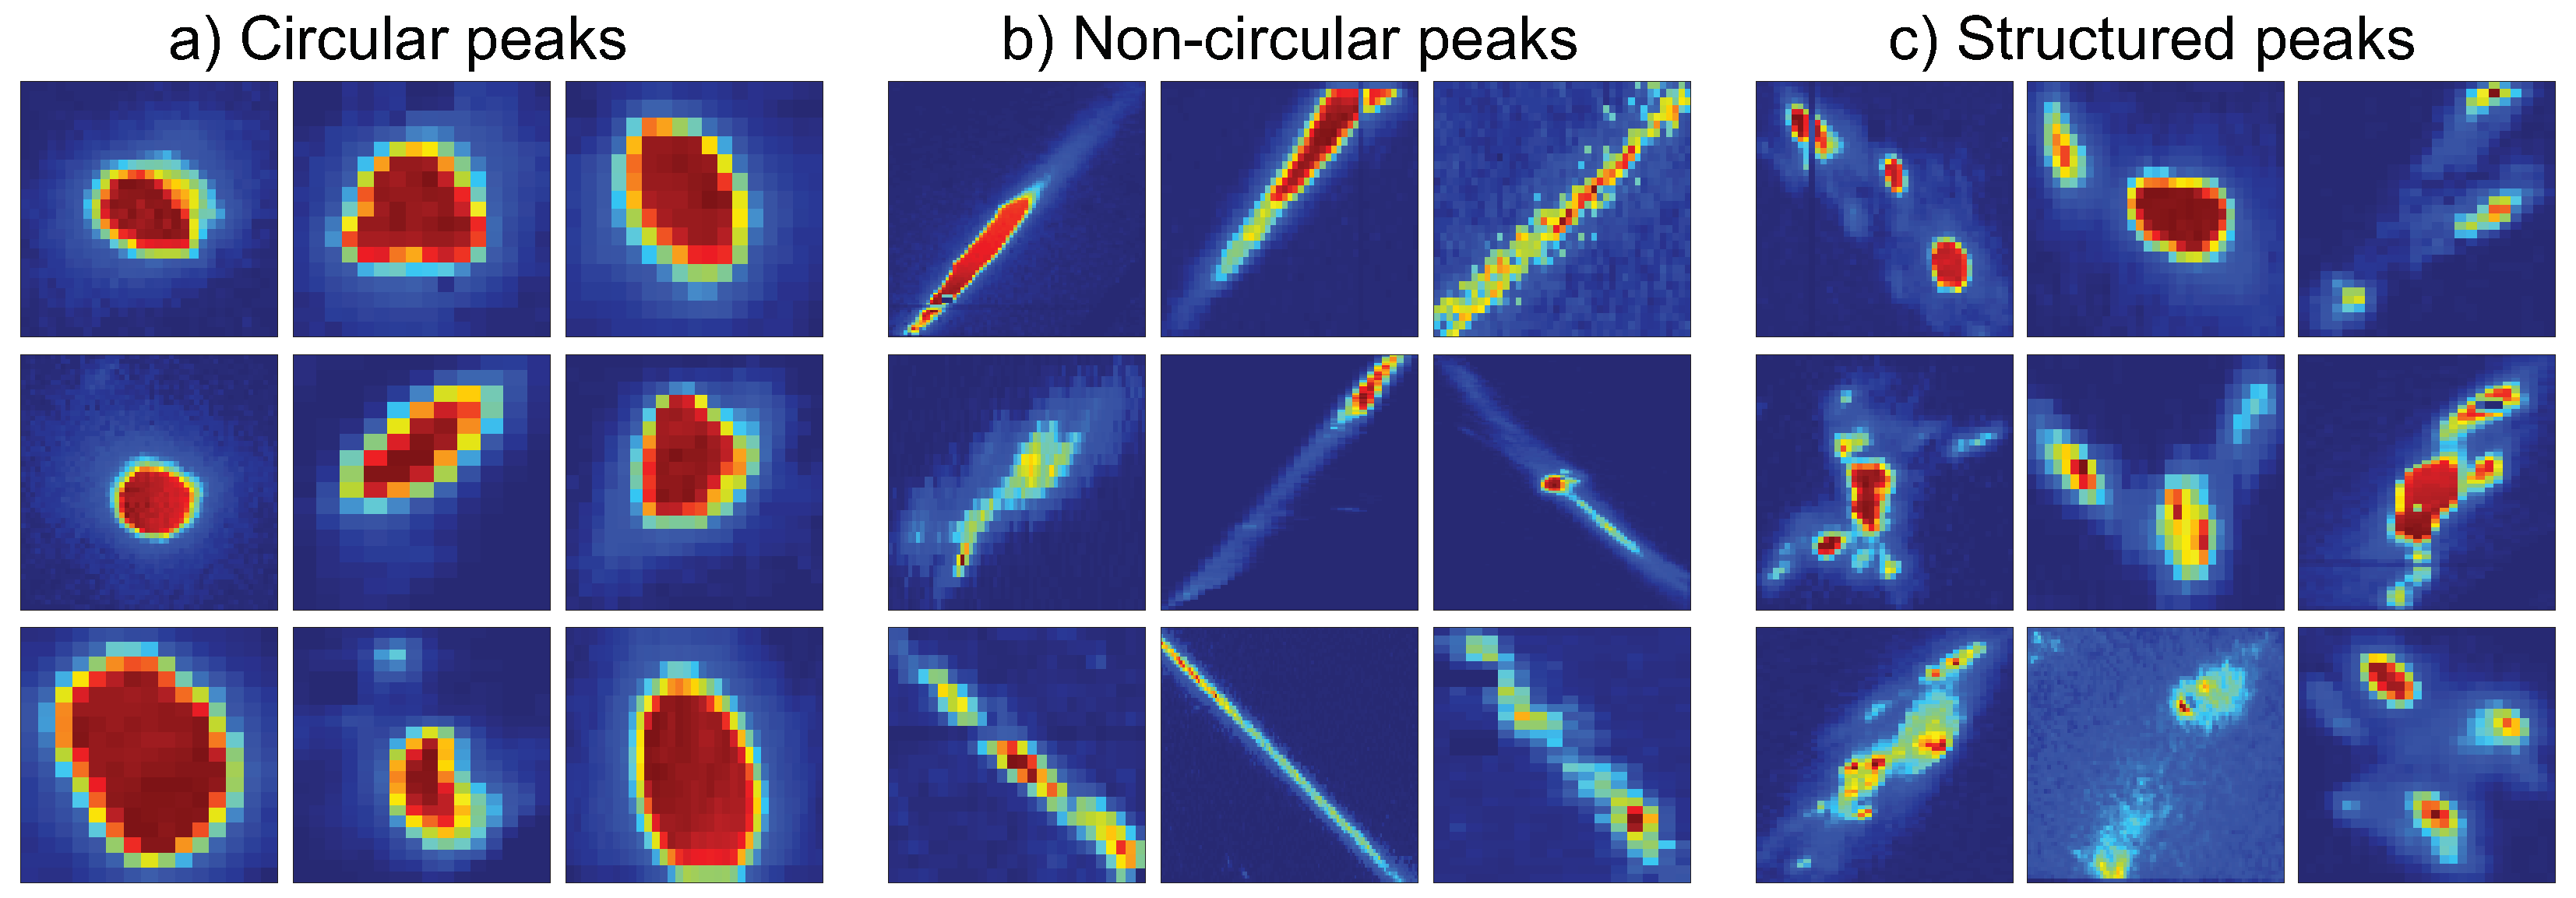
We can get an estimate of the geometrical peak shape by calculating the sphericity of individual peaks. The degree of a peak appearing as a circular disk or as a streak in the diffraction pattern can be determined by how close the sphericity of the peak is to 1 or 0, respectively. Figure 5 illustrates the sphericity of the peaks for strong (top panels a and b) and weak (bottom panels c and d) hits in a logarithmic and linear intensity scale used for contour detection. It is evident that the logarithmic intensity scale is more liberal in its contour detection (Figure A10), which results in a lower average sphericity. Furthermore, the strong hits tend to contain more circular peaks while the weak hits seem to contain fewer circular peaks compared to the strong hits. Through visualization, one can assign a sphericity value to a peak being classified as circular, non-circular or any other type. Three possible classes that can occur in the diffraction pattern are shown in Figure 6. The first class is defined for the peaks that have one local maximum in a peak region, a minimum reciprocal distance of at least 0.2 Å−1 to its closest neighboring peak and a sphericity higher than 0.7. We expect peaks with these properties being highly circular and thus the crystals having two real-space dimensions of similar size. The second class contains those peaks with the same criteria as the first class except that they have a sphericity of less than 0.3. These peaks should show single streaks, since they are expected to be non-circular and have an elongated shape. Hence, it may give information on crystal truncation rods and crystal orientations that grow slowly. Finally, the last class contains “structured peaks” that are either multiple maxima in a peak region or those peaks with a single maximum and a minimum reciprocal distance of less than 0.2 Å−1. These structured peaks are statistically unlikely for random crystal orientations and are therefore often related to planar and line defects in the crystal, such as twinning. Detailed peak statistics for total and classified hits (weak and strong) are given in Table 1 and Table 2.

4. Discussion

The obvious approach to study crystal structure in coherent diffraction patterns would be to Fourier-transform the data and obtain a reconstructed 3D density through iterative phase retrieval. However, two technical limitations in our recorded data makes it difficult to reconstruct the real-space structure. First, the fringes due to the crystal shape are not clearly resolved, resulting in that the obtained autocorrelation may deviate strongly from the true autocorrelation of the crystal shape, especially if the fringe spacing is shorter than twice the pixel size of the detector (∼0.003 Å−1), corresponding to an upper limit of ∼100 nm in crystal size according to the Nyquist-Shannon sampling theorem. Second, many of the Bragg peaks saturate the detector response at ∼100 photon/pixel, which means the reconstructed crystal shape may not be a unique solution if missing modes exist in the shape transform. Nevertheless, the undersampled autocorrelation suggested ice detection of individual crystals as thin as ten nanometers (Figure A15), whereas the high intensity of the saturated Bragg peaks indicated that the crystals in many of the strong hits must be at least ∼100 nm thick. This assumes perfect constructive interference between unit cells. Whether these estimates contradict each other or are merely a result of the heterogeneous crystal shapes requires further experiments with smaller droplets (∼1 μm) and higher resolution in reciprocal space on the order of ∼0.0003 Å−1.
We chose to divide our ensemble of ice hits into strong and weak hits based on their maximum intensity in their radial profile. In the powder diffraction limit, stronger hits should mean that the X-ray pulses are probing more of the center of the droplet, while weak hits are more likely probing the edge of the droplet. Although X-ray intensity fluctuations and variations in single crystal orientations weaken this relationship, there should still be a correlation between shot intensity and spatial overlap of the droplet and the X-ray pulse. There is also a possibility that very weak hits completely miss the main droplet and only probe satellite droplets or nanoscale water and ice particles that have been expelled from the original microdroplets. It is expected that at some distance the droplet train becomes unstable and secondary processes, such as cracking or water expulsion [44], will produce more weak hits. This appears to be true at 4.89 ms, where the fraction of ice hits is 97% [47] and a majority of the shots and characterized peaks occur in diffraction patterns with a maximum intensity in the radial profile below 50 ADU/pixel (Table 2).
It is possible to do an assessment of the cubic character in our strong and weak hits from the mean radial profiles presented in Figure 2 to see how cubicity changes as the droplet travels. This can be done by modeling ice Isd with a certain cubicity or assuming two phase-separated macroscopic phases of ice Ih and Ic or Isd. The modeling of macroscopic phases of ice Ih and Ic is most robust and gives a negligible (≤1%) cubicity for strong hits and a cubicity of 8–13% for weak hits. Modeling the last two travel times with only ice Isd results in a similar amount of cubicity, but clearly increases the disorder in the crystalline phases. This is evident from the very weak (102) reflection in Figure A12 and Figure A13 that is strongly underestimated by the model. This can be improved by assuming pure ice Ih in combination with ice Isd, which results in slightly higher cubicity of 20–26%, but also increases the peak broadening, especially for the (002) peak. This puts an upper bound on the stacking disorder that is compatible with our WAXS data. Although the cubicity is increasing slightly in all three models between 4.41 and 4.89 ms travel time, it is difficult to claim that this is a significant increase for the main droplets, since the slight increase in cubicity may be due to the increased occurrence of nanoscale droplets, which are known to form ice with high cubicity [15,20]. However, if nanoscale droplets dominated the weak hits, one would expect the nucleation rate to increase rapidly and approach that of nanodroplets. Since the calculated nucleation rates of 10 11 10 13 cm−3/s [46] are about 9 orders of magnitude lower than that of nanodroplets at ∼225 K [63], we deduce that secondary processes should have a minor effect on the estimated cubicity, especially at travel times <4.5 ms.
Theory predicts that homogeneous ice nucleation begins with a cubic defect and then grows into a hexagonal crystal [9,10], along with the heat released during crystal formation annealing out the original cubic defect [11,12,13,64]. The increased cubicity for the weak hits thus suggests that homogeneous ice nucleation or initial growth could be a surface-driven process [19,65,66,67]. One could envision several hypotheses for such a process. Homogeneous bulk nucleation followed by rapid dendrite growth at ∼0.3 m/s, which has been observed optically for larger microdroplets, [68] would reach the edge of the droplet within 20 μs. The vacuum interface would then facilitate further crystallite growth along the droplet surface where the growth velocity is much higher than in the bulk [69]. Alternatively, ice nucleation could be surface-induced [65,67] due to the increased Laplace pressure in the droplet inhibiting bulk nucleation [19]. It is clear that it is not possible to diffuse sub-critical nuclei to the surface from the bulk, but a surface-induced nucleation mechanism must be evoked. We estimate the diffusivity of sub-critical nuclei of ∼1 nm at 230 K using the Stokes-Einstein relation to be on the order of D = k B T / ( 6 π η r ) 10 11 m2/s, which would result in a time t to diffuse x = 1 μm of t x 2 / ( 2 D ) 60 ms, which is much longer than the travel time prior to crystallization.
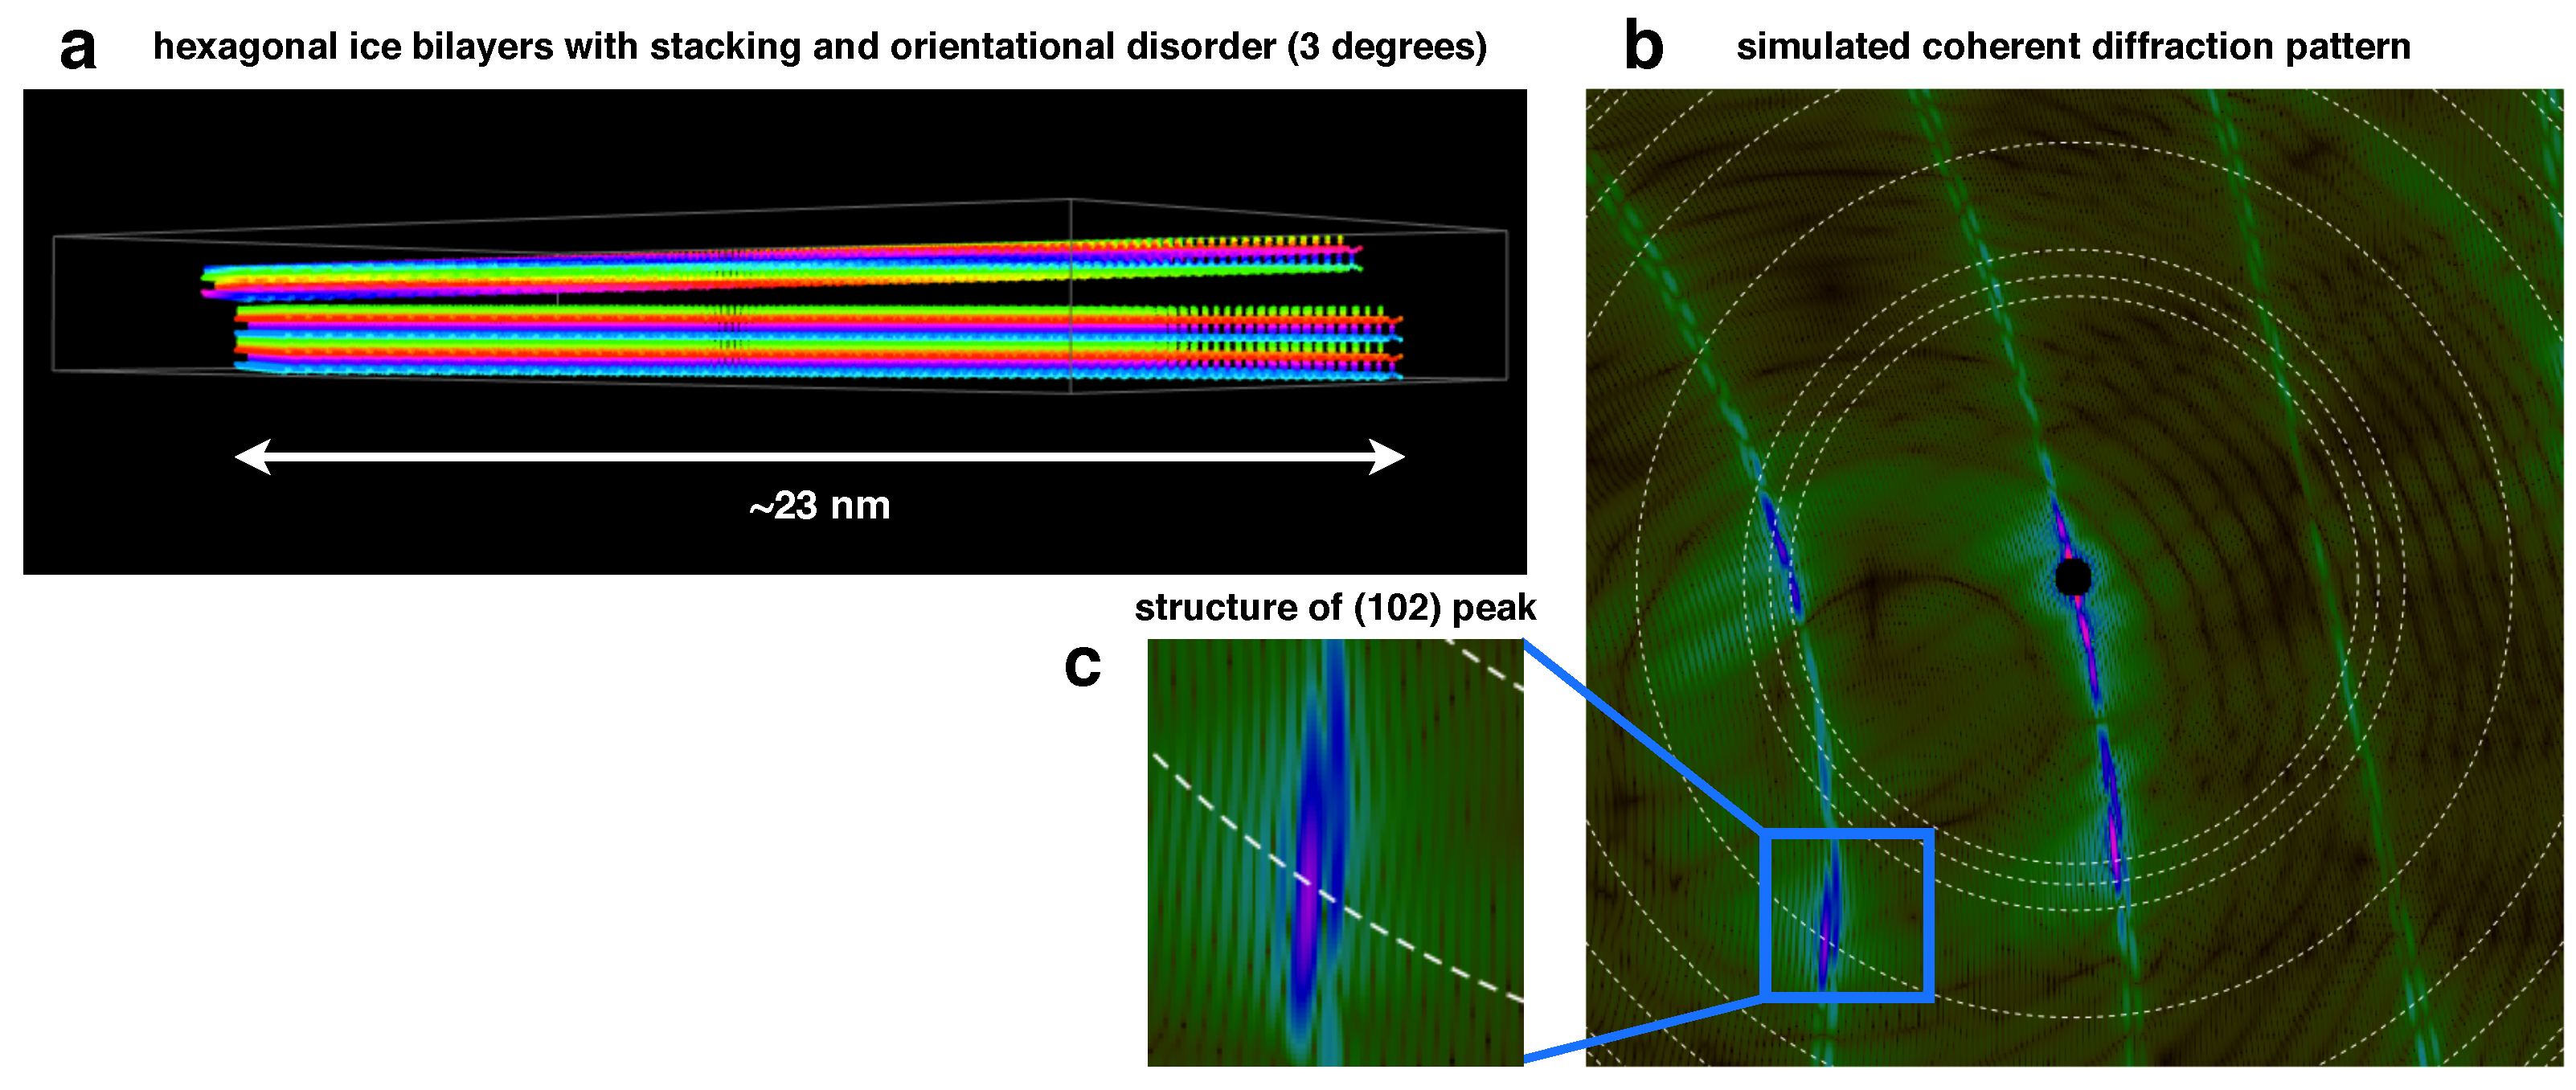
If crystallite growth occurs rapidly at the droplet interface, one might anticipate that large planar ice crystals would form with a preferred orientation. Our peak histogram and peak-pair distributions suggest that the (100) reflection plane is frequently occurring, with high translational order within the planar structure. This is supported by the high sphericity in this reflection plane (Figure A3) compared to other crystal orientations, suggesting two equally extended dimensions. Large planar ice crystals on the droplet surface should fracture into smaller and slightly misaligned domains to accommodate to the curvature of the droplets. This would explain the large number of structured peaks (Figure A15), as small angular deviations upon fracturing would result in crystallites with similar orientations (Figure A16). It would also explain the large number of crystallites for strong hits although crystallization at these conditions is nucleation limited. The even distribution of structured peaks and truncation rods in all reflection planes suggest that there is no preferred crystal orientation for fracturing, but rather an external geometric constraint. For future work, it would be interesting to analyze the angular correlations [70,71] of the coherent diffraction patterns that sample heterogeneous ice growth. The analysis method has previously been successfully applied to study silver nanoparticles in solution [71] and twinning in gold nanoparticles [72]. By analyzing the angular correlations of the structured peaks for various droplet sizes, one would expect the angular deviation to be inversely proportional to the curvature of the droplets if growth of large planar crystals would be promoted by the interface.

5. Conclusions

In summary, coherent X-ray diffraction patterns of ice crystals growing in evaporatively cooled micron-sized water droplets were studied. The peak locations in the radial WAXS profiles clearly showed the Bragg reflections of hexagonal ice. The peak position of (200) was consistent with the temperature rising quickly subsequent to nucleation due to the rapid release of latent heat. We estimated the cubicity for different travel times and sub-ensembles of droplets and found a higher cubicity (8–26%) for weak hits below 50 ADU/pixel. The increased cubicity for weaker hits may be due to an increased probability of partial hits that probe crystals at the surface of the droplet, where heat removal due to evaporation is efficient. Although our nucleation rates differ vastly from nanodroplets, we cannot discard that nanoscale ice particles formed by fractured droplets may contribute to the increased cubicity observed for the weak hits.
The coherent illumination of the droplets revealed strong heterogeneity in the shape transform of individual peaks with visible truncation rods. Our peak histogram and peak-pair distributions suggested that the (100) orientation is frequently occurring with 6-folded symmetry. The circular shape transforms suggested an extended in-planar structure with high translational order. Simultaneously, a large number of structured peaks with several maxima closely located in reciprocal space were observed in all reflection planes. These structured peaks are statistically unlikely for random crystal orientations and suggested that planar and line defects were formed during crystal growth. This is consistent with large planar ice crystals forming at the droplet surface, then fracturing into smaller and slightly misaligned domains to accommodate to the curvature of the droplets. Planar faulting due to misaligned domains would explain the increased cubicity close to the surface of the droplet.

Author Contributions

Conceptualization, J.A.S. and N.-T.D.L.; methodology, N.E. and J.A.S.; software, N.E., J.A.S., O.J. and N.-T.D.L.; formal analysis, N.E., O.J., M.L.-P. and H.L.; investigation, T.A.M., H.L., J.A.S. and N.-T.D.L.; data curation, J.A.S. and O.J.; writing—original draft preparation, N.E. and J.A.S.; writing—review and editing, N.E., J.A.S., M.L.-P., O.J., N.-T.D.L. and H.L.; validation, M.L.-P.; visualization, N.E. and N.-T.D.L.; supervision, J.A.S., O.J. and N.-T.D.L.; project administration, J.A.S.; funding acquisition, J.A.S. All authors have read and agreed to the published version of the manuscript.

Funding

This research was funded by the Swedish National Research Council (Starting Grant No. 2017-05128) and the Göran Gustafsson Foundation (Grant No. 1808).

Institutional Review Board Statement

Not applicable.

Informed Consent Statement

Not applicable.

Data Availability Statement

The data that support the findings of this study are available within the article, including its appendices. Raw data and software is available upon request from the corresponding author ([email protected]).

Acknowledgments

Parts of this research were carried out at LCLS at the SLAC National Accelerator Laboratory. LCLS is an Office of Science User Facility operated for the DOE Office of Science by Stanford University. We thank Anders Nilsson for discussions.

Conflicts of Interest

The authors declare no conflict of interest.

Appendix A

Appendix A.1. Sphericity and Relative Intensity Statistics

Figure A1. Frequency of relative intensity of local maxima within a peak region for the hits above 50 ADU/pixel (full Q-range) in (a) linear and (b) logarithmic intensity scales.
Crystals 12 00065 g0a1
Figure A2. Frequency of a peak appearing with a certain sphericity for the hits above 50 ADU/pixel (full Q-range) in (a) linear and (b) logarithmic intensity scales.
Crystals 12 00065 g0a2
Figure A3. Frequency of a peak appearing with a certain sphericity for the (100) direction for the hits above 50 ADU/pixel (a) in linear and (b) in logarithmic intensity scales as well as the hits below 50 ADU/pixel (c) in linear and (d) in logarithmic intensity scales.
Crystals 12 00065 g0a3
Figure A4. Frequency of a peak appearing with a certain sphericity for the (002) direction for the hits above 50 ADU/pixel (a) in linear and (b) in logarithmic intensity scales as well as the hits below 50 ADU/pixel (c) in linear and (d) in logarithmic intensity scales.
Crystals 12 00065 g0a4
Figure A5. Frequency of a peak appearing with a certain sphericity for the (101) direction for the hits above 50 ADU/pixel (a) in linear and (b) in logarithmic intensity scales as well as the hits below 50 ADU/pixel (c) in linear and (d) in logarithmic intensity scales.
Crystals 12 00065 g0a5
Figure A6. Frequency of a peak appearing with a certain sphericity for the (102) direction for the hits above 50 ADU/pixel (a) in linear and (b) in logarithmic intensity scales as well as the hits below 50 ADU/pixel (c) in linear and (d) in logarithmic intensity scales.
Crystals 12 00065 g0a6
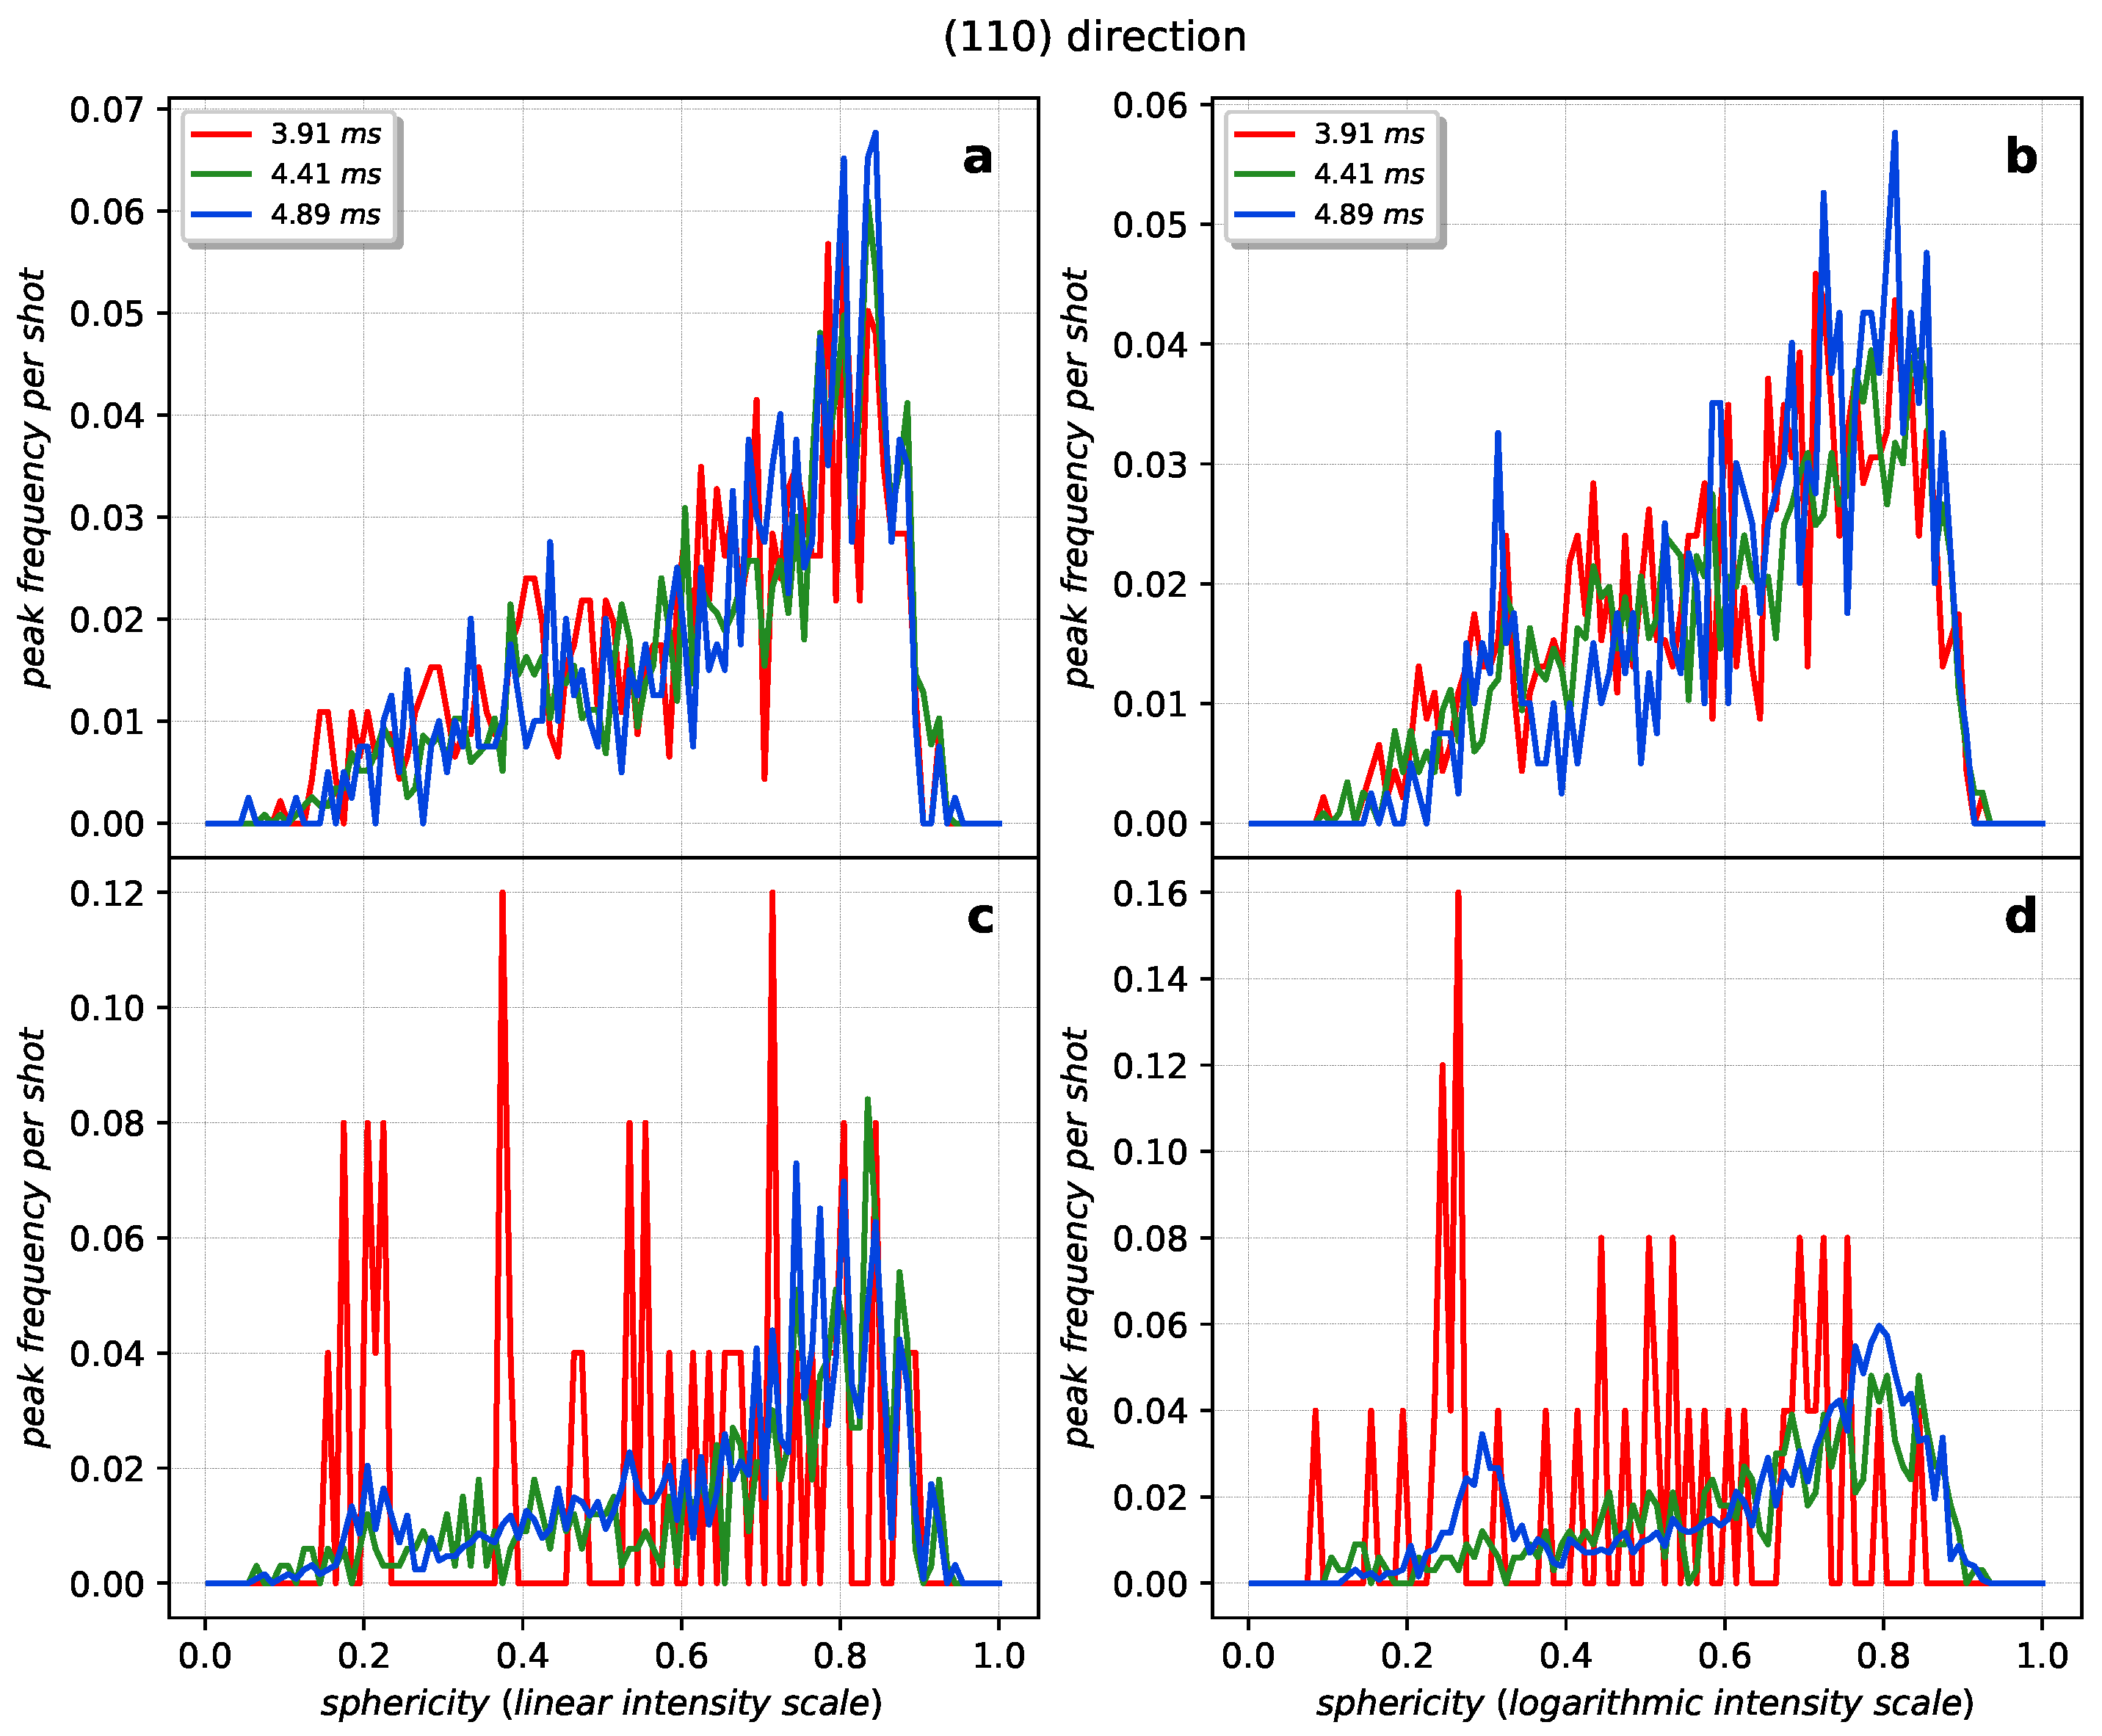
Figure A7. Frequency of a peak appearing with a certain sphericity for the (110) direction for the hits above 50 ADU/pixel (a) in linear and (b) in logarithmic intensity scales as well as the hits below 50 ADU/pixel (c) in linear and (d) in logarithmic intensity scales.
Crystals 12 00065 g0a7
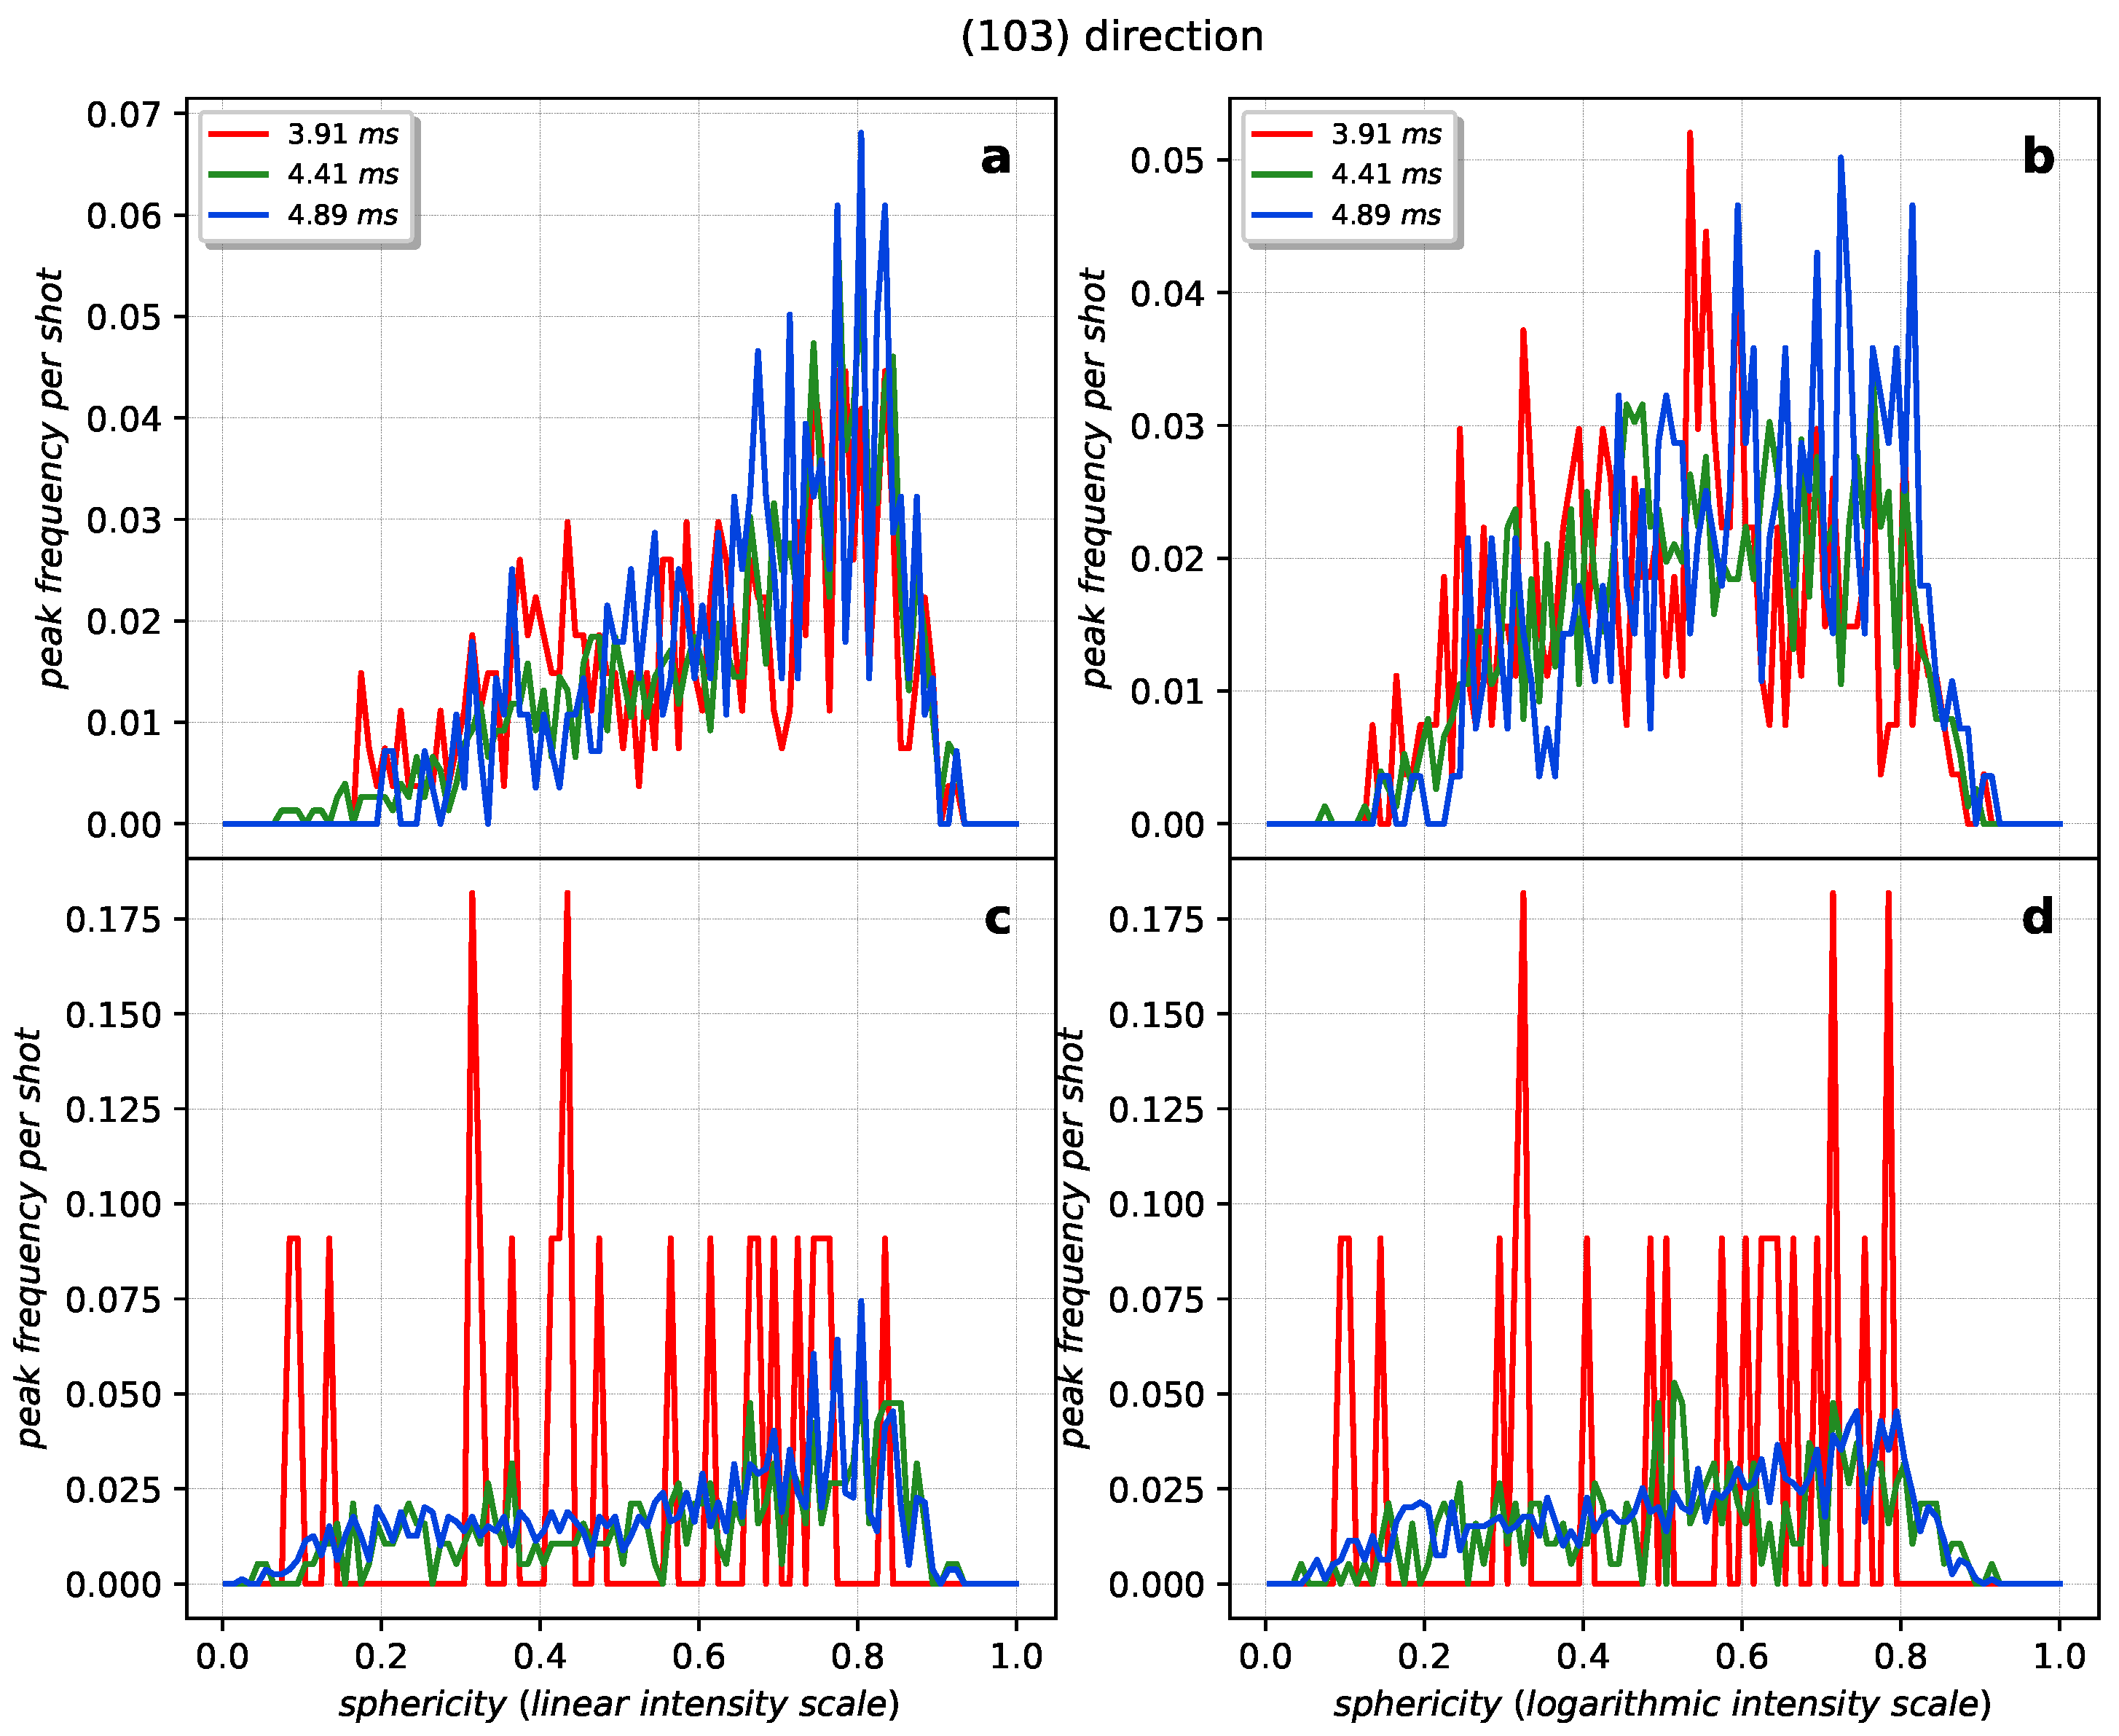
Figure A8. Frequency of a peak appearing with a certain sphericity for the (103) direction for the hits above 50 ADU/pixel (a) in linear and (b) in logarithmic intensity scales as well as the hits below 50 ADU/pixel (c) in linear and (d) in logarithmic intensity scales.
Crystals 12 00065 g0a8
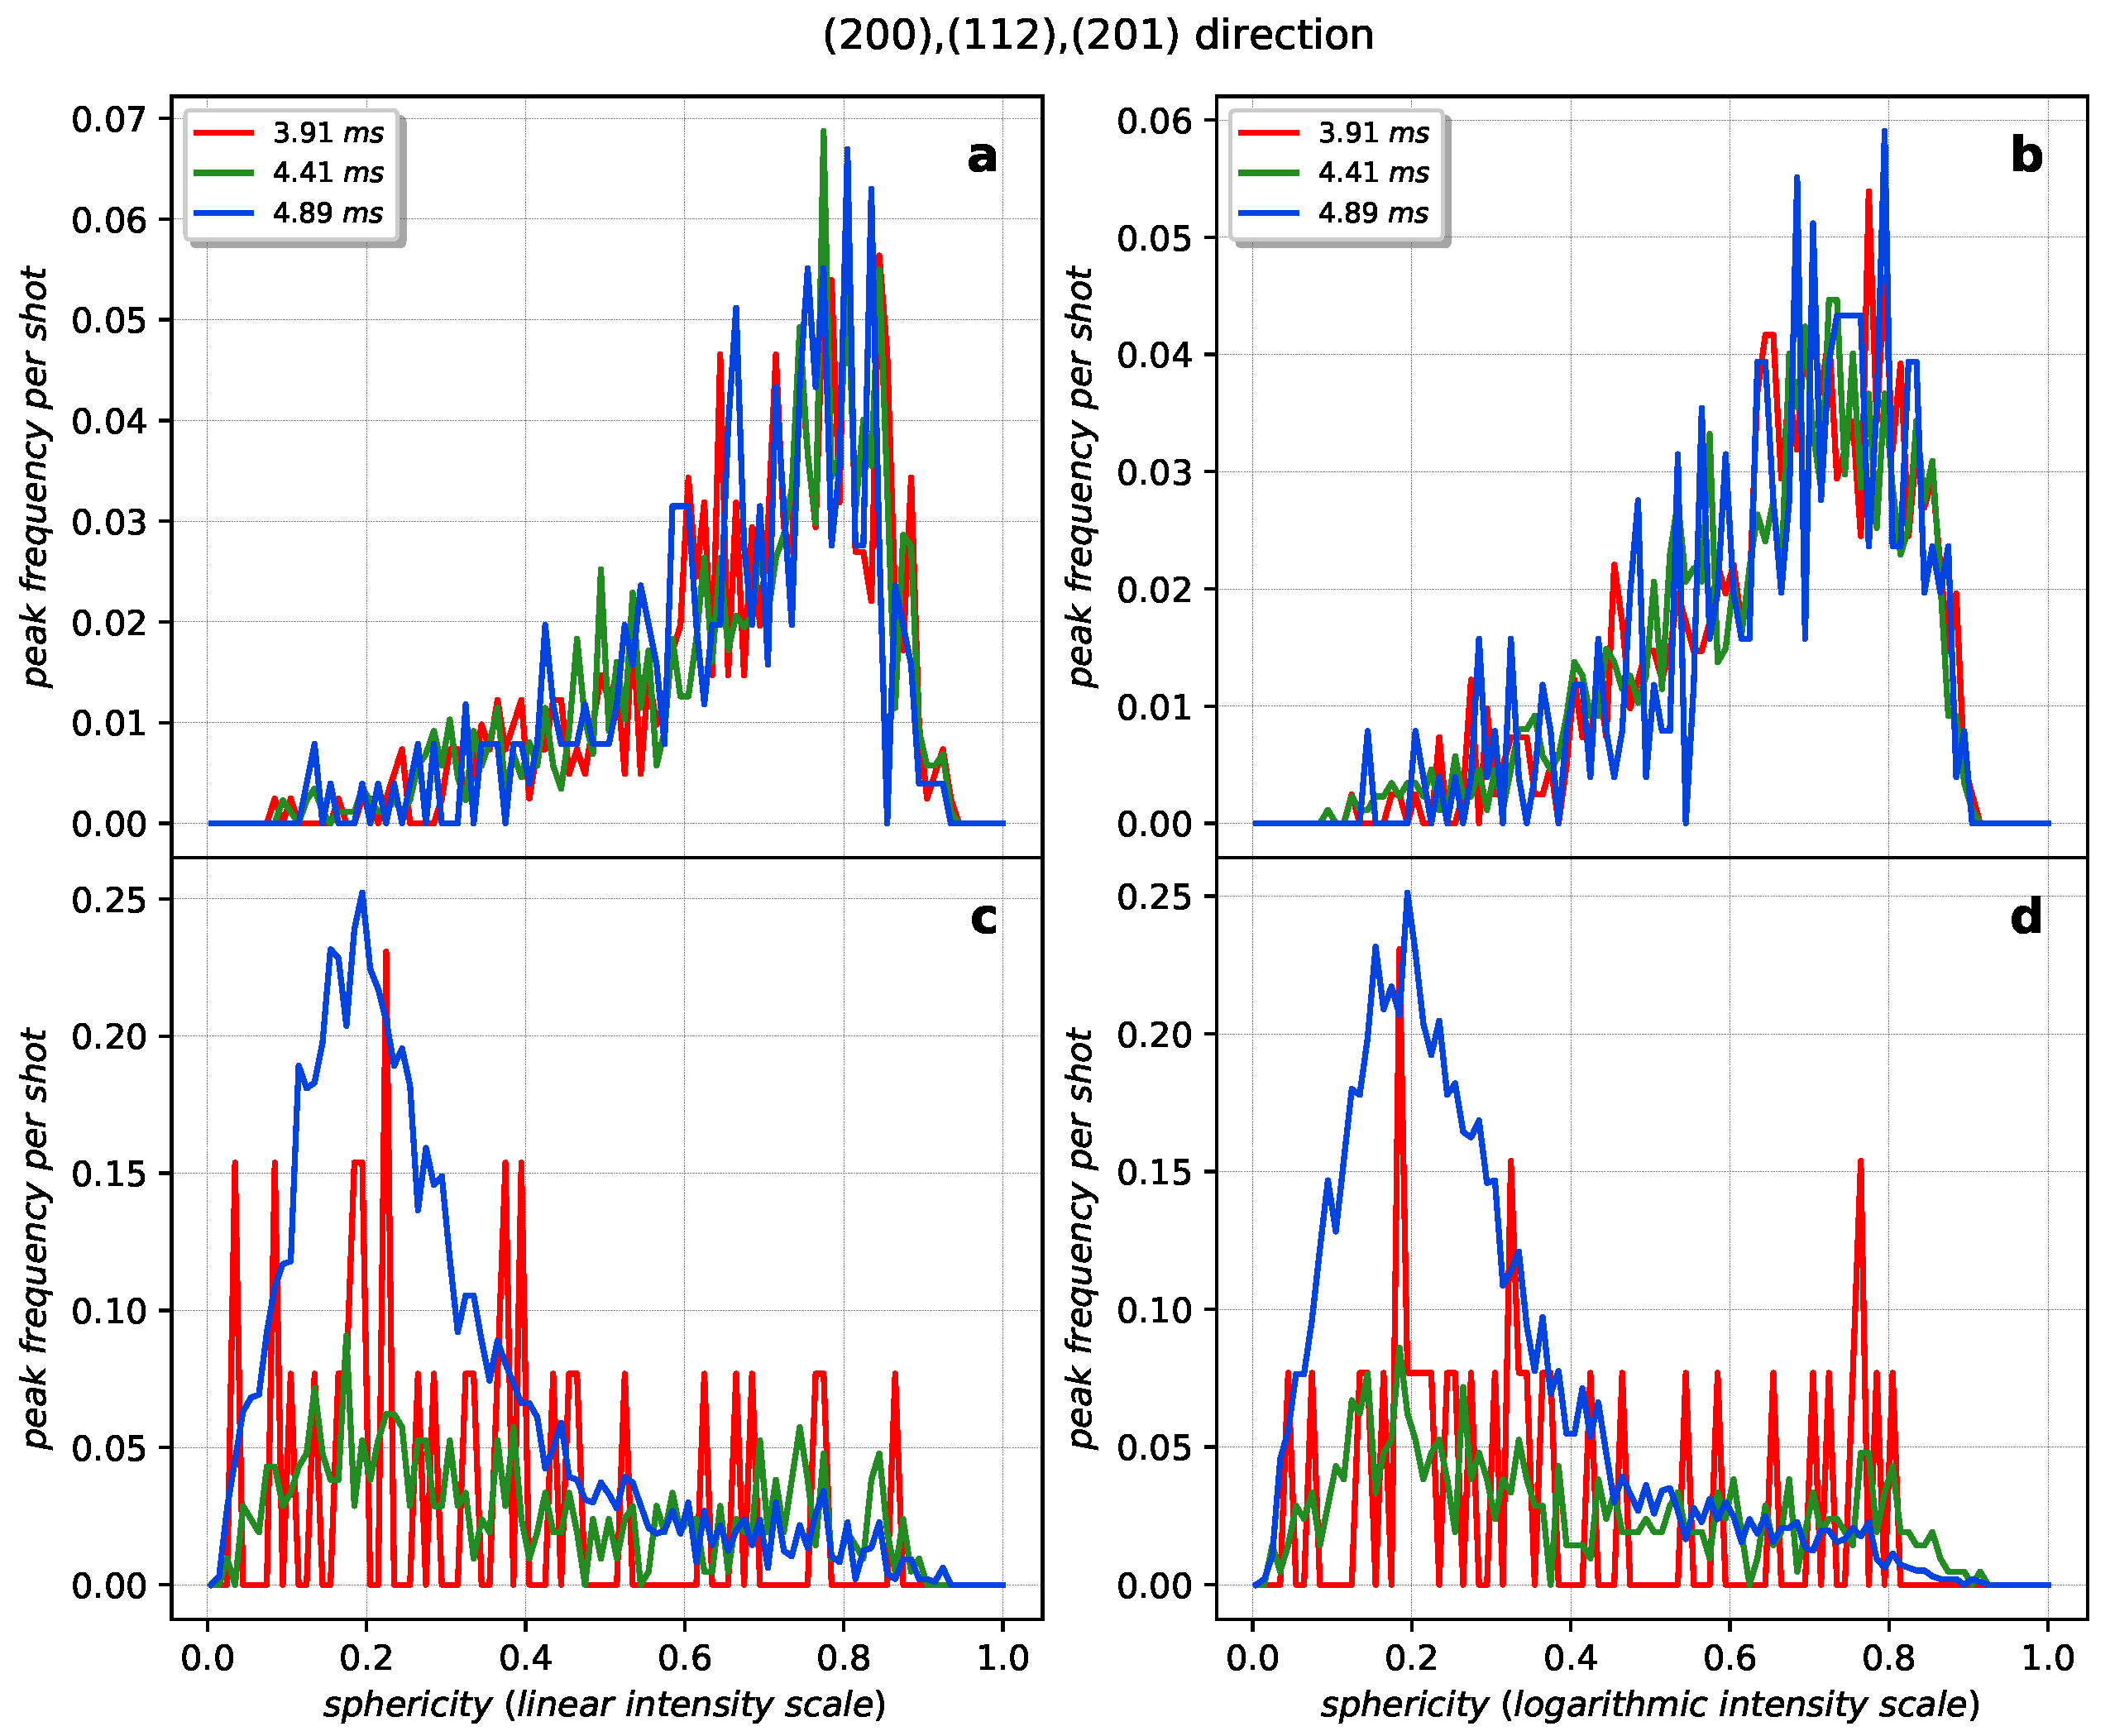
Figure A9. Frequency of a peak appearing with a certain sphericity for the (200), (112) and (201) directions for the hits above 50 ADU/pixel (a) in linear and (b) in logarithmic intensity scales as well as the hits below 50 ADU/pixel (c) in linear and (d) in logarithmic intensity scales.
Crystals 12 00065 g0a9

Appendix A.2. Gaussian Filtering and Contour Detection
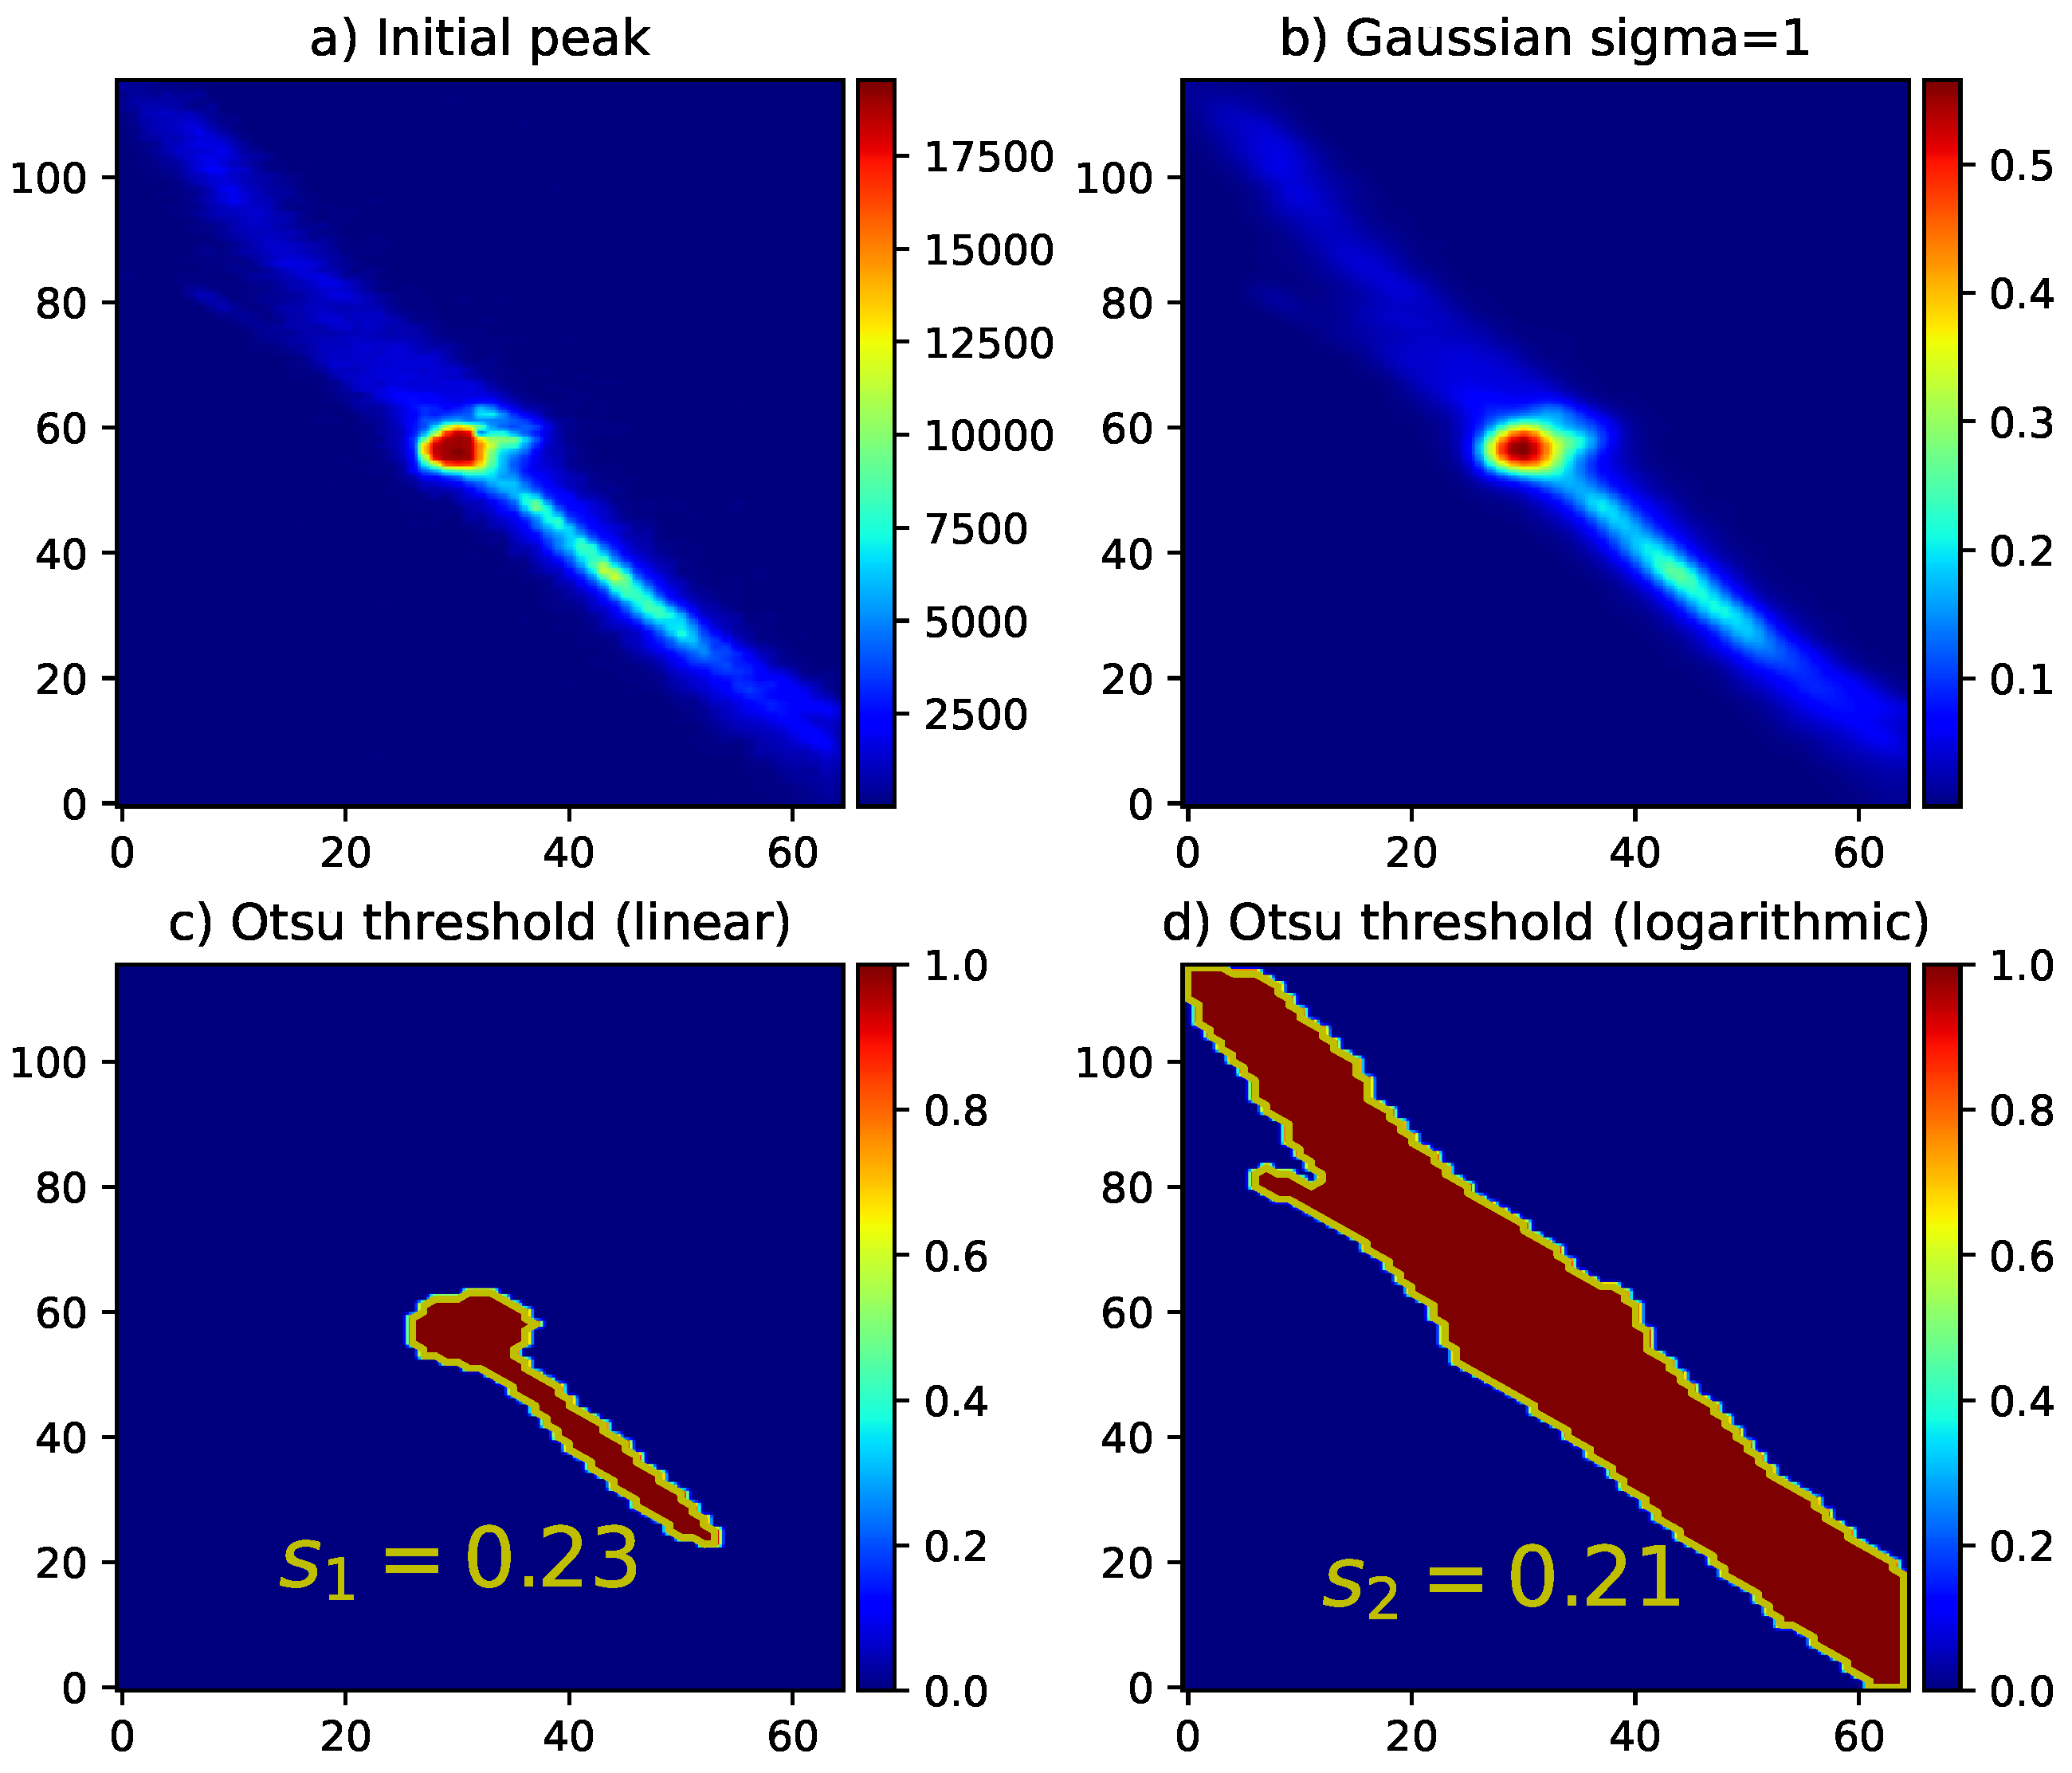
Figure A10. Example of a peak region (a) after first peak finding (initial cutout), (b) after Gaussian blurring with 1 s.d. = 1 pixel, (c) after Otsu thresholding and its corresponding sphericity in linear intensity scale ( s 1 = 0.23 ) and (d) after Otsu thresholding and its corresponding sphericity ( s 2 = 0.21 ) in logarithmic intensity scale.
Crystals 12 00065 g0a10

Appendix A.3. Cubicity Estimate

Figure A11. (a) Cubicity estimate for cubic and hexagonal mixture calculated from the peak heights of (002) and (101) of the hexagonal ice (black dashed) together with the corresponding experimental data at 3.91 ms travel time (red circles). (b) A zoom-in on the first three peaks of the model and experimental data at 3.91 ms travel time in Q-range of 1.55 to 1.90 Å−1.
Crystals 12 00065 g0a11
Figure A12. (a) Cubicity estimate for cubic and hexagonal mixture calculated from the peak heights of (002) and (101) of the hexagonal ice (black dashed), for hexagonal and stacking-disordered mixture (black dotted) and for pure stacking-disordered ice (solid black) together with the experimental data at 4.41 ms travel time (green circles). (b) A zoom-in on the first three peaks of the models and experimental data at 4.41 ms travel time in Q-range of 1.55 to 1.90 Å−1.
Crystals 12 00065 g0a12
Figure A13. (a) Cubicity estimate for cubic and hexagonal mixture calculated from the peak heights of (002) and (101) of the hexagonal ice (black dashed), for hexagonal and stacking-disordered mixture (black dotted) and for pure stacking-disordered ice (solid black) together with the experimental data at 4.89 ms travel time (green circles). (b) A zoom-in on the first three peaks of the models and experimental data at 4.89 ms travel time in Q-range of 1.55 to 1.90 Å−1.
Crystals 12 00065 g0a13
Figure A14. Ice Ic and Ih theoretical reference peaks estimated from FAULTS [52].
Crystals 12 00065 g0a14

Appendix A.4. Stacking and Orientational Disorder Observed in Single-Shot Diffraction Patterns
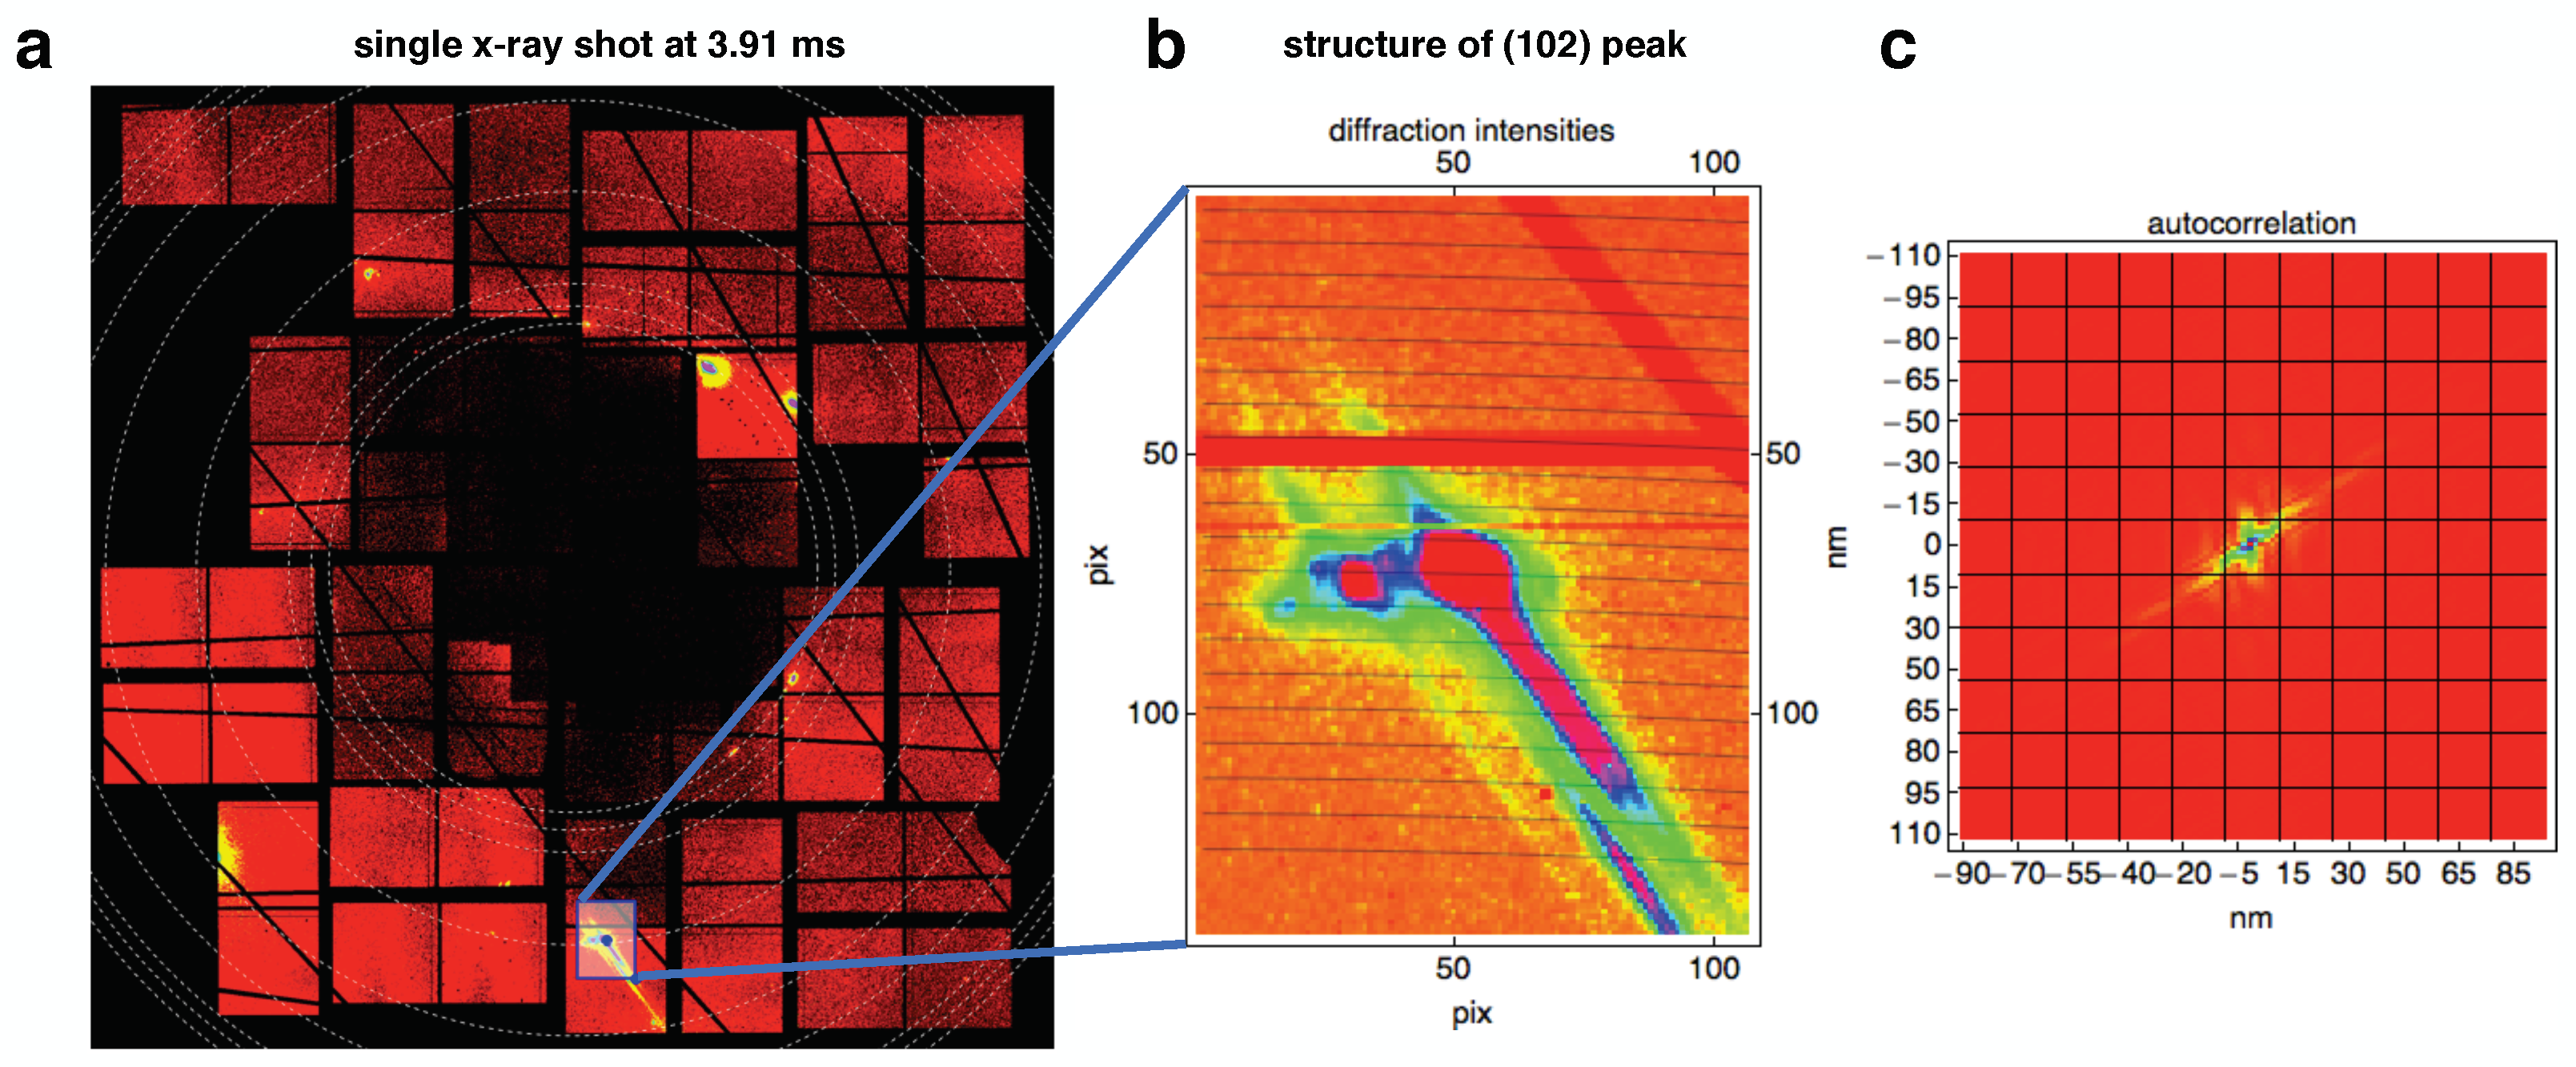
Figure A15. (a) Single-shot coherent diffraction pattern of a strong hit at 3.91 ms travel time. The dashed white lines show the expected locations of the Bragg peaks for hexagonal ice Ih [51]. (b) A zoom-in on the (102) peak in reciprocal space showing several maxima. (c) 2D Fourier transform of the diffracted intensities showing the resulting autocorrelation in real space.
Crystals 12 00065 g0a15
Figure A16. (a) Nanoscopic model of oxygen atoms in hexagonal ice bilayers with stacking and orientational disorder (3°), colored to show height from base. (b) Simulated coherent diffraction pattern of hexagonal ice layers with stacking and orientational disorder. The diffraction pattern exhibits clear crystal truncation rods. The dashed white lines show the expected locations of the Bragg peaks for hexagonal ice Ih [51]. (c) A zoom-in on the (102) peak in reciprocal space showing several maxima.
Crystals 12 00065 g0a16

References

  1. Day, J.A.; Schaefer, V.J. Peterson First Guides, Clouds and Weather; Houghton Mifflin: New York, NY, USA, 1991; p. 128. [Google Scholar]
  2. Fan, J.; Meng, J.; Ludescher, J.; Chen, X.; Ashkenazy, Y.; Kurths, J.; Havlin, S.; Schellnhuber, H.J. Statistical physics approaches to the complex Earth system. Phys. Rep. 2021, 896, 1–84. [Google Scholar] [CrossRef]
  3. Fossum, K.N.; Ovadnevaite, J.; Ceburnis, D.; Preißler, J.; Snider, J.R.; Huang, R.J.; Zuend, A.; O’Dowd, C. Sea-spray regulates sulfate cloud droplet activation over oceans. NPJ Clim. Atmos. Sci. 2020, 3, 14. [Google Scholar] [CrossRef] [Green Version]
  4. Kaufman, Y.J.; Tanré, D.; Boucher, O. A satellite view of aerosols in the climate system. Nature 2002, 419, 215–223. [Google Scholar] [CrossRef]
  5. Seinfeld, J.H.; Bretherton, C.; Carslaw, K.S.; Coe, H.; DeMott, P.J.; Dunlea, E.J.; Feingold, G.; Ghan, S.; Guenther, A.B.; Kahn, R.; et al. Improving our fundamental understanding of the role of aerosol-cloud interactions in the climate system. Proc. Natl. Acad. Sci. USA 2016, 113, 5781–5790. [Google Scholar] [CrossRef] [PubMed] [Green Version]
  6. Murray, B.J.; O’Sullivan, D.; Atkinson, J.D.; Webb, M.E. Ice nucleation by particles immersed in supercooled cloud droplets. Chem. Soc. Rev. 2012, 41, 6519–6554. [Google Scholar] [CrossRef] [PubMed] [Green Version]
  7. Hoose, C.; Möhler, O. Heterogeneous ice nucleation on atmospheric aerosols: A review of results from laboratory experiments. Atmos. Chem. Phys. 2012, 12, 9817–9854. [Google Scholar] [CrossRef] [Green Version]
  8. Fletcher, N.H. Size effect in heterogeneous nucleation. J. Chem. Phys. 1958, 29, 572–576. [Google Scholar] [CrossRef]
  9. Li, T.; Donadio, D.; Russo, G.; Galli, G. Homogeneous ice nucleation from supercooled water. Phys. Chem. Chem. Phys. 2011, 13, 19807–19813. [Google Scholar] [CrossRef]
  10. Reinhardt, A.; Doye, J.P. Free energy landscapes for homogeneous nucleation of ice for a monatomic water model. J. Chem. Phys. 2012, 136, 1–11. [Google Scholar] [CrossRef] [Green Version]
  11. Takahashi, T.; Kobayashi, T. The role of the cubic structure in freezing of a supercooled water droplet on an ice substrate. J. Cryst. Growth 1983, 64, 593–603. [Google Scholar] [CrossRef]
  12. Kobayashi, T.; Furukawa, Y.; Takahashi, T.; Uyeda, H. Cubic structure models at the junctions in polycrystalline snow crystals. J. Cryst. Growth 1976, 35, 262–268. [Google Scholar] [CrossRef]
  13. Ghaani, M.R.; Bernardi, M.; English, N.J. Crystallisation competition between cubic and hexagonal ice structures: Molecular-dynamics insight. Mol. Simul. 2021, 47, 18–26. [Google Scholar] [CrossRef]
  14. Hudait, A.; Qiu, S.; Lupi, L.; Molinero, V. Free energy contributions and structural characterization of stacking disordered ices. Phys. Chem. Chem. Phys. 2016, 18, 9544–9553. [Google Scholar] [CrossRef] [PubMed]
  15. Amaya, A.J.; Pathak, H.; Modak, V.P.; Laksmono, H.; Loh, N.D.; Sellberg, J.A.; Sierra, R.G.; McQueen, T.A.; Hayes, M.J.; Williams, G.J.; et al. How Cubic Can Ice Be? J. Phys. Chem. Lett. 2017, 8, 3216–3222. [Google Scholar] [CrossRef] [PubMed] [Green Version]
  16. Moore, E.B.; Molinero, V. Is it cubic? Ice crystallization from deeply supercooled water. Phys. Chem. Chem. Phys. 2011, 13, 20008–20016. [Google Scholar] [CrossRef]
  17. Johnston, J.C.; Molinero, V. Crystallization, melting, and structure of water nanoparticles at atmospherically relevant temperatures. J. Am. Chem. Soc. 2012, 134, 6650–6659. [Google Scholar] [CrossRef]
  18. Mason, B.J. The supercooling and nucleation of water. Adv. Phys. 1958, 7, 221–234. [Google Scholar] [CrossRef]
  19. Li, T.; Donadio, D.; Galli, G. Ice nucleation at the nanoscale probes no man’s land of water. Nat. Commun. 2013, 4, 1887. [Google Scholar] [CrossRef]
  20. Huang, J.; Bartell, L.S. Kinetics of Homogeneous Nucleation in the Freezing of Large Water Clusters. J. Phys. Chem. 1995, 99, 3924–3931. [Google Scholar] [CrossRef]
  21. Malkin, T.L.; Murray, B.J.; Brukhno, A.V.; Anwar, J.; Salzmann, C.G. Structure of ice crystallized from supercooled water. Proc. Natl. Acad. Sci. USA 2012, 109, 1041–1045. [Google Scholar] [CrossRef] [Green Version]
  22. Murray, B.J.; Knopf, D.A.; Bertram, A.K. The formation of cubic ice under conditions relevant to Earth’s atmosphere. Nature 2005, 434, 202–205. [Google Scholar] [CrossRef] [PubMed]
  23. Murray, B.J.; Bertram, A.K. Formation and stability of cubic ice in water droplets. Phys. Chem. Chem. Phys. 2006, 8, 186–192. [Google Scholar] [CrossRef] [PubMed] [Green Version]
  24. Guan, S.H.; Shang, C.; Huang, S.D.; Liu, Z.P. Two-Stage Solid-Phase Transition of Cubic Ice to Hexagonal Ice: Structural Origin and Kinetics. J. Phys. Chem. C 2018, 122, 29009–29016. [Google Scholar] [CrossRef]
  25. Fletcher, N.H. Structural diffusion, interface structure and crystal growth. J. Cryst. Growth 1975, 28, 375–384. [Google Scholar] [CrossRef]
  26. Thürmer, K.; Nie, S. Formation of hexagonal and cubic ice during low-temperature growth. Proc. Natl. Acad. Sci. USA 2013, 110, 11757–11762. [Google Scholar] [CrossRef] [PubMed] [Green Version]
  27. Hansen, T.C.; Koza, M.M.; Kuhs, W.F. Formation and annealing of cubic ice: I. Modelling of stacking faults. J. Phys. Condens. Matter 2008, 20, 285104. [Google Scholar] [CrossRef]
  28. Hansen, T.C.; Koza, M.M.; Lindner, P.; Kuhs, W.F. Formation and annealing of cubic ice: II. Kinetic study. J. Phys. Condens. Matter 2008, 20, 285105. [Google Scholar] [CrossRef]
  29. Kuhs, W.F.; Sippel, C.; Falenty, A.; Hansen, T.C. Extent and relevance of stacking disorder in “ice Ic”. Proc. Natl. Acad. Sci. USA 2012, 109, 21259–21264. [Google Scholar] [CrossRef] [PubMed] [Green Version]
  30. Malkin, T.L.; Murray, B.J.; Salzmann, C.G.; Molinero, V.; Pickering, S.J.; Whale, T.F. Stacking disorder in ice I. Phys. Chem. Chem. Phys. 2015, 17, 60–76. [Google Scholar] [CrossRef] [Green Version]
  31. Haji-Akbari, A. Ice and its formation. In Antifreeze Proteins Volume 1: Environment, Systematics and Evolution; Ramløv, H., Friis, D.S., Eds.; Springer International Publishing: Cham, Switzerland, 2020; pp. 13–51. [Google Scholar] [CrossRef]
  32. Tarn, M.D.; Sikora, S.N.; Porter, G.C.; Shim, J.U.; Murray, B.J. Homogeneous freezing of water using microfluidics. Micromachines 2021, 12, 223. [Google Scholar] [CrossRef]
  33. Lupi, L.; Hudait, A.; Peters, B.; Grünwald, M.; Gotchy Mullen, R.; Nguyen, A.H.; Molinero, V. Role of stacking disorder in ice nucleation. Nature 2017, 551, 218–222. [Google Scholar] [CrossRef] [PubMed]
  34. Del Rosso, L.; Celli, M.; Grazzi, F.; Catti, M.; Hansen, T.C.; Fortes, A.D.; Ulivi, L. Cubic ice Ic without stacking defects obtained from ice XVII. Nat. Mater. 2020, 19, 663–668. [Google Scholar] [CrossRef]
  35. Komatsu, K.; Machida, S.; Noritake, F.; Hattori, T.; Sano-Furukawa, A.; Yamane, R.; Yamashita, K.; Kagi, H. Ice Ic without stacking disorder by evacuating hydrogen from hydrogen hydrate. Nat. Commun. 2020, 11, 2–4. [Google Scholar] [CrossRef] [Green Version]
  36. Libbrecht, K.G. The physics of snow crystals. Rep. Prog. Phys. 2005, 68, 855–895. [Google Scholar] [CrossRef] [Green Version]
  37. Mossop, S.C. Concentrations of ice crystals in clouds. Bull. Am. Meteorol. Soc. 1970, 51, 474–479. [Google Scholar] [CrossRef] [Green Version]
  38. King, B.F.; Weinhold, F. Structure and spectroscopy of (HCN)n clusters: Cooperative and electronic delocalization effects in C–H-N hydrogen bonding. J. Chem. Phys. 1995, 103, 333. [Google Scholar] [CrossRef]
  39. Hashino, T.; De Boer, G.; Okamoto, H.; Tripoli, G.J. Relationships between immersion freezing and crystal habit for arctic mixed-phase clouds-A numerical study. J. Atmos. Sci. 2020, 77, 2411–2438. [Google Scholar] [CrossRef]
  40. Leisner, T.; Duft, D.; Möhler, O.; Saathoff, H.; Schnaiter, M.; Henin, S.; Stelmaszczyk, K.; Petrarca, M.; Delagrange, R.; Hao, Z.; et al. Laser-induced plasma cloud interaction and ice multiplication under cirrus cloud conditions. Proc. Natl. Acad. Sci. USA 2013, 110, 10106–10110. [Google Scholar] [CrossRef] [Green Version]
  41. Zhao, B.; Liou, K.N.; Gu, Y.; Jiang, J.H.; Li, Q.; Fu, R.; Huang, L.; Liu, X.; Shi, X.; Su, H.; et al. Impact of aerosols on ice crystal size. Atmos. Chem. Phys. 2018, 18, 1065–1078. [Google Scholar] [CrossRef] [Green Version]
  42. Espinosa, J.R.; Vega, C.; Sanz, E. Homogeneous Ice Nucleation Rate in Water Droplets. J. Phys. Chem. C 2018, 122, 22892–22896. [Google Scholar] [CrossRef] [Green Version]
  43. King, W.D.; Fletcher, N.H. Pressures and stresses in freezing water drops. J. Phys. D Appl. Phys. 1973, 6, 2157–2173. [Google Scholar] [CrossRef] [Green Version]
  44. Wildeman, S.; Sterl, S.; Sun, C.; Lohse, D. Fast Dynamics of Water Droplets Freezing from the Outside in. Phys. Rev. Lett. 2017, 118, 1–5. [Google Scholar] [CrossRef] [Green Version]
  45. DePonte, D.P.; Weierstall, U.; Schmidt, K.; Warner, J.; Starodub, D.; Spence, J.C.H.; Doak, R.B. Gas Dynamic Virtual Nozzle for Generation of Microscopic Droplet Streams. J. Phys. D Appl. Phys. 2008, 41, 195505. [Google Scholar] [CrossRef] [Green Version]
  46. Laksmono, H.; McQueen, T.A.; Sellberg, J.A.; Loh, N.D.; Huang, C.; Schlesinger, D.; Sierra, R.G.; Hampton, C.Y.; Nordlund, D.; Beye, M.; et al. Anomalous behavior of the homogeneous ice nucleation rate in “no-man’s land”. J. Phys. Chem. Lett. 2015, 6, 2826–2832. [Google Scholar] [CrossRef] [PubMed] [Green Version]
  47. Sellberg, J.A.; Huang, C.; McQueen, T.A.; Loh, N.D.; Laksmono, H.; Schlesinger, D.; Sierra, R.G.; Nordlund, D.; Hampton, C.Y.; Starodub, D.; et al. Ultrafast X-ray probing of water structure below the homogeneous ice nucleation temperature. Nature 2014, 510, 381–384. [Google Scholar] [CrossRef] [PubMed]
  48. Schlesinger, D.; Sellberg, J.A.; Nilsson, A.; Pettersson, L.G. Evaporative cooling of microscopic water droplets in vacuo: Molecular dynamics simulations and kinetic gas theory. J. Chem. Phys. 2016, 144, 124502. [Google Scholar] [CrossRef] [Green Version]
  49. Pathak, H.; Späh, A.; Esmaeildoost, N.; Sellberg, J.A.; Kim, K.H.; Perakis, F.; Amann-Winkel, K.; Ladd-Parada, M.; Koliyadu, J.; Lane, T.J.; et al. Enhancement and maximum in the isobaric specific-heat capacity measurements of deeply supercooled water using ultrafast calorimetry. Proc. Natl. Acad. Sci. USA 2021, 118, e2018379118. [Google Scholar] [CrossRef]
  50. Hart, P.; Boutet, S.; Carini, G.; Dragone, A.; Duda, B.; Freytag, D.; Haller, G.; Herbst, R.; Herrmann, S.; Kenney, C.; et al. The comell-SLAC pixel array detector at LCLS. In Proceedings of the 2012 IEEE Nuclear Science Symposium and Medical Imaging Conference, Anaheim, CA, USA, 27 October–3 November 2012; pp. 538–541. [Google Scholar]
  51. Dowell, L.G.; Rinfret, A.P. Low-Temperature Forms of Ice as Studied by X-ray Diffraction. Nature 1960, 188, 1144–1148. [Google Scholar] [CrossRef]
  52. Casas-Cabanas, M.; Reynaud, M.; Rikarte, J.; Horbach, P.; Rodriguez-Carvajal, J. FAULTS: A program for refinement of structures with extended defects. J. Appl. Crystallogr. 2016, 49, 2259–2269. [Google Scholar] [CrossRef]
  53. Barty, A.; Kirian, R.A.; Maia, F.R.; Hantke, M.; Yoon, C.H.; White, T.A.; Chapman, H. Cheetah: Software for high-throughput reduction and analysis of serial femtosecond X-ray diffraction data. J. Appl. Crystallogr. 2014, 47, 1118–1131. [Google Scholar] [CrossRef] [Green Version]
  54. Hadian-Jazi, M.; Messerschmidt, M.; Darmanin, C.; Giewekemeyer, K.; Mancuso, A.P.; Abbey, B. A peak-finding algorithm based on robust statistical analysis in serial crystallography. J. Appl. Crystallogr. 2017, 50, 1705–1715. [Google Scholar] [CrossRef]
  55. Peters, J. The ‘seed-skewness’ integration method generalized for three-dimensional Bragg peaks. J. Appl. Crystallogr. 2003, 36, 1475–1479. [Google Scholar] [CrossRef]
  56. Wilkinson, C.; Khamis, H.W.; Stansfield, R.F.; McIntyre, G.J. Integration of single-crystal reflections using area multidetectors. J. Appl. Crystallogr. 1988, 21, 471–478. [Google Scholar] [CrossRef]
  57. Sonka, M.; Hlavac, V.; Boyle, R. Segmentation. In Image Processing, Analysis and Machine Vision; Springer: Boston, MA, USA, 1993; pp. 112–191. [Google Scholar] [CrossRef]
  58. Yan, F.; Zhang, H.; Kube, C.R. A multistage adaptive thresholding method. Pattern Recognit. Lett. 2005, 26, 1183–1191. [Google Scholar] [CrossRef]
  59. Otsu, N. A Threshold Selection Method from Gray-Level Histograms. IEEE Trans. Syst. Man Cybern. 1979, 9, 62–66. [Google Scholar] [CrossRef] [Green Version]
  60. Rogowska, J. Overview and Fundamentals of Medical Image Segmentation, 2nd ed.; Elsevier Inc.: Amsterdam, The Netherlands, 2009; pp. 73–90. [Google Scholar] [CrossRef]
  61. Wadell, H. Volume, Shape, and Roundness of Rock Particles. J. Geol. 1932, 40, 443–451. [Google Scholar] [CrossRef]
  62. La Placa, S.J.; Post, B. Thermal expansion of ice. Acta Crystallogr. 1960, 13, 503–505. [Google Scholar] [CrossRef]
  63. Amaya, A.J.; Wyslouzil, B.E. Ice nucleation rates near 225 K. J. Chem. Phys. 2018, 148. [Google Scholar] [CrossRef] [PubMed]
  64. Kohl, I.; Mayer, E.; Hallbrucker, A. The glassy water–cubic ice system: A comparative study by X-ray diffraction and differential scanning calorimetry. Phys. Chem. Chem. Phys. 2000, 2, 1579–1586. [Google Scholar] [CrossRef]
  65. Jung, S.; Tiwari, M.K.; Doan, N.V.; Poulikakos, D. Mechanism of supercooled droplet freezing on surfaces. Nat. Commun. 2012, 3, 1–8. [Google Scholar] [CrossRef] [Green Version]
  66. Riechers, B.; Wittbracht, F.; Hütten, A.; Koop, T. The homogeneous ice nucleation rate of water droplets produced in a microfluidic device and the role of temperature uncertainty. Phys. Chem. Chem. Phys. 2013, 15, 5873–5887. [Google Scholar] [CrossRef]
  67. Xue, H.; Fu, Y.; Lu, Y.; Hao, D.; Li, K.; Bai, G.; Ou-Yang, Z.C.; Wang, J.; Zhou, X. Spontaneous Freezing of Water between 233 and 235 K Is Not Due to Homogeneous Nucleation. J. Am. Chem. Soc. 2021, 143, 13548–13556. [Google Scholar] [CrossRef] [PubMed]
  68. Stan, C.A.; Schneider, G.F.; Shevkoplyas, S.S.; Hashimoto, M.; Ibanescu, M.; Wiley, B.J.; Whitesides, G.M. A microfluidic apparatus for the study of ice nucleation in supercooled water drops. Lab A Chip 2009, 9, 2293–2305. [Google Scholar] [CrossRef] [PubMed]
  69. Schremb, M.; Tropea, C. Solidification of supercooled water in the vicinity of a solid wall. Phys. Rev. E 2016, 94, 52804. [Google Scholar] [CrossRef]
  70. Altarelli, M.; Kurta, R.P.; Vartanyants, I.A. X-ray cross-correlation analysis and local symmetries of disordered systems: General theory. Phys. Rev. B 2010, 82, 104207. [Google Scholar] [CrossRef] [Green Version]
  71. Mendez, D.; Lane, T.; Sung, J.; Sellberg, J.; Levard, C.; Watkins, H.; Cohen, A.; Soltis, M.; Sutton, S.; Spudich, J.; et al. Observation of correlated X-ray scattering at atomic resolution. Philos. Trans. R. Soc. B Biol. Sci. 2014, 369. [Google Scholar] [CrossRef] [PubMed] [Green Version]
  72. Mendez, D.; Watkins, H.; Qiao, S.; Raines, K.S.; Lane, T.J.; Schenk, G.; Nelson, G.; Subramanian, G.; Tono, K.; Joti, Y.; et al. Angular correlations of photons from solution diffraction at a free-electron laser encode molecular structure. IUCrJ 2016, 3, 420–429. [Google Scholar] [CrossRef]
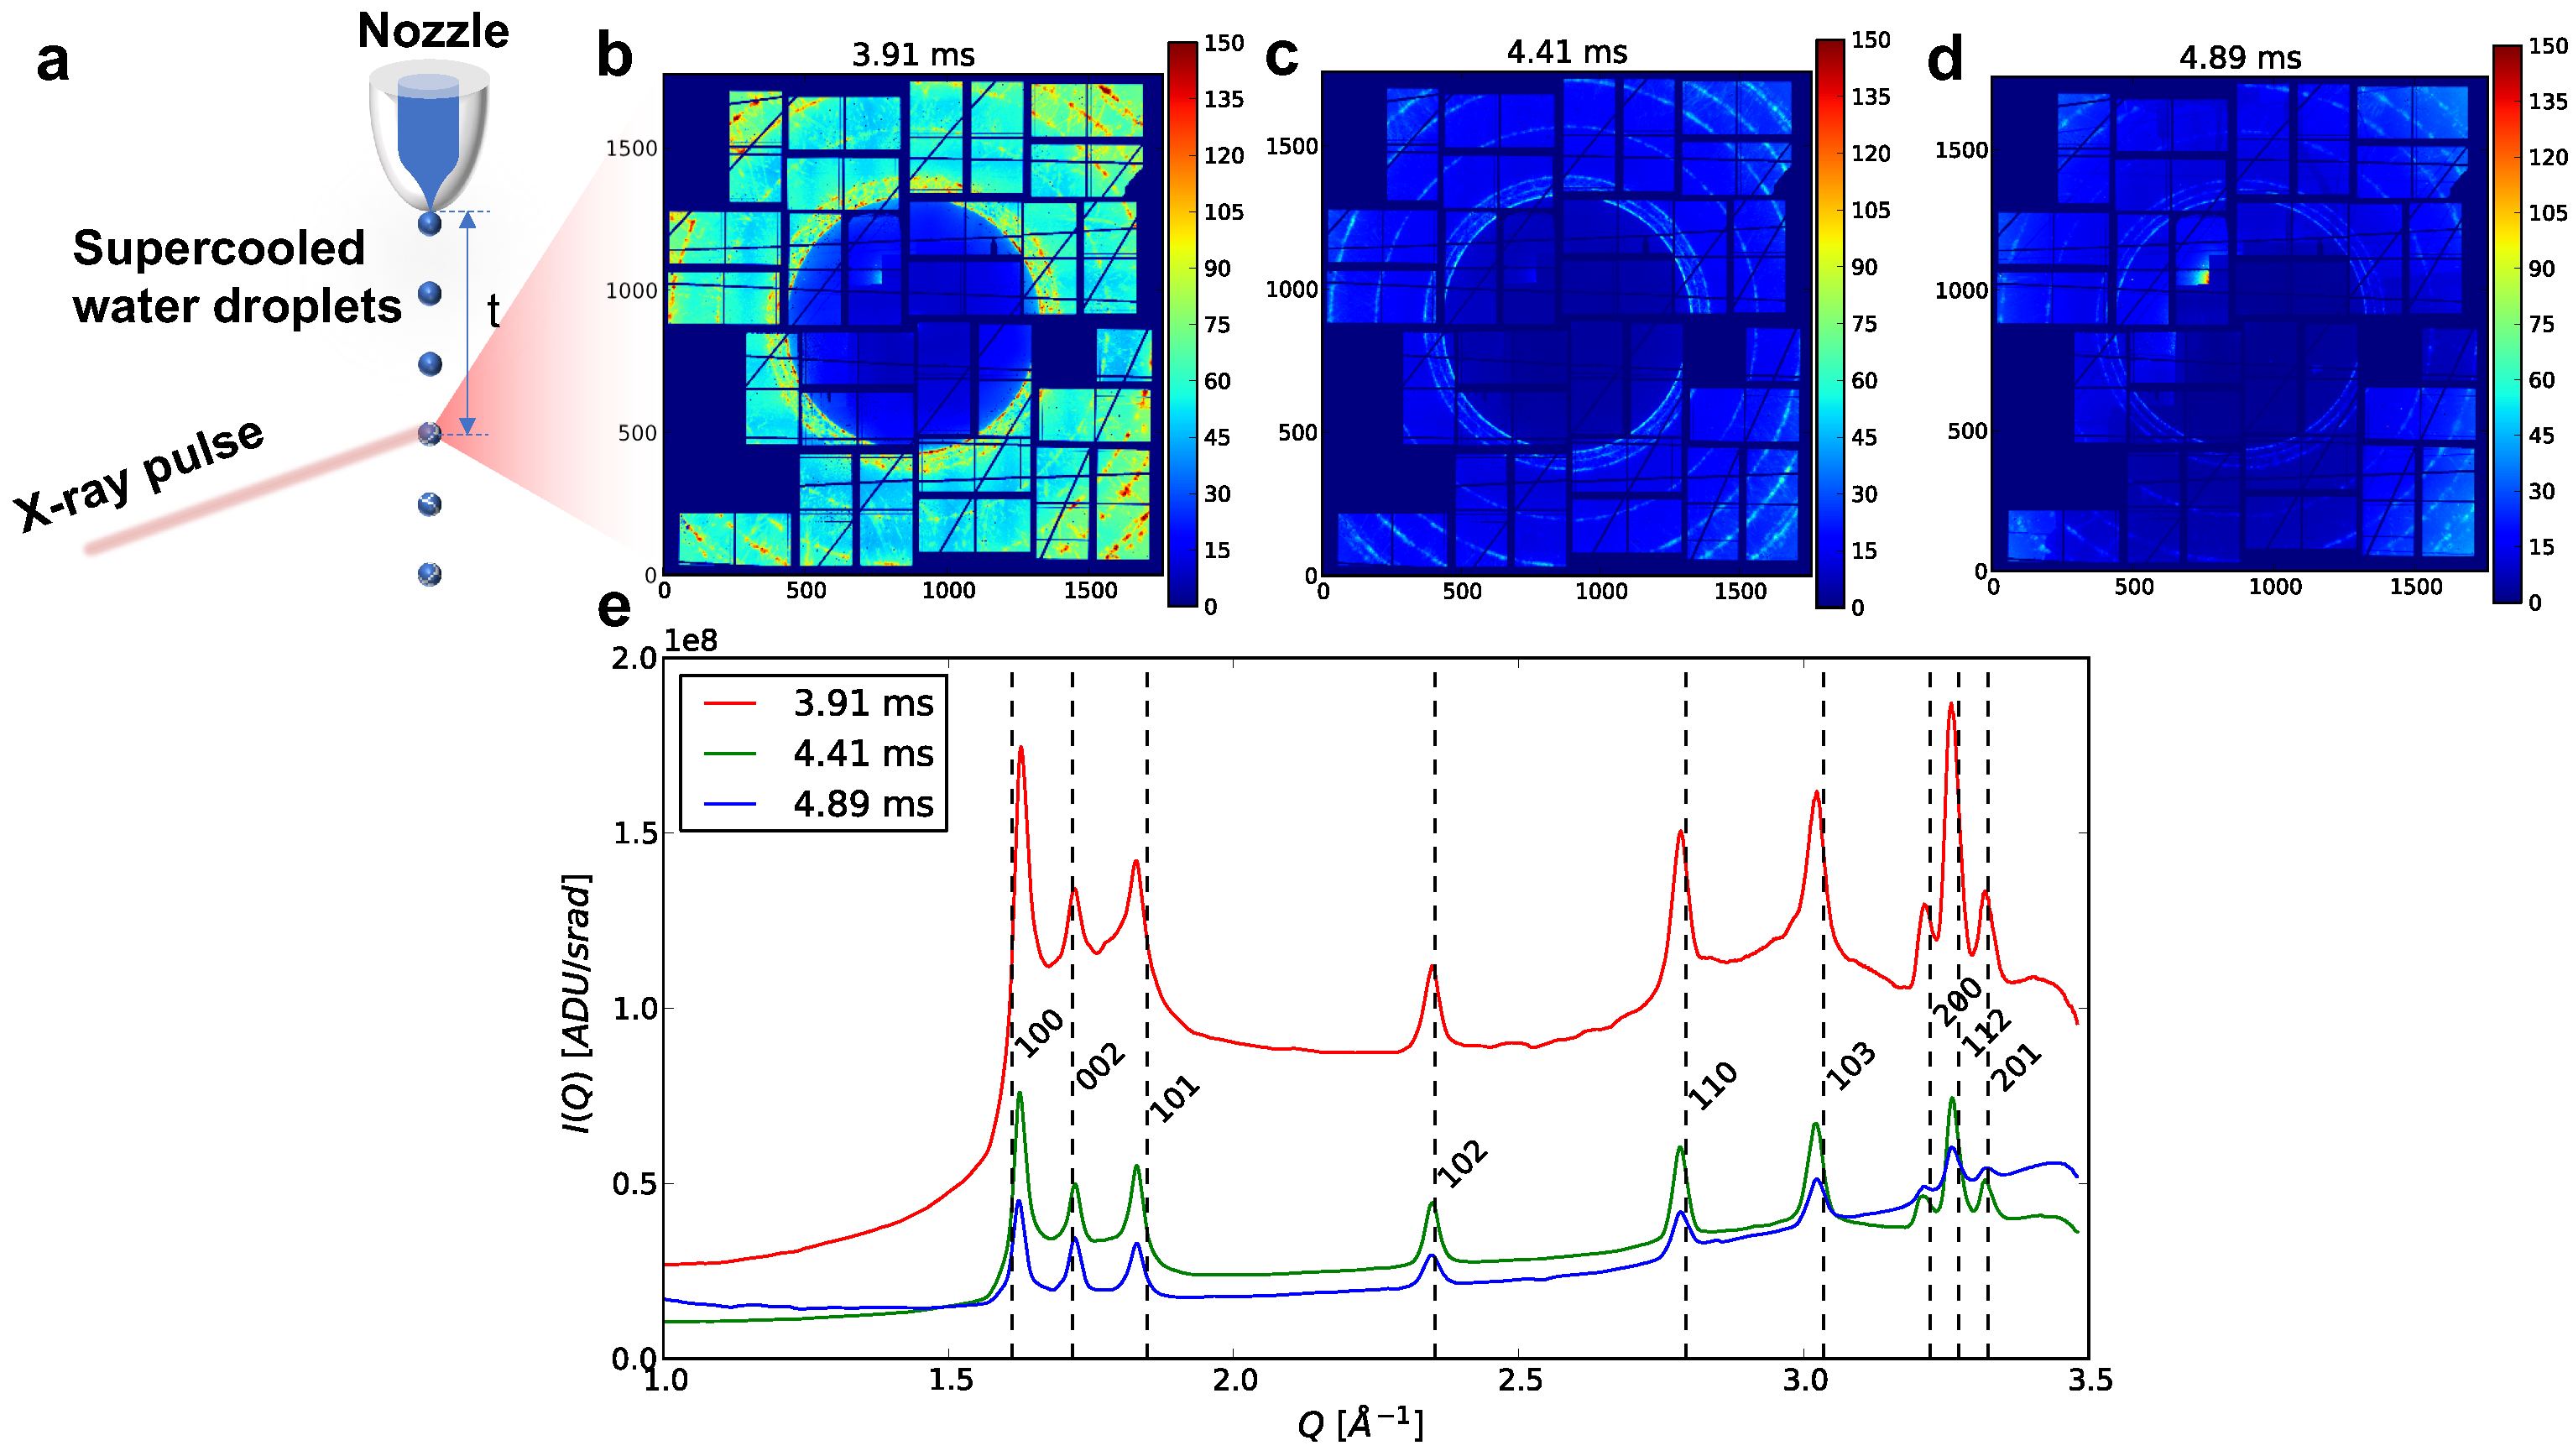
Figure 1. (a) Schematic of the experimental setup used to probe ice growth in micron-sized water droplets upon deep supercooling as function of travel time t in vacuo. Virtual powder X-ray diffraction patterns from all ice hits recorded at (b) 3.91 ms, (c) 4.41 ms, and (d) 4.89 ms. (e) Mean radial WAXS profiles for all diffraction images containing Bragg peaks. The dashed lines show the expected locations of the Bragg peaks for hexagonal ice Ih [51]. The high degree of overlap and the distinctive triple peaks between 1.6–1.85 Å−1 show that the majority of the ice we observed in this experiment is hexagonal ice Ih.
Crystals 12 00065 g001
Figure 2. Mean radial WAXS profiles for the ice hits separated into two sub-ensembles based on maximum diffracted intensity in the radial profile. (a) The mean radial profiles for hits with a maximum intensity above 50 ADU/pixel show the same hexagonal structure as the overall mean radial profile. We estimate the fraction of cubic ice (and thus cubicity) to be close to ∼0% at all travel times. (b) The mean radial profile for hits with a maximum intensity between 20 ADU/pixel and 50 ADU/pixel show significantly enhanced (002) peak, indicative of a greater cubic character in the low-intensity ice hits. Estimating the cubicity yields ∼9%, 8–20%, 11–26%, respectively.
Crystals 12 00065 g002
Figure 3. Frequency of a peak appearing at a certain momentum transfer in a shot as a function of its center of mass in reciprocal space ( Q c m ) for the hits (a) above 50 ADU/pixel and (b) below 50 ADU/pixel.
Crystals 12 00065 g003
Figure 4. Peak-pair distributions as a function of a center of mass difference in reciprocal space ( Δ Q c m ) for (a) shortest Δ Q c m and (b) all peaks in the ice hits above 50 ADU/pixel. Random hits that contain the most probable Δ Q c m (1.55–1.75, 2.8–2.95 and 3.2–3.5 Å−1) are shown as examples. The black-marked peak in each shot is the reference peak and the correlated Δ Q c m from the reference peak to the other neighboring peaks in the same shot is written on top of each corresponding peak.
Crystals 12 00065 g004
Figure 5. Frequency of a peak appearing with a certain sphericity in a Q-range of 1.5 to 2 Å−1 for the strong hits above 50 ADU/pixel in (a) linear and (b) logarithmic intensity scales as well as for the weak hits below 50 ADU/pixel in (c) linear and (d) logarithmic intensity scales.
Crystals 12 00065 g005
Figure 6. Different classes of peaks: (a) circular peaks that are peaks with one local maximum, a sphericity higher than 0.7 and Δ Q c m of at least 0.2 Å−1 to the nearest peak in reciprocal space; (b) non-circular peaks that are peaks with one local maximum, a sphericity lower than 0.3 and Δ Q c m of at least 0.2 Å−1 to the nearest peak in reciprocal space; and (c) structured peaks that have several maxima or single peaks that have Δ Q c m of less than 0.2 Å−1 to the nearest peak. All peaks are shown from 0 to 5000 ADU in a non-perceptual (jet) colormap.
Crystals 12 00065 g006
Table 1. Hit and peak statistics for different temperatures (or different travel distances of the droplet from nozzle tip to the interaction region).
Travel Time (ms)T (K)Total HitsTotal PeaksHits above 50 ADU/pixelHits below 50 ADU/pixelPeaks above 50 ADU/pixelPeaks below 50 ADU/pixel
3.91230111389971034798708289
4.41229398521,5752771121418,0053570
4.89228345725,9369202537540220,534
Table 2. Peak statistics for different crystal reflections of hexagonal ice for both strong (≥50 ADU/pixel) and weak (<50 ADU/pixel) hits and different travel times. The statistics of the number of peaks for three different classes of Bragg peaks (circular, non-circular and structured peaks) are also presented.
Directions (hkl)Travel Time
(ms)
Hits ≥ 50 ADU/pixelHits < 50 ADU/pixelPeaks ≥ 50 ADU/pixelPeaks < 50 ADU/pixelCircular Peaks 50 ADU/pixelNon-Circular Peaks 50 ADU/pixelStructured Peaks 50 ADU/pixelCircular Peaks < 50 ADU/pixelNon-Circular Peaks < 50 ADU/pixelStructured Peaks < 50 ADU/pixel
(100)3.9177622154726103925251926
4.41184641430304561867805051791743
4.895678289139495002116542516151
(002)3.9172336131445473395201609
4.4116024512526504874559391357121
4.894938647079581892328432712268
(101)3.9171725126733473304051407
4.41171433128504121206598101461091
4.89489618790733326142592878168
(102)3.91457106661117831313404
4.41121316117121996365467576966
4.89374389569442223122001816121
(110)3.914582569539168223876126
4.4111653331668429503548291377114
4.893991275593189721025240755103669
(103)3.91269113452269152093016
4.4176018997926625947507578143
4.8927979338312951041117929019709
(200),
(112),
(201)
3.91408135373420661831129
4.418732091111533429213685743718
4.8925496733263051157105110406028
Publisher’s Note: MDPI stays neutral with regard to jurisdictional claims in published maps and institutional affiliations.