Article

Between Harmonic Crystal and Glass: Solids with Dimpled Potential-Energy Surfaces Having Multiple Local Energy Minima

by
Nikolai A. Zarkevich
1,2,* and
Duane D. Johnson
1,3
1
Ames Laboratory, U.S. Department of Energy, Ames, IA 50011, USA
2
NASA Ames Research Center, Moffett Field, CA 94035, USA
3
Materials Science & Engineering, Iowa State University, Ames, IA 50011, USA
*
Author to whom correspondence should be addressed.
Crystals 2022, 12(1), 84; https://doi.org/10.3390/cryst12010084
Submission received: 10 December 2021 / Revised: 31 December 2021 / Accepted: 5 January 2022 / Published: 8 January 2022
(This article belongs to the Special Issue Feature Papers in Crystal Engineering in 2022)

Abstract

:
Solids with dimpled potential-energy surfaces are ubiquitous in nature and, typically, exhibit structural (elastic or phonon) instabilities. Dimpled potentials are not harmonic; thus, the conventional quasiharmonic approximation at finite temperatures fails to describe anharmonic vibrations in such solids. At sufficiently high temperatures, their crystal structure is stabilized by entropy; in this phase, a diffraction pattern of a periodic crystal is combined with vibrational properties of a phonon glass. As temperature is lowered, the solid undergoes a symmetry-breaking transition and transforms into a lower-symmetry phase with lower lattice entropy. Here, we identify specific features in the potential-energy surface that lead to such polymorphic behavior; we establish reliable estimates for the relative energies and temperatures associated with the anharmonic vibrations and the solid–solid symmetry-breaking phase transitions. We show that computational phonon methods can be applied to address anharmonic vibrations in a polymorphic solid at fixed temperature. To illustrate the ubiquity of this class of materials, we present a range of examples (elemental metals, a shape-memory alloy, and a layered charge-density-wave system); we show that our theoretical predictions compare well with known experimental data.

1. Introduction

Is there an intermediate state of matter between harmonic crystals and amorphous glasses? Below, we describe such state and identify key properties that lead to structural (elastic or phonon) instabilities and symmetry-breaking phase transition, such as the large athermal atomic displacements away from high-symmetry crystallographic positions, a dimpled atomic potential with multiple local minima (MLM), and a time-dependent pattern in the occupied neighborhoods of the local potential-energy minima (LPEM).
Here, in particular, we identify specific features in the potential-energy (PE) surface (appropriately defined in Figure 1) that lead a given solid to exhibit polymorphic behavior, which can be either stationary or dynamic. Next, we discuss computational methods to address such MLM state. Dimpled potentials are inherently anharmonic and present a challenge for the conventional theoretical methods. Notably, computational methodologies (typically assuming harmonic or quasiharmonic behavior) must be used with care to calculate the anharmonic (temperature-sensitive) vibrational contributions to free energy found for this class of solids. The underlying mathematical formulation is given in Appendix A and Appendix B. We also provide reliable means to address these anharmonic states and to estimate the energetics and temperatures associated with the solid–solid symmetry-breaking phase transition for such polymorphic solids with MLM potentials.
By definition, polymorphism describes the ability of a solid to have several atomic structures arising from MLM, some of which compete. If a transformation to another structure has sufficiently high enthalpy barriers, then each polymorph is a stable or metastable stationary state, in which atoms thermally vibrate around a local minimum in the PE surface. In contrast, if the transformation barriers are low compared to the thermal energy of atomic motion in a solid with a dimpled atomic potential, then multiple neighborhoods of local PE minima are visited by an ergodic atomic motion in a “dynamically polymorphic” phase. In this phase, a diffraction pattern of a periodic crystal coexists with vibrational properties of a phonon glass. Upon cooling, such solid must undergo a symmetry-breaking phase transition, accompanied by a decrease in lattice entropy.
As such, a harmonic vibration in a parabolic potential, a rattling motion in a locally flat potential, and a non-harmonic ergodic atomic motion in an MLM neighborhood are very different—the vibrational lattice entropy of the latter is challenging to calculate. Due to the structural instability, each MLM solid transforms to a lower-symmetry phase at lower temperature T; the transition temperature T c can be estimated [1]. Among the examples of symmetry-breaking transitions are martensitic transformations from a high-T austenitic to a low-T martensitic phase. Although common in solids with instabilities [2], dimpled potentials are not straightforward to handle. A cross section of enthalpy along a transformation path can be computed via solid-state nudged elastic band (NEB) methods [3,4,5].
Typically, the crystallographic high-symmetry atomic position is an enthalpy extremum, which can be a (meta)stable local minimum (Figure 1a) or an unstable maximum, as in Figure 1b. More generally, the constituents (atoms, ions, or molecular units) in a solid are trapped in PE basins (Figure 1), separated by barriers, E B , which are high compared to k T , where k is the Boltzmann constant. Solids can be crystalline or amorphous. An amorphous structure lacks atomic long-range order (Figure 1c). By definition, a crystal is a solid with an ordered Bravais lattice, with atomic potentials in a periodic geometric arrangement with a definite stable shape, satisfying Born criterion for the structural stability [6].
To help classify various solids, we define PE barriers for traditional and competing polymorphic states. A conventional quasiharmonic crystal has a locally parabolic atomic potential with a single minimum per PE basin. Its harmonic phonons can be computed within the quasiharmonic approximation (QHA) [7]. The high-symmetry atomic position at the center of a PE basin is at a local energy minimum. In contrast, MLM solids have multiple stable structures associated with several LPEM, separated by the associated local barriers, E l , that are low compared to the thermal energy k T of the atomic motion. To classify these, let N L 1 be the number of LPEM per basin; each LPEM is a stable or metastable arrangement of atoms. In an MLM solid with N L > 1 , the high-symmetry atomic position at the geometric center of a PE basin can occur at a local PE maximum or a saddle point, with several LPEM surrounding it, as in Figure 1b, Figure 2, Figure 3, and Figure 4b. This can be compared to the instability of the B2 structure in Figure 5 or instabilities of the body-centered cubic (bcc) phases in Figure 8.
Figure 2. (color online) Schematic of 2D sombrero PE basins arranged in a square lattice. Energy cross section (b) along the horizontal dashed red line in panel (a) is identical to Figure 1b. See also corrugated sombrero potentials in Figure 3.
Crystals 12 00084 g002
Figure 3. (color online) (a,b) Corrugated sombrero potentials with 4 (a) and 8 (b) equidistant LPEMs, given by Gaussians. (cf) Networks of symmetry-equivalent displacements (black spheres) relative to x = 0 (red dot). Two-dimensional basin with (c) hexagonal 3-fold rotational symmetry (shaded is its inversion) and (d) square 4-fold rotational symmetry. (e) The [111] projection, with shading below [111] plane through 3 corners of the cube, and (f) a view of the central part of a basin with 48 dimples, forming a 3D cubic lattice. LPEMs (black spheres) are displacements from a local maximum at the center (red dot). MEPs between pairs of LPEMs are represented by lines (light blue) that are not necessarily straight.
Crystals 12 00084 g003
Figure 4. (color online) Potential energy E and force F = d E / d x versus displacement x (in arbitrary units) for a 1D crystal, which is either (a) harmonic for E < E H with N L = 1 (as in Figure 1a) or (b) anharmonic with N L = 2 (as in Figure 1b). For anharmonic case, forces at x L < x < x L (shaded) push an atom away from the unstable equilibrium at x = 0 , as F / x < 0 . For k T > E L , the average atomic position is x = 0 , and the effective linear force and harmonic potential at x 0 (filled circle) are shown (orange dashed lines).
Crystals 12 00084 g004
Figure 5. (color online). NiTi potential energy vs. collective atomic displacement (which changes linearly from x = 0 at unstable B2 (CsCl) to ± x L at a LPEM) for a MEP from B2 to a representative austenitic structure (LPEM, E = 0 ), from B2 to BCO (base-centered orthorhombic B33) ground state. The B2-to-BCO (B33) transition occurs via B19′ or R′ structures (thin dashed lines), see Figure 6 (or also Figure 4 in [8]). Additionally, there is a pathway for a (lower-barrier) transformation between two orientations of B19’ (deformed BCO B33) martensite via B19 (thick green dashed line), see Figure 6f,g or also Figure 1b,e,f,i in [8] and Figure 3 in [8] or Figure 3 in [5]. There are low-enthalpy barriers around each austenitic LPEM (thin solid black line near x = 0 , E = 0 ), see also Figure 4 in [5].
Crystals 12 00084 g005
To set relative energy scales, we set E = 0 to be the enthalpy of the lowest LPEM, relative to which E L 0 is the enthalpy at the high-symmetry point at the center of a PE basin. E l is a low local barrier between the nearby LPEM in the same PE basin, and E B is a high barrier between basins. These enthalpies satisfy the inequality
0 E l E L E B .
As the PE surface depends on atomic positions and electronic structure, enthalpy is a multivariable functional of many positions. Consequently, the minimal-enthalpy path (MEP) from one LPEM to another refers to a collective atomic motion.
Each LPEM corresponds to a stable or metastable polymorph. If the barriers E l between polymorphs are high relative to k T , then each polymorph is stationary [9]. Yet, if E l k T , then ergodic thermal atomic motion covers several polymorphic states. Under certain conditions, such solids exhibit “buckled” [10] or “rattling” [11] modes of atomic motion. The MLM solids constitute a very interesting class of materials which differ from both harmonic crystals and amorphous glasses.
Existence of an intermediate class of solids between quasiharmonic crystals and glasses is the focus of our present consideration. We analyze properties of such solids and consider computational methods for dealing with them. In Section 2, we consider model potentials with N L > 1 and investigate atomic motion in MLM solids. In Section 3, we provide examples of unstable crystals with dimpled MLM atomic potentials. Computational details are given in Appendix A. In Appendix B, we consider methods for predicting vibrational spectra at various atomic displacements, related to temperature.

2. Models with Dimpled Potentials

As a model, and to set the stage, we consider a periodic potential with deep PE basins; a single atom occupies each basin (we are assuming that a strong interatomic repulsion at short distances makes presence of another atom in the same basin energetically unfavorable). For simplicity, we assume that enthalpies of all LPEM are the same and the barriers have the same height—although, by indexing the individual enthalpies, one can generalize to a less-symmetric case.

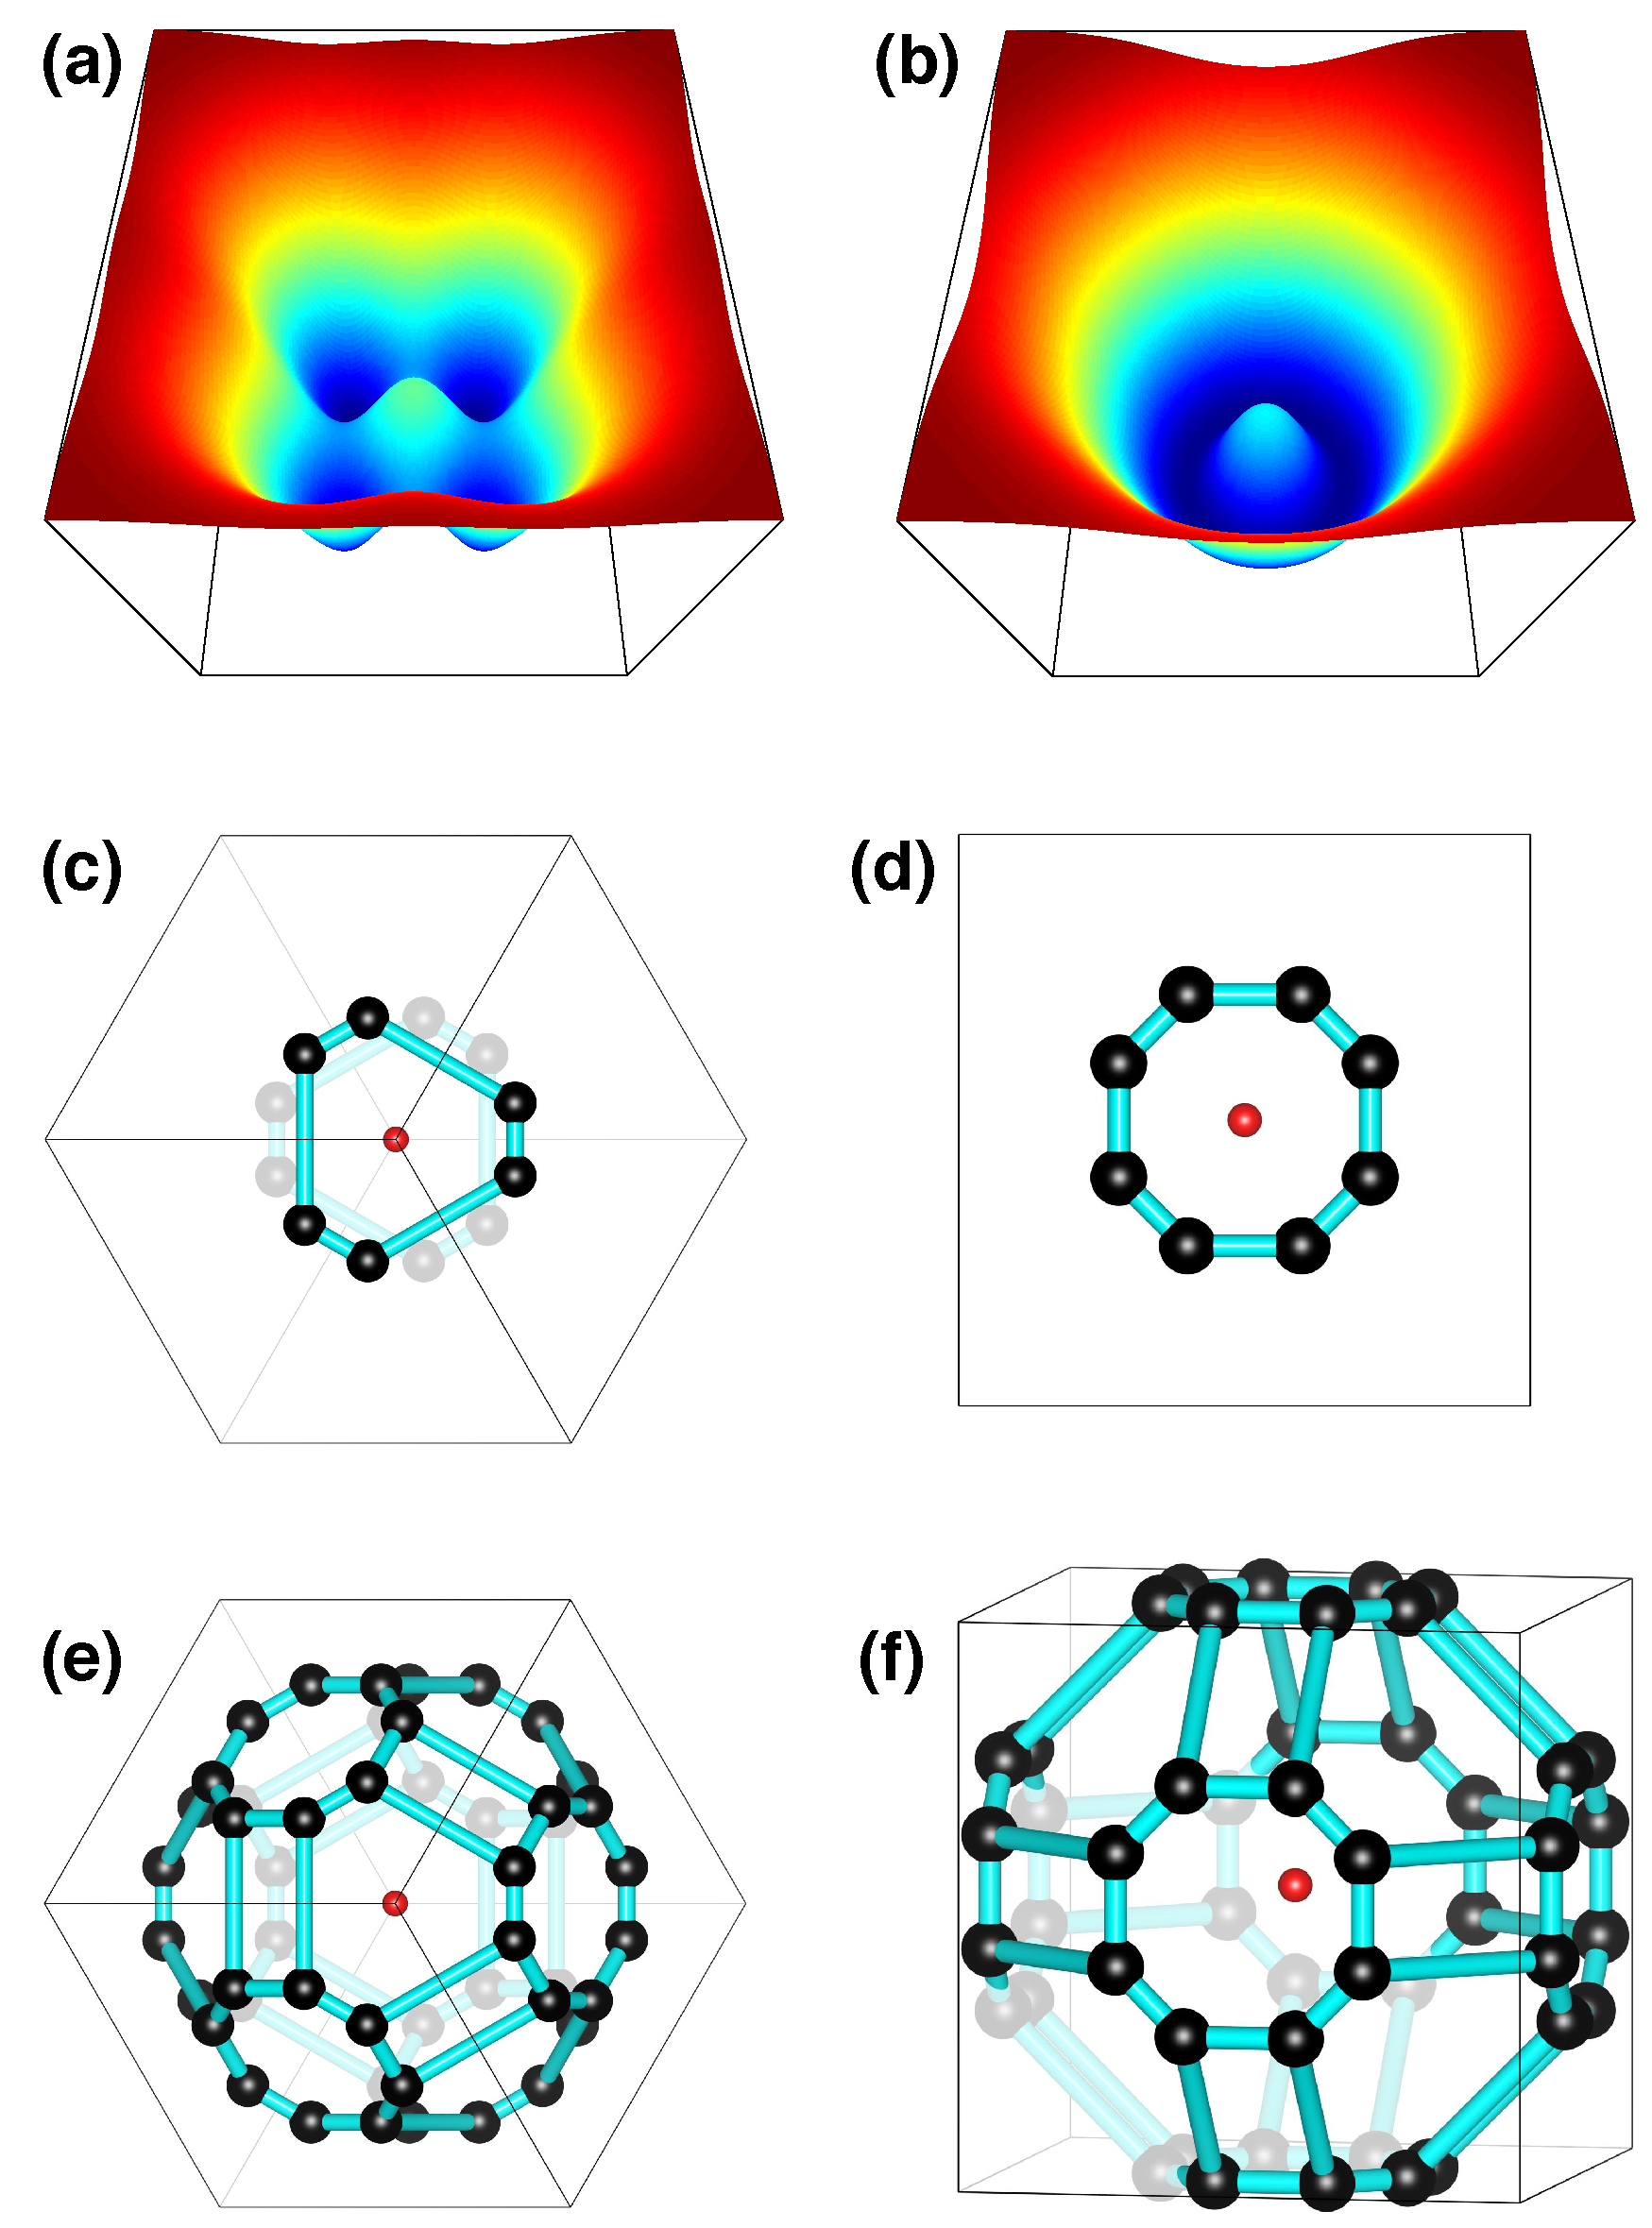
2.1. Networks of LPEM in MLM Solids

In a single basin, a set of LPEM connected by MEP forms a network: examples include Figure 1b, Figure 2 and Figure 3. The local enthalpy barriers E l ( E L ) are either the saddle points or local maxima on MEP, see Inequality (1).
For a harmonic potential, N L = 1 and E l = E L = 0 , as in Figure 1a. A one-dimensional double-well potential with N L = 2 is shown in Figure 1b, where the path from one LPEM at x L to another at + x L unavoidably goes through the local PE maximum at x = 0 ; here E l E L > 0 . In higher dimensions ( D > 1 ), a MEP can bypass the local maximum at E L , as in Figure 2. Figure 3 shows the 2D and 3D corrugated sombrero potentials with N L > 1 , where the saddle points E l are lower than the local enthalpy maximum E L , hence 0 < E l < E L E B . Inequality (1) is satisfied in all these examples.

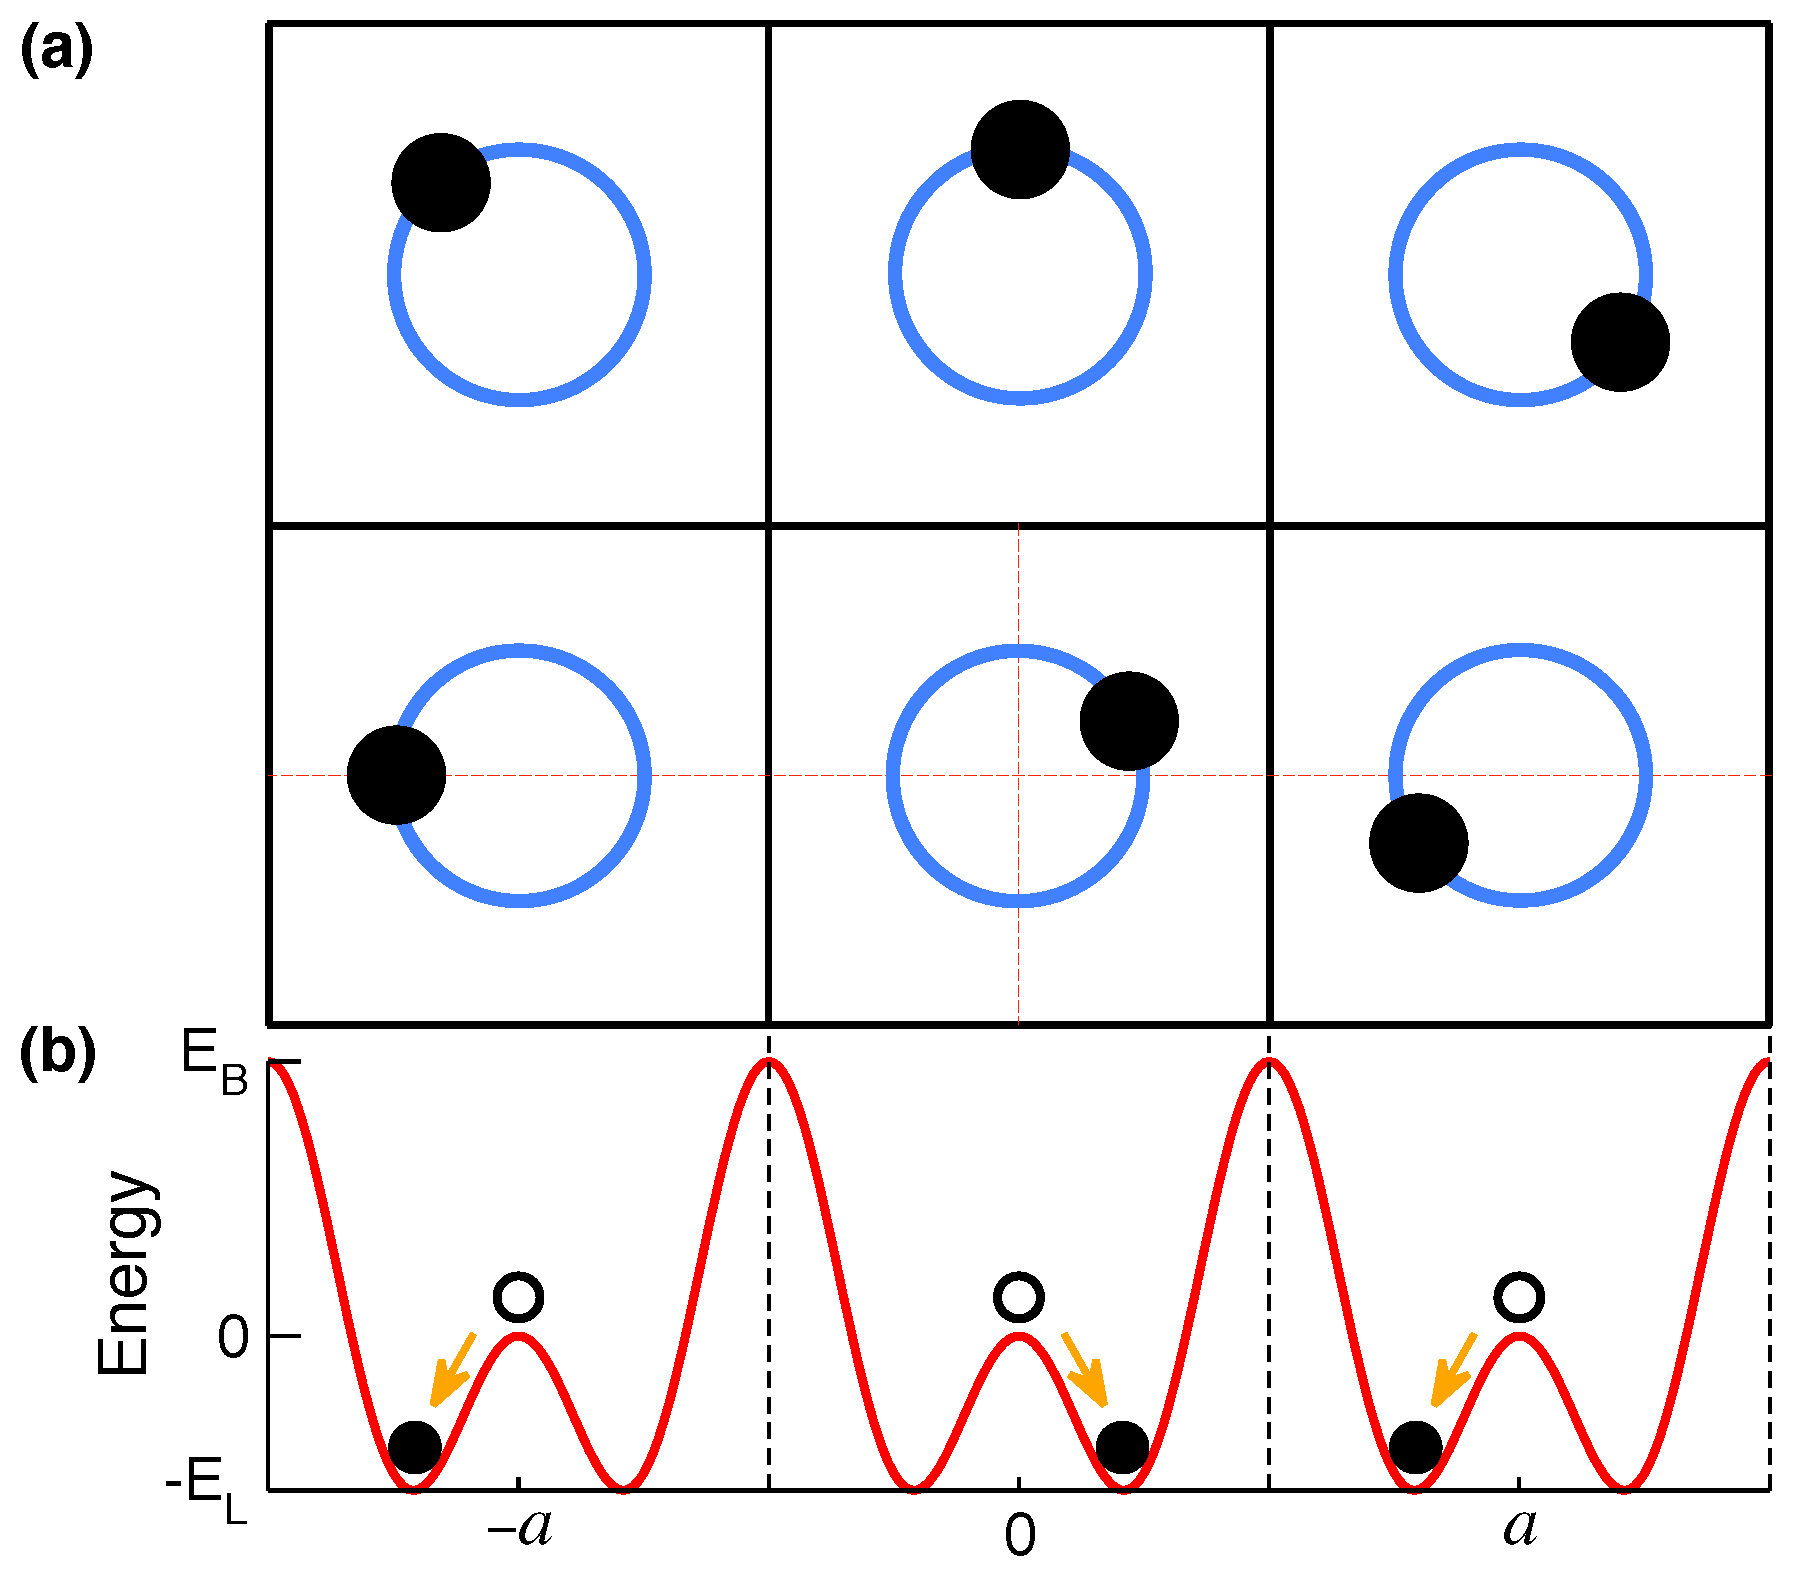
2.2. Symmetry-Breaking Phase Transition

At a high enough temperature T, an atom can overcome the barriers E l and move from one LPEM to another in the same PE basin; its ergodic motion covers multiple LPEMs, while its time-averaged position is the high-symmetry point x = 0 . At a low T, each atom is trapped in the vicinity of a single LPEM at | x | = x L , see Figure 4b. A symmetry-breaking phase transition occurs near the transition start temperature:
T c = I c E l / k .
Here, I c 1 is a dimensionless geometric constant [1]. Its value depends on the topology of the system. For example, I c = 1 for the classical 1D motion of a single particle with the total energy E = k T in a fixed dimpled MLM potential, see Figure 1b and Figure 4b.
In general, an effective potential for each atom depends on positions of the other atoms and on the instant electronic structure. The mean-field approximation allows to reduce complexity of an intractable many-body problem to consideration of a single particle in an effective potential. Within this approximation, a complicated many-body system with quantum effects is substituted by a simple classical model containing a single atom moving in a fixed effective potential, and, for such an oversimplified model, the T c in Equation (2) can be precise; however, the model itself is an approximation.
Two phases coexisting in thermodynamic equilibrium at T e have the same Gibbs free energies G = H T S , where H is enthalpy and S is entropy; hence, Δ G ( T e ) Δ H ( T e ) T e Δ S ( T e ) = 0 ; and consequently,
T e = Δ H ( T e ) / Δ S ( T e ) .
Equation (3) is exact. However, both Δ H ( T e ) and Δ S ( T e ) are difficult to determine [12], and both are functionals of specific heat at constant pressure, c p ( T ) .
The barrier E l is relevant to kinetics, and T c in Equation (2) approximates the temperature at which the phase transformation starts. In contrast, Gibbs free energy describes thermodynamics, and T e in Equation (3) denotes the temperature of phase coexistence at a thermodynamic equilibrium. In general, a first-order phase transition is accompanied by a hysteresis, usually described by four temperatures at which direct and reverse transformations start and end, see inequalities (5). Those temperatures are affected by inhomogeneities, lattice mismatch, and nucleation barriers, neglected in both equations for kinetics (2) and thermodynamics (3).

2.3. Expected Thermal Atomic Motion

Atomic motion in a solid with N L > 1 can cover the vicinity of one or several LPEM. We distinguish several types of T-dependent atomic motion.
  • k T E h E l : harmonic vibration around a single LPEM. The small-displacement method can provide phonons at a LPEM (see Appendix B).
  • E h < k T < E l : anharmonic vibration around a single LPEM.
  • k T E l : a transition occurs, see Equations (2) and (3) and inequalities (5).
  • E l k T < E L : motion covers several LPEMs in the same basin. If such LPEMs are distributed symmetrically around x = 0 , then the time-averaged atomic position is x = 0 .
  • E L k T < E B : motion covers a significant part of the PE basin, including neighborhoods of x = 0 and multiple LPEMs. If the PE surface has a negligible roughness ( E L k T ) at the bottom of a nearly harmonic potential, then a finite atomic displacement method can be used to calculate phonons around x = 0 , see Appendix B.
  • k T E B : atomic motion is no longer restricted by a PE basin; the solid has melted or sublimated.
A dynamically polymorphic solid phase exists if an ergodic atomic motion overcomes the barriers E l between LPEM at I c E l < k T < E B . Upon cooling, it transforms to a lower-symmetry phase at k T < I c E l (Equation (2)); the symmetry-breaking phase transition is expected to be of the first order, as it is accompanied by a discontinuous change of the lattice entropy S L . Indeed, entropy increases as the logarithm of the number of states, and an ergodic atomic motion covering several LPEMs involves more states than a vibration around a single LPEM. Under certain conditions, a change of the total entropy is responsible for the caloric effect [13,14]. In the “caloric” materials, such as NiTi [8] or FeRh [15], this effect can be quite large and was accurately predicted [16].

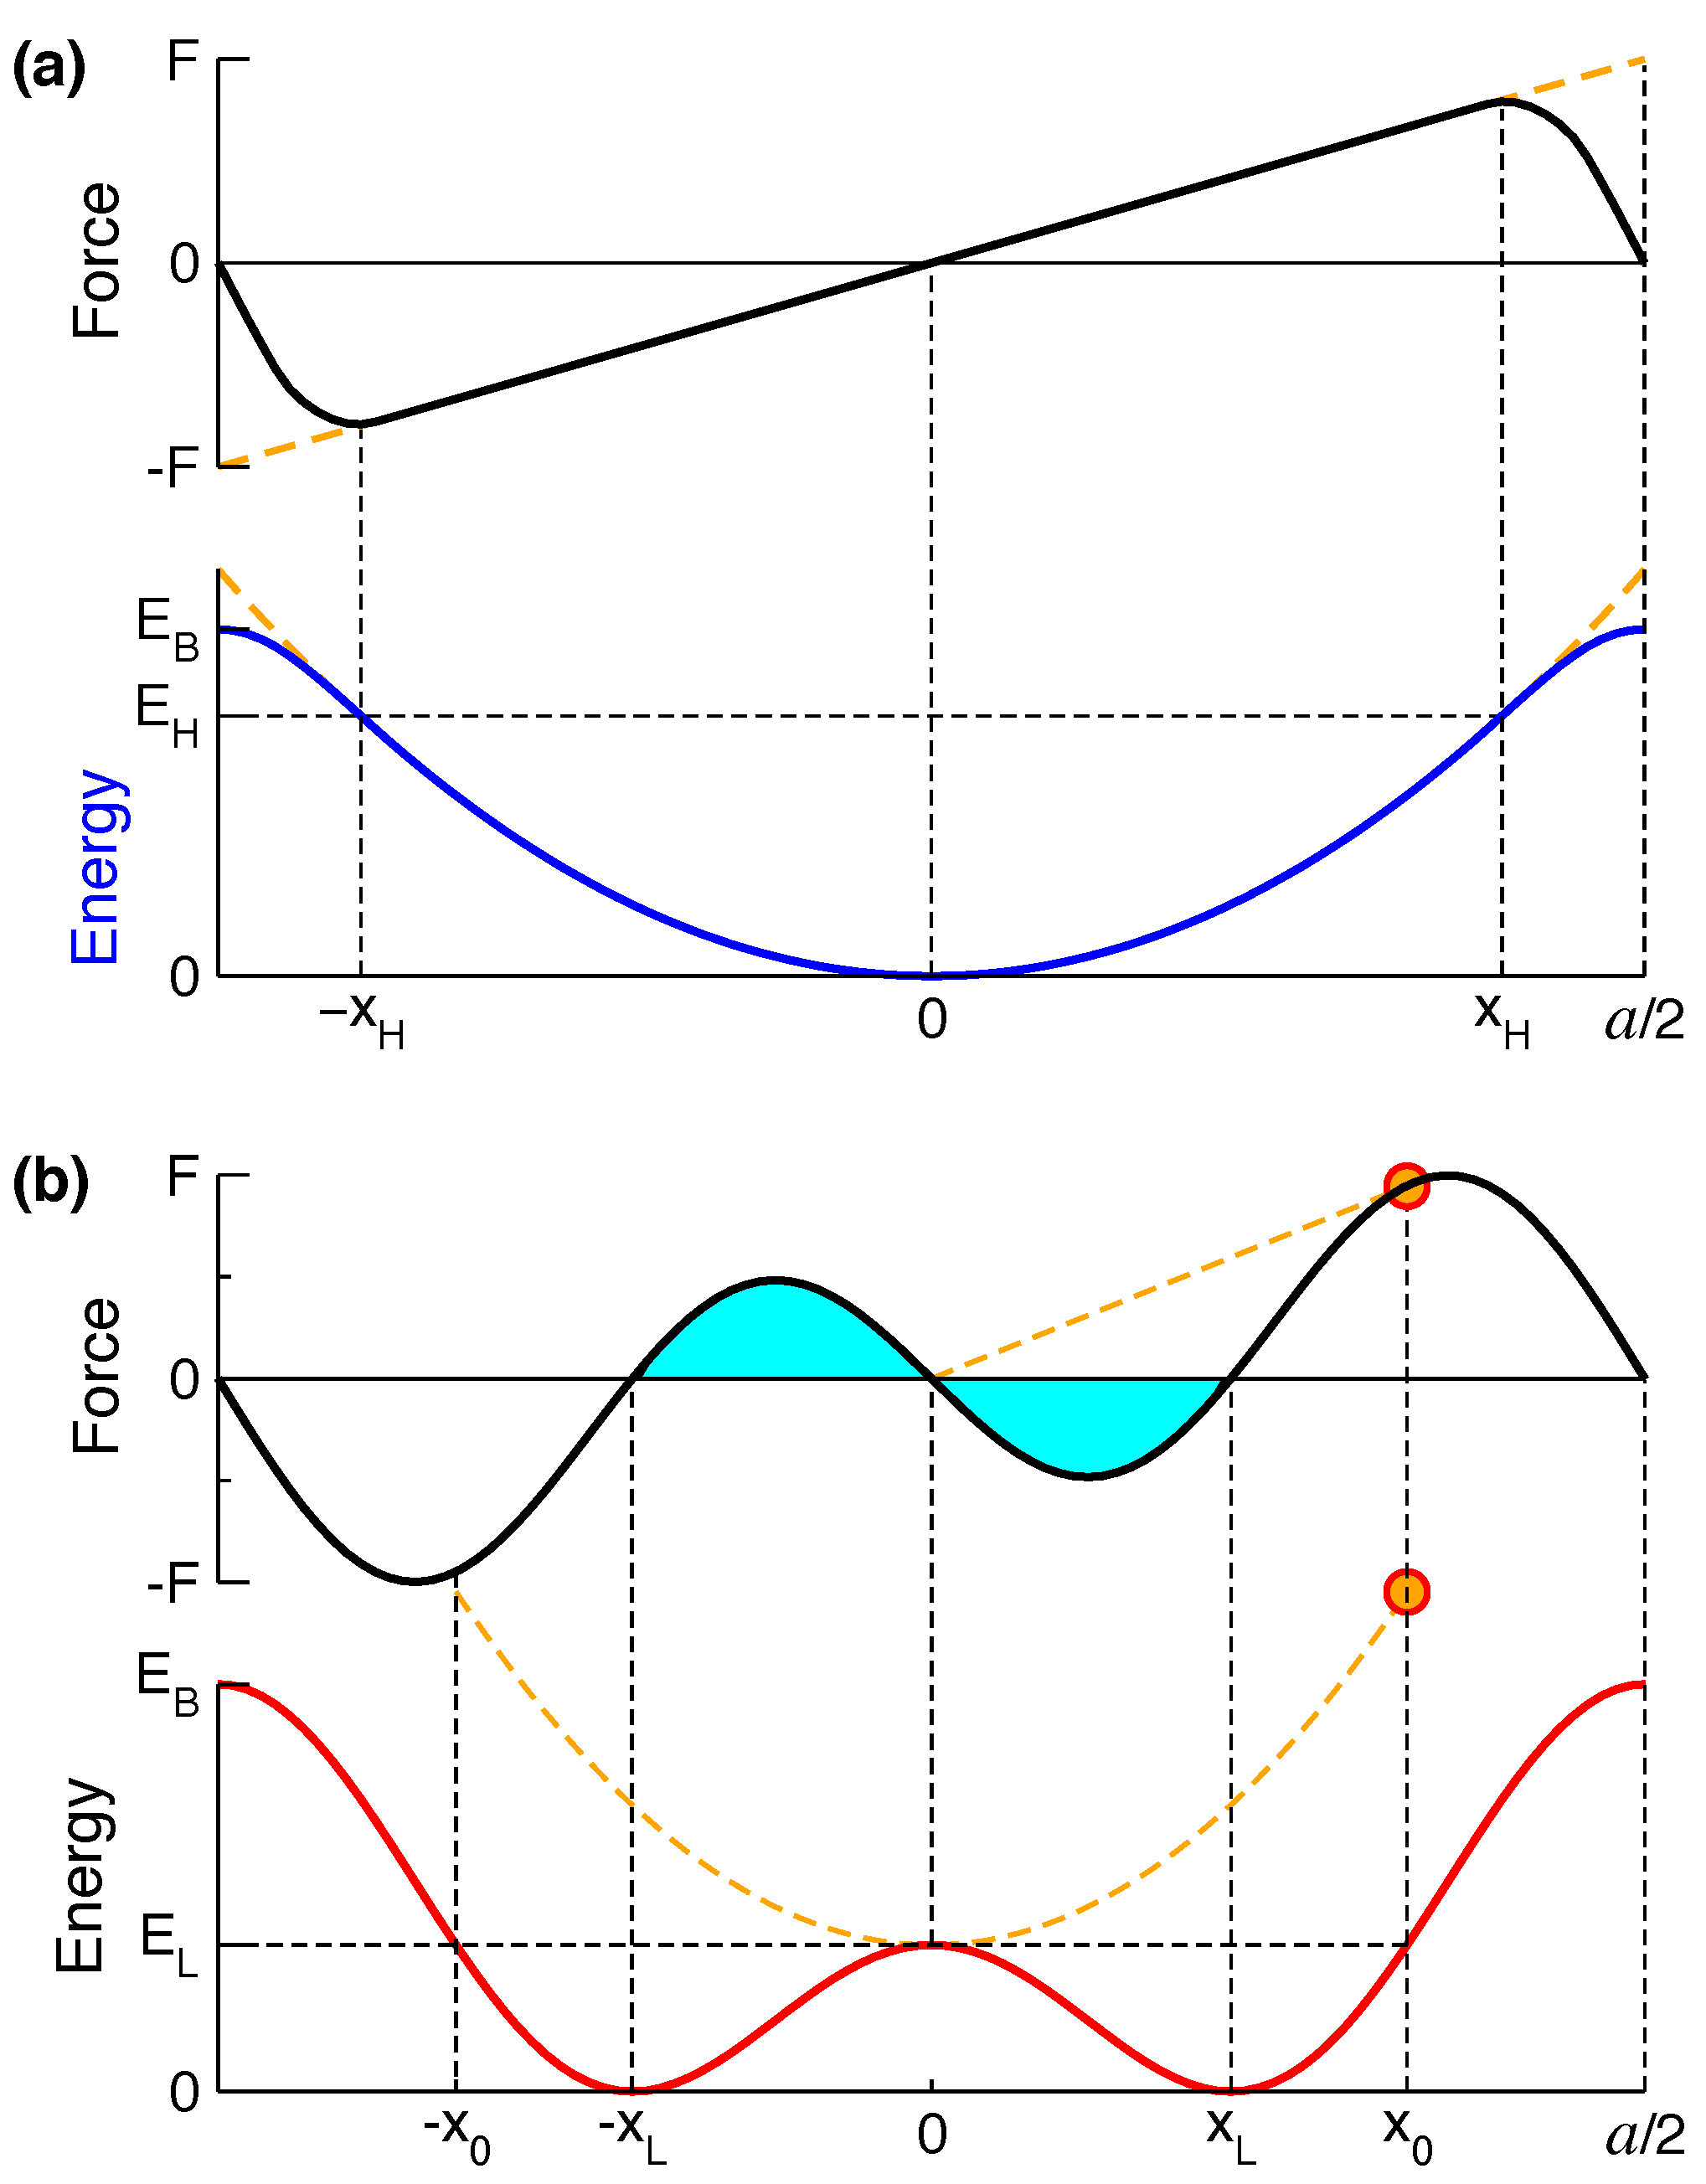
2.4. Atomic Forces in MLM Solids

Harmonic vibrations or phonons (Figure 4a) are described in the literature [17,18]. Here, we focus on a less-trivial case of an anharmonic motion in a dimpled double-well potential, shown in Figure 4b. It has a crystallographic high-symmetry point at x = 0 , but E ( 0 ) = E L is a local energy maximum, with two minima nearby at E ( ± x L ) = 0 . At x = 0 , the energy barrier E l = E L is between those two LPEMs. At k T E l E L , the small-displacement (or linear-response) method can be applied to a representative stable structure to find the relevant phonons.
Alternatively, at E L k T E H < E B , if multiple LPEMs are considered as a negligibly small roughness at the bottom of an otherwise nearly harmonic potential, then the finite-displacement method will approximate phonons at the average atomic position x = 0 (unstable at low T), see Appendix B.
For the double-well potential in Figure 4b, the “effective” spring stiffness K e = F ( x ) / x depends on displacement x. A negative K e for a small displacement | u | | x 0 | < x L results in imaginary frequency ω e = K e / M , characterizing an unstable phonon mode. The displacement x L with F ( x L ) = 0 gives K e = 0 and a soft phonon mode with ω e = 0 . A large displacement | u | > x L leads to a positive K e and a stable effective phonon frequency ω e > 0 , which depends on displacement u (Figure 4b, given by dashed orange line).
In other words, the frequency ω e of vibrations around an unstable equilibrium at x = 0 is not well-defined. However, a choice of a finite x T x 0 is related to thermal motion of atoms at temperature T, such that
E ( x T ) E ( x ) = 1 2 k T ,
results in a phonon spectrum that is stable and compares well with experiment at the same T [19]. It reflects the PE surface explored by large amplitudes of displacements, but approximates the actual PE by parabolic (Figure 4b, dashed orange line), neglecting the LPEM. This method is accurate at E L k T E H < E B . Alternatively, one can use forces from the steps of molecular dynamics (MD) to obtain phonons at a fixed T.
Phonon computational methods are compared in Appendix B. For deep dimples, phonons computed for a stable representative structure at a LPEM match the experimental measurement (see example in Section 3.1). For shallow dimples, one can use the finite displacements from the high-symmetry position; the finite-displacement method with u’s fixed by Equation (4) matches the results based on MD simulations at the same T.

2.5. Examples for Corrugated-Sombrero Potentials

To visualize a dimpled PE surface with a network of MEP connecting multiple LPEM in real crystalline materials, we exemplify appearance of corrugated potentials with the associated symmetries. A cubic austenite system with an unstable high-symmetry atomic position, such as that found in B2-type NiTi austenite [20] and many other systems, can have up to 48 symmetry-equivalent stable collective atomic displacements (LPEMs). In Figure 3, MEPs (lines) between LPEMs (dots) form networks in 2D and 3D. The similarity between the muffin-tin and corrugated sombreros increases with increasing number of LPEMs, see Figure 3a,b. The model sombrero potentials (Figure 2) and a qualitative distribution of LPEMs linked by networks of MEPs in Figure 3 help to understand atomic motion with large athermal displacements in real materials, such as NiTi. Many solids with lattice instabilities have atomic potentials that are reminiscent of a corrugated sombrero [21]. Examples include the austenitic phase of shape-memory NiTi and the bcc phases of Ti, Zr, Hf [22,23], and Li metals [24].

2.6. Diffraction from MLM Solids

In a solid in which atoms are arranged in a definite pattern (and whose surface regularity reflects its internal symmetry [25]), the crystalline arrangement of atoms [26] is manifested by diffraction of electrons, X-rays, or neutrons. Comparing an experimental diffraction pattern with that predicted for a Bravais lattice, crystallographers suggest a crystal structure [27]. Nevertheless, a correspondence between crystal structures and a diffraction pattern is many-to-one: various fully or partially ordered crystals might produce similar patterns. In some crystals, the ideal atomic positions on a Bravais lattice are unstable [2]. Figure 2 shows a 2D model, which produces a diffraction pattern of a square lattice, while each high-symmetry position at the center of a sombrero potential basin is unstable (and avoided by atomic motion at k T E L ). Examples of corrugated sombrero potential basins are shown in Figure 3. Austenite NiTi has the assumed unstable B2 structure and multiple stable representative structures [20]. Lattice instabilities were found in the antiferromagnetic (AFM) phase of B2 FeRh [15] and in bcc phases of Ti, Zr, Hf, and Li [2,28,29]. In MLM solids, athermal atomic displacements from the high-symmetry crystallographic positions are a common feature.

3. Example Applications

3.1. NiTi Austenite

NiTi is the most-used shape-memory alloy. It undergoes a first-order structural phase transition from the low-T martensitic to the high-T austenitic phase near T e 313 341 K [30,31], i.e., near room temperature.
The NiTi austenite at T T e exhibits anomalies of several physical properties, including instability of the ideal NiTi B2 structure (see Figure 5), softening of the phonon modes [32] and of the elastic shear constants [33,34,35], decreasing sound velocity [36], increasing internal friction [37], negative temperature coefficient of the electrical resistivity [38], positron lifetime increase during positron spectroscopy [39], and appearance of the superlattice reflections at 1 / 3 · ( 110 ) and 1 / 3 · ( 111 ) positions in experimental diffraction patterns [40,41,42].
We found that the energy basin of the NiTi austenite contains a local energy maximum at the unstable B2 structure, surrounded by multiple LPEMs [5,8], which are separated by low-energy barriers (one to a few meV/atom, small compared to k T e ), see Figure 5. Although each LPEM is a stable structure, the barrier on the transformation path from a LPEM to the groundstate is very low (∼1meV/atom, see Figure 4 in [5]). While the highly symmetric cubic B2 structure is unstable [8,43], one may use one of the stable representative structures for an approximate description of NiTi austenite [20].
To obtain a representative structure, we tried several supercells of B2 of various shapes and sizes (Figure 6). Each supercell was heated to 800 K for 100 fs, cooled to 0 K in 800 fs via ab initio MD, and then fully relaxed to the nearest LPEM via the conjugate-gradient algorithm. From the candidate structures, we selected the one with the lowest energy; the smallest one had a 54-atom unit cell (a distorted supercell of both 2-atom B2 and 18-atom R structure). We checked that repeating the whole procedure with a twice-larger (doubled along one of the lattice constants) 108-atom supercell resulted in a different structure with approximately the same energy per atom (within the DFT error), see Figure 6d. We verified that a 54-atom structure is indeed a LPEM with a stable phonon spectrum (Figure 2b in [20]), and we found that its phonon DOS compares well to that obtained from neutron-scattering experiment [44], see Figure 7.
Figure 6. (color online). (a) Ideal B2 (or CsCl) structure and (b) its [111] projection, with Ni (yellow) and Ti (blue) atoms; length of NN (Ni–Ti) bonds is 2.6 Å, NNN (Ni–Ni or Ti–Ti) bonds are 3.0 Å. Stable atomic positions in cubic B2 [111] projection are shown in representative supercells (bounded by thin black line), containing (c) 54 atoms and (d) 108 atoms; for view of projections in 54-atom supercell, see Figure 1 in [20]. The NNN Ni–Ni and Ti–Ti bonds shorter than 2.75 Å (or 2.7 Å in B19) are shown. (e) The kinetically limited unstable intermediate R structure (suggested from experiment [45]) is shown in cubic [111] (or hex [001]) projection (left) and cubic [100] (or hex [111]) projection (right). Shown in [001] (left) and [100] (right) projections are (f) the unstable B19 and (g) the BCO B33 ground state. The orthorhombic B19 and B33 structures can be viewed as monoclinic B19’ with a shear angle θ of 90 and ≈107 , respectively.
Crystals 12 00084 g006
Figure 7. (color online). Phonon density of states assessed from neutron diffraction [44] (black, shaded) and computed for NiTi austenite using several methods: small displacements from the stable LPEM austenitic representative structure [20] at 0 K (thick blue) and unstable B2 at 0 K (dashed red); large displacements from B2 in MD at 1586 K using ThermoPhonon [46] (thin green line).
Crystals 12 00084 g007
Interatomic interactions affect energy and equilibrium atomic positions, shown in Figure 6c,d. The largest distortion of the equilibrium nearest neighbor (NN) distance is 0.66 Å, 25% of NN in B2 and 22% of the B2 lattice constant ( 3 Å), both are above the Lindemann criterion for melting [47]. Atomic radius of Ni ( 1.24 Å) is smaller than that of titanium ( 1.47 Å), while an average displacement of Ni from B2 is larger than that of Ti (Figure 6 in [20]). The athermal NN pair distribution function (Figure 5 in [20]) is skewed and has a substantial width (2.42 to 2.88 Å, and 2.48 to 2.65 Å at half-maximum), in contrast to the 2.60 Å for an ideal B2 single crystal. There are more short Ni–Ni bonds than short Ti–Ti bonds, see Figure 6c,d. The shortest next-nearest neighbor (NNN) distances for both Ni–Ni and Ti–Ti in the austenite are shorter than the Ni–Ti NN distance in an ideal B2 crystal of the same density. The short NNN bonds form chains, which are approximately linear for Ti–Ti and branching for Ni–Ni, see Figure 6c,d. A representative LPEM has a smaller energy than B2 due to optimization of bond distances and angles. NiTi austenite is a dynamic network with large athermal instant atomic displacements from the ideal B2 positions, while the time-averaged atomic positions approximately coincide with those in B2.
A cross section of potential energy E vs. collective displacement x from B2 at x = 0 (Figure 6a,b) to a representative LPEM at x = ± x L (Figure 6c) and beyond is a double-well curve (Figure 5), reminiscent of Figure 4b. In addition, B2 transforms without a barrier to the base-centered orthorhombic (BCO) ground-state B33 structure [8,48], a variant of monoclinic B19’. Figure 5 shows two different transformation paths from B2 to BCO: the red line on the right is a transformation in a monoclinic B19’ unit cell, the blue line on the left (marked R’) is a transformation in the orthorhombic unit cell, shown in Figure 1 in [8]; both paths are barrierless. For the BCO-to-BCO transformation, the barrier (B19 is the maximum on the dashed green line in Figure 5) is well below B2. There are low barriers ( E l 1  meV/atom) for a transition from one LPEM to another, and similar 1  meV/atom barriers from a LPEM to BCO, see Figure 4 in [5]. The complexity of the PE landscape in NiTi is illustrated in Figure 5, with multiple instabilities of the cubic B2 structure.
A cubic structure has 48 isometries, forming O h symmetry group, isomorphic to S 4 × C 2 . If atoms are displaced from B2 to LPEM along generic directions, there can be 48 symmetry-equivalent LPEMs (as in Figure 3f) around a local PE maximum at an ideal B2. For stoichiometric NiTi, each austenitic LPEM is 20 meV/atom below the unstable B2 and 29.5 meV/atom above the martensitic B19’ (BCO) ground state; hence, Equation (2) provides T c = 343 K [8], in agreement with the experimental M s = 341 K [30].
Experimentally, one typically observes a kinetic process, during which assessment is made by extrapolation of the austenitic start A s and finish A f temperatures upon heating and martensitic start M s and finish M f temperatures upon cooling, while theorists typically consider a thermodynamic equilibrium at T e . In addition, temperatures A 1 / 2 and M 1 / 2 at half-transition (at which the material is 50% transformed) are often assumed to be approximately equal to the differential scanning calorimetry (DSC) peak temperatures A p and M p for heating and cooling, respectively. These temperatures satisfy the inequalities
M f < M p < M s ; A s < A p < A f ; M p T e A p ,
as well as M f < M 1 / 2 < M s and A s < A 1 / 2 < A f . For any sample M 1 / 2 T e A 1 / 2 . For a homogeneous sample, one expects M s T e A s , and consequently,
M f < M p < M s T e A s < A p < A f .
Each value in this inequality is affected by the atomic ordering (including long-range order, short-range order, and antisite disorder), which depends on both composition and thermomechanical history of the sample [49,50]. Due to nucleation barriers, the kinetic start temperatures M s and A s differ from T e for the phase coexistence in thermodynamic equilibrium. The spread from M f to A f is the total width of the phase transition. The difference ( A 1 / 2 M 1 / 2 ) is the temperature hysteresis. Hysteresis is increased by nucleation barriers, activation energy, and strain due to a lattice misfit [14].
Chemical inhomogeneity of a sample broadens both direct and reverse transitions. For an inhomogeneous sample, T e (see Equation (6)) is not well defined, and the inequality between M s and A s is ambiguous. Defects that serve as nucleation centers typically decrease the nucleation barriers, leading to a narrower hysteresis.
Atoms in NiTi austenite move from one LPEM to another, forming a dynamically changing pattern. In spite of the atomic motion across multiple LPEMs, the small-displacement method applied to a stable representative austenitic NiTi structure [20] yields a phonon density of states resembling the experimental one [44], see Figure 7. As expected, the small-displacement method applied to unstable B2 structure returns unstable phonon modes, while increasingly large atomic displacements from B2 suppress the relative weight of unstable phonons. From Figure 5, we expect that in NiTi austenite near room T atomistic motion covers mostly the vicinities of multiple LPEMs (illustrated as a network in Figure 3f), but rarely visits the energetically unfavorable B2 configuration. Figure 7 compares the results of several phonon methods with the assessed phonon DOS from the neutron diffraction experiment [44], for which phonons computed at a representative LPEM provide a reasonable match.

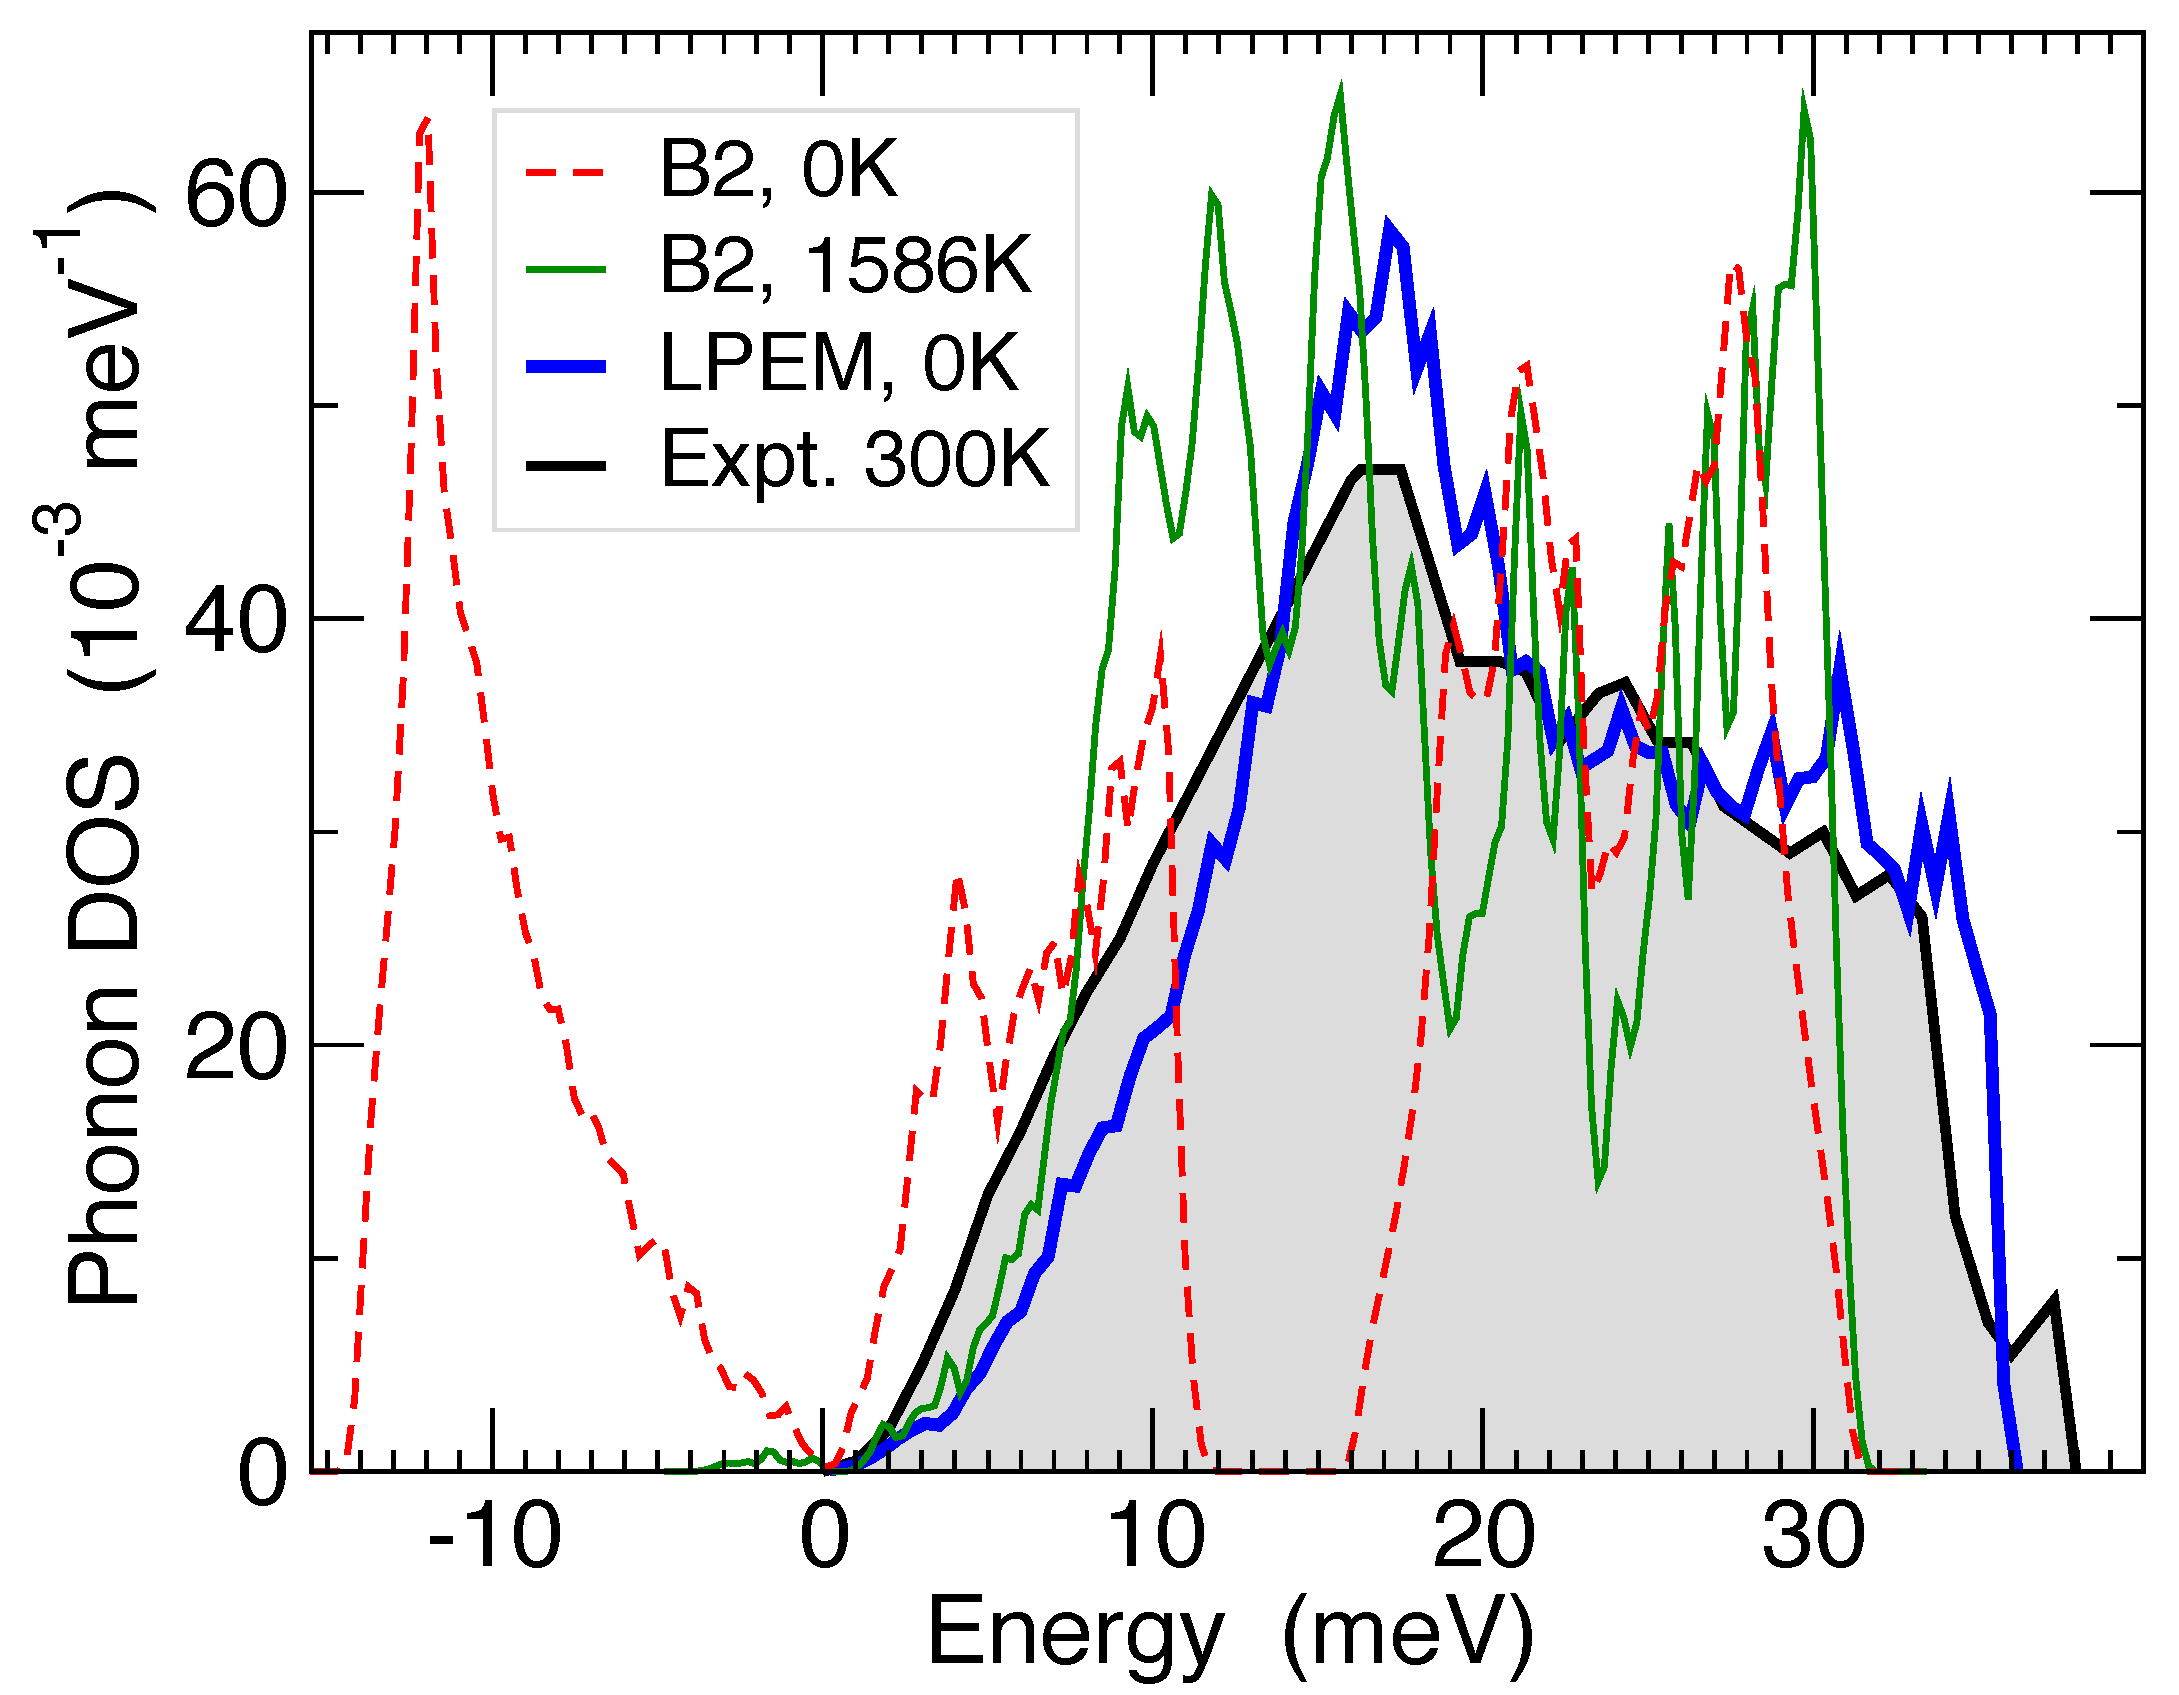
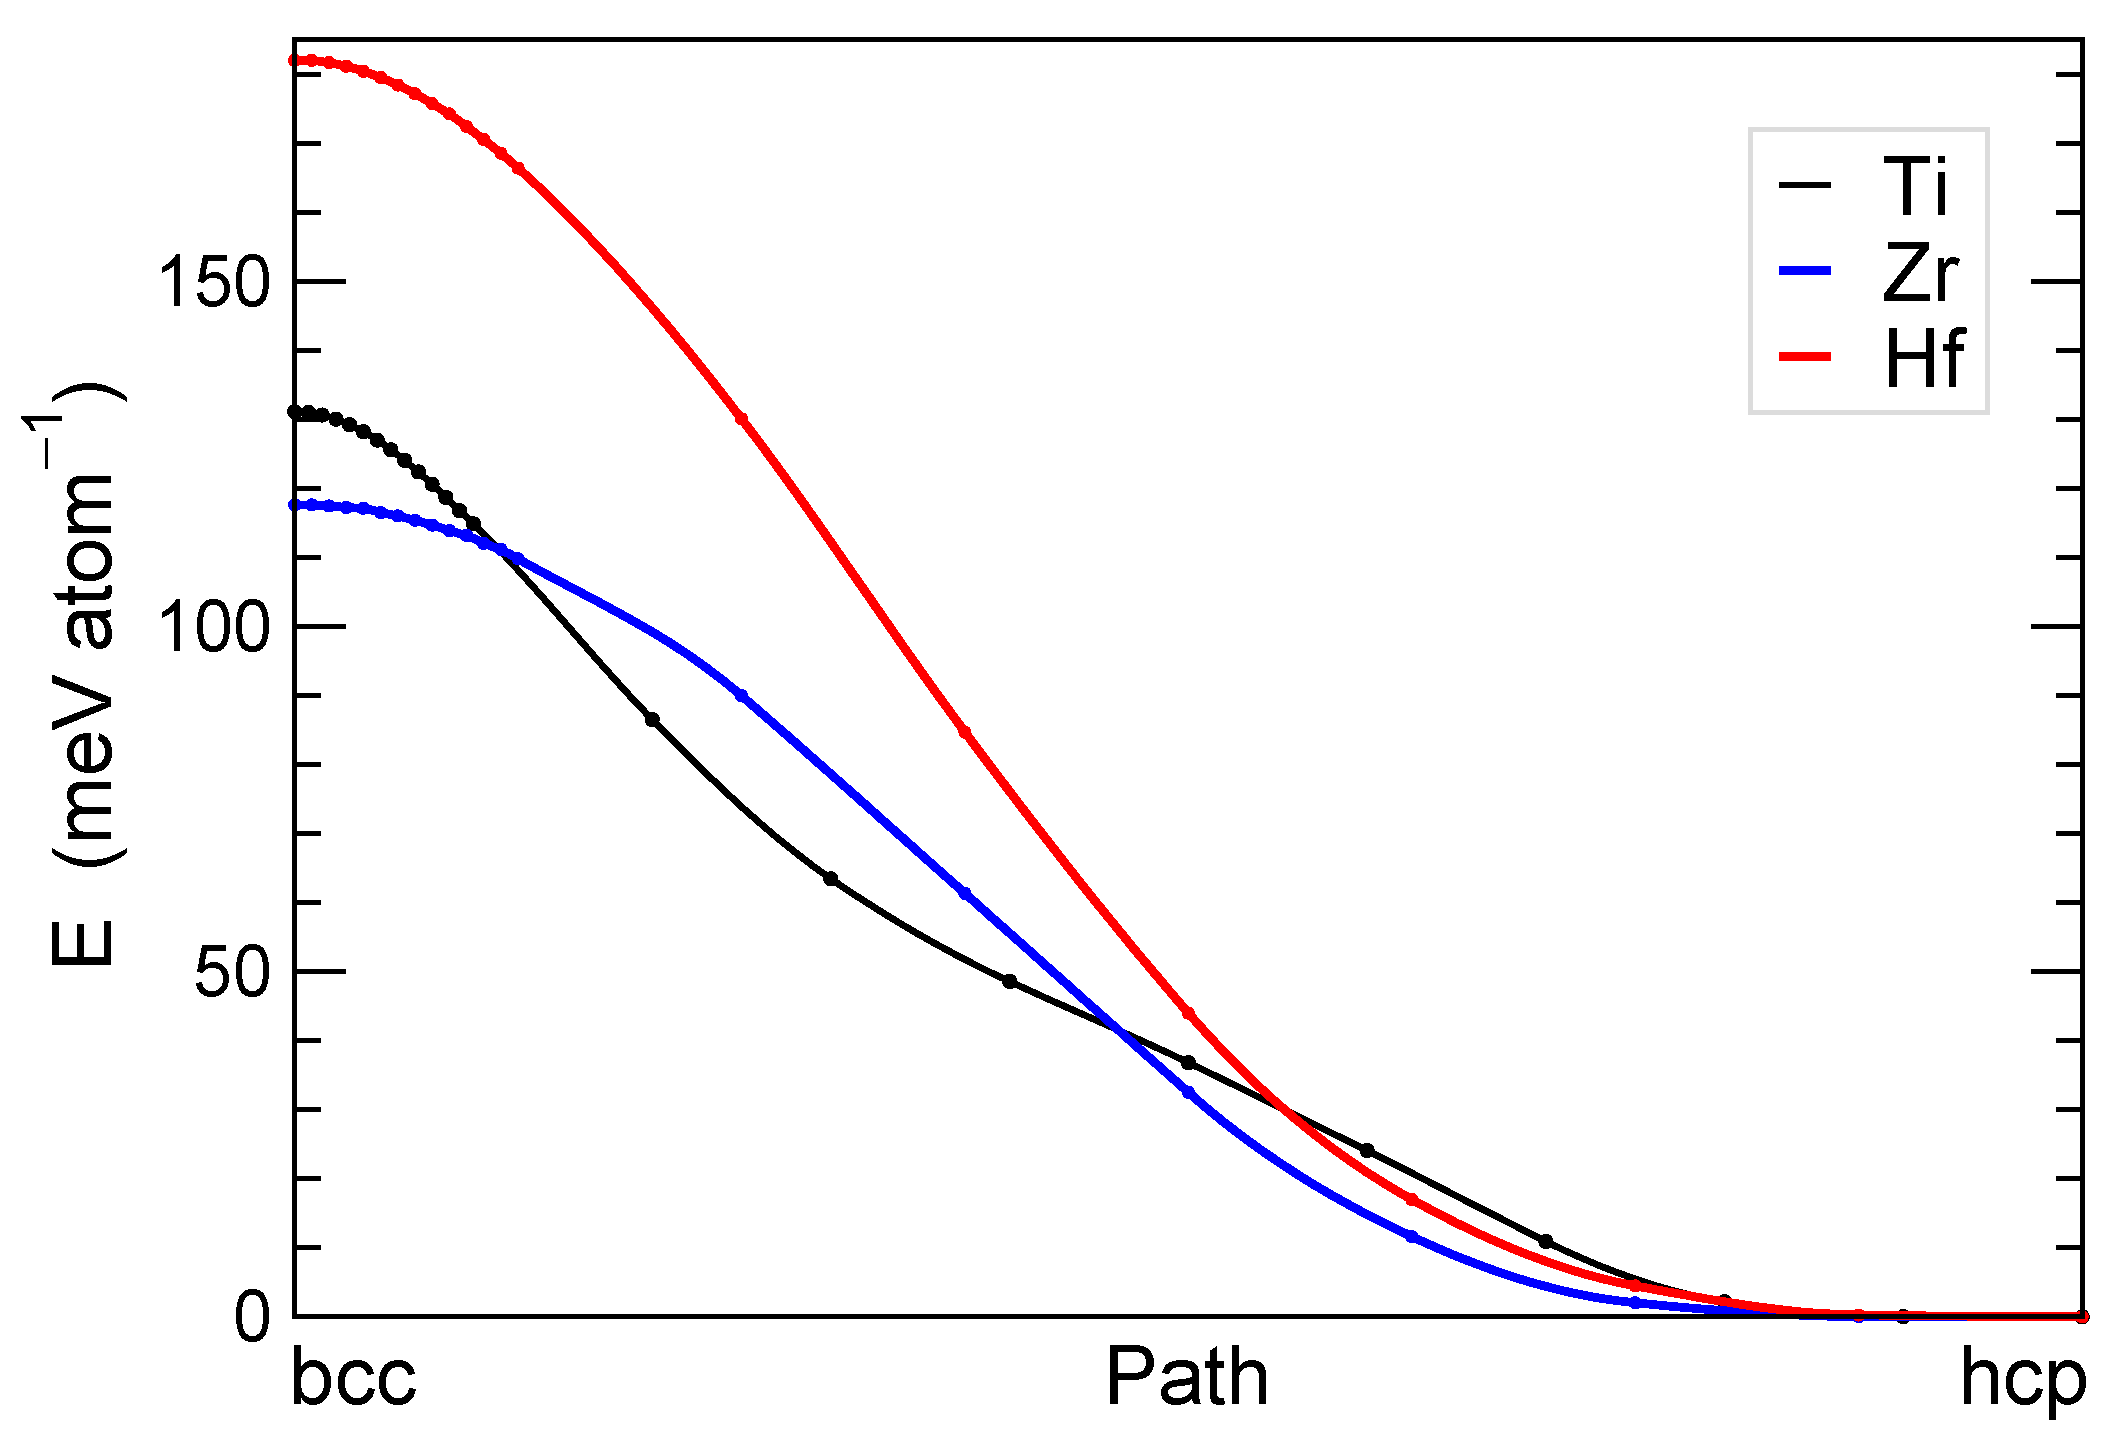
3.2. Group 4 Metals: Ti, Zr, and Hf

As noted, solids with lattice instability are quite common. In particular, the bcc structures of Ti, Zr, and Hf are unstable [2,19,51]. These metals transform from bcc β -phase to hexagonal close-packed (hcp) α -phase upon cooling, and to the ω -phase under pressure [52,53]. Using the modified solid-state NEB method [5], we find that the β α transformations are barrierless for all three metals (Figure 8), in agreement with previous results [51]. For these metals, the ideal bcc structure is a local energy maximum. Its computed energy E L Δ E (bcc−hcp) is 131, 118, and 182 meV/atom for Ti, Zr, and Hf, respectively. As expected from Inequality (1), E L / k B is an overestimate of T c , as E L E l and E l is used in the estimate in Equation (2). Indeed, the computed E L / k B = 1522 , 1365, and 2112 K are larger than measured [54] T c = 1155 , 1136, and 2016 K by the factors of 1.3, 1.2, and 1.05 for Ti, Zr, and Hf, respectively.
In contrast, the finite-displacement method yields stable phonons in bcc Ti, Zr [55], and Hf [56]; similar results were obtained using a self-consistent method with large displacements at elevated T (see Figure 1 in [19], reproduced in [2,57]). From MD results at 1300 K in a 128-atom ( 4 × 4 × 4 ) cubic supercell (incommensurate with the ω -phase), a stable phonon dispersion for bcc Zr was constructed [58]. The high-T bcc phases of Ti, Zr, and Hf with dimpled atomic potentials are dynamically stabilized by entropy.

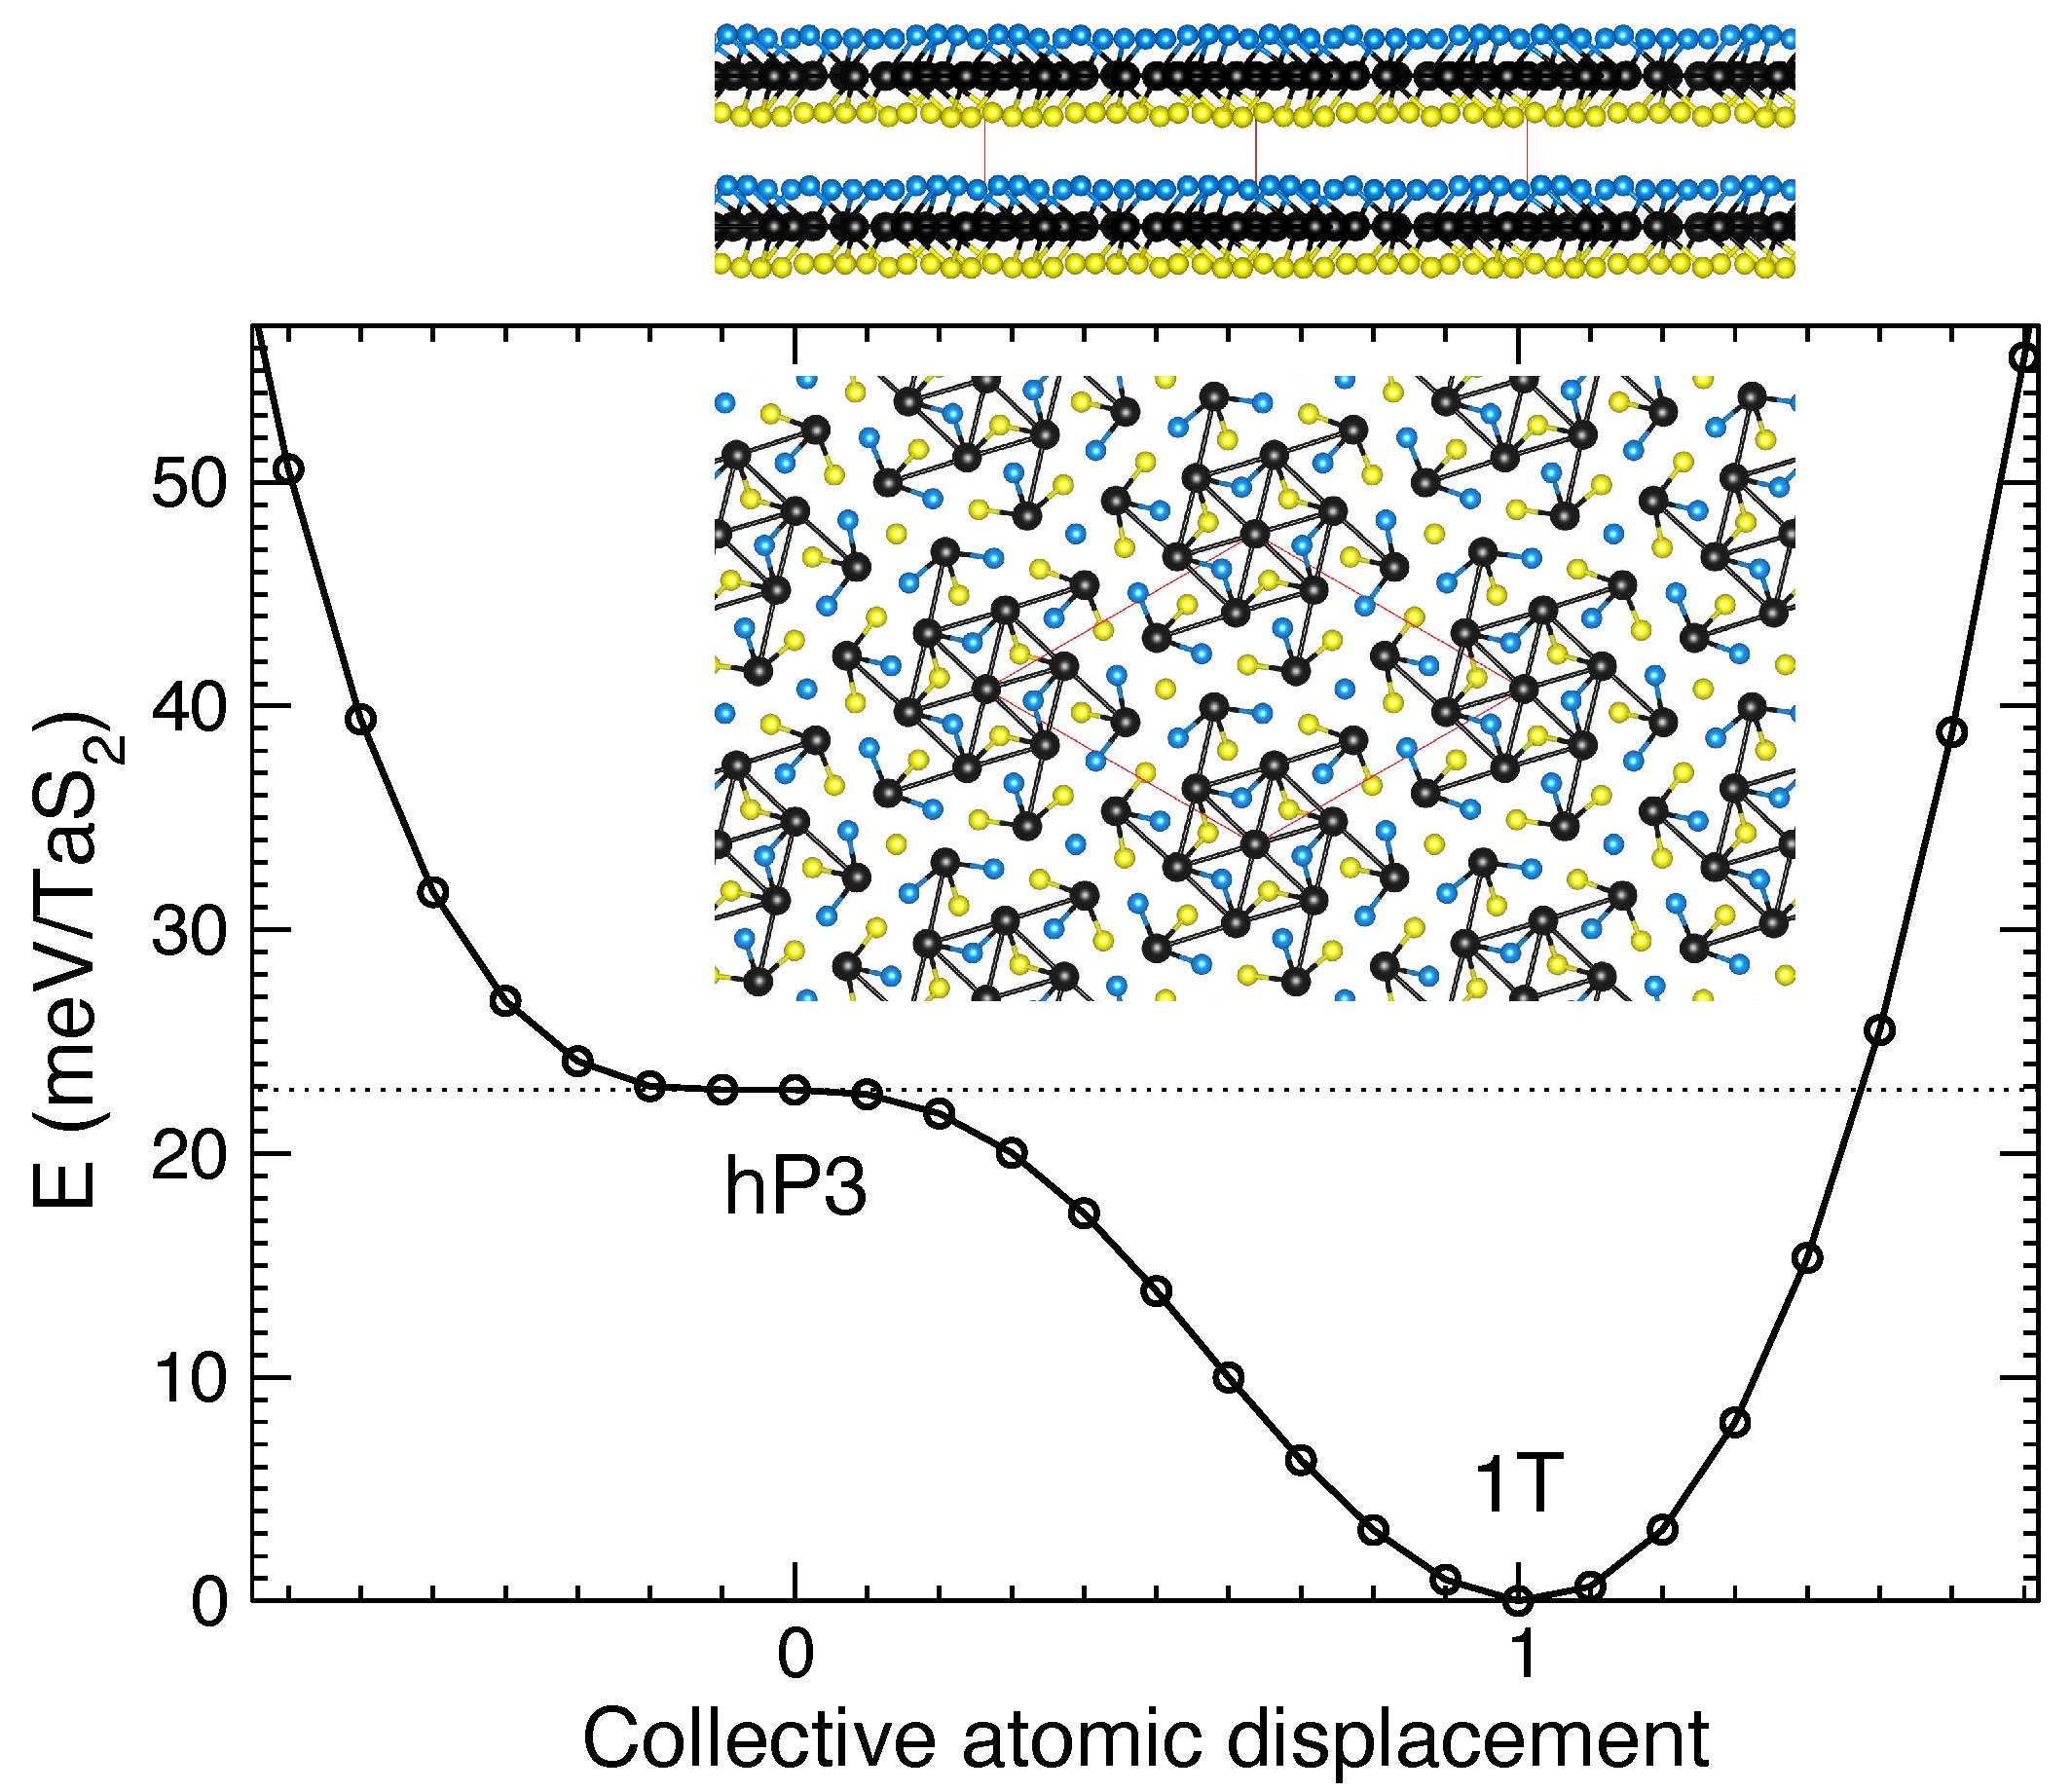
3.3. 1T-TaS2 Layered Crystal

The charge-density wave (CDW) in the 1T-TaS2 layered crystal creates a dimple in the atomic potential and causes a collective atomic displacement resulting in a grouping of 13-atom Ta clusters (inset of Figure 9). As T is lowered, the crystal transforms from the high-symmetry hP3 to the lower-symmetry 1T-TaS2 phase, as observed in bulk and quasi-2D samples [59,60].
Using the generalized solid-state NEB method [4,5,61], we assess the minimal enthalpy path for the enthalpically favorable correlated atomic displacement, see Figure 9. Within each Ta layer, the 1st, 2nd, and 3rd nearest-neighbor (NN) Ta–Ta distances in an ideal hexagonal hP3 structure with fixed lattice constants (a = 3.393 Å, c = 5.892 Å) are 3.3928, 5.8765, and 6.7856 Å, while they change in the 1T cluster to 3.2001, 5.6425, and 7.0137 Å, respectively, as counted from the Ta atom at the center of 3-fold rotational symmetry around (001). Within the cluster, the distances between the central Ta atom and each of its 6 NN Ta are 3.2001 Å, and the distances between the Ta NN themselves are the same. While the 2D cluster has the center of symmetry, it does not have a mirror symmetry, as its tips are distorted, and distances between the 1st and 2nd NN Ta are alternating 3.2746 (shown) and 3.2992 Å (not shown as bonding lines in Figure 9). The distances from the tip Ta atom (with a single bond in Figure 9 inset) to its 6 Ta neighbors (counterclockwise, starting from the shortest) are 3.275, 3.299, 3.523, 3.814, 3.543, and 3.543 Å; the last two are the same due to the 3-fold (001) rotational symmetry around the S atom with 3 NN S–Ta distances of 2.5113 Å.
Formation of a CDW is a result of an electronic instability in a higher-symmetry crystal structure. In general, electronic instabilities can result in dimples in the effective atomic potentials, and TaS2 was but one example.

3.4. Ubiquity

In general, a dynamically polymorphic solid has a higher lattice entropy than a conventional crystal. As entropy is proportional to the logarithm of the number of states, an atomic vibration around a single LPEM has a lower entropy than an atomic motion across multiple LPEMs on a fixed PE surface. Examples of dimpled PE surfaces are characterized in Figure 1b, Figure 2b and Figure 4b; and a multidimensional case was exemplified in Figure 3. For real materials, selected cross sections of PE surfaces are shown in Figure 5, Figure 8 and Figure 9. At a finite T, many solids are stabilized by entropy, and dynamic polymorphism is very common among those high-T solid phases.
Examples of dynamically polymorphic solids include the stabilized-by-entropy high-T phases of bcc Li, Ti, Zr, Hf, B2 AFM FeRh, and B2 NiTi austenite, crystals with a mobile interstitial dopant (including several metal hydrides and boron steels), or polymers and organic molecules with rotating molecular units [62].

4. Summary

Solids with dimpled atomistic potentials are ubiquitous among natural and technological materials. Some have multiple local minima (MLM) on the atomic potential-energy surface. A solid phase with a lattice instability can be stabilized by entropy at sufficiently high temperature. Examples of MLM solids include many anharmonic crystals with lattice instabilities, such as bcc Ti, Zr, Hf, and Li elemental solids [2], B2-type antiferromagnetic FeRh [15], and austenitic NiTi [8,20].
To provide a better understanding of the properties of MLM solids, we considered simplified models and classified the types of atomic motion. MLM solid must have a symmetry-breaking, first-order phase transition; we considered methods to make reliable estimates of the transition temperature (Equations (2) and (3)) and compared T e , describing phase coexistence in thermodynamic equilibrium with the measured hysteresis (Inequality 6).
The high-temperature dynamically polymorphic phase of an MLM solid can be considered an intermediate state of matter between harmonic crystals and amorphous glasses: (1) Its diffraction pattern has the regularity of a crystal, although with broadened Bragg peaks due to large athermal atomic displacements (and sometimes with additional weak spots indicating presence of a more stable superlattice); and (2) Its vibrational spectrum with anharmonic phonons is reminiscent of that of a phonon glass (also, due to atomic motion across multiple LPEMs, its lattice entropy is higher than that of a conventional harmonic crystal). The proper description of vibrations in this phase leads to agreement with neutron-scattering measurements of phonon density of states (for example, see Figure 7), in contrast to the phonons computed for the ideal crystalline state (e.g., B2 NiTi).
Using generalized solid-state nudged elastic-band methods, we computed the minimal-enthalpy paths for symmetry-breaking phase transitions in several MLM solids. We found no barriers for bcc-to-hcp transitions in Ti, Zr, and Hf, nor for hP3-to-1T transition in TaS2 (leading to the observed CDW). Similarly, we found no barriers on the transition pathways from ideal B2 (CsCl-type) to either a global (BCO B33 ground state) or a local energy minimum in NiTi, a well-known shape-memory alloy. For completeness, we discussed vibrations in a dimpled potential and we reviewed the applicability of phonon methods, which can address anharmonic vibrations at a fixed finite temperature (see Equation (4) and Appendix B), if those vibrations behave effectively as “harmonic” at sufficiently high temperatures. Our findings suggest that a possible MLM behavior should be checked as a part of the analysis in any polymorphic solid with competing structures.

Author Contributions

N.A.Z. performed research and wrote the manuscript, see arXiv:1803.03286 (published online 8 March 2018). D.D.J. participated in editing, as well as funding acquisition. All authors have read and agreed to the published version of the manuscript.

Funding

Research was performed at Ames Laboratory and continued at National Aeronautics and Space Administration (NASA). Methods development and applications at Ames Laboratory were supported by the U.S. Department of Energy (DOE), Office of Science, Basic Energy Sciences, Materials Science and Engineering Division. Ames Laboratory is operated for the U.S. DOE by Iowa State University under contract DE-AC02-07CH11358. Computational thermodynamics at NASA is supported by the NASA Transformative Aeronautics Concepts Program, Transformational Tools & Technologies (TTT) Project.

Institutional Review Board Statement

Not applicable.

Informed Consent Statement

Not applicable.

Data Availability Statement

Data is available from the authors upon reasonable request.

Acknowledgments

We thank Vitalij Pecharsky, Viktor Balema, Yaroslav Mudryk, Anis Biswas, Andrey Smirnov, Klaus Ruedenberg, Dario Alfé, Igor Abrikosov, Brent Fultz, Richard M. Martin, Mikhail Mendelev, and John W. Lawson for useful discussions.

Conflicts of Interest

The authors declare that there are no competing interests.

Abbreviations

The following abbreviations are used in this manuscript:
NASANational Aeronautics and Space Administration
DOEU.S. Department of Energy
USAUnited States of America
BCObase-centered orthorhombic
bccbody-centered cubic
hcphexagonal close-packed
CDWcharge-density wave
DOSdensity of states
LPEMlocal potential-energy minimum
MLMmultiple local minima
MDmolecular dynamics
MEPminimal-enthalpy path
NEBnudged elastic band
PEpotential energy
QHAquasiharmonic approximation
Ttemperature

Appendix A. Computational Details

Calculations using density functional theory (DFT) were performed with the plane-wave pseudo-potential-based VASP code [63,64] using a projected augmented wave (PAW) basis [65]. We used the generalized gradient approximation (GGA) [66]. Charge self-consistency convergence was accelerated using a modified Broyden’s method [67]. For the selected structures [68], the total energies and forces were calculated using k-meshes with at least 50 k-points per Å 1 . We used the plane-wave energy (augmentation charge) cutoff of 223.0 (328.9) eV for Ti, 193.3 (243.2) eV for Zr, 275.5 (335.1) eV for Hf, and 337 (544.6) eV for NiTi [8,20].
The group 4 metals (Ti, Zr, Hf) were addressed using DFT + U [69] with ( U J ) = 2.2 eV [70]. The endpoint bcc and hcp structures were fully relaxed.
The solid-state nudged elastic band method [4] with up to two climbing images [5] was combined with DFT [63,64] to address transformations. To obtain B2 to LPEM path in Figure 5, we linearly extrapolated atomic coordinates from an ideal B2 to a representative austenitic structure [20] in the 54-atom supercell, shown in Figure 6c. A linear extrapolation is not necessarily the MEP; thus, there could be a fictitious barrier in Figure 5 if the MEP was twisted [5].
Phonons at finite T were addressed by combining VASP [63,64], ThermoPhonon [46], and Phonopy [71] codes.

Appendix B. Phonon Calculations

Appendix B.1. Small-Displacement Method

Solids easily represented by the quasiharmonic approximation (QHA) can have their local potential energy E expanded by Taylor’s series to the second order in displacements u from the reference crystal structure, where atoms are assumed to be at a stable equilibrium at 0 K (i.e., all atomic forces are zero and the first-derivative terms vanish, while the second derivatives are positive). The QHA is often used to calculate phonons in conventional crystals [18]. The potential energy E is then quantified in terms of the force-constant matrix, D i j α β :
E = E 0 + 1 2 i j , α β u α ( r i ) D i j α β u β ( r j ) + O ( u 3 ) ;
D i j α β = 2 E u α ( r i ) u β ( r j ) .
Terms beyond second-order can be neglected if the amplitudes of all u’s are small: | u | u h , where u h is the harmonic limit (e.g., | x | x H in Figure 4a). The linear response theory [72] provides the matrix (A2) in the limit of infinitesimal u 0 . For slightly anharmonic potentials, the cubic terms are responsible for the thermal expansion [18,73]. The instantaneous atomic forces for the near-equilibrium atomic configuration τ n are
F i α ( τ n ) = β , j D i j α β u β j ( τ n ) .
Here, u α ( r i ) u α i is the component α of an atomic displacement from the original position r i ; F α ( r i ) F i α is the component α of the force acting on an atom at r i due to displacements u β j of the other atoms from the stable equilibrium. At equilibrium, all atomic forces are zero.
Given a sufficient number N of independent atomic configurations τ n ( n = 1 N ) with known atomic displacements u β j and forces F i α , one can solve the system of linear Equation (A3), find the matrix elements D i j , and use them to find the phonon spectrum and density of states (DOS). The minimal number N of independent configurations (and independent Equation (A3)) must equal the number N D of independent components of D i j . The system (A3) might be overdetermined if N > N D . For either well- or over-determined cases (A3), the effective force-constant matrix D i j ( e ) is found by minimizing the sum of the differences between the actual and predicted forces, as done in the ThermoPhonon code [46]:
Δ F n , i | F i ( τ n ) j D i j ( e ) u j ( τ n ) | min .
In the small-displacement method, the expansion around a LPEM is assumed to be harmonic. Within the harmonic limit (for example, at | x | x H in Figure 4a), any displacement u (including infinitesimal) provides the same vibrational frequency.
Interestingly, derivatives (A2) are the same everywhere within a harmonic region, and one finds the same phonon spectrum even if the expansion (A1) is not around the energy minimum and contains a nonzero linear term, which does not affect the second derivatives (A2). Thus, Equation (A3) can be generalized to
F i α ( τ n ) F i α ( τ r ) = β , j D i j α β u β j ( τ n ) u β j ( τ r ) .
Here, τ r is the reference atomic configuration, which may or may not be an exact equilibrium, but must be within the harmonic limit. Equation (A5) allows to consider atomic structures, which are not fully relaxed.
The QHA is straightforward to apply to a crystal with a single LPEM per basin (as in Figure 4a). For a dimpled MLM potential, one can construct expansion (A1) around a LPEM (e.g., at x L in Figure 4b) and use small displacements u x x L to find phonons. The result of the QHA is meaningful, if each displacement from a stable equilibrium at x L is indeed within the harmonic limit at | u | u h , and the potential energy E ( u ) is approximately quadratic at E E h E ( x L ± u h ) .
Each LPEM in a dimpled MLM potential typically has a lower crystal symmetry than the local PE maximum at the center of a basin (e.g., at x = 0 in Figure 4b). As the computational complexity of finding the matrix (A2) is lower at a higher symmetry, it is tempting to consider expansion (A1) around a high-symmetry point. However, the small-displacement method returns unstable phonon modes at an unstable equilibrium (such as the local PE maximum at x = 0 in Figure 4b), while sufficiently large displacements u > x L overlook the phonon instability. In Appendix B.3 and Appendix B.2, we consider finite atomic displacements and relate them to temperature T.

Appendix B.2. Finite-Displacement Method

A relatively fast, albeit approximate, method is an application of the QHA with a finite single-atom displacement u scaled to a “thermal” potential energy E ( u ) = 1 2 k T in an ideal structure, see Equation (4). Notably, we have used this to assess quantitatively caloric response in systems such as FeRh, which exhibits a caloric (ferromagnetic-to-antiferromagnetic) transition at T c = 353  K [16] and has a lattice instability [15]. Lattice instabilities are quite ubiquitous in cubic B2 and bcc systems, e.g., [2,19,51].
If one examines Figure 4, the harmonic potential (top) can be considered as a limit of the double-well potential (bottom) with x L 0 , so that x 0 = x L = 0 and E ( x L ) = E ( 0 ) = 0 . If multiple LPEMs can be interpreted as a negligibly small roughness at the bottom of a nearly harmonic potential (roughly parabolic at x H < x < x H in Figure 4a, with x L 0 in Figure 4b, i.e., x L x H and E L E H ), then one can estimate phonons using the finite-displacement method, which avoids unstable phonons, if F ( x ) / x > 0 . This happens when atomic displacements u ( x 0 ) are larger than the distance between unstable (at x = 0 ) and stable (at x L ) atomic positions, see Figure 4b.
For finite displacements, expansion (A1) can be made around the high-symmetry crystallographic position, which might or might not be a LPEM. If the displacements are sufficiently large (i.e., | u | | x 0 | > x L in Figure 4b), then there are no imaginary frequencies in the calculated phonon spectrum. In contrast, at x L < x < x L , a destabilizing force pushes an atom away from the unstable equilibrium at x = 0 in Figure 4b, resulting in imaginary phonon modes. Because the finite-displacement method with | u | = x T from Equation (4) deliberately avoids the region x L < x < x L , unstable phonons are “overlooked” [19].

Appendix B.3. Phonons at Fixed Temperature

To calculate phonons at a given T, one could use thermal atomic displacements and forces from ab initio molecular dynamics (MD) simulations to generate directly atomic configurations τ ( t ) . The snapshots of thermal atomic motion in MD at finite T are collective atomic displacements. MD sampling gives a set of atomic positions u j ( t n ) and forces F i ( t n ) for a large number N of time steps t n . ThermoPhonon code [46] solves the overdetermined set of Equations (A3) or (A5), and for the chosen reference configuration τ r finds the effective force-constant matrix D i j ( e ) (A4), which is used by the Phonopy [71] code to construct the phonon spectra.
This method is computationally expensive. It works reasonably well at sufficiently high T (if E L k T E B and the reference τ r is the high-symmetry equilibrium), although its result depends on the size of the MD simulation box (e.g., see Figure 3 in [74]). For harmonic vibrations around a single LPEM at low T (at k T < E h E l ), its result is similar to that from the small-displacement method. For anharmonic vibrations, displacements from Equation (4) in Section 2.4 lead to a similar phonon prediction.

References

  1. Zarkevich, N.A. Theoretical and computational methods for accelerated materials discovery. Mod. Phys. Lett. B 2021, 35, 2130003. [Google Scholar] [CrossRef]
  2. Grimvall, G.; Magyari-Köpe, B.; Ozolins, V.; Persson, K. Lattice instabilities in metallic elements. Rev. Mod. Phys. 2012, 84, 945–986. [Google Scholar] [CrossRef] [Green Version]
  3. Jonsson, H.; Mills, G.; Jacobsen, K.W. Nudged Elastic Band Method for Finding Minimum Energy Paths of Transitions. In Classical and Quantum Dynamics in Condensed Phase Simulations; Berne, B.J., Ciccotti, G., Coker, D.F., Eds.; World Scientific: Singapore, 1998. [Google Scholar]
  4. Sheppard, D.; Xiao, P.H.; Chemelewski, W.; Johnson, D.D.; Henkelman, G. A generalized solid-state nudged elastic band method. J. Chem. Phys. 2012, 136, 074103. [Google Scholar] [CrossRef] [PubMed]
  5. Zarkevich, N.A.; Johnson, D.D. Nudged-elastic band method with two climbing images: Finding transition states in complex energy landscapes. J. Chem. Phys. 2015, 142, 024106. [Google Scholar] [CrossRef] [PubMed] [Green Version]
  6. Born, M. On the stability of crystal lattices. I. Math. Proc. Camb. Philos. Soc. 1940, 36, 160–172. [Google Scholar] [CrossRef]
  7. Karplus, M.; Kushick, J.N. Method for estimating the configurational entropy of macromolecules. Macromolecules 1981, 14, 325–332. [Google Scholar] [CrossRef]
  8. Zarkevich, N.A.; Johnson, D.D. Shape-Memory Transformations of NiTi: Minimum-Energy Pathways between Austenite, Martensites, and Kinetically Limited Intermediate States. Phys. Rev. Lett. 2014, 113, 265701. [Google Scholar] [CrossRef] [PubMed]
  9. Zarkevich, N.A.; Chen, H.; Levitas, V.I.; Johnson, D.D. Lattice Instability during Solid-Solid Structural Transformations under a General Applied Stress Tensor: Example of Si I→Si II with Metallization. Phys. Rev. Lett. 2018, 121, 165701. [Google Scholar] [CrossRef] [Green Version]
  10. Frenkel, A.; Stern, E.A.; Voronel, A.; Qian, M.; Newville, M. Buckled crystalline structure of mixed ionic salts. Phys. Rev. Lett. 1993, 71, 3485–3488. [Google Scholar] [CrossRef]
  11. Sluchanko, N.; Bogach, A.; Bolotina, N.; Glushkov, V.; Demishev, S.; Dudka, A.; Krasnorussky, V.; Khrykina, O.; Krasikov, K.; Mironov, V.; et al. Rattling mode and symmetry lowering resulting from the instability of the B12 molecule in LuB12. Phys. Rev. B 2018, 97, 035150. [Google Scholar] [CrossRef] [Green Version]
  12. Haskins, J.B.; Lawson, J.W. Finite temperature properties of NiTi from first principles simulations: Structure, mechanics, and thermodynamics. J. Appl. Phys. 2017, 121, 205103. [Google Scholar] [CrossRef]
  13. Zarkevich, N.A.; Johnson, D.D.; Pecharsky, V.K. High-throughput search for caloric materials: The CaloriCool approach. J. Phys. D Appl. Phys. 2018, 51, 024002. [Google Scholar] [CrossRef] [Green Version]
  14. Zarkevich, N.A.; Zverev, V.I. Viable Materials with a Giant Magnetocaloric Effect. Crystals 2020, 10, 815. [Google Scholar] [CrossRef]
  15. Zarkevich, N.A.; Johnson, D.D. FeRh ground state and martensitic transformation. Phys. Rev. B 2018, 97, 014202. [Google Scholar] [CrossRef] [Green Version]
  16. Zarkevich, N.A.; Johnson, D.D. Reliable thermodynamic estimators for screening caloric materials. J. Alloys Compd. 2019, 802, 712–722. [Google Scholar] [CrossRef] [Green Version]
  17. Fultz, B. Vibrational thermodynamics of materials. Prog. Mater. Sci. 2010, 55, 247–352. [Google Scholar] [CrossRef] [Green Version]
  18. Kittel, C. Introduction to Solid State Physics, 8th ed.; Wiley: Hoboken, NJ, USA, 2004; ISBN 9780471415268. [Google Scholar]
  19. Souvatzis, P.; Eriksson, O.; Katsnelson, M.I.; Rudin, S.P. Entropy Driven Stabilization of Energetically Unstable Crystal Structures Explained from First Principles Theory. Phys. Rev. Lett. 2008, 100, 095901. [Google Scholar] [CrossRef]
  20. Zarkevich, N.A.; Johnson, D.D. Stable atomic structure of NiTi austenite. Phys. Rev. B 2014, 90, 060102. [Google Scholar] [CrossRef] [Green Version]
  21. Smith, T.M.; Zarkevich, N.A.; Egan, A.J.; Stuckner, J.; Gabb, T.P.; Lawson, J.W.; Mills, M.J. Utilizing local phase transformation strengthening for nickel-base superalloys. Commun. Mater. 2021, 2, 106. [Google Scholar] [CrossRef]
  22. Fisher, E.S.; Renken, C.J. Single-Crystal Elastic Moduli and the hcp-bcc Transformation in Ti, Zr, and Hf. Phys. Rev. 1964, 135, A482–A494. [Google Scholar] [CrossRef]
  23. Petry, W. Phonons at martensitic phase transitions of bcc-Ti, bcc-Zr and bcc-Hf. Phase Transit. 1991, 31, 119–136. [Google Scholar] [CrossRef]
  24. Gooding, R.J.; Krumhansl, J.A. Theory of the bcc-to-9R structural phase transformation of Li. Phys. Rev. B 1988, 38, 1695–1704. [Google Scholar] [CrossRef]
  25. Mahan, G.D. Crystal. In Encyclopedia Britannica; Encyclopædia Britannica: Chicago, IL, USA, 2021; (published online 26 July 1999; revised 5 March 2021); Available online: https://www.britannica.com/science/crystal (accessed on 9 December 2021).
  26. Ashcroft, N.W.; Mermin, N.D. Solid State Physics; Saunders College: Philadelphia, PA, USA, 1976. [Google Scholar]
  27. Bragg, W.H.; Bragg, W.L. The Reflection of X-rays by Crystals. Proc. R. Soc. Lond. A 1913, 88, 428–438. [Google Scholar] [CrossRef]
  28. Overhauser, A.W. Crystal Structure of Lithium at 4.2 K. Phys. Rev. Lett. 1984, 53, 64–65. [Google Scholar] [CrossRef]
  29. Petry, W.; Heiming, A.; Trampenau, J.; Alba, M.; Herzig, C.; Schober, H.R.; Vogl, G. Phonon dispersion of the bcc phase of group-IV metals. I. bcc titanium. Phys. Rev. B 1991, 43, 10933–10947. [Google Scholar] [CrossRef]
  30. Prokoshkin, S.; Korotitskiy, A.; Brailovski, V.; Turenne, S.; Khmelevskaya, I.; Trubitsyna, I. On the lattice parameters of phases in binary Ti-Ni shape memory alloys. Acta Mater. 2004, 52, 4479–4492. [Google Scholar] [CrossRef]
  31. Wang, Z.; Chen, J.; Besnard, C.; Kunčická, L.; Kocich, R.; Korsunsky, A.M. In situ neutron diffraction investigation of texture-dependent Shape Memory Effect in a near equiatomic NiTi alloy. Acta Mater. 2021, 202, 135–148. [Google Scholar] [CrossRef]
  32. Moine, P.; Allain, J.; Renker, B. Observation of a soft-phonon mode and a pre-martensitic phase in the intermetallic compound Ti50Ni47Fe3 studied by inelastic neutron scattering. J. Phys. F Met. Phys. 1984, 14, 2517–2523. [Google Scholar] [CrossRef]
  33. Mercier, O.; Melton, K.N.; Gremaud, G.; Hägi, J. Single-crystal elastic constants of the equiatomic NiTi alloy near the martensitic transformation. J. Appl. Phys. 1980, 51, 1833–1834. [Google Scholar] [CrossRef]
  34. Ren, X.; Miura, N.; Zhang, J.; Otsuka, K.; Tanaka, K.; Koiwa, M.; Suzuki, T.; Chumlyakov, Y.; Asai, M. A comparative study of elastic constants of Ti-Ni-based alloys prior to martensitic transformation. Mater. Sci. Eng. A 2001, 312, 196–206. [Google Scholar] [CrossRef]
  35. Sedlák, P.; Janovská, M.; Bodnárová, L.; Heczko, O.; Seiner, H. Softening of Shear Elastic Coefficients in Shape Memory Alloys Near the Martensitic Transition: A Study by Laser-Based Resonant Ultrasound Spectroscopy. Metals 2020, 10, 1383. [Google Scholar] [CrossRef]
  36. Bradley, D. Sound Propagation in Near-Stoichiometric Ti-Ni Alloys. J. Acoust. Soc. Am. 1965, 37, 700–702. [Google Scholar] [CrossRef]
  37. Hasiguti, R.R.; Iwasaki, K. Internal Friction and Related Properties of the TiNi Intermetallic Compound. J. Appl. Phys. 1968, 39, 2182–2186. [Google Scholar] [CrossRef]
  38. Sandrock, G.D. Premartensitic behavior of the electrical resistivity of NiTi. Metall. Mater. Trans. B 1974, 5, 299. [Google Scholar] [CrossRef]
  39. Araki, H.; Matake, N.; Chalermkarnnon, P.; Shirai, Y. Pre-Martensitic Phenomenon in NiTi Studied by Positron Lifetime Spectroscopy. Mater. Sci. Forum 2000, 327–328, 437–440. [Google Scholar] [CrossRef]
  40. Sandrock, G.D.; Perkins, A.J.; Hehemann, R.F. The premartensitic instability in near-equiatomic TiNi. Metall. Trans. 1971, 2, 2769–2781. [Google Scholar] [CrossRef]
  41. Moine, P.; Michal, G.; Sinclair, R. A morphological study of “Premartensitic” effects in TiNi. Acta Metall. 1982, 30, 109–123. [Google Scholar] [CrossRef]
  42. Michal, G.; Moine, P.; Sinclair, R. Characterization of the lattice displacement waves in premartensitic TiNi. Acta Metall. 1982, 30, 125–138. [Google Scholar] [CrossRef]
  43. Haskins, J.B.; Malmir, H.; Honrao, S.J.; Sandoval, L.A.; Lawson, J.W. Low-Temperature Mechanical Instabilities Govern High-Temperature Thermodynamics in the Austenite Phase of Shape Memory Alloy Constituents: Ab Initio Simulations of NiTi, NiZr, NiHf, PdTi, and PtTi. Acta Mater. 2021, 212, 116872. [Google Scholar] [CrossRef]
  44. Bogdanoff, P.D.; Fultz, B. The role of phonons in the thermodynamics of the martensitic transformation in NiTi. Philos. Mag. B 2001, 81, 299. [Google Scholar] [CrossRef]
  45. Ling, H.C.; Roy, K. Stress-Induced Shape Changes and Shape Memory in the R and Martensite Transformations in Equiatomic NiTi. Metall. Trans. A 1981, 12, 2101–2111. [Google Scholar] [CrossRef]
  46. Zarkevich, N.A. ThermoPhonon. 2014. Available online: http://lib.dr.iastate.edu/ameslab_software/2/ (accessed on 9 December 2021).
  47. Lindemann, F.A. Über die Berechnung molekularer Eigen-frequenzen. Phys. Z. 1910, 11, 609–612. [Google Scholar]
  48. Huang, X.Y.; Ackland, G.J.; Rabe, K.M. Crystal structures and shape-memory behaviour of NiTi. Nat. Mater. 2003, 2, 307. [Google Scholar] [CrossRef]
  49. Jardine, A.P.; Ashbee, K.H.G.; Bassett, M.J. Effects of cooling rate on the shape memory effect thermodynamics of NiTi. J. Mater. Sci. 1988, 23, 4273–4281. [Google Scholar] [CrossRef]
  50. Demidova, E.; Belyaev, S.; Resnina, N.; Shelyakov, A. Influence of the holding temperature on the kinetics of the isothermal B2–B19’ transformation in (TiNi)-based shape memory alloy. J. Therm. Anal. Calorim. 2020, 139, 2965–2970. [Google Scholar] [CrossRef]
  51. Persson, K.; Ekman, M.; Ozoliņš, V. Phonon instabilities in bcc Sc, Ti, La, and Hf. Phys. Rev. B 2000, 61, 11221–11224. [Google Scholar] [CrossRef] [Green Version]
  52. Trubitsin, V.Y. Effect of strongly anharmonic longitudinal and transverse vibrations with wave vector k = 2/3(111) on the structural stability of β-Zr under pressure. Phys. Rev. B 2006, 73, 214303. [Google Scholar] [CrossRef]
  53. Zhang, S.; Zhu, Y.; Zhang, X.; Zhang, S.; Qi, L.; Liu, R. First-principles study on the structural stabilities, electronic and elastic properties for zirconium under pressure. Comput. Mater. Sci. 2010, 50, 179–183. [Google Scholar] [CrossRef]
  54. Abriata, J.P.; Bolcich, J.C.; Peretti, H.A. The Hf-Zr (Hafnium-Zirconium) system. J. Phase Equilibria 1982, 3, 29–34. [Google Scholar] [CrossRef]
  55. Saxena, S.K.; Upadhyaya, S.C.; Upadhyaya, J.C.; Shyam, R.; Agrawal, R.M. Phonons in bcc Zr at various temperatures. Solid State Comm. 1996, 99, 519–523. [Google Scholar] [CrossRef]
  56. Antolin, N.; Restrepo, O.D.; Windl, W. Fast free-energy calculations for unstable high-temperature phases. Phys. Rev. B 2012, 86, 054119. [Google Scholar] [CrossRef] [Green Version]
  57. Souvatzis, P.; Eriksson, O.; Katsnelson, M.I.; Rudin, S.P. The self-consistent ab initio lattice dynamical method. Comput. Mater. Sci. 2009, 44, 888. [Google Scholar] [CrossRef]
  58. Hellman, O.; Abrikosov, I.A.; Simak, S.I. Lattice dynamics of anharmonic solids from first principles. Phys. Rev. B 2011, 84, 180301. [Google Scholar] [CrossRef] [Green Version]
  59. Scruby, C.B.; Williams, P.M.; Parry, G.S. The role of charge density waves in structural transformations of 1T TaS2. Philos. Mag. J. Theor. Exp. Appl. Phys. 1975, 31, 255–274. [Google Scholar] [CrossRef]
  60. Law, K.T.; Lee, P.A. 1T-TaS2 as a quantum spin liquid. Proc. Natl. Acad. Sci. USA 2017, 114, 6996–7000. [Google Scholar] [CrossRef] [Green Version]
  61. Zarkevich, N.A. Double Climbing Image Nudge Elastic Band Method, 1st ed.; 2014; Available online: http://lib.dr.iastate.edu/ameslab_software/1/ (accessed on 9 December 2021).
  62. Zarkevich, N.A.; Johnson, D.D. Predicting Enthalpies of Molecular Substances: Application to LiBH4. Phys. Rev. Lett. 2008, 100, 040602. [Google Scholar] [CrossRef]
  63. Kresse, G.; Hafner, J. Ab initio molecular dynamics for liquid metals. Phys. Rev. B 1993, 47, 558–561. [Google Scholar] [CrossRef]
  64. Kresse, G.; Hafner, J. Ab initio molecular-dynamics simulation of the liquid-metal–amorphous-semiconductor transition in germanium. Phys. Rev. B 1994, 49, 14251–14269. [Google Scholar] [CrossRef]
  65. Blöchl, P.E. Projector augmented-wave method. Phys. Rev. B 1994, 50, 17953–17979. [Google Scholar] [CrossRef] [Green Version]
  66. Perdew, J.P. Generalized gradient approximation for the fermion kinetic energy as a functional of the density. Phys. Lett. A 1992, 165, 79. [Google Scholar] [CrossRef]
  67. Johnson, D.D. Modified Broyden’s method for accelerating convergence in self-consistent calculations. Phys. Rev. B 1988, 38, 12807–12813. [Google Scholar] [CrossRef]
  68. Zarkevich, N.A. Structural Database for Reducing Cost in Materials Design and Complexity of Multiscale Computations. Complexity 2006, 11, 36–42. [Google Scholar] [CrossRef]
  69. Dudarev, S.L.; Botton, G.A.; Savrasov, S.Y.; Humphreys, C.J.; Sutton, A.P. Electron-energy-loss spectra and the structural stability of nickel oxide: An LSDA+U study. Phys. Rev. B 1998, 57, 1505–1509. [Google Scholar] [CrossRef]
  70. Zarkevich, N.A.; Johnson, D.D. Titanium α-ω phase transformation pathway and a predicted metastable structure. Phys. Rev. B 2016, 93, 020104(R). [Google Scholar] [CrossRef] [Green Version]
  71. Togo, A.; Oba, F.; Tanaka, I. First-principles calculations of the ferroelastic transition between rutile-type and CaCl2-type SiO2 at high pressures. Phys. Rev. B 2008, 78, 134106. [Google Scholar] [CrossRef] [Green Version]
  72. Savrasov, S.Y. Linear-response theory and lattice dynamics: A muffin-tin-orbital approach. Phys. Rev. B 1996, 54, 16470–16486. [Google Scholar] [CrossRef] [Green Version]
  73. Zarkevich, N.A.; Majzoub, E.H.; Johnson, D.D. Anisotropic thermal expansion in molecular solids: Theory and experiment on LiBH4. Phys. Rev. B 2014, 89, 134308. [Google Scholar] [CrossRef] [Green Version]
  74. Haskins, J.B.; Thompson, A.E.; Lawson, J.W. Ab initio simulations of phase stability and martensitic transitions in NiTi. Phys. Rev. B 2016, 94, 214110. [Google Scholar] [CrossRef] [Green Version]
Figure 1. (color online) Schematic 1D potentials with an average lattice constant a and barriers E B for (a) harmonic PE (parabolic below E H ), (b) dimpled case with 2 local minima per basin (here, E l E L ), where at k T < E L , each atom (filled circle) is displaced (arrow) from the high-symmetry unstable position (open circle), and (c) glass-like amorphous case.
Crystals 12 00084 g001
Figure 8. (color online) Minimal-enthalpy path from bcc to hcp has no barrier in Ti, Zr, and Hf metals.
Crystals 12 00084 g008
Figure 9. (color online) Enthalpy versus collective atomic displacement in TaS2 for the linear path between high-symmetry hP3 (at 0) and lower-symmetry 1T (at 1) phases and its continuation. Insets: Relaxed bulk 1T-TaS2 in 110 (upper) and 001 (lower) projections. S (blue and yellow) is above and below the Ta (black) layer. Bonds shown are Ta–Ta (Ta–S) shorter than 3.28 Å (2.50 Å). The 13(TaS2) hexagonal supercell (thin red lines) with fixed a = 12.233 Å and c = 5.892 Å is composed of 13 hP3 primitive cells (a = 3.393 Å, c = 5.892 Å); internal atomic relaxation was at fixed supercell lattice constants.
Crystals 12 00084 g009
Publisher’s Note: MDPI stays neutral with regard to jurisdictional claims in published maps and institutional affiliations.

