Article

Neutronographic Analysis of Load Partitioning and Micro Residual Stress Development in Duplex Stainless Steels

1
Institute for Applied Materials, Karlsruhe Institute of Technology, D-76131 Karlsruhe, Germany
2
Institut Laue-Langevin, CEDEX 9, 38042 Grenoble, France
3
Heinz Maier-Leibnitz Zentrum (MLZ), TU München, D-85748 Garching, Germany
*
Author to whom correspondence should be addressed.
Crystals 2022, 12(10), 1378; https://doi.org/10.3390/cryst12101378
Submission received: 8 September 2022 / Revised: 18 September 2022 / Accepted: 21 September 2022 / Published: 28 September 2022
(This article belongs to the Section Materials for Energy Applications)

Abstract

:
In the present work, neutronographic in situ diffraction stress analyses during uniaxial loading and subsequent unloading were carried out on the two duplex stainless steels X2CrNiMoN22-5-3 and X3CrNiMoN27-5-2 with nominal phase fractions for ferrite:austenite of 50:50% and 70:30%, respectively. In addition to the different phase fractions, the two steels also differed in their phase-specific crystallographic texture. The load-partitioning behaviour and the phase-specific micro (residual) stress evolution for total strains up to about 9% were investigated. The results indicated that for both materials under load, the phase-specific stress in the ferrite phase was significantly higher than in the austenite phase, while no texture development through the plastic deformation could be observed.

1. Introduction

Duplex stainless steels are becoming increasingly popular as construction materials in mechanical and plant engineering, as they combine the advantages of austenitic stainless steels and ferritic steels. Duplex stainless steels generally have good mechanical properties that are expressed in their high strength in combination with good ductility. In addition, duplex stainless steels often have better corrosion resistance than conventional austenitic steels [1,2,3]. Therefore, duplex stainless steels are particularly used in the chemical industry, petrochemistry, seawater desalination plants, and offshore technology [4,5].
Regarding design and dimensioning with duplex stainless steels, the knowledge of the macroscopic hardening behaviour and the phase-specific behaviour are of high importance. This applies in particular to numerical simulations of the deformation behaviour of duplex stainless steel sheets and in the development of phase-specific residual stresses (e.g., [6,7]). A viable and reliable approach to determine the phase-specific work hardening characteristic of multi-phase materials is to conduct diffraction experiments; i.e., by using X-ray or neutron radiation. Therefore, neutronographic stress analysis is particularly suited, since the phase-specific stress development inside massive samples can be followed in situ. Based on the phase-specific stresses, the macro stress can be calculated using a simple rule of mixture if the phase fractions are known. The difference between this macro stress and the phase-specific stresses are the phase-specific micro stresses; or in the unload state, the phase-specific micro residual stresses.
Regarding diffraction analyses on the load-partitioning behaviour of duplex stainless steels, numerous works have already been published (e.g., [8,9,10,11,12,13]). In particular, investigations of the X2CrNiN23-4 duplex steel with the same nominal phase content of 50:50, which was one of the duplex stainless steels studied within this work, have shown that the austenite phase exhibited significantly higher phase-specific stresses than the ferrite phase and that the load transfer changed depending on the texture orientation [9]. For the X2CrNiMoN25-7-4 duplex stainless steel, it was shown that both phases transferred almost the same phase-specific stress. The load carried by the ferrite phase was only minimally higher [8]. For the X2CrNiMoN22-5-3 duplex stainless steel, which was also investigated in the present work, a slightly higher phase-specific stress was transferred by the austenite phase [10]. Furthermore, in a cyclic load test, it was found that the harder phase transfers more load, while in the case of cyclic softening or hardening, the load distribution between the two phases also changes [14]. Hence, it can be summarised that even with almost identical phase contents but different appearances of the micro-structure and with divergences in the phase-specific crystallographic texture, there exist remarkable differences in the load partitioning behavior and in the underlying micro-mechanical characteristic and hence also for the resulting macro-mechanical behaviour. Therefore it is clearly apparent that generalisation regarding the phase-specific behavior across different duplex steels is not applicable.
Regarding the discussion of stress results determined by means of diffraction methods, elastic and plastic anisotropy effects are of particular interest; these depend inter alia on the coupling of crystallites in the polycrystal and on the phase-specific crystallographic texture. Based on load-stress experiments, some lattice planes were identified in literature as being less susceptible to this elastic and plastic anisotropy. For fcc materials, the {111}, {311}, and {220} lattice planes are recommended for diffraction stress analysis studies [15,16,17]. In contrast, for bcc materials, the {110} and {211} lattice planes are recommended [15,18]. Nevertheless, in the context of coarse multi-phase materials such as the duplex stainless steels that are the focus of the present work, it should be noted that the anisotropy effect is strongly related to texture or texture evolution. In previous investigations on duplex steels [19,20], it was evident that apart from phase-specific crystallographic texture, intergranular strains [21] contribute to a partly non-linear behaviour of {hkl}-dependent lattice strains vs. the applied load. In the present work, the load-partitioning behaviour for the two chosen duplex stainless steels, which clearly differ in their phase fractions, will be studied systematically while taking into account the phase-specific crystallographic texture.
In addition, neutronographic stress analysis will be applied to study the effect of the degree of plastic deformation on the development of phase-specific micro residual stresses and on the impact of these micro residual stresses on the value of the reference lattice spacing d 0 . The latter one is essential for the determination of the {hkl}-lattice strains and thus on the stress/residual stress calculation. In the literature, numerous methods for determining this reference value for stress- or strain-free materials state have been discussed [15,22,23,24]. The most common approach is to measure a supposedly stress-free sample volume and to use this value as a reference. An alternative approach is to take a small sample; e.g., a small cube or a small pin, from which it is assumed that the residual stresses are sufficiently relaxed by the sectioning. The selected size of the reference sample is of course also directly dependent on the used gauge volume. Typical gauge volumes for neutronographic stress analysis are in the range of ≥1 × 1 × 1 mm3 and the size of the reference samples is about several millimetres [15,25,26]. However, for coarse multi-phase materials such as duplex stainless steels, it is unclear if the phase-specific micro residual stresses can relax through the sectioning and how the remaining micro residual stresses—which contribute to a shift of the diffraction line—will affect the proper choice of the reference value for stress analysis. It is often assumed for single-phase materials that the residual stress integrated over the total reference sample volume is zero. This need not be the case for coarse multi-phase materials, since phase-specific residual stresses can already be introduced during manufacturing due to the difference in the phase-specific characteristics; e.g., the coefficients of thermal expansion (CTE) or the stiffness of the phases. It is expected that existing phase-specific residual micro-stresses of the II kind must be considered in this regard [27]. It is questionable to what extent these phase-specific micro-stresses are released during free cutting [28] and how they are to be assessed in the context of neutronographic (residual) stress analysis. In the present work, the load-partitioning behaviour and the effect of phase-specific micro residual stresses on the appropriate choice of the reference value d0 was systematically investigated for two duplex stainless steels that clearly differed in their phase fractions and in the phase-specific crystallographic texture. The X2CrNiMoN22-5-3 and X3CrNiMoN27-5-2 duplex stainless steels were chosen with nominal phase fractions for ferrite:austenite of 50:50% and 70:30%, respectively. Neutronographic in situ diffraction analysis during loading and unloading were carried out with stepwise increases in the elasto-plastic loading up to total strains of about 9%. These elaborate investigations were supplemented by extensive laboratory analyses of the crystallographic texture, the initial residual stress state, and the micro-structure, including EBSD investigations.

2. Materials and Methods

2.1. Basic Characterization of the Two Duplex Steels

The experimental studies were carried out on two different duplex stainless steels. The X2CrNiMoN22-5-3 duplex steel (material number: 1.4462) has a nominal phase fraction of 50% ferrite and 50% austenite. The X3CrNiMoN27-5-2 duplex steel (material number: 1.4460) has a ferrite content of 70% and an austenite content of 30%, respectively. The macroscopic yield strength of 1.4462 is 667 MPa and of 1.4460 is 545 MPa. The original material was a rod-shaped, semi-finished product with a diameter of 30 mm. For the investigation of the metallographic microstructure, residual stresses, and texture, samples from the same batch also were used in the neutronographic in situ load tests. The nominal chemical compositions are given in Table 1. Micrographs for the initial condition are shown in Figure 1. For these images, both materials were metallographically prepared and etched with Beraha II etchant. The mean sizes of the ferrite phase regions (Beraha II is not sensitive to grain boundaries) were 13 µm (longitudinal direction) and 5 µm (radial direction), respectively, for the 1.4462 duplex steel. For the austenite phase, these dimensions were about 22 µm and 5 µm, respectively. In the 1.4460 duplex stainless steel, the corresponding values for the ferrite phase were 16 µm and 9 µm, respectively; and for the austenite phase, 17 µm and 6 µm, respectively. The metallographically determined phase content of ferrite was 53 ± 3 % (γ-Fe: 48 ± 3%) for the 1.4462 duplex steel and 64 ± 3% (γ-Fe: 33 ± 4%) for the 1.4460 steel. These measured phase contents confirmed the nominal phase contents given by the supplier within the scope of the evaluation accuracy. In the further course of the work, the nominal phase contents were therefore always used.
In the initial state, both materials were textured; this initial texture was determined on cross sections through the material prior to the neutronographic diffraction stress analysis by means of an X-ray texture analysis using a Seifert PTS 3000 4-circle diffractometer (Rich. Seifert & Co, Ahrensburg, Germany) and Ni-filtered Co-Kα radiation. A pinhole collimator on the primary side with a nominal aperture of ø 1 mm was used in combination with a 0.8° slit on the secondary side. For the ferrite phase, the four independent lattice planes of {110}, {200}, {211}, and {220} were analysed; for the austenite phase, {111}, {200}, {220}, {222}, and {311} were chosen. In all cases, incomplete pole figures (PFs) were recorded up to sample tilts of 70°. From these incomplete pole figures for both phases, the orientation distribution function (ODF) was calculated using the MATLAB toolbox MTEX [31]. The phase-specific textures in the initial state are represented in Figure 2 by pole figures that were recalculated from the ODFs. The present pole figures in Figure 2 were typical for phase-specific textures for ferrite and austenite, as they occurred for rod-shaped, semi-finished products of the duplex steels. A detailed description is given in the Results section.
At this point, however, only this much was known about the pole figures shown in Figure 2: assuming that in the later uniaxial tensile tests the highest shear stress occurred at an orientation of about 45° with respect to the normal axis, it was reasonable to consider the intensity distributions of the pole figures in this region. Based on Figure 2, for the ferrite phase of the 1.4462 steel, it was expected that the {112}<111>-slip system should tend to become active at R.T. compared to the {110}<111>-slip system. In the austenite phase, there was only one possibility, and that was the {111}<110> slip system. In the 1.4460 duplex steel, on the other hand, the {110}<111>- rather than the {112}<111>-slip system should be active. In both duplex steels, the {123}<111>-slip system should not become active. Moreover, the predictions made earlier would be valid only if the critical shear stresses of the two ferrite-slip systems were comparable, which should be the case according to [32].
In addition, metallographically prepared longitudinal sections (ground and vibro-polished) were examined for the 1.4462 duplex stainless steel by means of an EBSD (Zeiss Auriga 60, detector: EDAX DigiView 5 EBSD camera, data collection: EDAX APEX (V2.2), analysis: OIM Analysis-8)(AMETEK GmbH - EDAX Division, Wiesbaden, Germany). The MATLAB toolbox MTEX [31] was used for the evaluation, including the Taylor factor calculations and graphical representations. The Taylor factor M is a geometric factor. The calculation using MTEX takes into account the grain orientation, the strain tensor corresponding to an applied load, and the possible slip systems. It is part of the Taylor theory and is used in the description of polycrystalline plasticity [33]. The Taylor factor is used to calculate the influence of different strengthening mechanisms affecting the critical shear stress τ on the yield stress according to M = σ / τ and is described in detail in [33]. For the analysis of the EBSD data with regard to their Taylor factors, all theoretically possible slip systems in the respective phases were considered.
Figure 3 shows that the Taylor factor tended to be higher in austenite than in ferrite. In the face-centred-cubic (fcc) austenite phase, only the slip system <111>{110} was considered. In the body-centred-cubic (bcc) ferrite phase, three different slip systems could theoretically be active. When these three slip systems were considered separately, we found that the {112}<111> tended to have the highest average Taylor factor. For the analysis in MTEX, it was necessary to specify a load direction. For the evaluation, a virtual strain tensor of 1% in the load direction was imposed in MTEX. Based on the metallographic studies, there was no evidence of twinning for the austenite phase of both duplex stainless steels
For the initial sample condition, X-ray RS analyses were performed using the sin2ψ-method [27]. To avoid influences due to the manufacturing process, a layer with a thickness of about 200 µm for each of the samples was electrochemically removed prior to the surface-sensitive X-ray diffraction analysis. For these analyses, vanadium-filtered CrKα-radiation was applied and a 3-circle diffractometer in ψ-geometry was used. For the primary aperture, a pinhole collimator with a nominal diameter of 0.4° was applied. On the secondary side, a 2 mm slit was installed in front of the scintillation counter. For the ferrite phase, the {211} lattice planes were examined, and for austenite, the {220} lattice planes were considered. A total of 21 sample tilts in the range of −60° ≤ ψ ≤ 60° equidistantly distributed in sin2ψ, were used. After background subtraction, the interference lines were fitted using Pearson VII functions. Kα2 stripping was performed by means of a double peak fitting. For the residual stress evaluation, the diffraction elastic constants (DEC) E 211 = 219,911 MPa [34] and v 211 = 0.28 [34] were applied for the ferrite phase and E 311 = 177,329 MPa [35] and v = 0.341 [35] were applied for the austenite phase. In the initial state of the duplex stainless steel 1.4462, residual stresses of −51 ± 15 MPa were determined for the ferrite phase and 242 ± 40 MPa for the austenite phase. For the 1.4460 duplex stainless steel, the initial residual stresses were 1 ± 55 MPa (ferrite phase) and 240 ± 60 MPa (austenite phase), respectively.

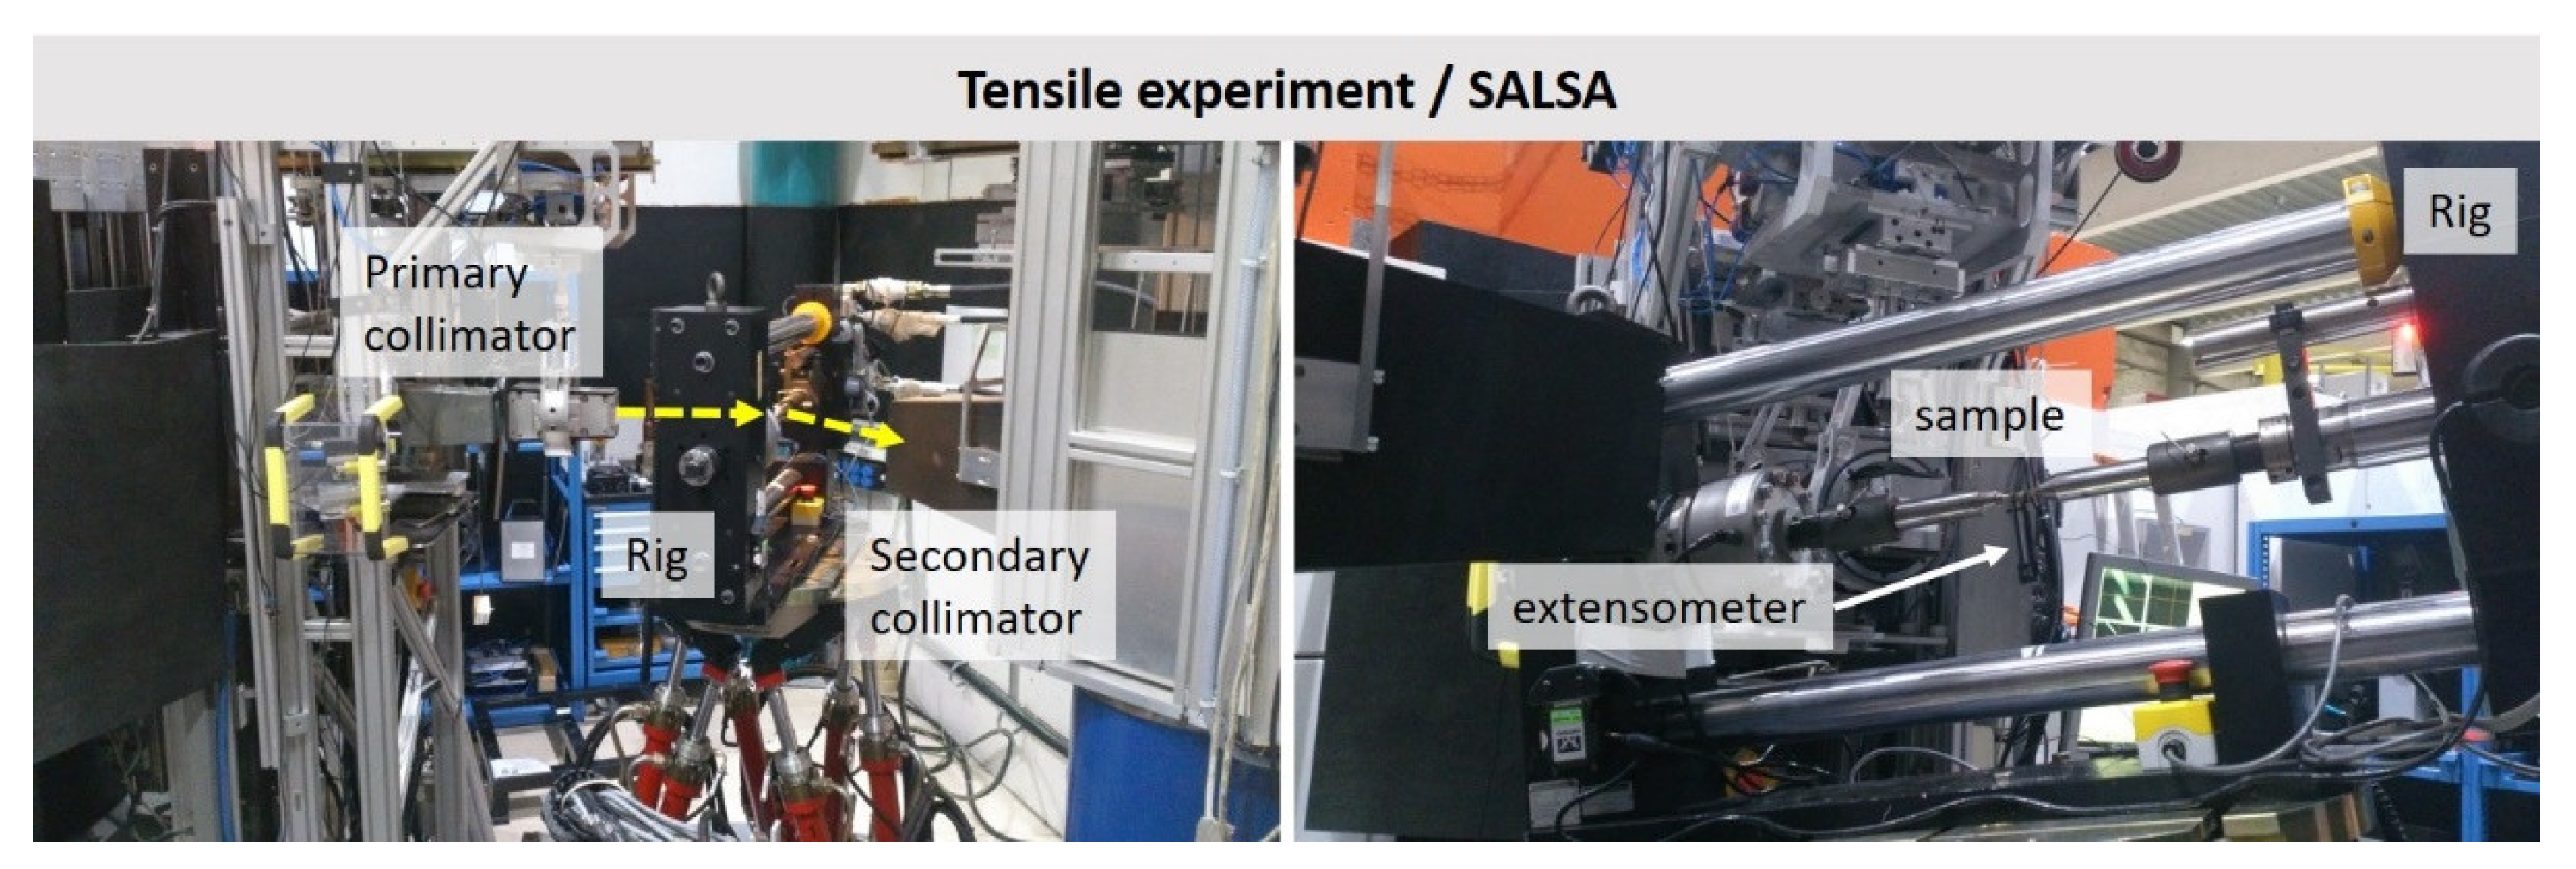
2.2. Neutronographic In Situ Load–Unload Test

The neutronographic in situ stress analyses during uniaxial elasto-plastic loading [36] were carried out using the SALSA instrument [26] at the European research reactor of the Institute Laue-Langevin (ILL) in Grenoble/France using a wavelength of 1.62 Å. For the ferrite phase, the lattice planes {200}, {211}, and {220} were investigated; for the austenite phase, the {220}, {311} and {222} lattice planes were analysed using a nominal gauge volume of about 2 × 2 × 2 mm3. The loading experiments were carried out using the 50 kN INSTRON tensile rig available at the SALSA experiment. The lattice strains in the longitudinal and radial directions were determined in separate experiments. The cylindrical samples with dimension of ∅ 6 × 30 mm (a sketch of the sample geometry is provided in Figure 4) in the measuring length were identically oriented with respect to the crystallographic texture. The general experimental set-up of the in situ diffraction analysis during loading at SALSA is shown in Figure 5.
Interrupted tensile tests were performed at room temperature and under strain control, while during the holding steps, the control was changed to position control. All investigated lattice planes of one direction (longitudinal or radial) were analysed on the same sample in an incremental load-increase experiment; i.e., diffraction analyses were performed for individual holding steps after the targeted loads were set. Furthermore, at total strains of 2, 5, 7, and 9%, the samples were unloaded to a nominal load of only 5 MPa to determine the development of the phase-specific micro residual stresses. Prior to diffraction analysis for each loading/unloading step, a relaxation time of 10 min was considered to ensure that the neutronographic stress analyses were carried out for a sufficiently stationary load level.
Figure 6 shows the stress–strain curves of the interrupted tests with the relaxation steps and entire unloading steps. For comparison, the stress–strain curves of the material using standardised tensile tests are also shown. These continuous tensile tests (indicated as laboratory) were carried out on a conventional universal testing machine using a crosshead velocity of 0.001 mm/s. The longitudinal strain was determined with an external extensometer.
The measured {hkl} interference lines for both phases were fitted using a Gaussian function by means of the evaluation software LAMP [37]. A separate and individual background function (intensity above 2θ) was created for each {hkl} diffraction line. The lattice strain was calculated according to [27]:
ε h k l = d h k l d 0 h k l d 0 h k l
where d 0 h k l describes the lattice plane distance in the stress-free material state. In general, various d 0 h k l strategies were proposed in the literature to evaluate the load stress experiment. According to [22], we assumed that the approach of using the lattice plane distances from the phase initial state of the tensile samples as a reference for the lattice strain calculation was the most suitable. Hence, using this approach, lattice strains were calculated with reference to the initial material state.
The {hkl}- and phase-specific stress of the phase p was calculated according to [15] following:
σ i j h k l , p = E h k l , p 1 υ h k l , p ε i j h k l , p + υ h k l , p 1 2 υ h k l , p ε 11 h k l , p + ε 22 h k l , p + ε 33 h k l , p
where the index ij identifies the current calculated direction; ε 11 h k l corresponds to the load direction and ε 22 h k l = ε 33 h k l to the radial direction of the cylindrical sample. E h k l , p corresponds to the phase- and lattice plane-specific Young’s modulus and υ h k l , p is the respective {hkl}- and phase-dependent Poisson’s ratio. The considered values are listed in Table 2 [34,35]. In addition to the {hkl}- and phase-specific stresses, a ‘global’ phase-specific stress could be calculated. To calculate the phase-specific stress, the measured {hkl}- and phase-specific strains were averaged ( ε ¯ i j   p ) according to [38]. This calculation was carried out while taking into account the texture and the multiplicity of the reflection. The calculation of the phase-specific stresses was similar to Equation (2) as follows and used the phase-specific Young’s modulus and respective Poisson’s ratio:
σ i j p = E p 1 υ p ε ¯ i j   p + υ p 1 2 υ p ε ¯ 11   p + ε ¯ 22   p + ε ¯ 33   p
The macro stresses for both materials were calculated using a “rule of mixture” [27] as:
σ m a c r o = σ α R S   ϑ α + σ γ R S   ϑ γ
In this equation, σ m a c r o is the macroscopic stress, ϑ α / γ is the assumed phase content, and σ α / γ R S is the phase-specific stress. For error calculation, the original fitting error in determining the line positions of the considered lattice planes was also included in the calculated strain and stress values. In this regard, the relevant rules of error propagation were used for this purpose.

3. Results

Figure 7 shows the textures of the two materials after unloading for different degrees of plastic pre-deformation. In the present case, only the results for 0%, 2%, and 9% total strain are shown. The upper two rows show the ODF sections at φ 2   = 45° for the 1.4462 steel and the lower two rows for the 1.4460 steel, respectively. In the 1.4462 duplex stainless steel with a micro-structure with a ferrite:austenite ratio of 50:50, a different texture for both phases was determined. The austenite phase showed a pronounced Θ-fibre in combination with a broad γ-fibre. In the ferrite phase, on the other hand, only brass and Goss orientations, as well as their rotated equivalents, were present. These smeared into a single Goss-brass-belt in the shown φ 2   = 45° section. For the austenite phase in the 1.4460 steel, a distinct cubic orientation component was determined as well as a slight gamma fibre. In the ferrite phase, only a cubic component was determined.
The following section addresses the strain results based on the in situ measurements for the austenite phase as plotted against the applied relaxed load stress in both materials. These distributions are shown in Figure 8; the upper line is for the 1.4462 duplex stainless steel and the lower row is for the 1.4460 steel. In both cases, the measured macroscopic yield strength is additionally marked; it was approx. 667 MPa for the 1.4462 steel and about 545 MPa for the 1.4460 steel, respectively. The expected curve based on the {hkl}-specific Young’s modulus and the {hkl}-specific Poisson’s ratio is plotted in blue. The respective {hkl}-specific values shown in Table 2 were based on [34,35].
For the {220} planes in the longitudinal direction, no evaluable diffraction lines could be measured in the 1.4462 duplex stainless steel due to the present phase-specific texture. For the transverse direction, a linear progression of the lattice strain vs. the applied load partitioning could be observed. Above the macroscopic yield strength, there was a slight increase in the lattice strain. In the 1.4460 duplex stainless steel, however, both directions could be measured. In the longitudinal direction, a kink in the distribution was noticed before the macroscopic yield point was reached. This effect in the longitudinal direction could also be observed for all other lattice planes. The kink point in the 1.4462 duplex stainless steel was in a range between 510 and 540 MPa, while for the 1.4460 steel, it was between 270 and 350 MPa. After reaching the macroscopic yield point, a renewed increase in the lattice strain occurred for both duplex stainless steels. In both cases, the {222} lattice planes showed the smallest deviations from the expected linearity in the longitudinal direction, followed by the {311} lattice planes. In the transverse direction, the measured values tended to follow the expected course, whereby it appeared that the lattice strain slightly increased for the {220} and {311} lattice planes and decreased for the {222} planes after reaching the macroscopic yield strength.
The lattice strain vs. applied load distributions of the ferrite phase are shown in Figure 9. In comparison to the values measured for the austenite phase, no kink or plateau formation could be observed. With the exception of the {200} lattice planes, for all lattice planes an approximately linear course occurred. However, it can be seen for the {211} and {220} lattice planes in the 1.4462 duplex stainless steel that the lattice strain was initially below the expected curve, but after reaching the kink point for the austenite phase, it was above it. This also appeared to be the case in the 1.4460 duplex stainless steel, but the effect was slightly weaker. Neither lattice planes ({220} or {211}) showed any pronounced plastic anisotropy effects, even for the over-elastic range.
In the transverse direction, the {200} lattice planes for both phases also showed a clear change in their behaviour after the macroscopic yield strength was reached. For the other lattice planes, no change in the sign of the slope in the transverse direction was detected. However, the slope also changed slightly after a kink appeared in the distribution of the austenite phase.
Figure 10 shows the residual strains in the longitudinal direction after unloading to about 5 MPa plotted depending on the maximum total strain previously reached. In the upper line, the results for the austenite phase are shown, and in the lower line, those for the ferrite phase are shown. It can be seen that the identical lattice planes in both materials behaved comparably. For the austenite {311} lattice planes and the ferrite {220}, even a congruent behaviour could be observed. For the austenite {222} lattice planes, the residual lattice strains for the 1.4462 duplex stainless steel 1.4462 were slightly lower than for the 1.4460 steel. In the ferrite phase, a match could also be found for the {211} lattice planes with the exception of the first measuring point (unloading step after 450 MPa). It should be noted that the {211} lattice planes built up almost no residual lattice strain after unloading. In contrast, low compressive strains of up to -340 µstrain developed for the ferrite {220} lattice planes and high tensile strains of over 1000 µstrain developed in the ferrite {200} lattice planes. In austenite, on the other hand, all investigated lattice planes developed compressive strains, although these seemed to decrease slightly for the {311} lattice planes with increasing deformation.
Figure 11 shows the phase-specific stresses calculated from the lattice strains presented in Figure 8 and Figure 9 and the macro stress calculated based on the nominal volume content. In addition, the smoothed average course of the stresses is plotted against the applied relaxed load stress. For better orientation, the expectation line between the two diagram axes, including the macroscopic yield strength, is plotted in grey. Here, the kink in the lattice strains for the austenite phase was reflected as a decrease in the phase-specific load stress. Correspondingly, the phase-specific stress in the ferrite phase deviated towards a higher stress value relative to the expected curve. In the region around the macroscopic yield strength, the austenite phase showed a renewed increase in the phase-specific stress. From this point on, the phase-specific stresses tended to increase equally in both phases.

4. Discussion

4.1. Data Evaluation
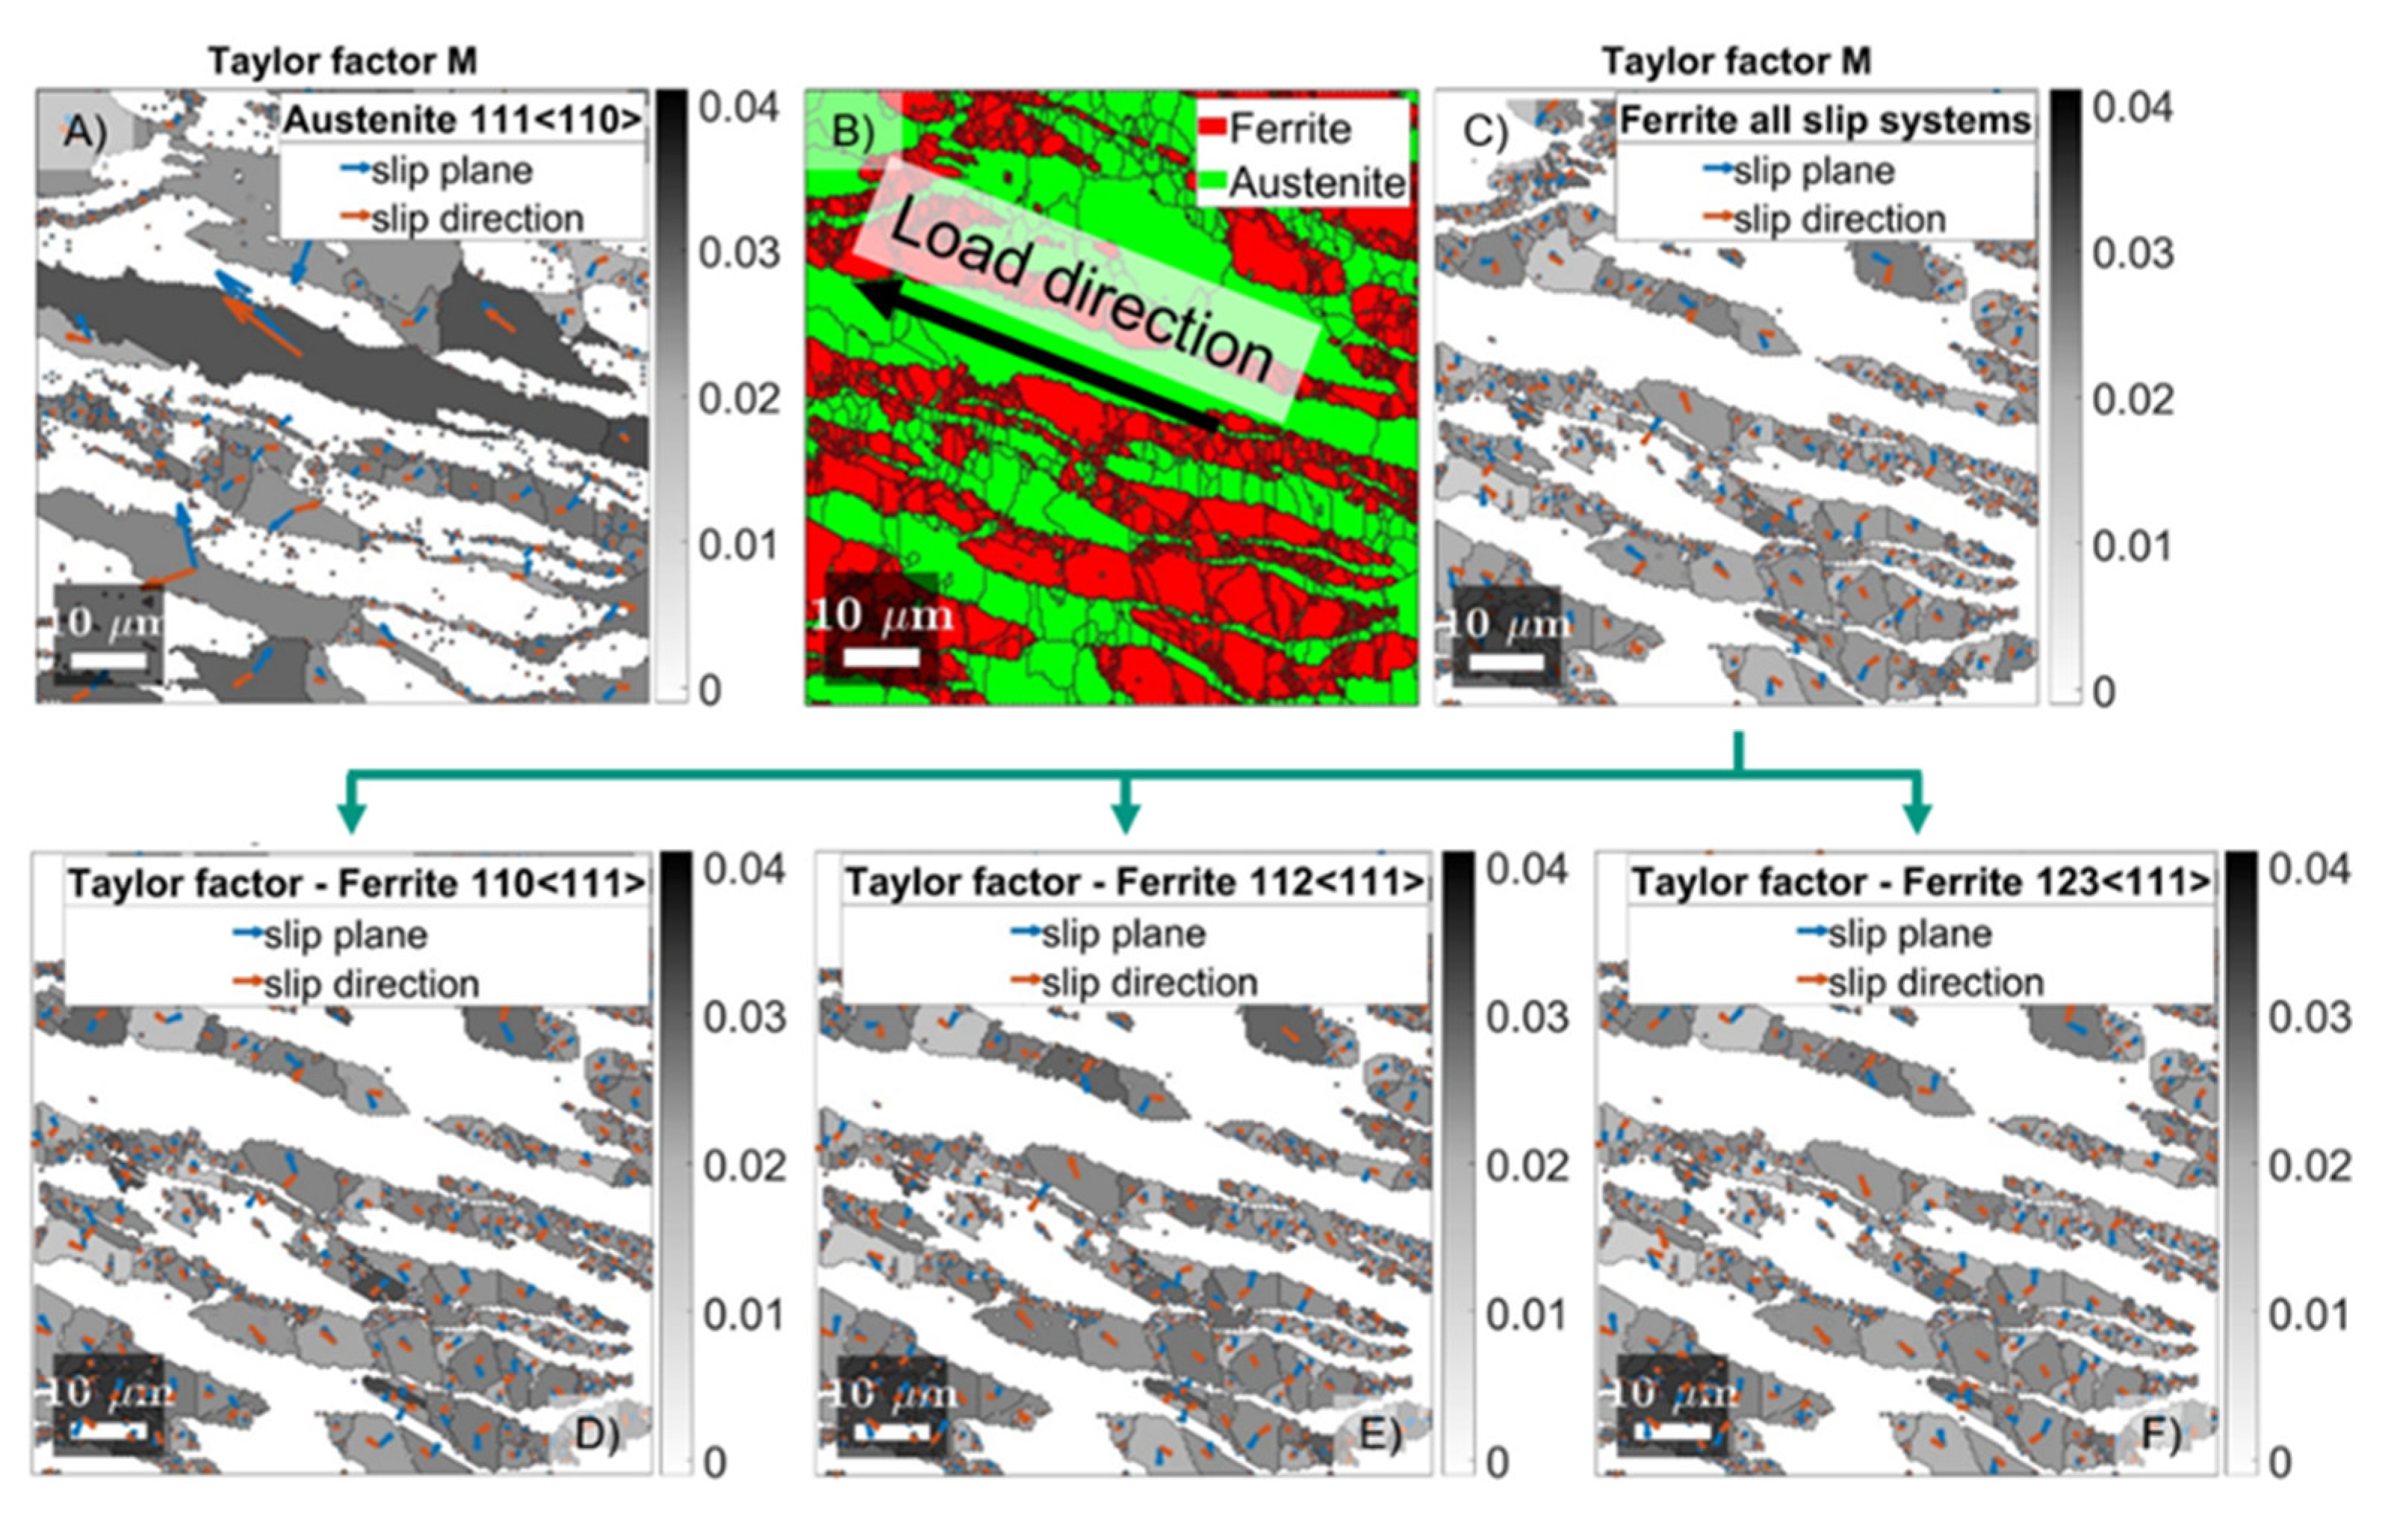
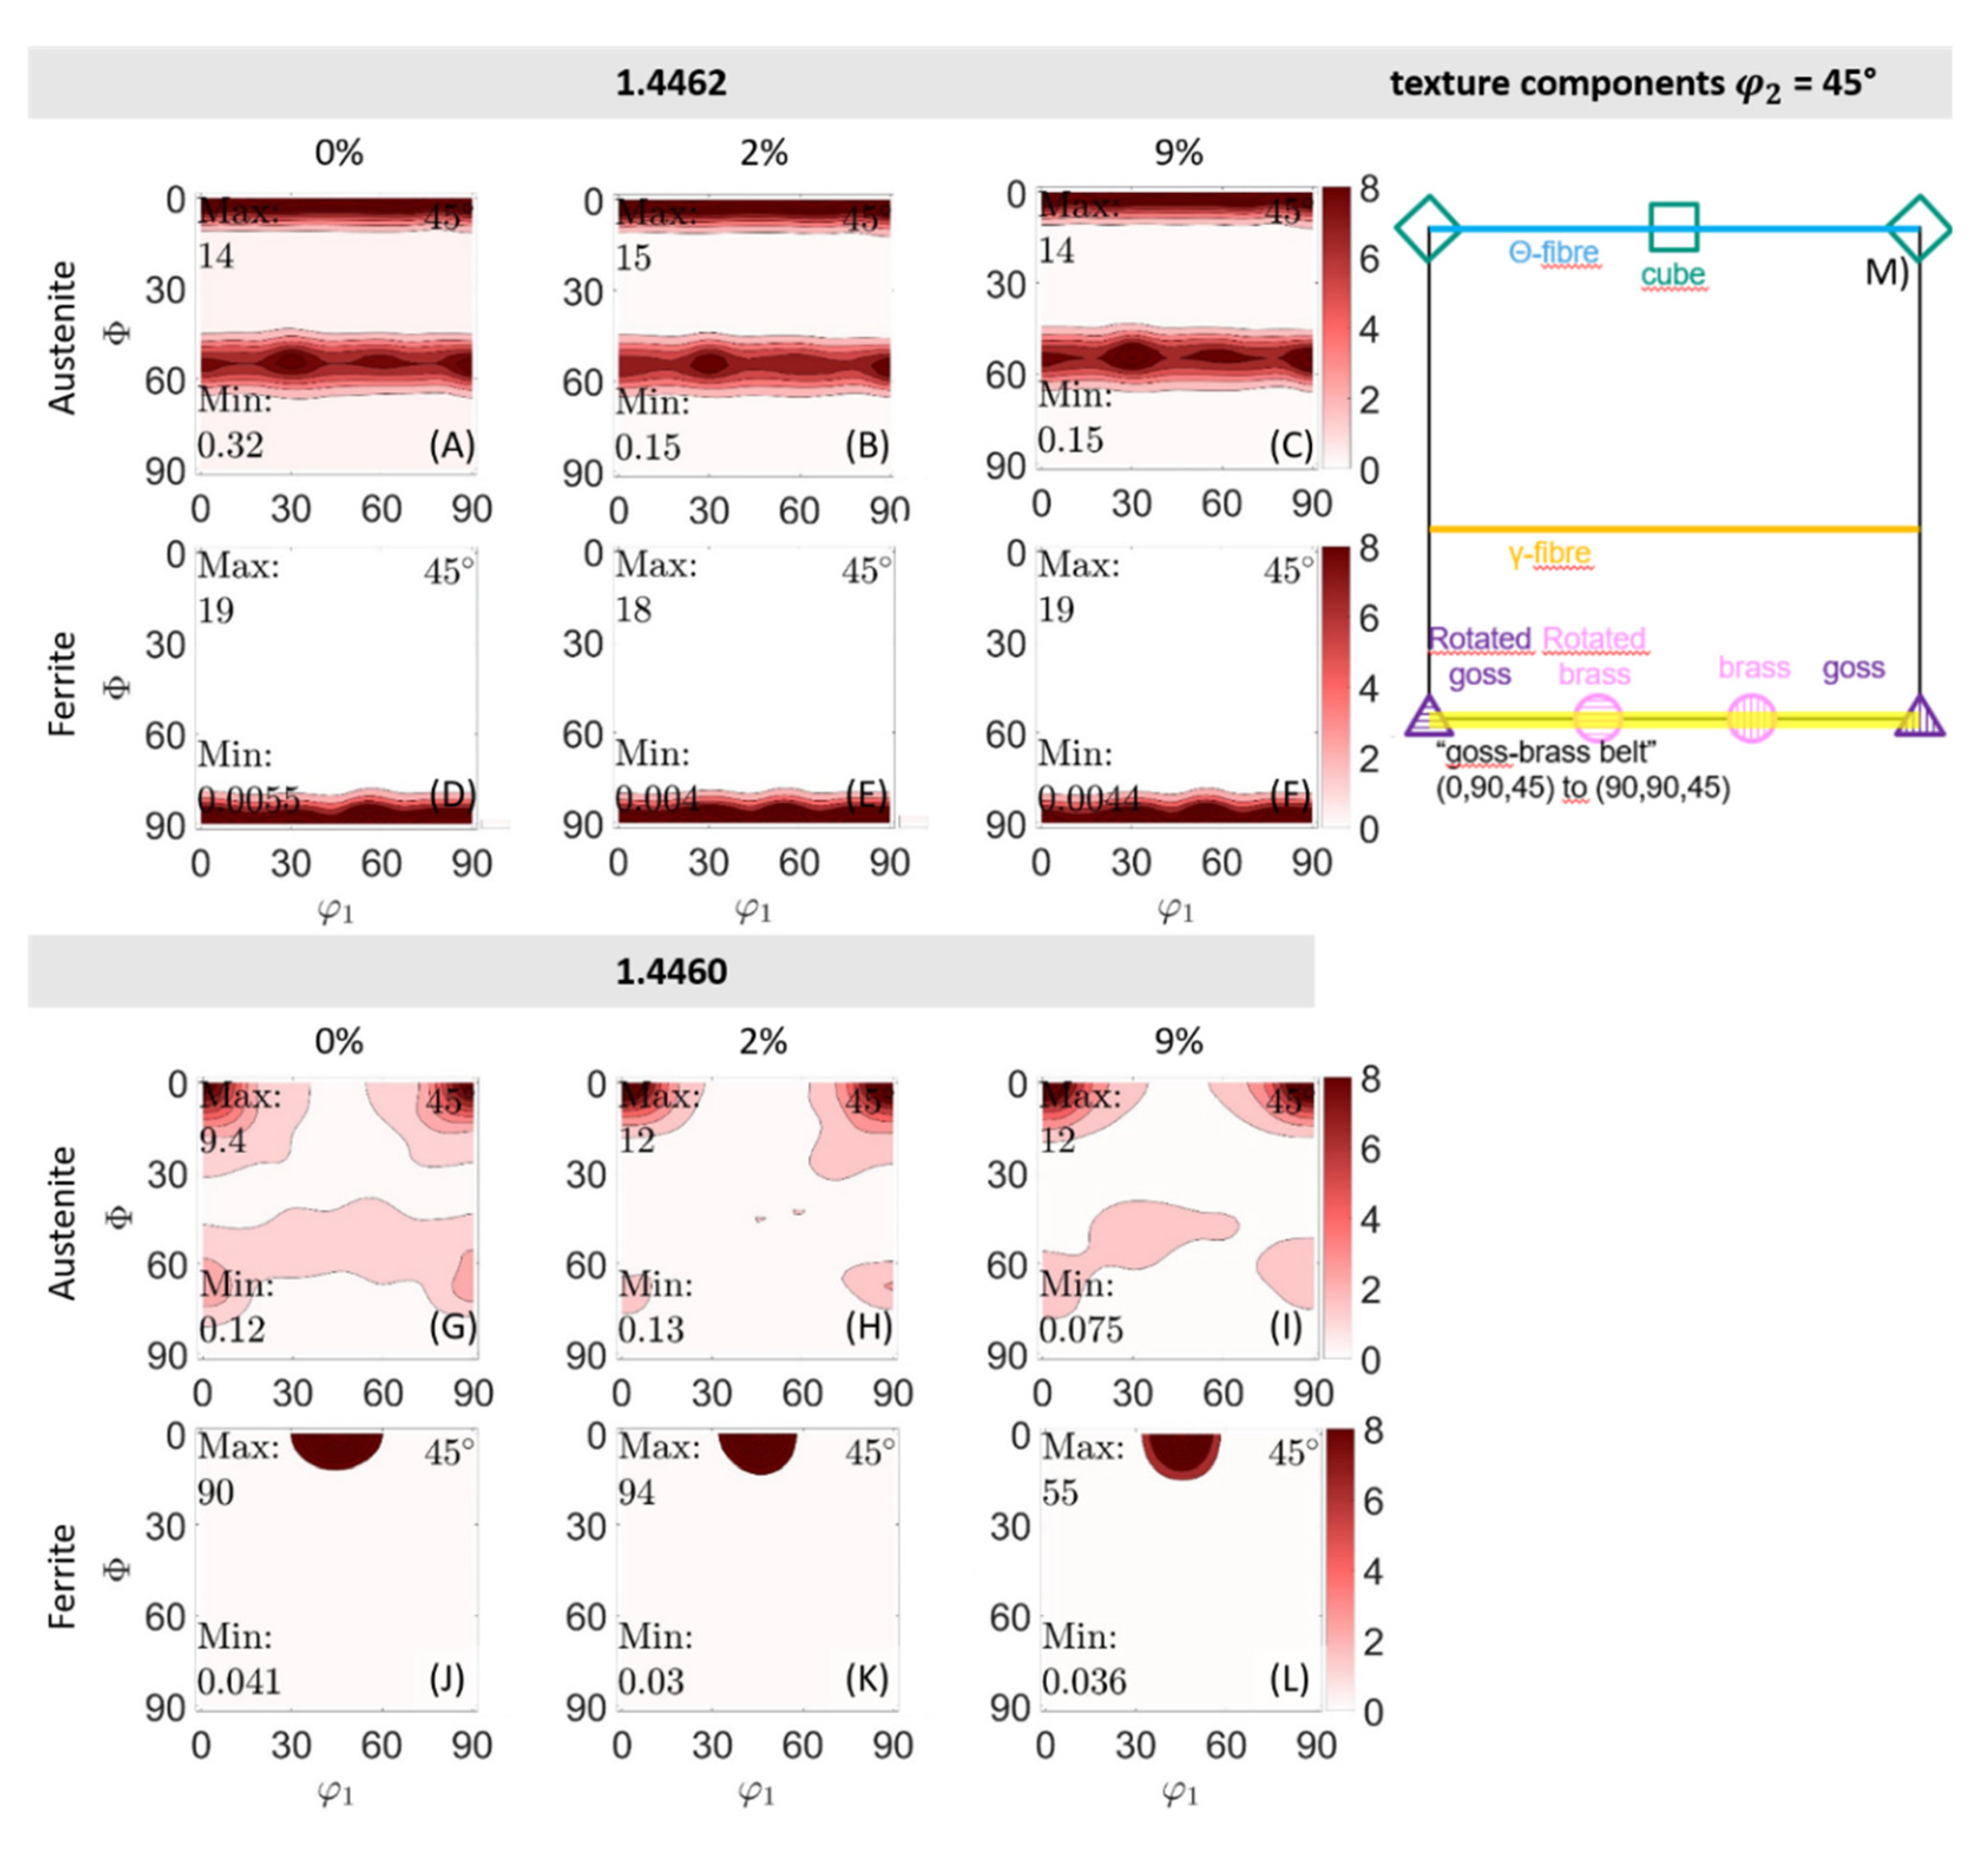
The d 0 h k l approach chosen in this work allowed for the direct determination of the phase- and {hkl}-specific strain and stress changes. However, due to this approach (referencing to the initial state), it must be accepted that possibly existing phase-specific or intergranular stresses in the initial state could not be captured directly. Calculation of the strain- and stress-free lattice plane spacing via stress equilibrium in the initial state was not considered useful. The use of free-cut reference samples; e.g., small cubes, in combination with the coarse multi-phase duplex steel has not yet been finally clarified as to whether sufficient residual stress relief would occur. We currently assume that this would not be the case.
It should be noted that the significance of the average phase-specific strain used to calculate the phase-specific stresses according to Equation (2) increased when further lattice planes were included in this averaging. In the present work, it was unfortunately not possible to measure more than the two different lattice planes in the ferrite phase or three lattice planes in the austenite phase with the existing experimental setup in the limited beam time.

4.2. Texture

In accordance with Figure 7, it was observed that no significant texture development occurred in both phases of the two duplex steels at loads of up to about 9% total strain. It followed that the initial state (Figure 2) can be regarded as representative of the entire experiment.
A pronounced texture should have an effect on the behaviour of the sample in the elastic and elasto-plastic regime. The effect in the elastic range was significantly weaker than in the elasto-plastic regime. As the crystallographic textures for the ferrite phase for both duplex stainless steels differed significantly more in contrast to the austenite phase, an effect was more likely to be observed in the elastic range. Due to the pronounced texture orientation of the {110} lattice planes ( E 110 = 219 , 911   M P a [34]) for 1.4462 (compare Figure 2) in the load direction, the effective resulting macro elasticity modulus should have been higher here than for the 1.4460 duplex stainless steel. In the 1.4460 steel, the {100} lattice planes ( E 110 = 164 , 409   M P a [34]) tended to be more oriented towards the load direction (stronger texture). This should have resulted in the lattice strain of the ferrite phase being smaller in the 1.4462 steel than in the 1.4460 steel at the same load stress. This can be observed in the readings in Figure 9.
In the austenite phase, the initial texture orientation was identical with regard to a clear orientation of the {100} lattice planes in the load direction (compared to Figure 2). However, this was more pronounced in the 1.4462 steel than in the 1.4460 steel. The additional rotation around the longitudinal axis in the 1.4462 steel should not have had any influence on the stiffness. Since the {100} lattice plane’s Young’s modulus ( E 100 = 138 , 405   M P a [35]) was lower than the mean macroscopic Young’s modulus ( E m a c r o = 192 , 116   M P a [35]), a somewhat lower macroscopic stiffness in the load direction in the elastic range was expected for the 1.4462 duplex steel than for the 1.4460 steel. However, the resolution of the strain data shown in Figure 8 was too poor to prove this unambiguously.
For the elasto-plastic region in 1.4662, we concluded from Figure 2 that the {112}<111> slip system should have become active rather than the {110}<111> slip system. This was evident in the intensity densities’ distribution shown in Figure 2 at ψ = 45°. According to the intensity distribution shown in Figure 2, there should have been significantly more optimally orientated {112}<111> slip systems. The hypothesis that the slip system {112}<111> was activated first due to preferred orientation was only valid under the assumption that the critical resolved shear stress values of both slip systems were approximately equal [32]. For the second duplex stainless steel 1.4460, the difference in orientation distribution according to Figure 2 was not as pronounced. However, the {110}<111> slip system rather than {112}<111> should have tended to become active here. In both duplex stainless steels, the {123}<111> slip system should have been less important because this slip system should not be active at room temperature [32] and the Taylor factor shown in Figure 3 also was a little smaller.
Despite the relatively strong textures, there were a large number of differently oriented grains in the polycrystalline duplex steel. In each grain, the slip system was oriented differently relative to the applied load. As shown in Figure 3, the differences between the three different slip systems were small in the ferrite phase, but again the Taylor factors tended to be highest for the {112}<111> slip system. This confirmed the above assumption that the slip system {112}<111> was activated first. For the austenite phase, only one slip system was possible due to the fcc structure. However, compared to the ferrite phase, the austenite phase again exhibited significantly higher Taylor factors. A direct comparison of the Taylor factors between the two phases was not useful. In this way, no influence on the phase-specific yield strength or load distribution could be derived.

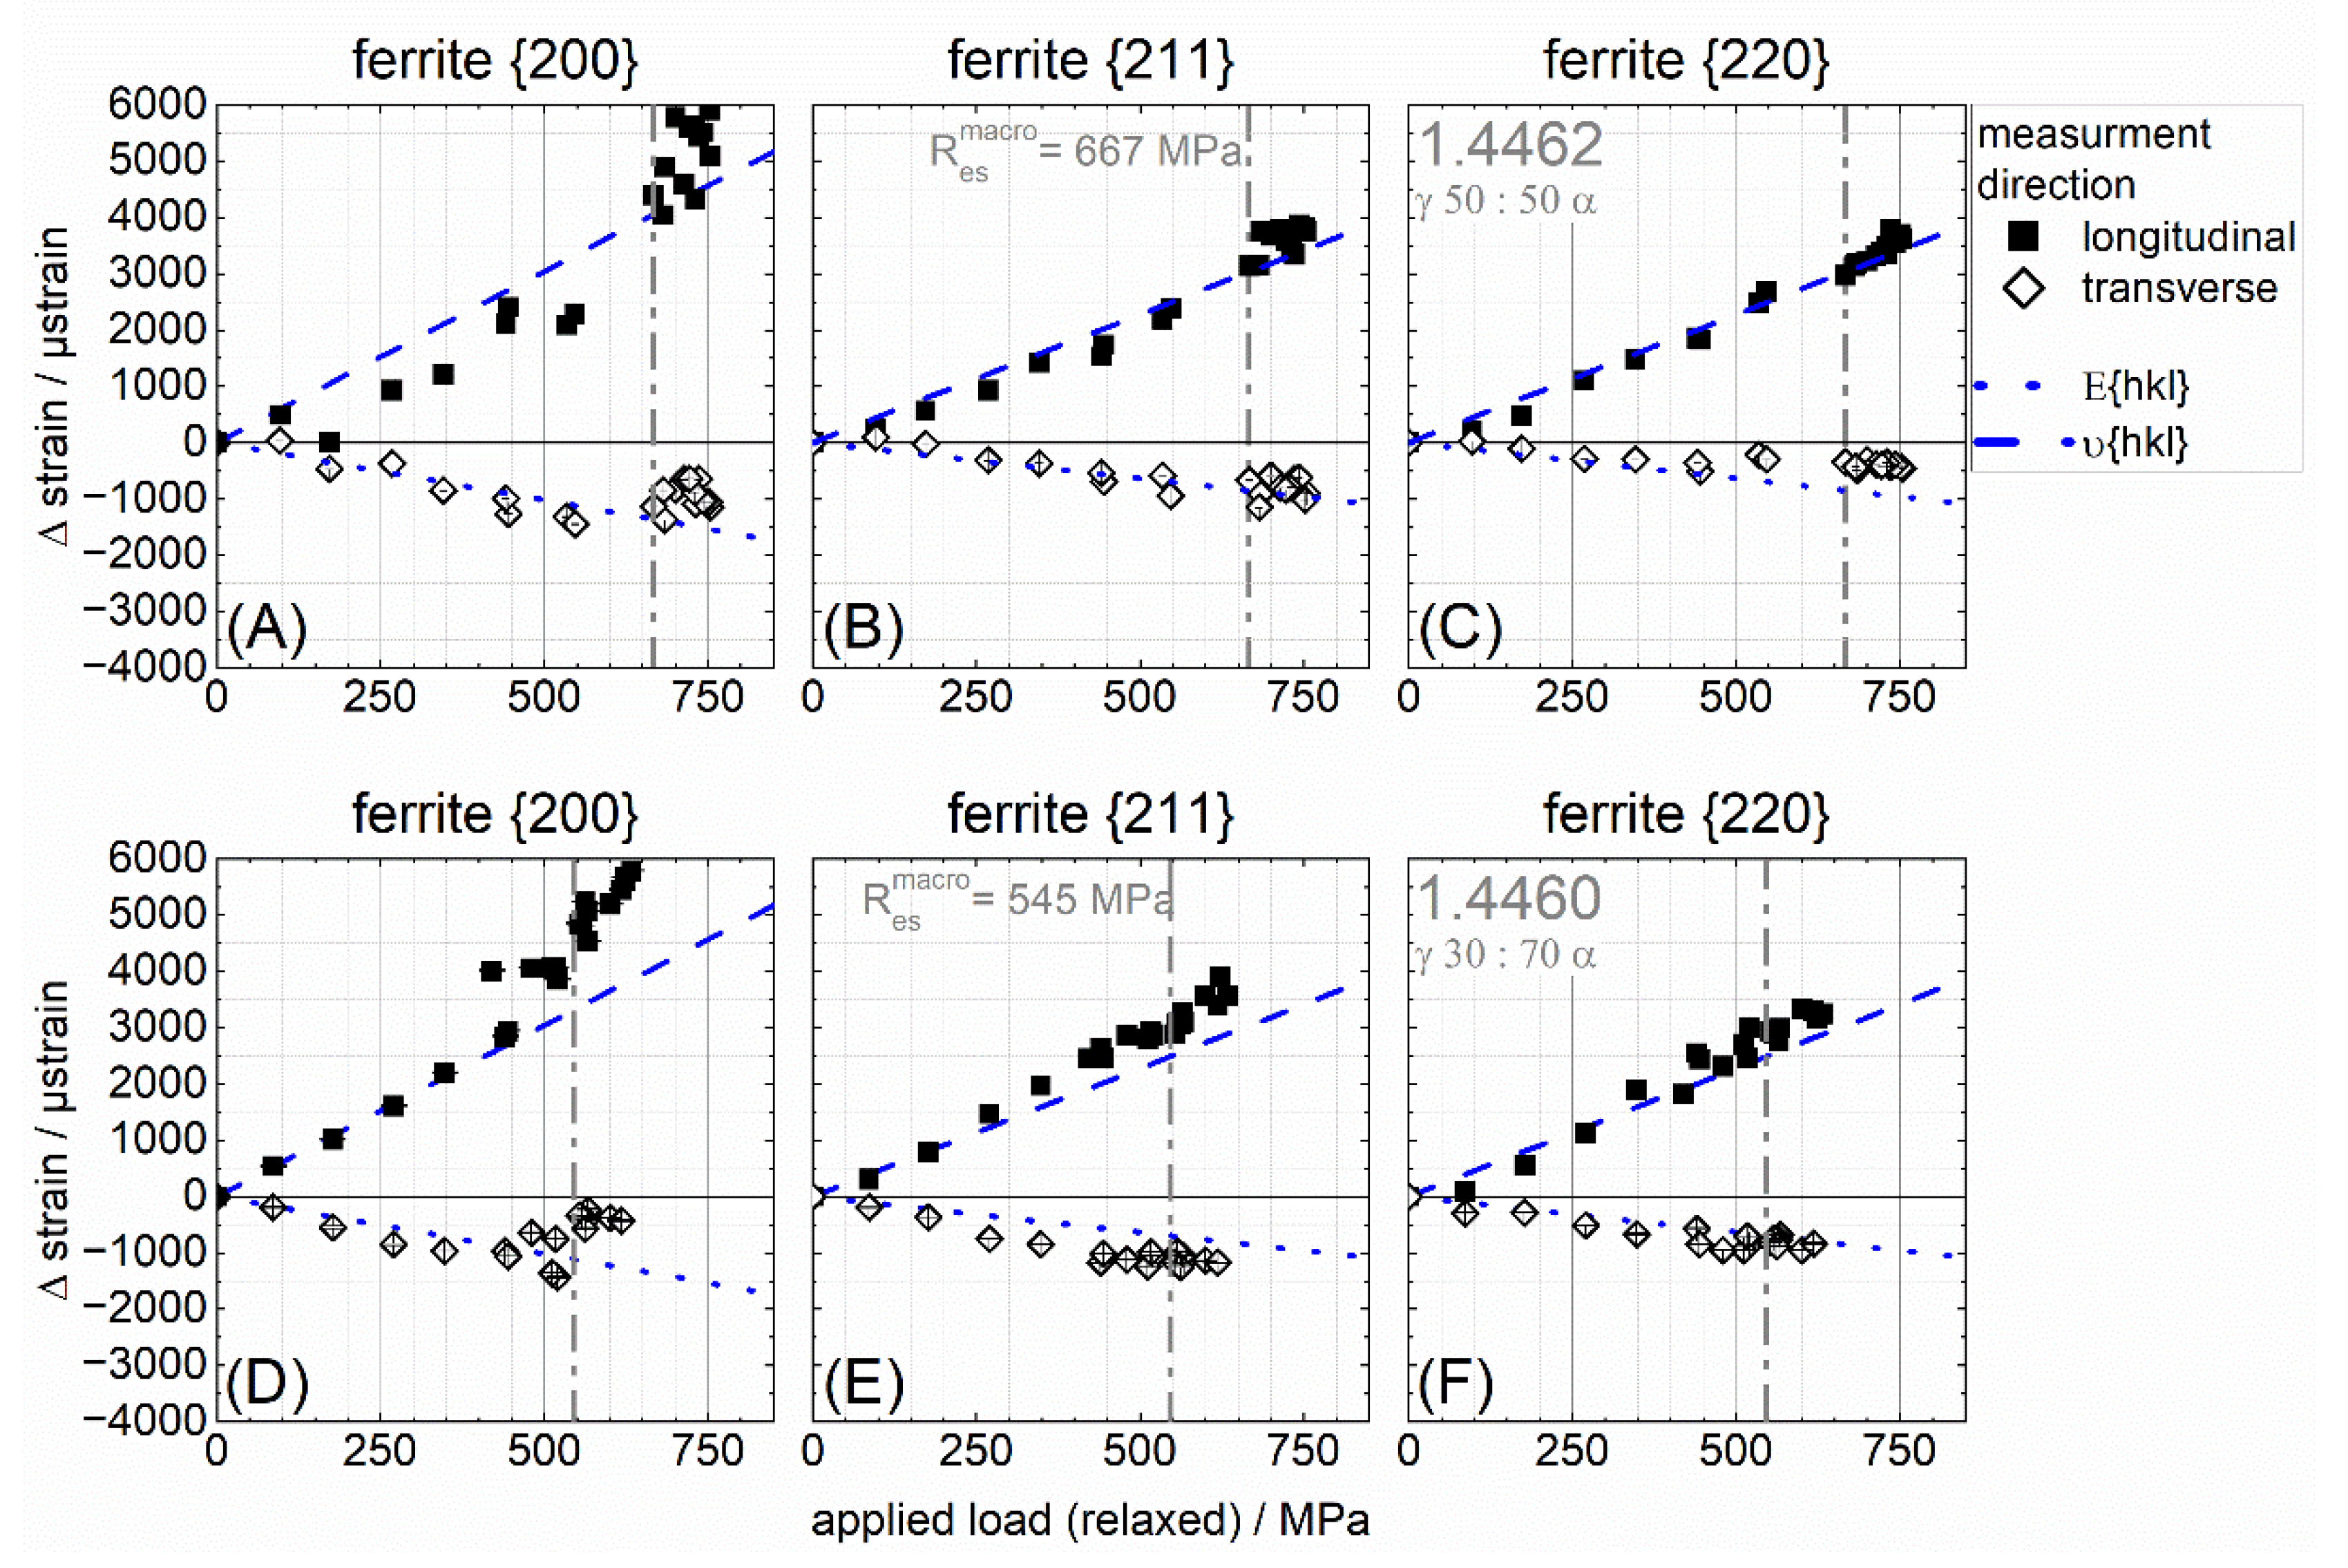
4.3. Phase-Specific Load Distribution in the Elastic Range

It can be assumed that in the purely elastic region, both phases contributed equally to the load transfer according to their phase fraction and Equation (3). According to Figure 11 and Figure 12, respectively, for the duplex steel in the elastic range, the phase-specific stress in the austenite phase was slightly higher than in the ferrite phase. Under the model assumption according to Voigt (equal strains in both phases), it followed that the stress in ferrite should have been higher than in austenite. According to the Reuss assumption (equal stress in both phases), it should follow that the lattice strains (and thus the phase-specific stresses) were lower in the ferrite phase than in the austenite phase. The actual behaviour, however, lay in the middle. A detailed description via elasto-plastic self-consistent modelling or other approaches is not provided here. However, an estimation of the development of phase specific stresses is shown in Figure 12. For the 1.4462 duplex stainless steel, the phase-specific stress in the ferrite phase tended to be lower. The macro stress calculated via Equation (3) perfectly reproduced the load stress up to about 300 MPa. The phase-specific stresses of the II kind were between 30–70 MPa in the elastic range. In the 1.4460 duplex stainless steel, on the other hand, there was no difference in the phase-specific stresses within the first 300 MPa.
In this context, it should be noted that the phase-specific stiffness of the two phases in duplex stainless steel might differ slightly compared to the stiffness values determined for single-phase materials. The exact experimental determination of the phase-specific stiffness of the two phases in duplex stainless steel is not possible with the classical approaches. It can be shown with respect to coarse multi-phase materials that for the elastic constants of the same phase measured in single phase and as part of a multi-phase, materials can present significant differences [39,40]. For this purpose, different approaches were described in literature that took into account the interaction between the two phases and thus allowed the prediction of the effective elastic constants based on single-crystal data [39,41,42,43]. The values adopted in this work [30,31] seemed to be sufficiently close to the actual stiffnesses of both duplex stainless steels.

4.4. Phase-Specific Load Distribution in the Elasto-Plastic Range

For both duplex stainless steels, it was observed that the lattice strain distribution vs. the load stress for the austenite phase showed a noticeable kink even before the material reached the macroscopic yield strength. This indicated that plastic deformation occurred first in the austenitic phase. In [11], for the 1.4462 duplex steel, the critical shear stress in the austenite phase slip system {111}<110> was given as 75 MPa and the phase-specific R p 0 , 2 was given as 235 MPa. Regarding the slip systems {110}<111> and {110}<111> + {112}<111> for the ferrite phase, the values of the critical shear stresses were 230 and 245 MPa, respectively. The phase-specific R p 0 , 2 for the ferrite phase occurred at about 660 and 650 MPa, respectively. The given phase-specific yield strength in ferrite was very close to the macroscopic yield strength of 667 MPa determined in this work, which was largely in agreement with the one for the ferrite phase. The situation was different in the austenite phase, in which the yield strength determined here was located in the range between 510 and 540 MPa for the 1.4462 duplex stainless steel. For the purpose of completeness, it should be noted that the yield strength for the austenite phase in the 1.4460 duplex stainless steel was determined to be in a range between 270 MPa ({220} + {222}) and a maximum 440 MPa ({311}). For the macroscopic yield strength of the ferrite phase, a value of about 545 MPa was determined.
Likewise, initial phase-specific residual stresses can have an influence on the apparent phase-specific yield strength, since the applied load stresses in the tensile test are superimposed on the existing phase-specific residual stresses [27]. The large errors determined for the residual stresses were primarily due to the textural sensitivity of the stress analysis according to the s i n 2 ψ -method. The addition of the initial residual stresses for the austenite phase to the applied load stress (in Figure 8) would shift the estimated phase-specific yield strength close to the macroscopic yield strength. This was especially true for the 1.4460 steel.
The kink in the lattice strain in the austenite observed in the two duplex stainless steels was thus due to the changing load partitioning. Since the austenite phase plastically deformed earlier, it transmitted less load than the elastically deforming ferrite phase from this point on. This can also be seen in Figure 11 and led to the formation of the plateau observed in Figure 8. The changing load distribution can also be observed in the ferrite phase, although here the effects were weaker. As can be seen in Figure 9 for the lattice planes {211} and {220} of the 1.4462 duplex stainless steel, the absolute value of the lattice strain in the ferrite changed after the phase-specific yield strength in the austenite phase was reached. If the lattice strain was still below the expected curve before the phase-specific yield strength for the austenite phase, it was then above it. This was a direct effect of the changing load partitioning. This effect also occurs in the 1.4460 steel, but could not be observed quite as clearly due to the smaller number of measuring points before the yield strength in the austenite phase was reached. After reaching the yield point for the ferrite phase, the ferrite phase also deformed elasto-plastically. This led to a renewed change in the load partitioning. From this moment on, the phase-specific stress in both phases increased again (Figure 11). Both phases strain-hardened in approximately the same way, whereby the phase-specific stress in the investigated applied load range always remained higher in the ferrite phase than in the austenite phase. The mean phase-specific micro stress under load (according to Equation (3) and σ α m i c r o = σ m a c r o σ α ) in the ferrite phase in both duplex steels averaged around 100 MPa. For the austenite phase in the 1.4462 steel, similar values were determined depending on the respective phase fractions. In the 1.4460 duplex stainless steel, however, the micro-stress in the austenite phase was approx. 250 MPa. This was due to the different phase fractions.
For the lattice planes {211} and {220} in the ferrite phase in both duplex stainless steels, an approximately linear behaviour (despite a changing load distribution) in the elastic-plastic range could also be observed. This confirmed the low susceptibility of these two lattice planes to the plastic anisotropy effect. This is worth mentioning because the crystallographic texture for the ferrite phase was very different in the two materials. In the austenite phase, the {311} lattice planes showed significantly stronger non-linearity in the elasto-plastic region than the {222} lattice planes in both duplex stainless steels.

4.5. Phase-Specific (Residual) Strain Development

According to [21], the differences between the linear elastic expected behaviour and the behaviour resulting from the elasto-plastic anisotropy effect corresponded to the intergranular and interphase micro stresses. This should result in phase-specific compressive residual stresses for the lattice planes in the austenite phase. For the ferrite phase lattice planes {211} and {220}, on the other hand, only minimal tensile residual stresses should be generated according to Figure 9. Here, these should have been somewhat larger for the {211} lattice planes than for the {220} ones. The {200} lattice planes should have formed large tensile residual stresses in both materials. A comparison of this prediction with the residual strains in the longitudinal direction (see Figure 10) showed that this was mostly correct. Only the ferrite lattice planes {220} deviated from the prediction. This was due to the offset in the lattice strain caused by the early plastic deformation of the austenite phase and the resulting change in the load partitioning. If this offset was subtracted, the {220} lattice planes were slightly below the blue line, with the {211} lattice planes directly on top of it. In the unloaded condition, this load partitioning was not active, so the {211} and {220} lattice plane strains shifted slightly towards the compressive strain region in the unloaded state. The difference in the {222} lattice plane strains of the austenite phase can be attributed to the different phase content. Since the sample was macro-stress-free in the unloaded state, in the 1.4460 steel, the austenite phase must have had a higher stress value than the ferrite phase with a higher volume content. It seemed that the {222} lattice planes behaved more sensitively to this residual stress partitioning than the {311} lattice planes. It should be noted, however, that this lattice plane also exhibited minimally higher compressive strains than the same lattice planes in the 1.4462 steel. In the ferrite phase, on the other hand, the opposite picture emerged, with the 1.4460 steel tending to show lower strain values. However, this was not a contradiction to [21], but proved that the anisotropy deviations with respect to the absolute value were also influenced by the load-sharing condition. Since the curves of the different lattice planes could be regarded as the same with the exception of γ{222}, we also concluded, on the basis of Figure 10, that different phase-specific textures played only a minor role in the residual lattice strains.

5. Conclusions

In the present work, the phase-specific load partitioning of two coarse multi-phase duplex stainless steels (1.4462 and 1.4460), which clearly differed in their phase fractions, was investigated in situ during uniaxial loading by means of neutron diffraction. Special attention was paid to the evolution of phase-specific micro residual stresses in the load-stress experiments. Based on the results, the following conclusions were drawn:
Regardless of the different phase contents, the following common were identified for both investigated duplex stainless steels:
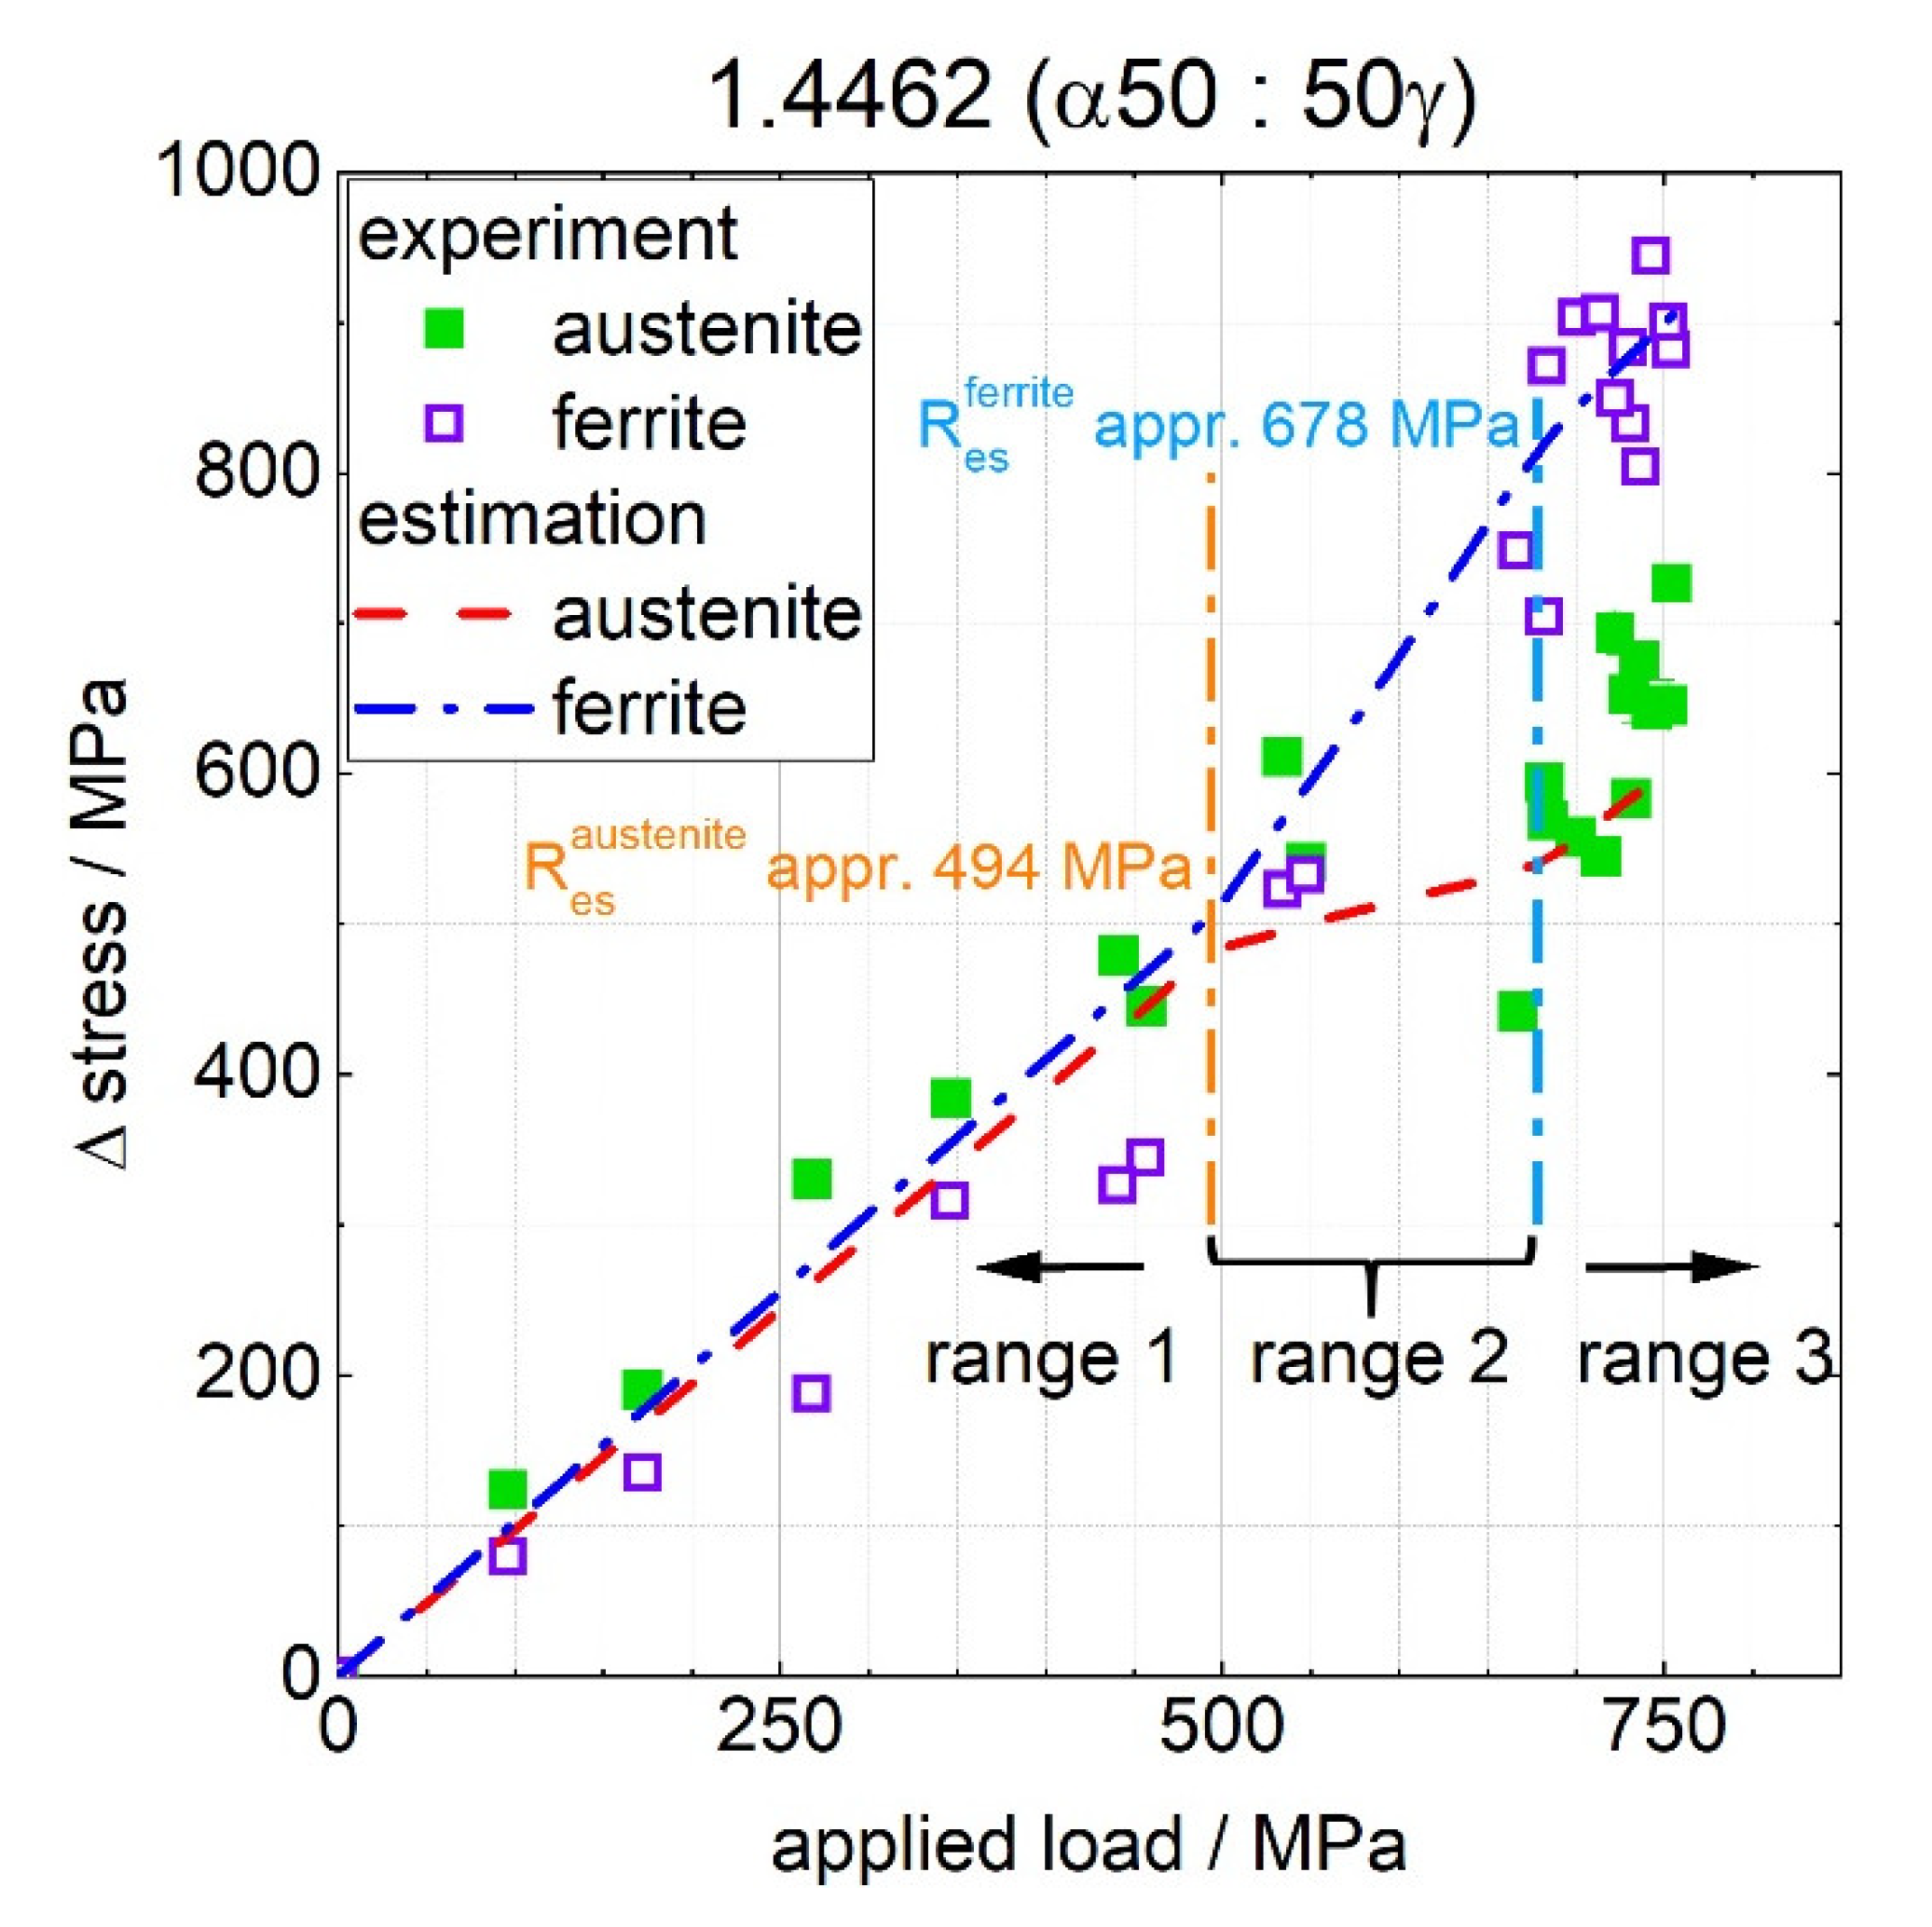
  • The load-partitioning behaviour could be distinguished in three ranges:
    • In the purely elastic case, both phases; i.e., austenite and ferrite, contributed almost equally to the load partitioning.
    • After the onset of plastic deformation, which was observed for both materials in the austenite phase, the ferrite phase transmitted a higher load.
    • In the further course; i.e., with increasing plastic deformation, the load partitioning changed again. However, the ferrite phase continued to transmit a higher load within the investigated range of 9% total strain.
  • For both steels, the austenite phase exhibited plastic deformation before the macroscopic yield strength was reached.
  • The formation of intergranular stresses (and respective strains) with increasing plastic deformation were similar in their principal course. This was observed despite the different phase contents and phase-specific crystallographic textures.
  • In the austenitic phase, only intergranular compressive strains occurred in the unloaded state for the investigated lattice planes, which clearly differed from the behaviour observed for the ferrite phase.
  • For the three investigated lattice planes of the ferrite phase, the two lattice planes {211} and {220} were only weakly sensitive to plastic anisotropy effects as expected, despite clearly different and sharp crystallographic textures. In the austenite phase, the {222} lattice plane showed a correlation that could be described as almost linear.
  • In both phases, no texture evolution with increasing plastic deformation was observed; i.e., no texture components appeared nor disappeared. Only a slight variation in the intensity distribution was observed.
Regarding the load-partitioning behaviour of both duplex stainless steels, the following differences occurred:
  • Quantitatively, the load partitioning depended on the respective phase content. For the 1.4460 duplex stainless steel, which had an austenite content of 70%, the drop in the load partitioning after reaching the phase-specific yield strength was more pronounced compared to the 1.4462 duplex stainless steel with an austenite content of 50%.
  • Even though for both steels the austenite phases exhibited elasto-plastic behaviour before reaching the macroscopic yield strength, the phase-specific yield strength of the austenite phase was reached earlier for the 1.4460 duplex steel than for the 1.4462 steel.
  • For the investigated lattice planes, the different phase contents only showed an effect on the residual intergranular strains for the austenite {222} lattice plane. Here, a higher residual strain was observed for the higher austenite content.

Author Contributions

Conceptualization, S.P. and J.G.; methodology, S.P. and J.G.; validation, S.P. and J.G. formal analysis, S.P.; general investigation, S.P.; neutron diffraction experiment, S.P., J.G., M.G.Z., S.C. and T.P.; resources, M.H. and J.G.; data curation, S.P.; writing—original draft preparation, S.P. and J.G.; writing—review and editing, S.P., J.G., M.H., S.C., and T.P.; visualization, S.P.; supervision, J.G.; project administration, M.H. and J.G.; funding acquisition, M.H. and J.G. All authors have read and agreed to the published version of the manuscript.

Funding

This research was funded by the German Research Foundation (DFG) under grant numbers GI 376/11-2 and Ho 3322/4-2.

Institutional Review Board Statement

Not applicable.

Informed Consent Statement

Not applicable.

Acknowledgments

This research was funded by the German Research Foundation (DFG) under grant number GI 376/11-2 (No. 282874578). Furthermore, we would like to thank the Institut Laue-Langevin—GRENOBLE (France)) for granting beamtime 1-02-226 [36] on the SALSA instrument. In addition, we acknowledge support by the KIT-Publication Fund of the Karlsruhe Institute of Technology. Finally, we would like to thank Sabine Schlabach from KIT (IAM-WK) for providing the SEM images (KNMF, No. 2019-022-026411).

Conflicts of Interest

The authors declare no conflict of interest.

References

  1. Moura, V.S.; Lima, L.D.; Pardal, J.M.; Kina, A.Y.; Corte, R.; Tavares, S. Influence of microstructure on the corrosion resistance of the duplex stainless steel UNS S31803. Mater. Charact. 2008, 59, 1127–1132. [Google Scholar] [CrossRef]
  2. Calderón-Uríszar-Aldaca, I.; Briz, E.; Matanza, A.; Martin, U.; Bastidas, D.M. Corrosion Fatigue Numerical Model for Austenitic and Lean-Duplex Stainless-Steel Rebars Exposed to Marine Environments. Metals 2020, 10, 1217. [Google Scholar] [CrossRef]
  3. Johansson, J. Residual Stresses and Fatigue in a Duplex Stainless Steel. PhD Thesis, Linkoeping Studies in Science and Technology, Linkopings Universitet, Linköping, Sweden, 1999. 91-7219-523-1. [Google Scholar]
  4. TMR Stainless. Practical Guidelines for the Fabrication of Duplex Stainless Steels, 3rd ed.; International Molybdenum: London, UK, 2014; ISBN 978-1-907470-09-7. [Google Scholar]
  5. Tang, J.; Yang, X.; Wang, Y.; Wang, H.; Xiao, Y.; Apreutesei, M.; Nie, Z.; Normand, B. Corrosion Behavior of 2205 Duplex Stainless Steels in HCl Solution Containing Sulfide. Metals 2019, 9, 294. [Google Scholar] [CrossRef]
  6. Simon, N.; Erdle, H.; Walzer, S.; Gibmeier, J.; Böhlke, T.; Liewald, M. Residual stresses in deep-drawn cups made of duplex stainless steel X2CrNiN23-4. Forsch. Ingenieurwes. 2021, 85, 795–806. [Google Scholar] [CrossRef]
  7. Simon, N.; Erdle, H.; Walzer, S.; Gibmeier, J.; Böhlke, T.; Liewald, M. Phase-specific residual stresses induced by deep drawing of lean duplex steel: Measurement vs. simulation. Prod. Eng. Res. Devel. 2019, 13, 227–237. [Google Scholar] [CrossRef]
  8. Peng, R.L.; Gibmeier, J.; Chai, G.C.; Johansson, S. Load partitioning in a duplex stainless steel with surface strength gradient and residual stresses. In Proceedings of the 57th Annual Conference on Applications of X-ray Analysis and the 8th International Conference on Residual Stresses, Advances in X-Ray Analysis, Denver, CO, USA, 4–8 August 2008; pp. 773–780. [Google Scholar]
  9. Simon, N.; Krause, M.; Heinemann, P.; Erdle, H.; Böhlke, T.; Gibmeier, J. Phase-Specific Strain Hardening and Load Partitioning of Cold Rolled Duplex Stainless Steel X2CrNiN23-4. Crystals 2020, 10, 976. [Google Scholar] [CrossRef]
  10. Tao, P.; Gong, J.; Wang, Y.; Jiang, Y.; Li, Y.; Cen, W. Characterization on stress-strain behavior of ferrite and austenite in a 2205 duplex stainless steel based on nanoindentation and finite element method. Results Phys. 2018, 11, 377–384. [Google Scholar] [CrossRef]
  11. Baczmański, A. Elastoplastic properties of duplex steel determined using neutron diffraction and self-consistent model. Acta Mater. 2004, 52, 1133–1142. [Google Scholar] [CrossRef]
  12. Baczmański, A.; Zhao, Y.; Gadalińska, E.; Le Joncour, L.; Wroński, S.; Braham, C.; Panicaud, B.; François, M.; Buslaps, T.; Soloducha, K. Elastoplastic deformation and damage process in duplex stainless steels studied using synchrotron and neutron diffractions in comparison with a self-consistent model. Int. J. Plast. 2016, 81, 102–122. [Google Scholar] [CrossRef]
  13. Dakhlaoui, R.; Braham, C.; Baczmański, A. Mechanical properties of phases in austeno-ferritic duplex stainless steel—Surface stresses studied by X-ray diffraction. Mater. Sci. Eng. A 2007, 444, 6–17. [Google Scholar] [CrossRef]
  14. Fu, H.; Dönges, B.; Krupp, U.; Pietsch, U.; Fritzen, C.-P.; Yun, X.; Christ, H.-J. Microcrack initiation mechanism of a duplex stainless steel under very high cycle fatigue loading condition: The significance of load partitioning and micro residual stresses. Acta Mater. 2020, 199, 278–287. [Google Scholar] [CrossRef]
  15. Hutchings, M.T.; Withers, P.J.; Holden, T.M.; Lorentzen, T. Introduction to the Characterization of Residual Stress by Neutron Diffraction, 1st ed.; CRC Press Taylor & Francis Group: Boca Raton, FL, USA, 2005; ISBN 0-415-31000-8. [Google Scholar]
  16. Clausen, B.; Lorentzen, T.; Bourke, M.A.; Daymond, M.R. Lattice strain evolution during uniaxial tensile loading of stainless steel. Mater. Sci. Eng. A 1999, 259, 17–24. [Google Scholar] [CrossRef]
  17. DIN Deutsches Institut für Normung e.V.; DIN German Institute for Standardization. Non-destructive testing—Standard test method for determining residual stresses by neutron diffraction; Beuth Verlag GmbH: Berlin, Germany, 2020; 19.100 (ISO 21432:2020). [Google Scholar]
  18. Pang, J.W.L.; Holden, T.M.; Mason, T.E. The development of intergranular strains in a high-strength steel. J. Strain Anal. Eng. Des. 1998, 33, 373–383. [Google Scholar] [CrossRef]
  19. Allen, A.J.; Bourke, M.; David, W.I.F.; Dawes, S.; Hutchings, M.T.; Krawitz, A.D.; Windsor, C.G. Effects of Elastic Anisotropy on the Lattice Strains in Polycrystalline Metals and Composites Measured by Neutron Diffraction. In International Conference on Residual Stresses: ICRS2; Beck, G., Denis, S., Simon, A., Eds.; Springer: Dordrecht, The Netherlands, 1989; pp. 78–83. ISBN 978-94-010-7007-2. [Google Scholar]
  20. Dakhlaoui, R.; Baczmański, A.; Braham, C.; Wroński, S.; Wierzbanowski, K.; Oliver, E.C. Neutron Diffraction Study of Duplex Stainless Steel during Loading at 200 °C. In Materials Science Forum; Trans Tech Publications, Ltd.: Wollerau, Switzerland, 2008; Volume 571–572, pp. 175–180. [Google Scholar] [CrossRef]
  21. Dye, D.; Stone, H.J.; Reed, R.C. Intergranular and interphase microstresses. Curr. Opin. Solid State Mater. Sci. 2001, 5, 31–37. [Google Scholar] [CrossRef]
  22. Withers; Preuss, P.J.M.; Steuwerb, A.; Pang, J.W.L. Methods for obtaining the strain-free lattice parameter when using diffraction to determine residual stress. Appl. Crystallogr. 2007, 40, 891–904. [Google Scholar] [CrossRef]
  23. Daymond, M.R.; Johnson, M.W. The determination of a stress-free lattice parameter within a stressed material using elastic anisotropy. J. Appl. Crystallogr. 2001, 34, 263–270. [Google Scholar] [CrossRef]
  24. Repper, J.; Hofmann, M.; Krempaszky, C.; Regener, B.; Berhuber, E.; Petry, W.; Werner, E. Effect of macroscopic relaxation on residual stress analysis by diffraction methods. J. Appl. Phys. 2012, 112, 64906. [Google Scholar] [CrossRef]
  25. Hofmann, M.; Gan, W.; Rebelo-Kornmeier, J. STRESS-SPEC: Materials science diffractometer. J. Larg.-Scale Res. Facil. 2015, 1, 6. [Google Scholar] [CrossRef]
  26. Pirling, T.; Bruno, G.; Withers, P.J. SALSA—A new instrument for strain imaging in engineering materials and components. Mater. Sci. Eng. A 2006, 437, 139–144. [Google Scholar] [CrossRef]
  27. Eigenmann, B.; Macherauch, E. Röntgenographische Untersuchung von Spannungszuständen in Werkstoffen: X-Ray Investigation of Stress States in Materials. Materialwiss. Werkstofftech. 1995, 26, 148–160. [Google Scholar] [CrossRef]
  28. Pulvermacher, S.; Bücker, T.; Šaroun, J.; Rebelo-Kornmeier, J.; Hofmann, M.; Gibmeier, J. Neutron and X-ray Diffraction Analysis of Macro and Phase-Specific Micro Residual Stresses in Deep Rolled Duplex Stainless Steels. Materials 2021, 14, 1854. [Google Scholar] [CrossRef] [PubMed]
  29. Knabben, H. Werkstoffblatt TK 1.4462 (X2CrNiMoN22-5-3), 45313 Essen, 2006. Available online: https://www.steelinox.nl/en/qualities/duplex-superduplex/1.4462-s31803-f51-x2crnimon22-5-3 (accessed on 13 October 2016).
  30. DIN EN 10088-3:2014-12, Nichtrostende Stähle_- Teil_3: Technische Lieferbedingungen für Halbzeug, Stäbe, Walzdraht, gezogenen Draht, Profile und Blankstahlerzeugnisse aus korrosionsbeständigen Stählen für allgemeine Verwendung; Deutsche Fassung; Beuth Verlag GmbH: Berlin, Germany. Available online: https://www.beuth.de/de/norm/din-en-10088-3/201983218 (accessed on 7 September 2022).
  31. Bachmann, F.; Hielscher, R.; Schaeben, H. Texture Analysis with MTEX—Free and Open Source Software Toolbox. In Solid State Phenomena; Trans Tech Publications Ltd.: Wollerau, Switzerland, 2010; Volume 160, pp. 63–68. [Google Scholar] [CrossRef]
  32. Du, C.; Maresca, F.; Geers, M.; Hoefnagels, J. Ferrite slip system activation investigated by uniaxial micro-tensile tests and simulations. Acta Mater. 2018, 146, 314–327. [Google Scholar] [CrossRef]
  33. Bunge, H.J. Some applications of the Taylor theory of polycrystal plasticity. Cryst. Res. Technol. 1970, 5, 145–175. [Google Scholar] [CrossRef]
  34. Börnstein, L. Elastische, piezoelektrische, piezooptische und elektrooptische Konstanten von Kristallen, Landolt-Börnstein: Zahlenwerte und Funktionen aus Naturwissenschaft und Technik, Neue Serie, Gruppe 3: Kristall-und Festkörperphysik; Band 1; Bechmann, R., Hearmon, R.F.S., Hellwege, K.H., Eds.; Springer: Berlin, Germany, 1966. [Google Scholar]
  35. Ledbetter, H.M. Predicted single-crystal elastic constants of stainless-steel 316. Br. J. Non-Destr. Test. 1981, 23, 286–287. [Google Scholar]
  36. Gibmeier, J.; Hofmann, M.; Pirling, T.; Pulvermacher, S.; Kornmeier, R.; Saroun, J.; Zürn, M. Residual stress analysis for multiphase materials with depth gradients of the strain free/independent lattice parameter d0 (cont.): 1-02-226/Cycle 183 (from 03/09/2018 to 28/10/2018), instrument SALSA. [CrossRef]
  37. Richard, D.; Ferrand, M.; Kearley, G.J. Analysis and visualisation of neutron-scattering data. J. Neutron Res. 1996, 4, 33–39. [Google Scholar] [CrossRef]
  38. Daymond, M.R. The determination of a continuum mechanics equivalent elastic strain from the analysis of multiple diffraction peaks. J. Appl. Phys. 2004, 96, 4263–4272. [Google Scholar] [CrossRef]
  39. Tanaka, K.; Akiniwa, Y.; Ito, T. Effect of secondary phase on diffraction elastic constants of polycrystalline materials. In Proceedings of the ICRS-6, Oxford, UK, 10–12 July 2000; pp. 1012–1019. [Google Scholar]
  40. Behnken, H.; Hauk, V. Die röntgenographischen Elastizitätskonstanten keramischer Werkstoffe zur Ermittlung der Spannungen aus Gitterdehnungsmessungen. Zeitschrift fuer Metallkunde 1990, 81, 891–895. [Google Scholar] [CrossRef]
  41. Fréour, S.; Gloaguen, D.; François, M.; Guillén, R. Modelling and simulation of multi-phase effects on X-ray elasticity constants. Phys. Stat. Sol. (B) 2003, 239, 297–309. [Google Scholar] [CrossRef] [Green Version]
  42. Heldmann, A.; Hoelzel, M.; Hofmann, M.; Gan, W.; Schmahl, W.W.; Griesshaber, E.; Hansen, T.; Schell, N.; Petry, W. Diffraction-based determination of single-crystal elastic constants of polycrystalline titanium alloys. J. Appl. Crystallogr. 2019, 52, 1144–1156. [Google Scholar] [CrossRef]
  43. Tanaka, K.; Akiniwa, Y. Effect of Secondary Phase on Elastic Constants for Stress Measurement of Multi-Phase Materials by X-Ray and Neutron Diffraction Methods. JSME Int. J. Ser. A 1998, 41, 280–286. [Google Scholar] [CrossRef]
Figure 1. Micrographs from metallographical analysis on cross sections in the longitudinal direction for 1.4460 (left) and 1.4462 (right) etched with Beraha II etchant. The bright areas correspond to the austenite phase.
Crystals 12 01378 g001
Figure 2. Initial textures represented by the back-calculated pole figures. The x- and y-axes correspond to the transverse directions of the sample. The normal direction (z-axis) corresponds to the longitudinal direction of the sample and was parallel to the load direction in the tensile test. The upper two rows show the phase-specific texture in the sample cross-section for 1.4462 duplex stainless steel. The lower two rows, on the other hand, show that for the 1.4460 duplex stainless steel. Pole figures of four different lattice planes were recalculated from the phase-specific ODFs for both duplex stainless steels. The axis label correlates with the intensity distribution in relation of a random density distribution of the recalculated pole figure. The legend was scaled to 4 regardless of the present maximum intensity to allow for the recognition of small texture gradients. In addition, the pole-figure-specific maximum and minimum values of the recalculated intensity distribution were plotted together with each individual pole figure.
Crystals 12 01378 g002
Figure 3. EBSD investigation of the 1.4462 duplex stainless steel and the Taylor factors derived from the EBSD data for the different slip systems. (A) The Taylor factor and the orientation of the slip system for the austenite phase.(B) The phase distribution in the investigated area. The represented load direction corresponds to the load direction applied in the neutronographic in situ tensile test. For both phases, the Taylor factor M (global and {hkl}-specific) was determined using MTEX [31]. (C) The same for the ferrite phase. (DF) Separate similar results for the three possible slip systems in the bcc ferrite phase.
Crystals 12 01378 g003
Figure 4. Sample geometry for in situ diffraction analysis during uniaxial tensile loading.
Crystals 12 01378 g004
Figure 5. Experimental set-up used at SALSA for the in situ diffraction experiment during uniaxial tensile loading for the longitudinal component.
Crystals 12 01378 g005
Figure 6. Stress–strain curves from continuous testing using a standardised tensile test (the curves with the designation ‘laboratory’ were added as benchmark data) from interrupted testing performed during the in situ diffraction experiment at SALSA with a relaxation-driven stress–strain decrease in each step.
Crystals 12 01378 g006
Figure 7. Evolution of the phase-specific texture in the two studied duplex steels represented by a section at φ 2 = 45° through the ODF. In addition, the previously achieved maximum degree of deformation in % total strain is indicated in each case. All figures are scaled similarly. (AF) The phase-specific texture evolution in the 1.4462 duplex stainless steel. The results for the austenite phase are presented in (AC) and for the ferrite phase in (DF), respectively. (GL) The corresponding results for the 1.4460 duplex stainless steel. Again, the ODF sections are presented separately for the austenite phase (GI) and the ferrite phase (JL). In (M), the main texture components are highlighted for clarification.
Crystals 12 01378 g007
Figure 8. Evolution of lattice strain vs. applied load stress for the austenite phase in both duplex stainless steels. (AC) Duplex stainless steel 1.4462; (DF) steel 1.4460.
Crystals 12 01378 g008
Figure 9. Evolution of lattice strain vs. applied load stress for the ferrite phase in both duplex stainless steels. (AC) Duplex stainless steel 1.4462; (DF) steel 1.4460.
Crystals 12 01378 g009
Figure 10. The {hkl}-specific (residual) strain when unloaded to 5 MPa above the previously applied load stress. (AC) Duplex stainless steel 1.4462; (DF) steel 1.4460.
Crystals 12 01378 g010
Figure 11. Phase-specific stress vs. load stress in the relaxed state after unloading for both stainless duplex steels. (A) Duplex stainless steel 1.4460; (B) duplex stainless steel 1.4462. In (A), a phase content of α70:30γ was assumed, and in (B), α50:50γ was assumed. The macro stress in blue was calculated via the nominal volume content. The black line represents the direct relationship between the applied load stress and the calculated stress. The dashed line corresponds to a smoothed curve of the phase-specific stresses.
Crystals 12 01378 g011
Figure 12. Phase-specific load partitioning based on the duplex stainless steel 1.4462. Shown are the discrete stress values from the experiment and an estimated curve that can be used to understand the changing load distribution. Range 1: both phases behaved elastically. Range 2: plastic deformation of the austenite phase, elastic behaviour of the ferrite phase. Range 3: elasto-plastic behaviour of both phases.
Crystals 12 01378 g012
Table 1. Chemical composition of the 1.4462 [29] and 1.4460 [28] duplex steels according to the supplier’s data sheet (balance: Fe). All values are according to DIN EN 10088-3 [30] in mass %.
Mat.-No.CSiMnPSCrMoNiN
1.44620–0.030–1.00–2.00–0.0350–0.01521.0–23.02.5–3.54.5–6.50.1–0.22
1.44600–0.050–1.00–2.00–0.0350–0.0325.0–28.01.3–2.04.5–6.50.05–0.20
Table 2. Parameters applied for data evaluation. Young’s modulus and Poisson’s ratio for the austenite phase (γ-Fe) according to [35] and for the ferrite phase (α-Fe) according to [34].
γ{220}γ{222}γ{311}α{220}α{211}
E h k l , p /MPa212,758259,167177,329219,911219,911
E p /MPa192,116206,002
υ p /-0.3280.294
Publisher’s Note: MDPI stays neutral with regard to jurisdictional claims in published maps and institutional affiliations.

