Abstract
MII3(TeIVO3)2(OH)2 (M = Mg, Mn, Co, Ni) compounds crystallize isotypically in the hexagonal space group P63mc (No. 186) with unit-cell parameters of a ≈ 13 Å, c ≈ 5 Å. In the crystal structure, a framework with composition M3(TeO3)2(OH)1.50.5+ defines large hexagonal channels extending along [001] where the remaining OH− anions are located. Crystal-growth studies under mild hydrothermal conditions with subsequent structure analyses on basis of X-ray diffraction methods revealed that parts of other anions present in solution such as CO32−, SO42−, SeO42−, NO3−, Cl− or Br− could partly replace the OH− anions in the channels. The incorporation of such anions into the M3(TeO3)2(OH)2 structure was confirmed by energy-dispersive X-ray spectrometry (EDS) measurements and Raman spectroscopy of selected single-crystals.
1. Introduction
The manganese(II) oxidotellurate(VI) phase with composition MnII3TeVIO6 exhibits complex magnetic behaviour. Its ambient-pressure phase is characterized by an incommensurate magnetic ordering [1,2], and its high-pressure phase by magnetic frustration [3]. The magnetic structure of the manganese(III) oxidotellurate(VI) with composition MnIII2TeVIO6 was established on the basis of a neutron powder diffraction study [4]. This phase gained renewed interest because it is considered a possible multiferroic [5]. On the other hand, magnetic properties of manganese(II) oxidotellurates(IV), for which numerous phases have been reported [6,7,8,9,10,11], are not well-investigated and restricted to the high-pressure polymorph β-MnIITeIVO3 [12,13]. This lack of knowledge is most probably caused by difficulties to synthesize the corresponding manganese(II) oxidotellurates(IV) as single-phases for magnetic bulk measurements or for neutron diffraction studies. With the objective to prepare different phases in the MnII/TeIV/O/(H) system in the form of single-phase material, we started systematic studies of the phase formation in this system using solid-state or hydrothermal reactions. Although we were eventually able to grow single-crystals and to determine the crystal structures of α-MnTeO3, γ-MnTeO3, Mn6Te5O16, Mn15(TeO3)14(OH)2 and Mn3(TeO3)2(OH)2, the intended phase purity could not be achieved because all products consisted of mixtures of different phases [14].
Whereas the results of single-crystal structure analyses were inconspicuous for α-MnTeO3, γ-MnTeO3, Mn6Te5O16 and Mn15(TeO3)14(OH)2 [14], those of the channel-structure of hexagonal Mn3(TeO3)2(OH)2 revealed some unsatisfactory features of the refined crystal structure model, in particular, high remaining electron densities located within the channels. Preliminary experiments indicated that the height of the remaining electron density depends on the metal salt used as the source for manganese(II) in the hydrothermal experiment, and that corresponding anions (CO32−, SO42−, SeO42−, NO3−, Cl−, Br−) can be incorporated into the channels where they partly substitute the prevalent OH− species. Substitution of OH− by other anionic species is not uncommon and observed in several minerals, for example, apatites [15] or defernite [16], and thus of general interest.
In the current report, we present the results of partial OH− substitution investigated systematically for Mn3(TeO3)2(OH)2 and, to a certain extent, for the other isotypic members of the MII3(TeO3)2(OH)2 family of compounds (M = Mg, Co, Ni).
2. Materials and Methods
2.1. Synthesis
The crystal-growth procedures for all batches were conducted under hydrothermal conditions using Teflon containers with an inner volume of ca. 3 mL. The corresponding educt mixture, consisting of commercially available chemicals, was placed inside the container, which was subsequently filled to about ⅔ of its inner volume with water or 15%wt ammonia solution. After closing the container with a Teflon lid, the reaction vessel was enclosed in a steel autoclave, heated to temperatures of 200 or 210 °C, kept at the chosen temperature under autogenous pressure for several days and then cooled to room temperature within three hours by removing the autoclave from the oven. The solid material obtained after the reaction time was filtered off through a glass frit, washed with mother liquor, water and ethanol and dried in air. Details of selected batches are given in Table 1. Crystals suitable for single-crystal X-ray diffraction studies were obtained from most of these experiments.

Table 1.
Details for selected hydrothermal experiments to investigate foreign anion inclusions into M3(TeO3)2(OH)2 phases.
2.2. Diffraction Measurements and Crystal-Structure Refinements
Powder X-ray diffraction (PXRD) measurements were performed on a PANalytical X´Pert II Pro type PW 3040/60 diffractometer (Malvern Panalytical Ltd., Malvern, UK) using Cu-Kα1,2-radiation and an X’Celerator detector. For phase analysis and refinements of unit-cell parameters, the Highscore+ software suite was used [17].
Single-crystal X-ray diffraction studies were conducted on a Bruker Kappa Apex-II single crystal diffractometer (Bruker AXS Inc.: Madison, WI, USA) using graphite-monochromatized Mo-Kα-radiation equipped with a CCD area detector. Instrument software (APEX3, SAINT [18]) was used for optimized measurement strategies and data reduction. The intensity data were corrected for absorption effects with SADABS [19]. The crystal structures were solved with SHELXT [20], refined with SHELXL [21] and graphically represented with ATOMS [22].
The atom labels were assigned in accordance with the structure of isotypic Co3(TeO3)2(OH)2 [23]. Refinement of the framework structure including the metal position M1 and atoms Te1, Te2, O1–O4 was straightforward. In some cases, the H1 atom attached to O4 could be located from difference-Fourier maps and was included in the model with soft restraints on the O–H bond length (O–H = 0.9(1) Å). Smeared electron-density peaks originating from occupationally disordered sites located in large hexagonal channels characterize the remaining part of the crystal structures. Except for Co3(TeO3)2(OH)2 and Mn3(TeO3)2(OH)2 obtained from batch 2 and 3, respectively, which were modelled with full occupancy of O5 (belonging to the OH group), in all other crystal-structure refinements, the presence of additional anions in the channels was considered for modelling. The site occupation factor (s.o.f.) of the heaviest element (S, Se, Cl, Br) was refined freely until convergence and then fixed. For SO42− and SeO42− groups, the corresponding s.o.f.s of participating O atoms were adapted to this value, and the s.o.f. of O5 constrained to fulfil the criterion of electroneutrality. Although it is known that the (refined) occupancy correlates with the displacement parameters, we used this approach for simplicity. H atoms associated with the OH group in the channels could not be located and were not modelled but are considered in the formula and other crystallographic data. Crystal structure and refinement data are compiled in Table 2. Further details of the crystal structure investigations may be obtained from the joint CCDC/FIZ Karlsruhe online deposition service: https://www.ccdc.cam.ac.uk/structures/ (accessed on 30 August 2022) by quoting the deposition numbers specified at the end of Table 2.
Table 2.
Data collection and refinement details.
Numerical data of the related phases Co3(TeO3)2(OH)2 from batch 2 (apparent NO3− inclusion not modelled), Co3(TeO3)2(OH)1.5{(SO4)0.12(OH)0.26} from batch 1, Mn3(TeO3)2(OH)1.5{Cl0.18(OH)0.32} from batch 8, and Mn3(TeO3)2(OH)1.5{(SO4)0.15(OH)0.20} from batch 10 (with different modelling of the sulfate group in the channels) and their respective CSD deposition codes can be found in the Supplementary Material (Tables S1 and S2).
2.3. Energy-Dispersive X-ray Spectrometry (EDS)
Semiquantitative chemical analysis of carbon-coated, mechanically separated crystals was carried out using a JEOL JSM-6610LV (JEOL Ltd., Tokyo, Japan) scanning electron microscope (SEM) equipped with a high-sensitivity and high-resolution energy-dispersive X-ray spectrometer (Bruker e-FlashHR+; detector area 30 mm2, resolution 127 eV) and Bruker Esprit 2.0 software (Bruker Nano GmbH, Berlin, Germany). Each spectrum was measured with an accelerating voltage of 15 kV for 60 s. No beam damage was noted. Several years of experience with this set-up show that the performed standardless analyses allow the derivation of chemical formulae that differ only 2–10% from the ideal formulae.
2.4. Raman Spectroscopy
Raman spectra were measured on randomly oriented crystals using a confocal micro-Raman spectrometer Renishaw RM1000 (Renishaw plc, Gloucestershire, UK) equipped with a 17 mW HeNe laser (632.8 nm) for excitation, an ultra-steep edge filter set facilitating measurements as close as >40 cm−1 to the Rayleigh line, a Leica DLML microscope (Leitz, Wetzlar, Germany) with a 50×/0.75 objective, a 1200 lines/mm grating in a 300 mm monochromator and a thermo-electrically cooled CCD detector. The entrance slit and CCD readout were set to quasi-confocal mode. The resolution of the system (apparatus function) was 3–4 cm−1, and the Raman shift of the instrument was calibrated by the Rayleigh line and the 520.5 cm−1 line of a Si standard. Spectra were acquired over 120 s to obtain a good signal-to-noise ratio. Full laser power (100%) could be used for crystals from batches 4, 8 and 9, whereas the Co-compounds from batches 1 and 2 required attenuation of the laser to 25% and 10%. The spectral range was extended from 4000 to −20 cm−1 in order to include the Rayleigh line as an internal standard. Instrument set-up and control were controlled with Grams32 software. Baseline handling and peak-fitting with Lorentz-peaks were done using the program fityk [26] using the Levenberg-Marquardt algorithm.
3. Results and Discussion
3.1. Synthesis
M3(TeO3)2(OH)2 compounds with M = Ni, Co are known and have been prepared hydrothermally from MO and TeO2 in diluted HCl solution at 380 °C and 900 bar [23]. Under these conditions, an inclusion of Cl− likewise appears to be possible, but chemical analysis showed no amount of Cl in the crystals [23]. During the current study, we have worked under considerably lower temperatures and autogenous pressures for the hydrothermal set-up, but under alkaline conditions, because otherwise the solubility of TeO2 is not sufficient at the given temperature-pressure conditions.
Just as it was the case for the intended preparation of single-phase material in the MnII/TeIV/O/(H) system [14], phase purity could not be achieved during the current study for preparation of M3(TeO3)2(OH)2 (M = Mg, Mn, Co, Ni) compounds. In all batches, phase mixtures were obtained, as revealed by phase analysis on basis of PXRD data (see Supplementary Material, Figure S1). All batches compiled in Table 1 at least yielded M3(TeO3)2(OH)2-type phases as byproducts, frequently in form of prismatic hexagonal crystals (Figure 1). The refined composition of crystals from the different batches is provided in Table 2. Due to the distinct hexagonal prismatic form of the M3(TeO3)2(OH)2-type crystals, the PXRD pattern of the bulk show strong texture effects (Figure S1).
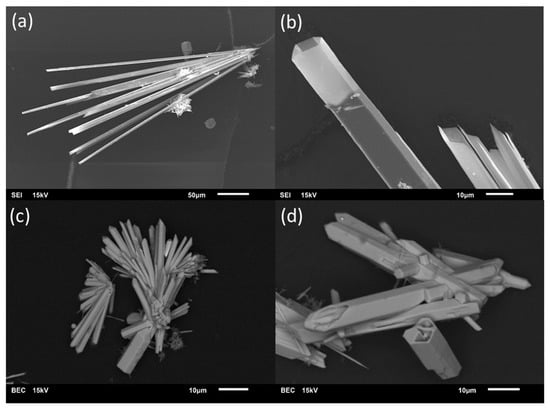
Figure 1.
Representative for the entire MII3(TeO3)2(OH)2-type series (M = Mg, Mn, Co, Ni), SEM photographs of Mg3(TeO3)2(OH)1.5{(SO4)0.2(OH)0.10} (a,b) and of Mn3(TeO3)2(OH)1.5{Cl0.18(OH)0.32} (c,d) show the characteristic hexagonal prismatic form of the crystals. The crystals frequently aggregate in sprays and have hollow terminations, suggesting growth under conditions of local oversaturation. The images are either secondary electron images (SEI) or backscattered electron contrast (BEC) images.
Next to other known phases in variable yields, e.g., M2Te3O8 [11] and MTe6O13 [9,27] as main phases, the non-reacted educt TeO2 and M3O4 phases (M = Co, Mn) together with elemental Te were sometimes found in the product mixtures. In several batches, also some reflections in the PXRD pattern could not be assigned during phase analysis, indicating the presence of yet unknown phases. Similar problems for preparation of single-phase material were reported for Co3(TeO3)2(OH)2·~0.45 H2O under similar hydrothermal conditions [28]. The high number of adjustable and interdependent parameters such as molar educt ratio, concentration, temperature, duration, pH value, etc., causes this behaviour. Thus, these parameters need to be varied and optimized for each batch, which, in most cases, is a laborious undertaking [28].
The presence of phase mixtures precluded bulk measurements such as thermogravimetry as a complementary analytical method for confirmation of the chemical composition, here in particular with respect to the amount of OH− and/or water, and NO3− or CO32− in the crystals. Thus, analyses of the chemical composition with respect to additionally incorporated groups, as refined in the respective crystal structure models, were performed with selected single crystals of the MII3(TeO3)2(OH)2 series and are based upon SEM-EDS measurements and Raman spectroscopy.
3.2. Crystal Structures
The phases with idealized composition MII3(TeO3)2(OH)2 (M = Mg, Mn, Co, Ni) crystallize isotypically in the non-centrosymmetric hexagonal space group type P63mc. Hydrothermally synthesized Co3(TeO3)2(OH)2 and Ni3(TeO3)2(OH)2 have been reported as the first representatives of the M3(TeO3)2(OH)2 family, with the crystal structure determined on basis of single-crystal X-ray data. Since the M3(TeO3)2(OH)2 structure type has already been described in detail [23], here only the most important aspects of the crystal structure are given.
The asymmetric unit of the M3(TeO3)2(OH)2 structure type comprises ten atoms. Atom O5, which is part of an OH group, is located on a site with site symmetry 3m. (multiplicity 2, Wyckoff letter a), Te2 likewise is situated on a site with symmetry 3m. (2 b), Te1, O1, O3, O4 (that is also part of an OH group) and H1 on sites with symmetry .m. (6 c), and M1 and O2 are located on the general position (12 d). So far, the position of the H atom bonded to O5 remains undetermined.
In the M3(TeO3)2(OH)2 structure type, the two isolated trigonal-pyramidal [TeO3] units, each described with Q3000 in the notation of Christy et al. [29], and [MO4(OH)2] octahedra share common corners and edges, thus forming a framework structure with the composition MII3(TeO3)2(OH)1.50.5+. The Te–O bond lengths range between 1.8 and 1.9 Å, which is characteristic for isolated [TeO3] groups [29]; secondary Te–O bonds typically associated with more distant O atoms situated between 2.7–3.5 Å [29] are found for Te1 (≈3.0 Å), but not for Te2. The M–O bond lengths likewise are in the usual ranges (Table 3) for six-coordinate metal cations MII (Mg: 2.089 Å [30]; Mn: 2.199 Å; Co: 2.108 Å; Ni: 2.070 Å [31]) and differ mainly due to the size of the MII cation (ionic radii [32] for coordination number 6: 0.72 Å for Mg, 0.83 Å for Mn (high-spin configuration), 0.745 Å for Co (high-spin configuration) and 0.69 Å for Ni). Within the framework structure, only weak hydrogen-bonding interactions [33] between the OH donor group and the O3 acceptor atom exist, with O4 · O3 distances in the range between 3.10 [28] and 3.13 Å (Table 3). The 5s2 lone-pair electrons (E) situated at the TeIV atoms are stereochemically active [34] and point to the free space of the structure, i.e., parallel to trigonal channels for Te2 and to the centre of large hexagonal channels for Te1. Both types of channels extend parallel to [001]. The remaining OH− counter anions associated with O5 are accommodated in the centre of the large hexagonal channels. The diameter of these channels amounts to ≈6.5 Å when the space requirement of the lone-pair electrons E situated at Te1 is neglected, and to ≈4.6 Å when considered. Thus, O5 has no framework oxygen atoms within typical interaction distances for classical hydrogen bonding (shortest O · O distance ≈4.1 Å to O2). Therefore, it appears likely that O5 shows weak bonding interactions to the surrounding lone-pair electrons E of the [Te1O3] units, as has been discussed for apparent stabilizing E · X interactions in the cubic M3Te2O6X2 (M = Sr, Ba; X = Cl, Br) structure family where the X− anions are likewise located in large channels without notable interactions to the surrounding framework [35].
Table 3.
Selected interatomic distances/Å in the crystal structures of M3(TeO3)2(OH)1.50.5+{(Xx/n)(OH)0.5−x}0.5− (0.5 ≤ x ≤ 0) compounds.
However, the distance between symmetry-related O5 atoms within the channels is ≈ 2.57 Å, which points to rather strong possible hydrogen-bonding interactions [33] along the channel direction. The principal set-up of the M3(TeO3)2(OH)2 structure type is given in Figure 2. As depicted in Figure 2a, the O5 atom exhibits a very large Ueq parameter. If O5 is refined with anisotropic displacement parameters (ADP), a pronounced displacement in form of elongated ellipsoids along the channel direction is observed (Figure 2b). The reason for this behavior is obvious, since O5 is not directly linked to the framework but shows strong interactions only to its symmetry-related counterparts along the channel direction. Aside from that, the large displacement parameter of O5 indicates a possible disorder around the position with 3m. site symmetry. This feature was observed for all M3(TeO3)2(OH)2-type crystals, irrespective of the batch or the two measurement temperatures (RT and −173 °C). Hence, this disorder appears to be characteristic for the M3(TeO3)2(OH)2 structure type. All attempts to model this kind of disorder by introducing split positions led to unsatisfactory results, and O5 was eventually modelled with only one site and a large displacement parameter.
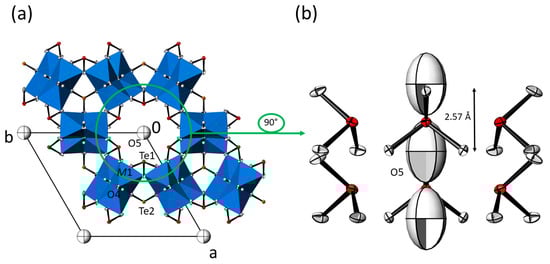
Figure 2.
(a) Crystal structure of the isotypic M3(TeO3)2(OH)2 family of compounds (data from Mn3(TeO3)2(OH)2) in a projection along the hexagonal axis. [M1O6] octahedra (blue) are given in the polyhedral representation, and displacement ellipsoids are drawn at the 90% probability level; except O5 refined with isotropic displacement parameters, all other non-H atoms were refined with anisotropic displacement parameters. (b) The content of the hexagonal channel with surrounding [Te1O3] units and the O5 atom in the centre; all atoms are displayed with anisotropic displacement parameters at the 90% probability level. The indicated distance refers to adjacent O5 sites.
Dependent on the employed metal salt as the MII source, additional high remaining positive electron densities were noticed within the channels in the vicinity of O5. Using SO42−, SeO42− or X− (X = Cl, Br) as anion groups of the metal salt, the remaining but smeared electron densities were much higher than in the case of CO32− or NO3− as counter anions. In fact, for the crystals grown from metal sulfate, selenate or metal halide solutions, SO42− and SeO42− groups (using restraints on the S–O or Se–O distances) and X− (X = Cl, Br) anions, respectively, could be modelled. Difference maps, representative of the entire MII3(TeO3)2(OH)2-type series, are shown for Mn3(TeO3)2(OH)1.5{(SO4)0.15(OH)0.20} in Figure 3.
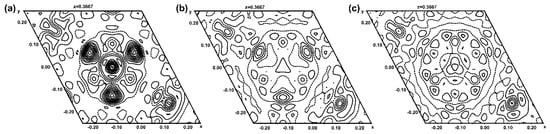
Figure 3.
Difference contour maps showing an intersection perpendicular to the channel direction at the centre of the channel and with a height of z = 0.3667. Contour lines are shown at intervals of 0.2 e− Å−3 with cut-offs for minimum and maximum values of −1.5 and 3.0 e− Å−3, respectively. In (a), only O5 is modelled in the channel, and positive electron density (continuous lines) at the centre (S atom) and from three surrounding O atoms is clearly visible. The remaining electron density nearly vanishes by modelling the sulfate group with one S and two O sites in (b) (see Figure 4), or with one S and three O sites in (c) (see Supplementary Material, Figure S2).
Like the O5 atom of the OH− group, the additional anions present in the channels are situated on the 63 screw axis. Interdependent from each other, the corresponding anions present in the channels are occupationally disordered with the OH− group and are characterized by likewise large displacement parameters (Figure 4 and Figure 5). Again, this feature is indicative of further disorder of the incorporated groups, and most probably interrelated with the (non-modelled) positional disorder of O5. This is a typical case, where single crystal diffraction reveals its inherent limitations, leading to an averaged (and idealized) picture over the entire crystal. Nevertheless, modelling of incorporated XO42− groups for M = Mg, Co and Ni with X situated on the 63 screw axis (2 a; site symmetry 3m.), O5 as one vertex and O6 situated on a mirror plane (6 c; .m.) together with its two symmetry-related O6′ and O6″ vertex atoms led to a satisfying tetrahedral shape. In the case of M = Mn, the X site is situated at the same height (in z) as the three O6 atoms, resulting in an unrealistic trigonal-planar arrangement with an additional capping O5 atom (Figure 4b). Splitting O5 into two further positions (O7, O8) on the mirror plane resulted in a more realistic tetrahedral arrangement but with a tilted orientation of the disordered XO42− group relative to the 63 axis (see Supplementary Material, Figure S2).
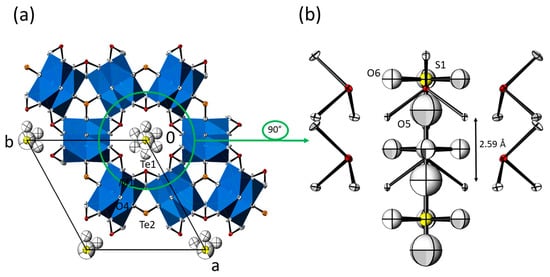
Figure 4.
(a) Crystal structure of the M3(TeO3)2(OH)2 family of compounds with additional SO42− ions in the hexagonal channels (data from Mn3(TeO3)2(OH)1.5{(SO4)0.15(OH)0.20}). Displacement ellipsoids are drawn at the 90% probability level (isotropic for O5 and the sulfate group; anisotropic for all other atoms). (b) The content of the hexagonal channel with surrounding [Te1O3] units, and the O5 atom and the sulfate group in the centre. The indicated distance refers to adjacent O5 sites.
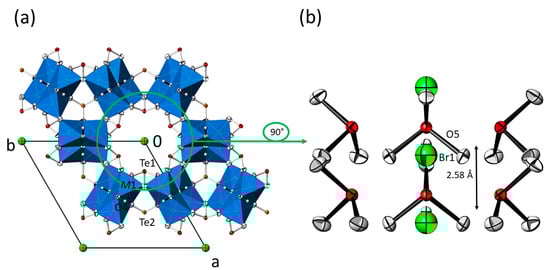
Figure 5.
(a) Crystal structure of the M3(TeO3)2(OH)2 family of compounds with additional X− ions in the hexagonal channels (data from Mn3(TeO3)2(OH)1.5{Br0.18(OH)0.32}). Displacement ellipsoids are drawn at the 90% probability level (isotropic for O5 and Br1; anisotropic for all other atoms). (b) The content of the hexagonal channel with surrounding [Te1O3] units, and the O5 site and the Br1 site in the centre. The indicated distance refers to adjacent O5 sites.
For the lighter CO32− or NO3− anion groups, modelling of their presence in the hexagonal channels did not lead to satisfactory results, although the existence of these groups is indicated by peaks of small remaining positive electronic densities more than 1 Å away from the hexagonal axis, and evidenced by spectroscopic measurements, as discussed below. A special case pertains to the use of CoSeO4 as the CoII source for growth of Co3(TeO3)1.6(SeO3)0.4(OH)1.5{(SeO4)0.18(OH)0.14} crystals. Similar to the sulfates, small amounts of occupationally disordered SeO42− groups then are incorporated within the hexagonal channels. In addition, SeO32− anion groups exclusively substitute most parts of the [Te2O3] units in the framework structure (occupation ratio Se2:Te2 = 0.80(3):0.20(3)), as can be seen by the considerably shortened (Se,Te)2–O distances of 1.750(15) Å in comparison with the typical Te–O distance (Table 3). The [Te1O3] unit, however, is not substituted in the present case, and the corresponding Te1–O distances are normal, indicative of a clear preference of Se for the Te2 site. Hydrothermal synthesis and crystal structure refinement (based on PXRD data) were reported for the pure end-member Co3(SeO3)2(OH)2 [36]. This phase likewise adopts the M3(TeO3)2(OH)2 structure type where the SeO32− groups replace the TeO32− groups. The presence of such SeO32− groups in Co3(TeO3)1.6(SeO3)0.4(OH)1.5{(SeO4)0.18(OH)0.14}, however, requires a partial reduction of the employed SeVIO42− to SeIVO32−. Such a situation is not uncommon for hydrothermal syntheses where different (unwanted) redox reactions can occur between the constituents, frequently leading to phase mixtures. As noted in Section 3.1., mixed-valent M3O4 phases were identified in some of the batches. The MII cations, partially oxidized to MIII cations, may react as a reductant for SeVI.
The influence of the type of incorporated anion or (hypothetically) also of water on the unit-cell parameters was examined on the basis of single-crystal and powder X-ray diffraction measurements, neglecting different measurement temperatures. Experience shows that the volume of the unit-cell is about 1–2% smaller at −173 °C than at room-temperature, provided that no phase-transformations occur. Corresponding unit-cell parameters for Co- and Mn-containing phases and of Co3(TeO3)2(OH)2 and Co3(TeO3)2(OH)2·~0.45H2O as references are collated in Table 4. The unit-cell parameters of Co3(TeO3)2(OH)2 are considerably smaller than those of its slightly hydrated form. The unit-cell parameters of the Co3(TeO3)2(OH)2 phases with additional incorporated anions (SO42−, NO3−) lie between those of the two forms. In order to rule out possibly incorporated crystal water molecules inside the channels, the powder samples from batch 1 and 2 were heat-treated at 210 °C for three days and measured again directly afterwards (see Supplementary Material, Figure S1). The temperature of 210 °C should be sufficient for the release of potential crystal water, as for Co3(TeO3)2(OH)2·~0.45H2O the evaporation of water molecules is reported to start at 100 °C and to be finished around 195 °C based on Raman, TGA and MS analyses [28]. For the present samples, a significant change of the unit-cell parameters before and after heat-treatment was not observed, demonstrating that crystal water was not present in the samples and that the incorporated anions cause the increase of the unit-cell volume relative to Co3(TeO3)2(OH)2.
Table 4.
Unit-cell parameters of samples to investigate foreign anion inclusion into M3(TeO3)2(OH)2 phases. Batch numbers refer to Table 1.
For the Mn-compounds obtained from batches 3–9, a clear dependence of unit-cell parameters from incorporated anions is difficult to deduce because a reference material without additional anions, like for Co3(TeO3)2(OH)2, has not been reported so far. From the given data, it can be seen that the unit-cell volumes of samples with CO32−, Cl− or Br− as possible additional anions are very similar. Only for samples from batches 6 and 7 containing the considerably bigger SO42− anion groups, a significant increase of the unit-cell volume is noticed. On the other hand, the data for batch 5 with SO42− and CO32− simultaneously present in the reaction mixture suggest that only a minor amount of sulfate, if any, is incorporated in the crystals, indicating a preferred incorporation of CO32− over SO42− anion groups.
However, the diameter of the hexagonal channel in the M3(TeO3)2(OH)2 structure type, as calculated from opposite Te⋯Te distances at the same height, correlates with the size of the incorporated foreign group (radius OH− = 1.33 Å, Cl− = 1.72 Å, Br− = 1.88 Å, SO42− = 2.58 Å, SeO42− = 2.49 Å [37]; H2O = 1.35 Å [38]. Due to this effect, the channel diameter increases from 6.412 Å in Co3(TeO3)2(OH)2 [23] upon incorporation of water to 6.604 Å in Co3(TeO3)2(OH)2·~0.45H2O [28], to 6.535 Å in Co3(TeO3)2(OH)1.5{(SO4)0.12(OH)0.26}, or to 6.526 Å with additional oxidoselenate(VI) anions in the channels in Co3(TeO3)1.6(SeO3)0.4(OH)1.5{(SeO4)0.18(OH)0.14} (this work). In comparison with the incorporation of water, the bigger size of the oxidoselenate(VI) anion suggests also a larger size of the channel diameter. However, in Co3(TeO3)1.6(SeO3)0.4(OH)1.5{(SeO4)0.18(OH)0.14} parts of the [Te2O3] groups in the framework structure are substituted by smaller SeO32− anions, which makes the framework itself smaller and thus is not suitable for direct comparison The above mentioned trend can also be seen when additional sulfate anions are hosted in the channels, with a resulting increase of the channel diameter from 6.459 Å in Ni3(TeO3)2(OH)2 [23] to 6.477 Å in Ni3(TeO3)2(OH)1.5{(SO4)0.2(OH)0.1} (this work), and is obvious for the series Mn3(TeO3)2(OH)2 (6.538 Å), Mn3(TeO3)2(OH)1.5{Cl0.18(OH)0.32} (6.553 Å), Mn3(TeO3)2(OH)1.5{Br0.18(OH)0.32} (6.578 Å), and Mn3(TeO3)2(OH)1.5{(SO4)0.15(OH)0.20} (6.617Å).
3.3. EDS
Since no internal calibration was conducted for the individual SEM-EDS measurements, the absolute values of the determined atomic contents are of less significance, but at least semi-quantitative deductions can be made from each measurement. The light elements N and C were below EDS detection limits in all cases; H atoms were not considered for the determined composition (in %at).
For the hexagonal prismatic crystals of the Co-compounds obtained from batches 1 and 2 (employed salts: CoSO4·7H2O and Co(NO3)2·6H2O), various point analyses on two different crystals revealed an average Co:Te atomic ratio (ideal 1.5) of 1.56 for batch 1 and 1.54 for batch 2, respectively. The averaged sulfur content was determined to 1%at for crystals of batch 1 (expected value for the refined composition Co3(TeO3)2(OH)1.5{(SO4)0.12(OH)0.26} = 0.9%at).
Crystals from batches 8 and 9 (employed salts: MnCl2 and MnBr2) consisted of rather large hexagonal prisms (Figure 1c,d). For both samples, an Mn:Te ratio slightly below the expected value of 1.5 was determined, viz. 1.38 for crystals from batch 8 (averaged from four measurement points) and 1.37 for sample 9 (averaged from five measurement points). The determined averaged halogen content of 2.8%at Cl and 3.1%at Br is significantly higher than that in the refined composition from single-crystal diffraction data (Mn3(TeO3)2(OH)1.5{X0.18(OH)0.32}; X = Cl, Br; ideal 1.4%at). Crystals from batch 7 (employed salt: MnSO4) had the form of small hexagonal needles. An Mn:Te ratio of 1.43 on average from three measurement points and a sulfur content of 1.5%at (ideal 1.1%at for the refined composition Mn3(TeO3)2(OH)1.5{(SO4)0.15(OH)0.20}) were determined. SEM-EDS analyses of the crystals from batches 3 and 5 (employed salts: MnCO3 and MnSO4 in a K2CO3 solution) revealed no presence of heavy elements other than Mn and Te in ratios of 1.48 and 1.54 (from two and three measurement points on different crystals). Therefore, it can be deduced that CO32− ions are preferably incorporated compared to SO42− ions, if both are present in the solution (as in batch 5).
The colourless crystals from batch 13 (Figure 1a,b), obtained from a multi-metal mixture (employed salts: NiO, Fe(NO3)3·9H2O, Mg(OH)2), showed only the presence of Mg as the metal. Again, the Mg:Te ratio of 1.38 averaged from five measurement points is in fair agreement with the ideal value of 1.5. Although the employed salts were free from sulfur, this element was clearly detected in the EDS measurement, albeit with a much lower amount of 0.4%at than expected (1.5%at for an assumed composition of Mg3(TeO3)2(OH)1.5{(SO4)0.2(OH)0.1}). We suspect that the sulfur source originates from a polluted Teflon container that had been used in the series of batches (including sulfates) conducted during the present study. It should also be noted that in some of the EDS analyses Na and Si were detected in very small amounts of ≈1%at. We can only speculate about the origin of these elements. Insufficient washing of crystals grown in NaOH-containing solutions and abrasion from glass containers are probable sources.
3.4. Raman Spectroscopy
Raman spectra of investigated samples from batches 1, 2, 4, 8 and 9 exhibit similar general features, with bands subdivided into three main groups. The O–H-stretching vibrations occur in the region 3600–3400 cm−1, bands originating from incorporated anions in the region 1100–900 cm−1, and bands from Te–O, M–O and lattice vibrations in the region below 800 cm−1.
Raman-spectra of the Co-compounds obtained from batches 1 (SO42− as counter anion) and 2 (NO3− as counter anion) in general show very similar band positions with one major exception in the range between 1100 and 900 cm−1 (Figure 6). The corresponding band in the crystal from batch 1 is at 971 cm−1 and does not appear in any of the other investigated samples from batches 2, 4, 8 and 9. This band corresponds to the symmetrical stretching vibration of the SO42− group and is comparable to the band at 981 cm−1 for Na2SO4 [39]. Crystals from batch 2, instead, exhibit a rather sharp Raman band at 1044 cm−1, corresponding to the symmetrical stretching mode of the NO3− group, which is at 1050 cm−1 for alkali metal nitrates [39]. Thus, this is a strong confirmation that SO42− and NO3− units, respectively, are incorporated in the hexagonal channels.
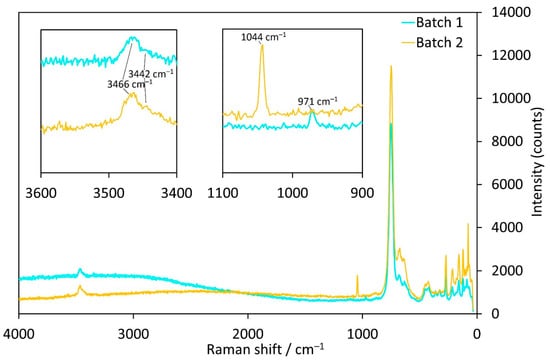
Figure 6.
Raman spectra of Co3(TeO3)2(OH)2 samples with incorporated SO42− (batch 1, cyan) or NO3− ions (batch 2, orange).
The Mn-samples from batches 8 (Cl− as counter anion) and 9 (Br− as counter anion) have almost the same Raman spectra (Figure 7). Between 3600 and 3500 cm−1, two OH-stretching vibrations are discernible with maxima around 3560 and 3515 cm−1. In contrast, the corresponding OH modes are at 3466 and 3442 cm−1 for batches 1 and 2 above (Figure 6). No bands corresponding to a foreign anion group were observed in the 1100–900 cm−1 region unlike for the crystals from batches 1 and 2. However, crystals from batch 4 (with CO32− as counter anion) show different bands in both of these characteristic ranges. The first band at 3560 cm−1 is distinctly weaker than for the crystals from batches 8 and 9. Given the fact that for four of the five investigated samples the band at higher Raman shifts is more intense than the neighbouring one except for batch 4 (CO32−), this indicates that the inclusion of CO32− influences the signal of one type of OH− groups in a different way than inclusion of Cl− or Br−. Furthermore, from the Raman spectra displayed in Figure 7, together with the results from SEM-EDS measurements of batches 8 and 9, we can assume that the channels are partially filled with both OH− groups and a foreign anion (Cl−, Br−, CO32−) in the single-crystals.
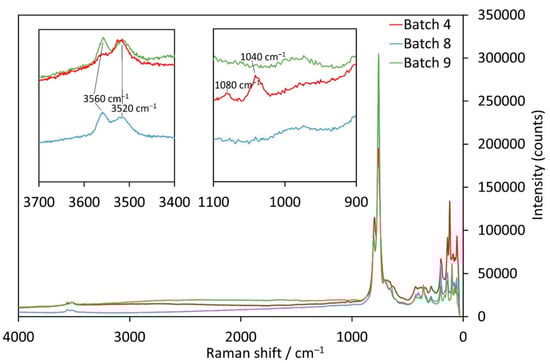
Figure 7.
Raman spectra of Mn3(TeO3)2(OH)2 samples with incorporated CO32− (batch 4, red), Cl− (batch 8, blue) or Br− ions (batch 9, green).
When looking for characteristic bands originating from the CO32− group itself, two bands between 1100 and 1000 cm−1 can be observed. The one with lower intensity at 1080 cm−1 fits perfectly with the symmetric stretch of a carbonate ion, like in Na2CO3 (1079 cm−1 [39]). On the other hand, the occurrence of the band with higher intensity at 1040 cm−1 is not so clear and might be caused either by the presence of a HCO3− group where the bands are shifted towards lower wavenumbers like in KHCO3 (1005 cm−1 [39]), or to possible weak bonding interactions involving the carbonate anion itself. Possible bonding partners are either the OH− groups inside the channels or the tellurium atoms directed towards the centre of the channel. As an interaction with the remaining hydroxide groups in the channels would most likely cause a shift of the 3560 cm−1 band (which is not observed), an interaction of the carbonate O atoms with the Te1 atoms is the most probable situation. It should be noted that a contamination by nitrate (the NO3− anion also matches the Raman shift) seems rather unlikely. The symmetrical nitrate band (crystals of batch 2) is much stronger and has a higher intensity than the one at 1040 cm−1 for the carbonate sample. Moreover, no reasonable contamination sources could be identified by phase analysis of the obtained bulk for the sample from batch 4.
Based on literature data for the [TeO3]2− group [40] and analyses of the Raman spectra of several oxidotellurate(IV) minerals [41,42,43], certain bands were assigned to the corresponding vibrational modes. A free [TeO3]2− ion has C3v symmetry, and four modes can be expected: ν1 (A1) = 758 cm−1, ν2 (A1) = 364 cm−1, ν3 (E) = 703 cm−1 and ν4 (E) = 326 cm−1 [41]. In the case of the M3(TeO3)2(OH)2 structure type, two different, isolated [TeO3]2− groups are present, corresponding to the Te1 and Te2 sites. Te2 has a site symmetry of 3m., which agrees with the C3v symmetry of the free [TeO3]2− anion and therefore only four bands should be expected. Te1 has site symmetry .m., therefore the given bands could be split. Furthermore, Te2 is bonded by the three oxygen atoms at closer distances than Te1. Hence, it can be expected that each of the aforementioned four modes can lead to two vibration bands, corresponding to the two different Te sites. Finally, also the specific M atom in M3(TeO3)2(OH)2–type compounds has an obvious influence on the position of the [TeO3]2− bands. For M = Co (batches 1, 2), the mean Te–O distances are slightly larger [1.897 Å (Te1), 1.859 Å (Te2) for batch 1 and 1.895 Å (Te1), 1.859 Å (Te2) for batch 2)] than for the M = Mn compounds [1.880 Å (Te1), 1.847 Å (Te2) for batch 8 and 1.880 Å (Te1), 1.851(9) Å (Te2) for batch 9)]. This difference exists despite the Co-compounds being measured at −173 °C and the Mn-compounds at room temperature.
The Mn-samples show two bands at 804–801 cm−1 and 762–760 cm−1, which correspond to the ν1 [TeO3]2− symmetric stretching mode of the Te1- and Te2-centred polyhedra, respectively. For the Co-samples, only one band is clearly visible in this range at 749 cm−1, although a very weak shoulder can be seen at around 795 cm−1. The bonds of the Co-samples appear at lower wavenumbers, in accordance with the aforementioned difference in Te–O bond lengths. The ν3 [TeO3]2− antisymmetric stretching mode (703 cm−1 for a free [TeO3]2− anion) can be observed at 688–679 cm−1 and 657–645 cm−1 for the Mn-samples, as well as 677–675 cm−1 and 635–629 cm−1 for the Co-samples. It should be noted that the range of the Raman shifts varies much more than for the ν1 modes because the corresponding bands have a much lower intensity and are rather broad.
Assigning the ν2 and ν4 bending modes is less straightforward, reflected also by the given literature values that are more ambiguous. Moreover, in this low-energetic spectral region vibrations of the [MO6] structural units and lattice modes occur. In most analyses of oxidotellurate(IV) minerals, the ν4 (E) [TeO3]2− bending modes were assigned between 400 and 500 cm−1 rather than in the neighbourhood of the 326 cm−1 of the free anion. If this is assumed to be the case for M3(TeO3)2(OH)2-type structures as well, then the bands at 428–426 cm−1 and 400–394 cm−1 for the Mn-compounds, and 454–452 cm−1 and 426–424 cm−1 for the Co-samples could be assigned. Finally, for the ν2 (A1) [TeO3]2− bending modes the bands at 362–357 cm−1 and 343–334 cm−1 (Mn) and 326 cm−1 and 362–359 cm−1 (Co) are considered as relevant.
4. Conclusions
Using complementary analytical methods (single-crystal and powder X-ray diffraction, energy-dispersive X-ray spectrometry, Raman spectroscopy), we could show that foreign anions such as Cl−, Br−, SO42−, SeO42−, CO32− or NO3− can be incorporated into the crystal structure of MII3(TeO3)2(OH)2 compounds (M = Mg, Mn, Co, Ni), where they partly substitute OH− anions in large hexagonal channels. The size of the incorporated foreign anion correlates with the size of the channel diameter and supports the refined structure model. Due to the large diameter of the channels, in all cases, the interaction of the disordered components in the channels with framework atoms is very weak, which causes high displacements from their ideal positions. In a more elaborated crystal-chemical scheme, the incorporation of monovalent or divalent anions or anionic groups X can be expressed by the general formula M3(TeO3)2(OH)1.50.5+{(Xx/n)(OH)0.5−x}0.5− (0.5 ≤ x ≤ 0; n = 1, 2) where the anionic part in curly brackets denotes the components situated in the channels.
Supplementary Materials
The following supporting information can be downloaded at: https://www.mdpi.com/article/10.3390/cryst12101380/s1, Table S1: Data collection and refinement details of related MII3(TeO3)2(OH)2-type compounds; Table S2: Selected interatomic distances/Å in the crystal structures of related MII3(TeO3)2(OH)2-type compounds; Figure S1: PXRD measurements of bulk material; Figure S2: Crystal structure of MnII3(TeO3)2(OH)1.5{(SO4)0.15(OH)0.20 with further disorder modelling of the sulfate group in the hexagonal channels.
Author Contributions
F.E.: Conceptualization; Investigation; Visualization; Data curation; Formal analysis; Writing—original draft; Writing—review and editing. M.W.: Conceptualization; Investigation; Visualization; Data curation; Resources; Supervision; Writing—original draft; Writing—review and editing. O.P.M.: Investigation; Data curation; Writing—review and editing. U.K.: Investigation; Data curation; Writing—review and editing. E.L.: Investigation; Data curation; Writing—review and editing. All authors have read and agreed to the published version of the manuscript.
Funding
Support funding was provided to OPM by an Australian Government Research Training Program (RTP) Scholarship, a Monash Graduate Excellence Scholarship (MGES) and a Monash–Museums Victoria Scholarship (Robert Blackwood).
Data Availability Statement
The data presented in this study are available in The Cambridge Crystallographic Data Centre (CCDC) and can be obtained free of charge via www.ccdc.cam.ac.uk/structures, accessed on 25 September 2022.
Acknowledgments
The X-ray Centre of TU Wien is acknowledged for providing access to the single-crystal and powder X-ray diffractometers. The authors thank Emma Ogden for help with the hydrothermal synthesis. The authors also acknowledge TU Wien Bibliothek for financial support through its Open Access Funding Programme.
Conflicts of Interest
The authors declare no conflict of interest.
References
- Ivanov, S.A.; Nordblad, P.; Mathieu, R.; Tellgren, R.; Ritter, C.; Golubko, N.V.; Politova, E.D.; Weil, M. New type of incommensurate magnetic ordering in Mn3TeO6. Mater. Res. Bull. 2011, 46, 1870–1877. [Google Scholar] [CrossRef]
- Ivanov, S.A.; Ritter, C.; Nordblad, P.; Tellgren, R.; Weil, M.; Carolus, V.; Lottermoser, T.; Fiebig, M.; Mathieu, R. New insights into the multiferroic properties of Mn3TeO6. J. Phys. D Appl. Phys. 2017, 50, 085001. [Google Scholar] [CrossRef]
- Arévalo-López, Á.M.; Solana-Madruga, E.; Aguilar-Maldonado, C.; Ritter, C.; Mentré, O.; Attfield, J.P. Magnetic frustration in the high-pressure Mn2MnTeO6 (Mn3TeO6-II) double perovskite. Chem. Commun. 2019, 55, 14470–14473. [Google Scholar] [CrossRef] [PubMed]
- Fruchart, D.; Montmory, M.C.; Bertaut, E.F.; Bernier, J.C. Structures magnétiques de Mn2TeO6 et V2WO6. Stabilité des modes magnétiques observés. J. Phys. 1980, 41, 141–147. [Google Scholar] [CrossRef][Green Version]
- Matsubara, N.; Damay, F.; Vertruyen, B.; Barrier, N.; Lebedev, O.I.; Boullay, P.; Elkaim, E.; Manuel, P.; Khalyavin, D.D.; Martin, C. Mn2TeO6: A Distorted Inverse Trirutile Structure. Inorg. Chem. 2017, 56, 9742–9753. [Google Scholar] [CrossRef]
- Trömel, M.; Schmid, D. Tellurite des zweiwertigen Mangans, Kobalts und Nickels. Z. Anorg. Allg. Chem. 1972, 387, 230–240. [Google Scholar] [CrossRef]
- Trömel, M.; Scheller, T. Die Kristallstruktur von Co6Te5O16. Z. Anorg. Allg. Chem. 1976, 427, 229–234. [Google Scholar] [CrossRef]
- Miletich, R. Copper-substituted manganese-denningites, Mn(Mn1−xCux)(Te2O5)2 (0 ≤ x ≤ 1): Synthesis and crystal chemistry. Mineral. Petrol. 1993, 48, 129–145. [Google Scholar] [CrossRef]
- Cooper, M.A.; Hawthorne, F.C. The crystal structure of spiroffite. Can. Mineral. 1996, 34, 821–826. [Google Scholar]
- Irvine, J.T.S.; Johnston, M.G.; Harrison, W.T.A. Lone-pair containment in closed cavities. The MTe6O13 (M = Mn, Ni, Co) family of ternary oxides. Dalton Trans. 2003, 13, 2641–2645. [Google Scholar] [CrossRef]
- Feger, C.R.; Schimek, G.L.; Kolis, J.W. Hydrothermal synthesis and characterization of M2Te3O8 (M = Mn, Co, Ni, Cu, Zn): A series of compounds with the spiroffite structure. J. Solid State Chem. 1999, 143, 246–253. [Google Scholar] [CrossRef]
- Kohn, K.; Akimoto, S.-I.; Uesu, Y.; Asai, K. Crystal Structure and Magnetic Properties of MnTeO3, CoTeO3 and NiTeO3. J. Phys. Soc. Jpn. 1974, 37, 1169. [Google Scholar] [CrossRef]
- Kohn, K.; Inoue, K.; Horie, O.; Akimoto, S.-I. Crystal chemistry of MSeO3 and MTeO3 (M = Mg, Mn, Co, Ni, Cu, and Zn). J. Solid State Chem. 1976, 18, 27–37. [Google Scholar] [CrossRef]
- Eder, F.; Weil, M. Phase formation studies and crystal structure refinements in the MnII/TeIV/O/(H) system. Z. Anorg. Allg. Chem. 2022. [Google Scholar] [CrossRef]
- Ptáček, P. Substitutents and Dopants in the Structure of Apatite. In Apatites and Their Synthetic Analogues; IntechOpen: London, UK, 2016; pp. 289–334. [Google Scholar]
- Peacor, D.R.; Sarp, H.; Dunn, P.J.; Innes, J.; Nelen, J.A. Defernite from the Kombat mine, Namibia: A second occurrence, structure refinement, and crystal chemistry. Am. Mineral. 2006, 73, 888–893. [Google Scholar]
- Degen, T.; Sadki, M.; Bron, E.; König, U.; Nénert, G. The HighScore suite. Powder Diffr. 2014, 29, S13–S18. [Google Scholar] [CrossRef]
- APEX3 and SAINT; Bruker AXS Inc.: Madison, WI, USA, 2016.
- Krause, L.; Herbst-Irmer, R.; Sheldrick, G.M.; Stalke, D. Comparison of silver and molybdenum microfocus X-ray sources for single-crystal structure determination. J. Appl. Cryst. 2015, 48, 3–10. [Google Scholar] [CrossRef]
- Sheldrick, G.M. SHELXT–Integrated space-group and crystal-structure determination. Acta Crystallogr. 2015, 71, 3–8. [Google Scholar] [CrossRef]
- Sheldrick, G.M. Crystal structure refinement with SHELXL. Acta Crystallogr. 2015, 71, 3–8. [Google Scholar]
- ATOMS for Windows; Shape Software: Kingsport, TN, USA, 2006.
- Perez, G.; Lasserre, F.; Moret, J.; Maurin, M. Structure cristalline des hydroxytellurites de nickel et de cobalt. J. Solid State Chem. 1976, 17, 143–149. [Google Scholar] [CrossRef]
- Parsons, S.; Flack, H.D.; Wagner, T. Use of intensity quotients and differences in absolute structure refinement. Acta Crystallogr. 2013, 69, 249–259. [Google Scholar] [CrossRef] [PubMed]
- Flack, H.D. On enantiomorph-polarity estimation. Acta Crystallogr. 1983, 39, 876–881. [Google Scholar] [CrossRef]
- Wojdyr, M. Fityk: A general-purpose peak fitting program. J. Appl. Crystallogr. 2010, 43, 1126–1128. [Google Scholar] [CrossRef]
- Shirkhanlou, M.; Weil, M. The Mg member of the isotypic series MTe6O13. Acta Crystallogr. 2013, 69, i18. [Google Scholar]
- Poupon, M.; Barrier, N.; Pautrat, A.; Petit, S.; Perez, O.; Bazin, P. Investigation of Co6(OH)3(TeO3)4(OH)~0.9(H2O): Synthesis, crystal and magnetic structures, magnetic and dielectric properties. J. Solid State Chem. 2019, 270, 147–155. [Google Scholar] [CrossRef]
- Christy, A.G.; Mills, S.J.; Kampf, A.R. A review of the structural architecture of tellurium oxycompounds. Mineral. Mag. 2016, 80, 415–545. [Google Scholar] [CrossRef]
- Gagné, O.C.; Hawthorn, F.C. Bond-length distributions for ions bonded to oxygen: Alkali and alkaline-earth metals. Acta Crystallogr. 2016, 72, 602–625. [Google Scholar] [CrossRef]
- Gagné, O.C.; Hawthorn, F.C. Bond-length distributions for ions bonded to oxygen: Results for the transition metals and qu antification of the factors underlying bond-length variation in inorganic solids. IUCrJ 2020, 7, 581–629. [Google Scholar] [CrossRef]
- Shannon, R.D. Revised effective ionic radii and systematic studies of interatomic distances in halides and chalcogenides. Acta Crystallogr. 1976, 32, 751–767. [Google Scholar] [CrossRef]
- Gilli, G.; Gilli, P. The Nature of the Hydrogen Bond: Outline of a Comprehensive Hydrogen Bond Theory; Oxford University Press: New York, NY, USA, 2009. [Google Scholar]
- Galy, J.; Meunier, G.; Andersson, S.; Åström, A. Stéréochimie des eléments comportant des paires non liées: Ge(II), As(III), Se(IV), Br(V), Sn(II), Sb(III), Te(IV), I(V), Xe(VI), Tl(I), Pb(II), et Bi(III) (oxydes, fluorures et oxyfluorures). J. Solid State Chem. 1975, 13, 142–159. [Google Scholar] [CrossRef]
- Stöger, B.; Weil, M.; Silich, K.A.; Olenev, A.V.; Berdonosov, P.S.; Dolgikh, V.A. Synthesis and Structural Characterization of New Phases in the Cubic M3Te2O6X2 (M = Sr, Ba; X = Cl, Br) Structure Family. Z. Anorg. Allg. Chem. 2011, 637, 1322–1329. [Google Scholar] [CrossRef]
- Amoros, P.; Marcos, M.D.; Roca, M.; Beltran-Porter, A.; Beltran Porter, D. Synthetic Pathways for New Tubular Transition Metal Hydroxo and Fluoro-Selenites: Crystal Structures of M12(X)2(SeO3)8(OH)6 (M = Co2+, Ni2+; X = (OH)−). J. Solid State Chem. 1996, 126, 169–176. [Google Scholar] [CrossRef]
- Jenkins, H.D.B.; Thakur, K.P. Reappraisal of thermochemical radii for complex ions. J. Chem. Educ. 1979, 56, 576–577. [Google Scholar] [CrossRef]
- Nicholls, P. Introduction: The biology of the water molecule. CMLS Cell. Mol. Life Sci. 2000, 57, 987–992. [Google Scholar] [CrossRef] [PubMed]
- Weidlein, J.; Müller, U.; Dehnicke, K. Schwingungsfrequenzen I (Hauptgruppenelemente); Georg Thieme Verlag: Stuttgart, Germany, 1981. [Google Scholar]
- Farmer, V.C. (Ed.) Mineralogical Society Monograph 4: The Infrared Spectra of Minerals; The Mineralogical Society: London, UK, 1974. [Google Scholar]
- Frost, R.L.; Keeffe, E.C. Raman spectroscopic study of the tellurite minerals: Graemite CuTeO3·H2O and teineite CuTeO3·2H2O. J. Raman Spectrosc. 2009, 40, 128–132. [Google Scholar] [CrossRef]
- Frost, R.L.; Keeffe, E.C. Raman spectroscopic study of the tellurite mineral: Sonoraite Fe3+Te4+O3(OH)·H2O. J. Raman Spectrosc. 2009, 40, 133–136. [Google Scholar] [CrossRef]
- Rumsey, M.S.; Welch, M.D.; Mo, F.; Kleppe, A.K.; Spratt, J.; Kampf, A.R.; Raanes, M.P. Millsite CuTeO3·2H2O: A new polymorph of teineite from Gråurdfjellet, Oppdal kommune, Norway. Mineral. Mag. 2018, 82, 433–444. [Google Scholar] [CrossRef]


Publisher’s Note: MDPI stays neutral with regard to jurisdictional claims in published maps and institutional affiliations. |
© 2022 by the authors. Licensee MDPI, Basel, Switzerland. This article is an open access article distributed under the terms and conditions of the Creative Commons Attribution (CC BY) license (https://creativecommons.org/licenses/by/4.0/).