Article

Atomic Simulations of Si@Ge and Ge@Si Nanowires for Mechanical and Thermal Properties

1
Key Laboratory for Anisotropy and Texture of Materials (Ministry of Education), Northeastern University, Shenyang 110819, China
2
School of Materials Science and Engineering, Northeastern University, Shenyang 110819, China
*
Author to whom correspondence should be addressed.
Crystals 2022, 12(10), 1447; https://doi.org/10.3390/cryst12101447
Submission received: 20 September 2022 / Revised: 6 October 2022 / Accepted: 8 October 2022 / Published: 13 October 2022
(This article belongs to the Special Issue Nanowires for Novel Electronics and Photonics)

Abstract

:
Molecular dynamics simulations using Tersoff potential were performed in order to study the evolution of the atomic packing structures, loading states on the atoms, and tensile tests, as well as the thermal properties of Si/Ge core–shell nanowires with different core–shell structures and ratios at different temperatures. Potential energy and pair distribution functions indicate the structural features of these nanowires at different temperatures. During uniaxial tensile testing along the wire axis at different temperatures, different stages including elasticity, plasticity, necking, and fractures are characterized through stress–strain curves, and Young’s modulus, as well as tensile strength, are obtained. The packing patterns and Lode–Nadai parameters reveal the deformation evolution and different distributions of loading states at different strains and temperatures. The simulation results indicate that as the temperature increases, elasticity during the stretching process becomes less apparent. Young’s modulus of the Si/Ge core–shell nanowires at room temperature show differences with changing core–shell ratios. In addition, the Lode–Nadai parameters and atomic level pressures show the differences of these atoms under compression or tension. Temperature and strain significantly affects the pressure distribution in these nanowires. The phonon density of states, when varying the composition and strain, suggest different vibration modes at room temperature. The heat capacities of these nanowires were also determined.

1. Introduction

With reductions in the size of microelectronic devices, size and electronically matched micro or nano power supply systems are in high demand [1,2]. As the fundamental material for the fabrication of microelectronics, micro/nano electromechanical systems (M/NEMS), or integrated circuit (IC) devices, Si is the best candidate to be used for electrode materials or substrates in terms of their integration with the above electronic devices [3,4]. Moreover, Si-based electrode materials are employed as appropriate and competitive candidates for lithium batteries, owing to their high theoretical capacity [5,6,7,8,9]. However, the continuous up-take and release of Li atoms in these Si-based anodes on cycling bring about large volume expansion/contraction and enormous stress inside the anode, leading to the cracking and even pulverization of the anode and the fracture of electronic conductive networks around electroactive Si [10,11]. Therefore, compositionally and geometrically engineering Si/Ge-based nanostructures, such as Si/Ge core–shell nanowires (NWs), are proposed to address the fracture issues induced from volume expansion, as well as improving structural stability and electrochemical kinetics [12]. Over the two most recent decades, the Si/Ge core–shell nanowires, which could be integrated with current Si-based technology [13,14,15,16,17], have attracted more attention both experimentally and theoretically [18,19,20]. By modulating the compositions, the semiconductor core–shell nanowires present enhanced thermal and mechanical properties compared to their pure counterparts [21,22,23,24,25].
However, unlike the mechanical testing of bulk materials, the tensile testing of nanowires heavily depends on the experimental setup, so there are significant challenges during manipulating which makes accurately applying and measuring the external force or strains at the nano-scale hardly possible [26,27]. Therefore, computational approaches have been used to provide the mechanical properties of reasonably sized nanowires. Many computational investigations for some core–shell nanowires have been reported [28,29,30]. For example, Liu et al. [31] studied the composition-dependent stiffness of Ge-core/Si-shell and Si-core/Ge-shell nanowires using Stillinger–Weber potential. The results revealed that the trends of Young’s modulus for the core–shell nanowires was essentially attributed to the different components of the cores and the shells. Thanh et al. [32] used the molecular dynamics (MD) method to investigate the mechanical properties of Si/Ge and Ge/Si NWs under axial tensile strain and further researched the effects of different strain rates on the mechanical properties of these materials. However, the distribution of local stress, as well as their effects on strengths on an atomic scale have not been presented to show the loading states on the atoms under the effects of temperature and applied strain.
In addition, since the chemical reaction inside the battery during discharge will generate a lot of heat energy, which significantly affects the performance of the IVA-based (Si/Ge) electrode, the composition and structural design of the materials used for the electrode also requires characteristics of thermal properties, which can be determined from lattice vibrational modes, such as heat capacity (CV). Previous studies have found that heat capacity varies with size, temperature, and the structure of different modulated compositions. Zhu et al. [33] discussed heat capacity as a function of the temperature for the order and disorder phases of SixGe1−x alloys through the quasi-harmonic Debye model. Zhang et al. [34] investigated the specific heat of silicon nanowires with Stillinger–Weber potential. It was found that the specific heat of thin nanowires was much higher than that of bulk silicon, and enhancement of the specific heat of silicon nanowires can be attributed to the surface effect and phonon confinement effect. Therefore, the importance of understanding the thermal response of the nanowires following strain is not overemphasized [35,36,37,38].
In this paper, Si@Ge and Ge@Si nanowires with different core–shell ratios were compared in order to investigate their structural stability at elevated temperatures via potential energy and pair distribution functions using molecular dynamics simulations. The mechanical properties of these nanowires under tension were studied at different temperatures, including stress–strain curves, locally atomic stresses, tensile strength, and Young’s modulus, as well as atomic level stress and loading states. The phonon density of states was used to calculate the heat capacities for the nanowires with different core–shell ratios at room temperature.

2. Simulation Detail

2.1. Tersoff Potential

For the present MD simulations performed for Si/Ge NWs, the Tersoff potential [39,40] was used to describe the Si–Si, Ge–Ge, and Si–Ge interactions. As an indicator of bond order potential, the Tersoff potential not only takes into account the influence of covalent bonds, the local environment of atoms, bond angles, and other factors on the bond level, but can also correctly simulate the formation and destruction of covalent bonds. In addition, the potential has a rather simple and analytical form, which describes short-range interactions among the atoms, and can be used to predict the molecular structures, mechanical properties, and the thermal properties of Si–Ge binary systems. The General Utility Lattice Program (GULP) software (Julian D. Gale, Perth, Australia) used in this study does not integrate the tight-binding potential [41,42]. In addition, there is no Slater–Koster table describing the interactions between Ge atoms that are commonly used in DFTB+ software (B. Hourahine et al.). The embedded atom method (EAM) potential is mainly used to describe many particle interactions in metal systems. The modified embedded atom method (MEAM) presents covalent bonding among Ge and Si atoms. The results from a study conducted by Pishkenari et al. [43] show that MEAM potential overestimates both the lattice constant and the thermal properties of bulk silicon, whereas the Tersoff potential provides good results about the thermal properties with experimental data.
As a function of atomic coordinates, the total potential energy (E) takes the following forms:
E t o t = 1 2 i j V i j      
V i j = f C ( r i j ) [     f R ( r i j ) + b i j f A ( r i j ) ]
f R ( r i j ) = A i j exp ( λ i j r i j )
f A ( r i j ) = B i j exp ( μ i j r i j )
f C ( r i j ) = { 1 ,                                                       r i j < R i j   1 2 + 1 2 cos π ( r i j R i j ) S i j R i j ,                   R i j < r i j < S i j     0 ,                                                         r i j > S i j  
b i j = χ i j ( 1 + β i n i ζ i j n i ) 1 2 n i
ζ i j = k i , j f C ( r i k ) ω i k g ( θ i j k )
g ( θ i j k ) = 1 + c i 2 d i 2 c i 2 d i 2 + ( h i + cos θ i j k ) 2
λ i j = λ i + λ j 2 ,     μ i j = μ i + μ j 2
A i j = ( A i A j ) 1 2 ,   B i j = ( B i B j ) 1 2 ,   R i j = ( R i R j ) 1 2 ,   S i j = ( S i S j ) 1 2
where V i j   is the bond energy between ij atoms, f R and f A are attractive and repulsive terms for the potential, f C refers to the slip cutoff function, and b i j is the key sequence function. r i j   is the length of the i j bond, and θ i j k is the bond angle between bonds i j   and   i k . The crucial parameters are listed in Table 1.

2.2. The Initial NW Models

Initially, after direct cleaving from bulk silicon, one silicon nanowire (including 2080 atoms along the 110 direction) was built with exposed (100) and (111) surfaces, accounting for the fact that experimental studies have reported 110 as the preferred growth direction for a diameter that is less than 20 nm [39,40,44]. After constructing the silicon nanowires, the Ge-core or Ge-shell segments were built by replacing Si atoms with Ge. Therefore, the Si@Ge nanowires with different compositions are the ones with Ge atoms in the core and Si atoms in the shell. Analogously, the Ge@Si nanowires with different compositions have a core of Si and a shell of Ge. The structures of the Si@Ge and Ge@Si nanowires are shown in Figure 1, where the yellow balls represent silicon atoms and the green balls represent germanium atoms. The structural parameters of the nanowires are listed in Table 2.
The periodic conditions were applied along x-, y-, and z-directions. To ensure negligible interactions between the nanowires from their periodic images, we created a vacuum space with a lattice parameter of 100 Å in the x- and y-directions in order to ensure isolation of the nanowires. The visualization tool software OVITO [42] was used to present the structural images.
The pair distribution function g(r) gives the probability of finding the atom pairs within a distance (r) in the system:
g ( r ) = 1 N 2 i j 1 δ ( r r i j )
where N is the number of atoms in the nanowires in the simulation, and denotes the average value for the statistical time step.

2.3. Simulation Protocol

All MD calculations were performed using the GULP package (version 4.5) [43,44]. Each simulation was carried out in the NVT ensemble (constant atom number, volume, and temperature) using an Andersen thermostat. By solving Newton’s motion equations, we could obtain the positions and velocities of each atom, and a predictor–corrector algorithm was used to integrate the equations of motion. We accounted for the fact that the maximum temperature that high-temperature lithium batteries can withstand is below 1000 K. All structures were thermalized from 300 K to 800 K gradually at an increment of 50 K and we performed lattice energy minimization to find the lowest energy configuration through 1,000,000 time steps. The last 50,000 time steps were used to record the atomic trajectories and energy, that is, these were used to calculate the average values of energy for these nanowires at each temperature. Among them, a time step corresponds to real time of 1 fs. The relaxed structures were then simulated to generate their mechanical properties. The initial structures for each temperature were obtained from the coordinates of the last time step from the previous temperature.
In the tensile simulation process, the nanowires were stretched along the axial direction. The strain rate was selected to perform the tensile simulations, with a tensile strain of 0.005 applied each time during the stretching process. This process was repeated until the nanowires were broken.

2.4. Analysis Functions

The potential energy ( E a v ) per atom at each temperature is defined below:
E a v = 1 N E t o t
The local stress tensors ( σ i ) of each atom(i) are given in the following equation [45,46]:
σ i a b = 1 V i j i E i r i j r i j a r i j b r i j
where V i is the volume of atoms, E i is the energy of the ith atom, and r i j a and r i j b are the Cartesian components of the vector r i j in which a and b stand for any two of x, y, or z.
From these stress tensors, three stress invariants ( I 1 i , I 2 i , and I 3 i ) are given as follows [47]:
I 1 i = σ i x x + σ i y y + σ i z z
I 2 i = | σ i y y σ i y z σ i y z σ i z z | + | σ i z z σ i z x σ x z σ i x x | + | σ i x x σ i x y σ i y x σ i y y |
I 3 i = | σ i x x σ i x y σ i x z σ i y x σ i y y σ i y z σ i z x σ i z y σ i z x |
A third-order differential equation with the three coefficients of the invariants is given by the following equation:
σ i 3 I 1 i σ i 2 + I 2 i σ i I 3 i = 0
the first, the second, and the third main stresses of σ 1 ,   σ 2 ,   and   σ 3   are obtained, where   σ 1 σ 2 σ 3 . The Lode–Nadai parameter [48] was calculated from the following formula:
μ σ = 2 σ 2 i σ 3 i σ 1 i σ 3 i 1
Furthermore, the isotropic pressure ( P i ) on the atom is related to the σ i , as given by the following equation [45,46]:
P i = 1 3 ( σ i x x + σ i y y + σ i z z )
The heat capacity at a certain temperature (T), is given by the following formula:
C v = 0 ω m k B g ( ω ) ( ћ ω / k B T ) 2 e ћ ω / k B T ( e ћ ω / k B T 1 ) 2 d ω
where g ( ω ) represents the density of the angular frequency ω, ω m represents the maximum angular frequency, ћ represents the Planck Constant, and k B   represents the Boltzmann constant.

3. Results and Discussion

Figure 2 shows variations in the average energy per atom with temperature on heating. By comparing the average energy curves of pure Si, pure Ge, and six core–shell nanowires, it can be seen from the figure that the average energy increases in a linear mode with an increase in temperature, which is caused by gradual intensification of the thermal vibrations of the atoms around their lattice positions as the temperature is increased. Here, the atoms in these nanowires can hold their packing patterns within these temperature ranges. In addition, as the germanium content increases, the average energy increases.
In order to understand the structural characteristics of Ge@Si and Si@Ge nanowires, the pair distribution functions (PDFs) (Figure 3) demonstrate that there are discrete peaks with a certain width due to the thermal movement of atoms around their equilibrium position. For the pure Ge and Si nanowires, the locations of the first peaks are approximately 0.245 nm and 0.236 nm, respectively, whereas those of the core–shell nanowires are located between them. The location of one peak corresponds to the distance between paired atoms, and these distinct peaks indicate orderly packing patterns. It should be noted that the height of the first peak of the PDFs for these core–shell nanowires decreases compared with those of pure Si and Ge nanowires. It is obvious that the thicker the shell, the higher the height of the peak, especially at relatively low temperatures. This is because for one thick shell, there are less Si–Ge atomic pairs, whereas there are more Si–Si or Ge–Ge atomic pairs, indicating that the content of these components plays a significant role in the changes made to the structures and mechanical properties of these nanowires. In addition, for Si@Ge_NW1, there is an apparent splitting phenomenon when the distance exceeds the second neighbor distance. When the temperature increases, the shapes of these discrete peaks become passivated, the heights of the peaks decrease, and the widths increase, owing to the intensified thermal vibration.
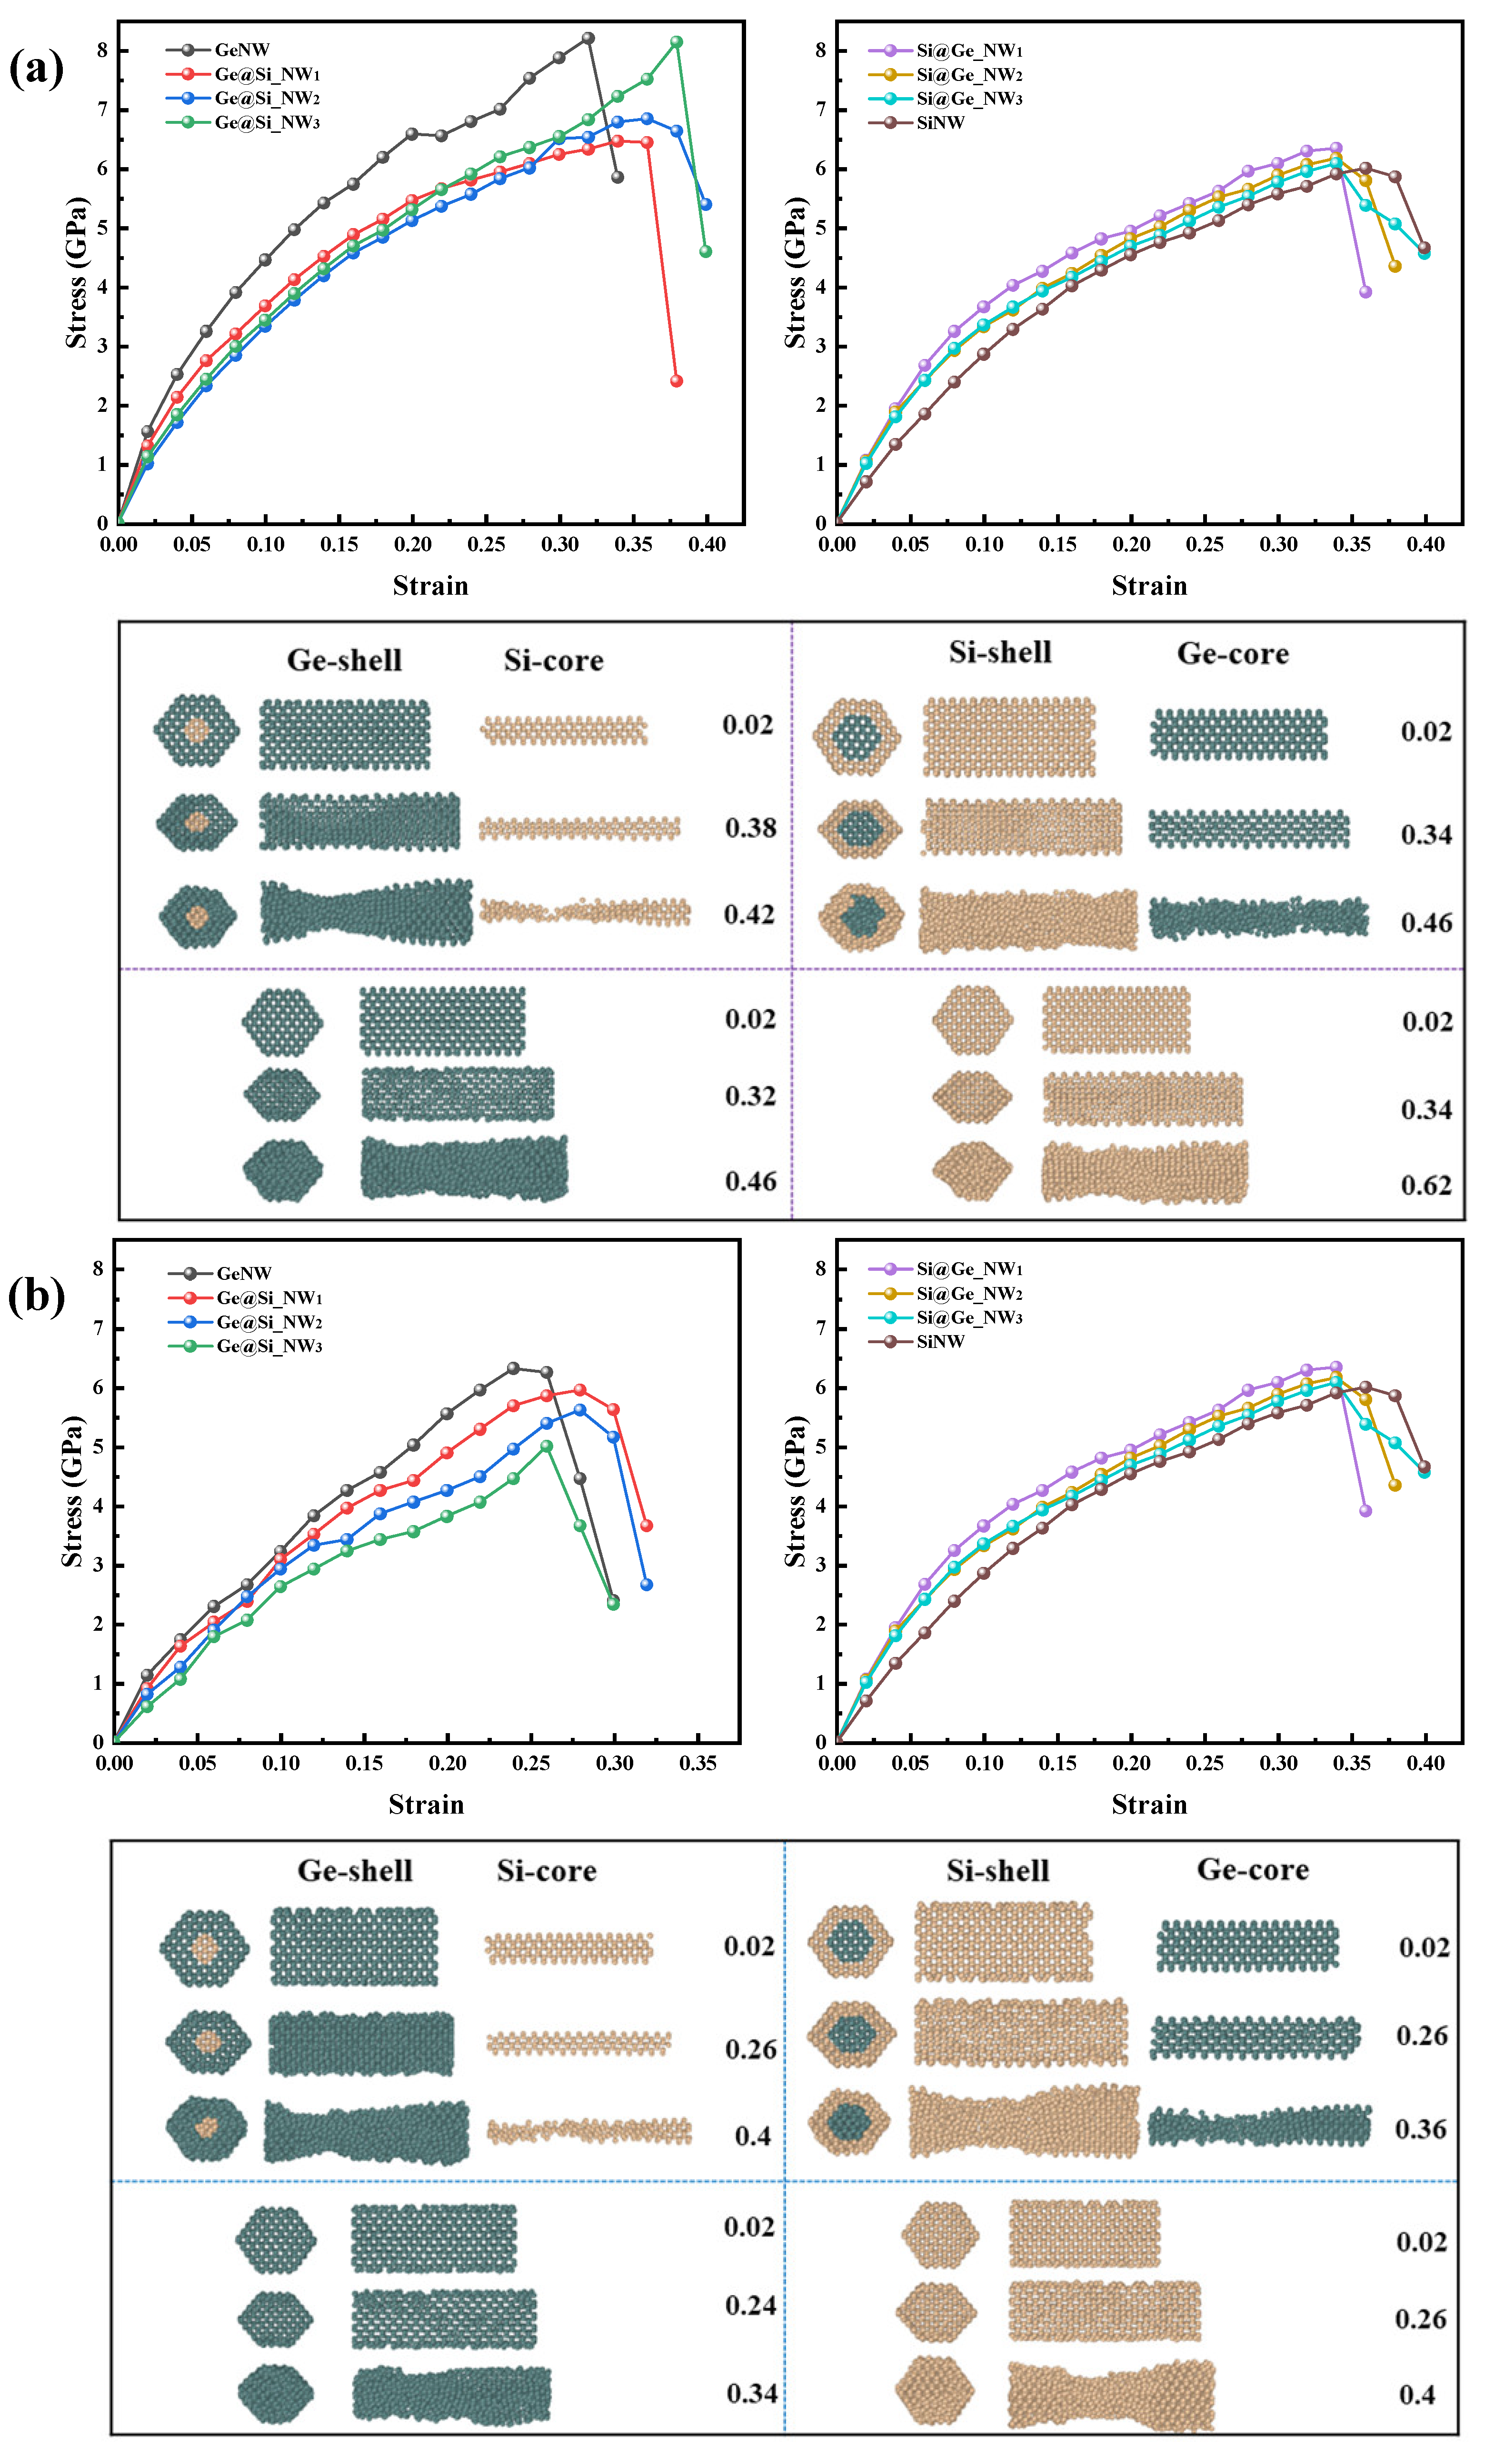
Figure 4 shows the stress–strain relationship for the tensile process of the Ge@Si and Si@Ge nanowires, as well as the atom packing images under different strains at different temperatures, where the NWs have different core–shell ratios. As shown in this figure, all the nanowires start with a linear relationship between stress value and small strain at room temperature, indicating that these nanowires undergo elastic deformation following Hook’s law. The slope of the stress–strain curve near zero strain gives the Young’s modulus. At small strains, the distribution of the stress on each atom is calculated and the results are shown in Figure 5, where the atoms are under positive and negative pressure. It is worth noting that the value of stress for the pure Ge nanowire is significantly higher than that of the core/shell nanowires with silicon cores. The stress value of the pure Si nanowire is also higher than that of the corresponding Ge as the core filled in the core/shell nanowires. Under stretching, the slope of the curves gradually decreases, and the stress–strain of nanowires no longer follows a linear relationship; some of these wires apparently enter into the yielding state at this time. When the stress of these nanowires reaches a maximum or the tensile strength (Rm), the corresponding strain is written as εmax. Then, there is an abrupt drop in stress. The atomic packing images show that a necking phenomenon occurs in these nanowires, as is also shown in their evolutionary morphologies. Here, under small strain, the distance between the atoms increases slightly and only some of the atoms in the shell surface present apparent rearrangements, resulting in some local lattice defects. Most of the atoms are still in their lattice positions. As the stretch continues, the lattice defects gradually increase and expand from the middle part to both ends of the nanowires, which results in necking of the nanowires. It is worth noting that, at room temperature, silicon shell nanowires did not show obvious necking, but gradually formed a cylinder due to the existence of the Ge core. The stress–strain curves at 800 K, as depicted in Figure 4b, show similar trends when compared to the stress–strain curves at 300 K. However, the stress–strain curves at 800 K have no obvious elastic stage. From the perspective of lattice vibration, as the temperature increases, the thermal motion of the atoms is more intense. This generates a greater amplitude from its equilibrium position. Under external loads, some atoms break away from their neighboring atoms and their previous lattice positions. Thus, stress increases nonlinearly with strain. In the packing images at this temperature, necking appears again during the stretching process, where the Si shell and Ge core present apparent necking.
Figure 6a shows the distribution of Lode–Nadai parameters for the Ge@Si and Si@Ge nanowires under different strains at 300 K and 800 K, where a μσ of −1 indicates that the atom is just stretched, 1 indicates that the atom is just compressed, and 0 indicates subject to shear. For the Ge@Si_NW1 at room temperature (Figure 6a), a proportion of the Ge-shell atoms under just tension or compression have significantly high values under small strain, resulting from the fact that the Ge atoms undergo applied loading, and the atoms in the Ge/Si interface compress each other. Most of the atoms present values between −0.5 and 0.5, indicating shearing accompanied by different degrees of tension and compression. As strain increases to 0.42, a significant decrease occurs for the Ge-shell atoms undergoing just compression. The phenomenon that there is a decrease in the compressed ratio with increasing the strain was found for the Si atoms in the core region, indicating significant changes in packing structures. At 800 K, under small strain, most of the Ge-shell atoms undergo shear. Under large strain, many Ge atoms undergo compression, whereas a certain number of Ge atoms undergo tension. However, the loading states on the Si-core atoms change when undergoing shear. This is because at high temperatures, the atoms can leave their origin positions under applied loading, whereas many of them are confined by the Ge-shell atoms. In the meantime, while the surface Ge atoms still undergo tension, the changes in packing structures accompanied by the atoms’ motions decrease the stretch loading on the atoms. For the Si@Ge_NW2 at room temperature, under small strain, strong covalent bonds among Si atoms make them less susceptible to stretching. As the strain increases to 0.62, the atom’s number undergoing shear, as well as tension, increases significantly. This increase can be also found on the Ge-core atoms. At 800 K, increased thermal motions of the atoms significantly decrease the loading states of just tension or compression on the atoms, where the Si-shell and Ge-core atoms undergo significant shear. At a strain of 0.36, the apparent changes in the ratios both on Si and Ge atoms imply packing changes, as shown in Figure 4.
Figure 6b shows images of the Lode–Nadai parameters on the atoms at 300 K and 800 K under different strains. Under small strain at room temperature, surface Ge atoms undergo significant tension. The images of the cross-section viewed from the front for the core and shell parts show that most of the atoms are apparently stretched along the tensile direction, where these atoms are also sheared by the atoms in the adjacent atomic layers. For the Si-core atoms, a certain number of the interfacial atoms are compressed significantly. Under a large strain of 0.42, the atoms in the necking region are apparently compressed, whereas a certain amount of the surface Ge atoms in the other region present significant tension states. From the front images, it was noted that most of the Ge atoms, as well as some Si atoms, in the core central region undergo significant tension. At 800 K, under small strain, the pure red regions decrease significantly, implying that most of the atoms undergo mixing in their loading states from compression shear or tension shear. Under large strain, many Ge atoms are subjected to significant tension. For the Si@Ge nanowire, under small strain at 300 K, the shell atoms exhibit obvious retraction due to strong bonding between the Si atoms, whereas some Ge-core atoms in the Si–Ge interface undergo apparent tension from the Si atoms. Under large strain, while most of the Si shell atoms are stretched significantly, the atoms in the necking region appear compressed. As the temperature increases to 800 K, some atoms in the shell surface are subjected to tension under small strain, whereas the apparent tension becomes weak for the interfacial Ge atoms. Under large strain, significant compression occurs in the necking region for both core and shell parts.
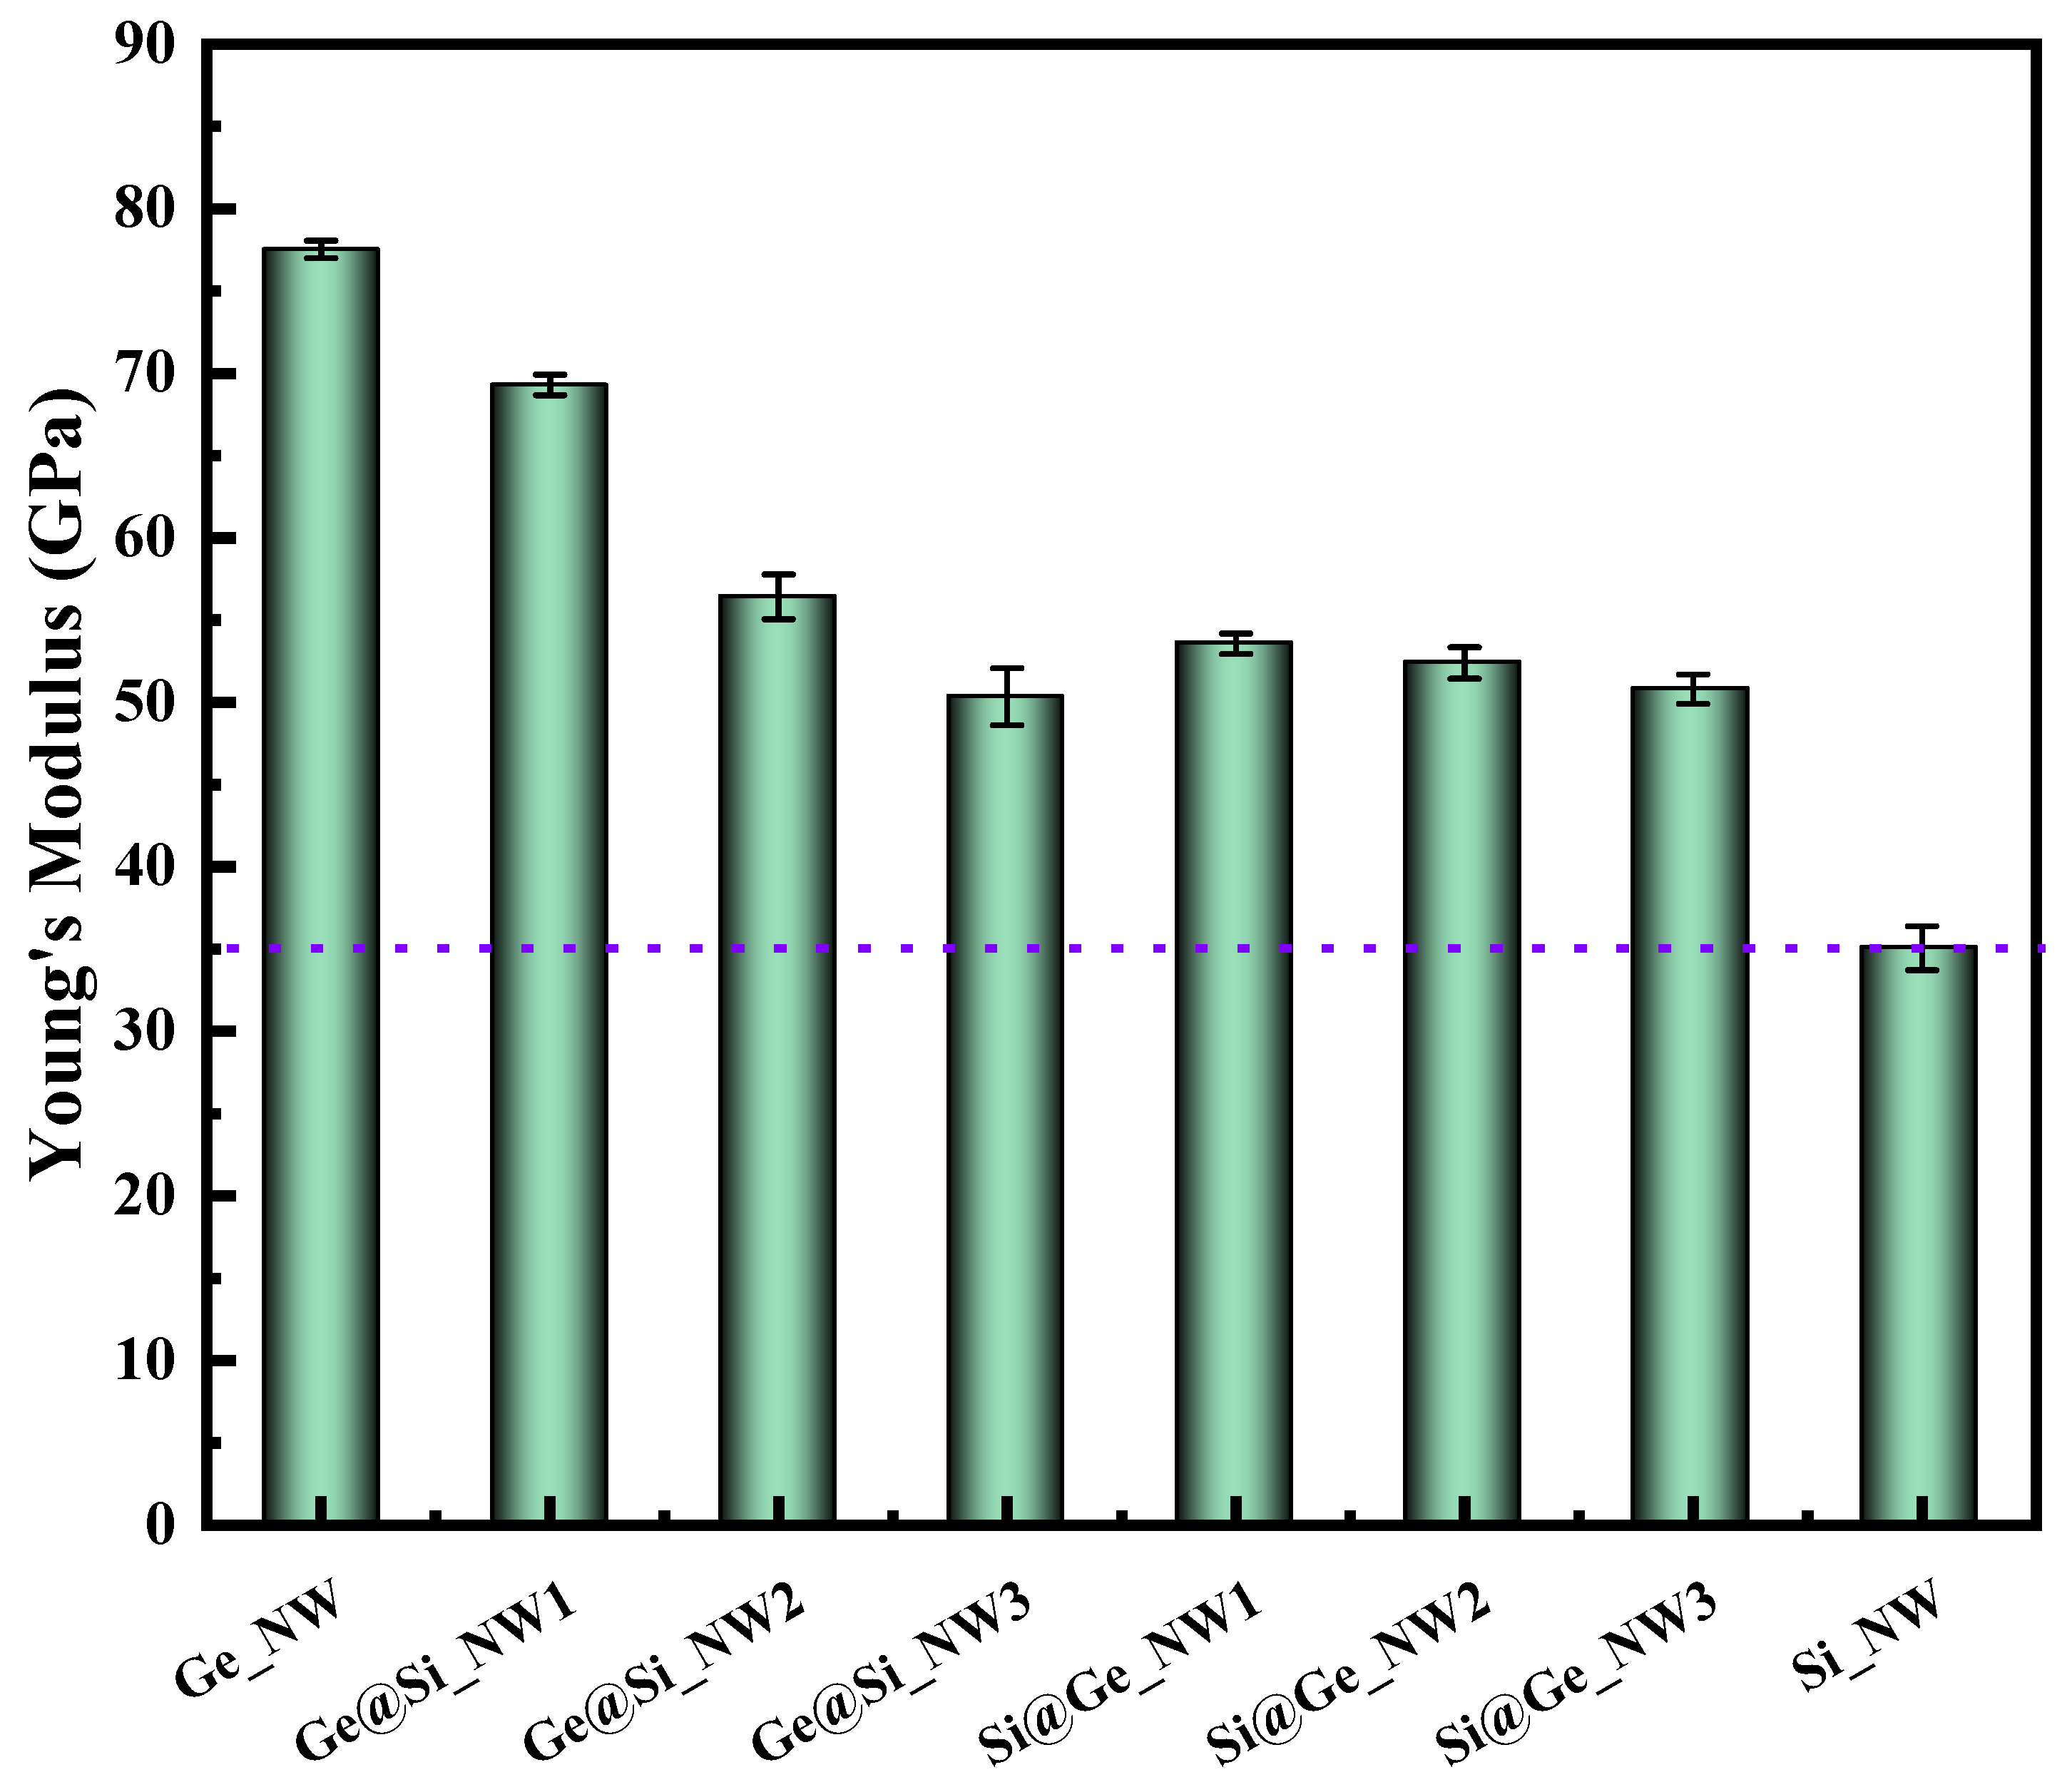
It can be seen from the stress–strain curves in Figure 4 that when the temperature reaches 800 K, there is no obvious elastic stage, so only the Young’s modulus of different Ge@Si and Si@Ge nanowires at 300 K are illustrated (Figure 5). In this figure, the error bars were obtained by using ten values of Young Modulus corresponding to ten stretching processes for the NWs under the same rate at 300 K, suggesting position adjustments of a few of surface atoms during stretching. It can be seen that the Young’s modulus of the pure Ge nanowires was significantly higher than that of the pure Si nanowires. Furthermore, the Young’s modulus of the Ge@Si nanowires was decreased compared to that of the pure Ge nanowires, whereas the Young’s modulus of the Si@Ge nanowires was increased compared to the pure Si nanowires. As the Ge content decreased, the value of the Young’s modulus for the Ge@Si nanowires decreased significantly. However, when the Ge content changed in Si@Ge nanowires, there was only a small change in the Young’s modulus for these nanowires.
Table 3 lists the tensile strengths of all nanowires. The tensile strengths decreased as the temperature increased. The higher the temperature was, the easier it was for the atoms to escape from their equilibrium position. This resulted in lattice defects. At the same strain, the lattice defects of the nanowires were more intense at higher temperatures, so the nanowires were more easily able to reach their tensile limits. Therefore, the tensile strengths of the nanowires at 800 K are lower than those at 300 K. As illustrated in Table 3, the elongation of pure Ge nanowires was significantly better than that of pure Si nanowires at 300 K and 800 K. In addition, for Ge@Si nanowires, as the Ge content decreased, the elongations increased and the tensile strength decreased. However, as the silicon content increased, the elongation and tensile strength decreased, there was no obvious change in the elongations, and there was a slight decrease in tensile strengths.
Figure 7 shows the isotropic pressure distributions of these nanowires with different core–shell ratios at a small strain and εmax, corresponding to the yield state during stretching processes. The trends in pressure distributions at 300 K and 800 K are similar. Under small strain, the pressures on the atoms were distributed around zero, indicating that most of the atoms were less stressed and the pressure distributions were more concentrated. When the strain reached their tensile strengths, the pressure increased significantly and most of the atoms had a positive pressure. As the strain increased, the pressure distributions widened, indicating that the degree of disorder for the atoms increased. It should be noted that when the strain was small, the range of the pressure distribution for the Si@Ge_NW2 at 800 K was significantly larger than that of the other nanowires because the Si@Ge_NW2 had more lattice defects, as mentioned above.
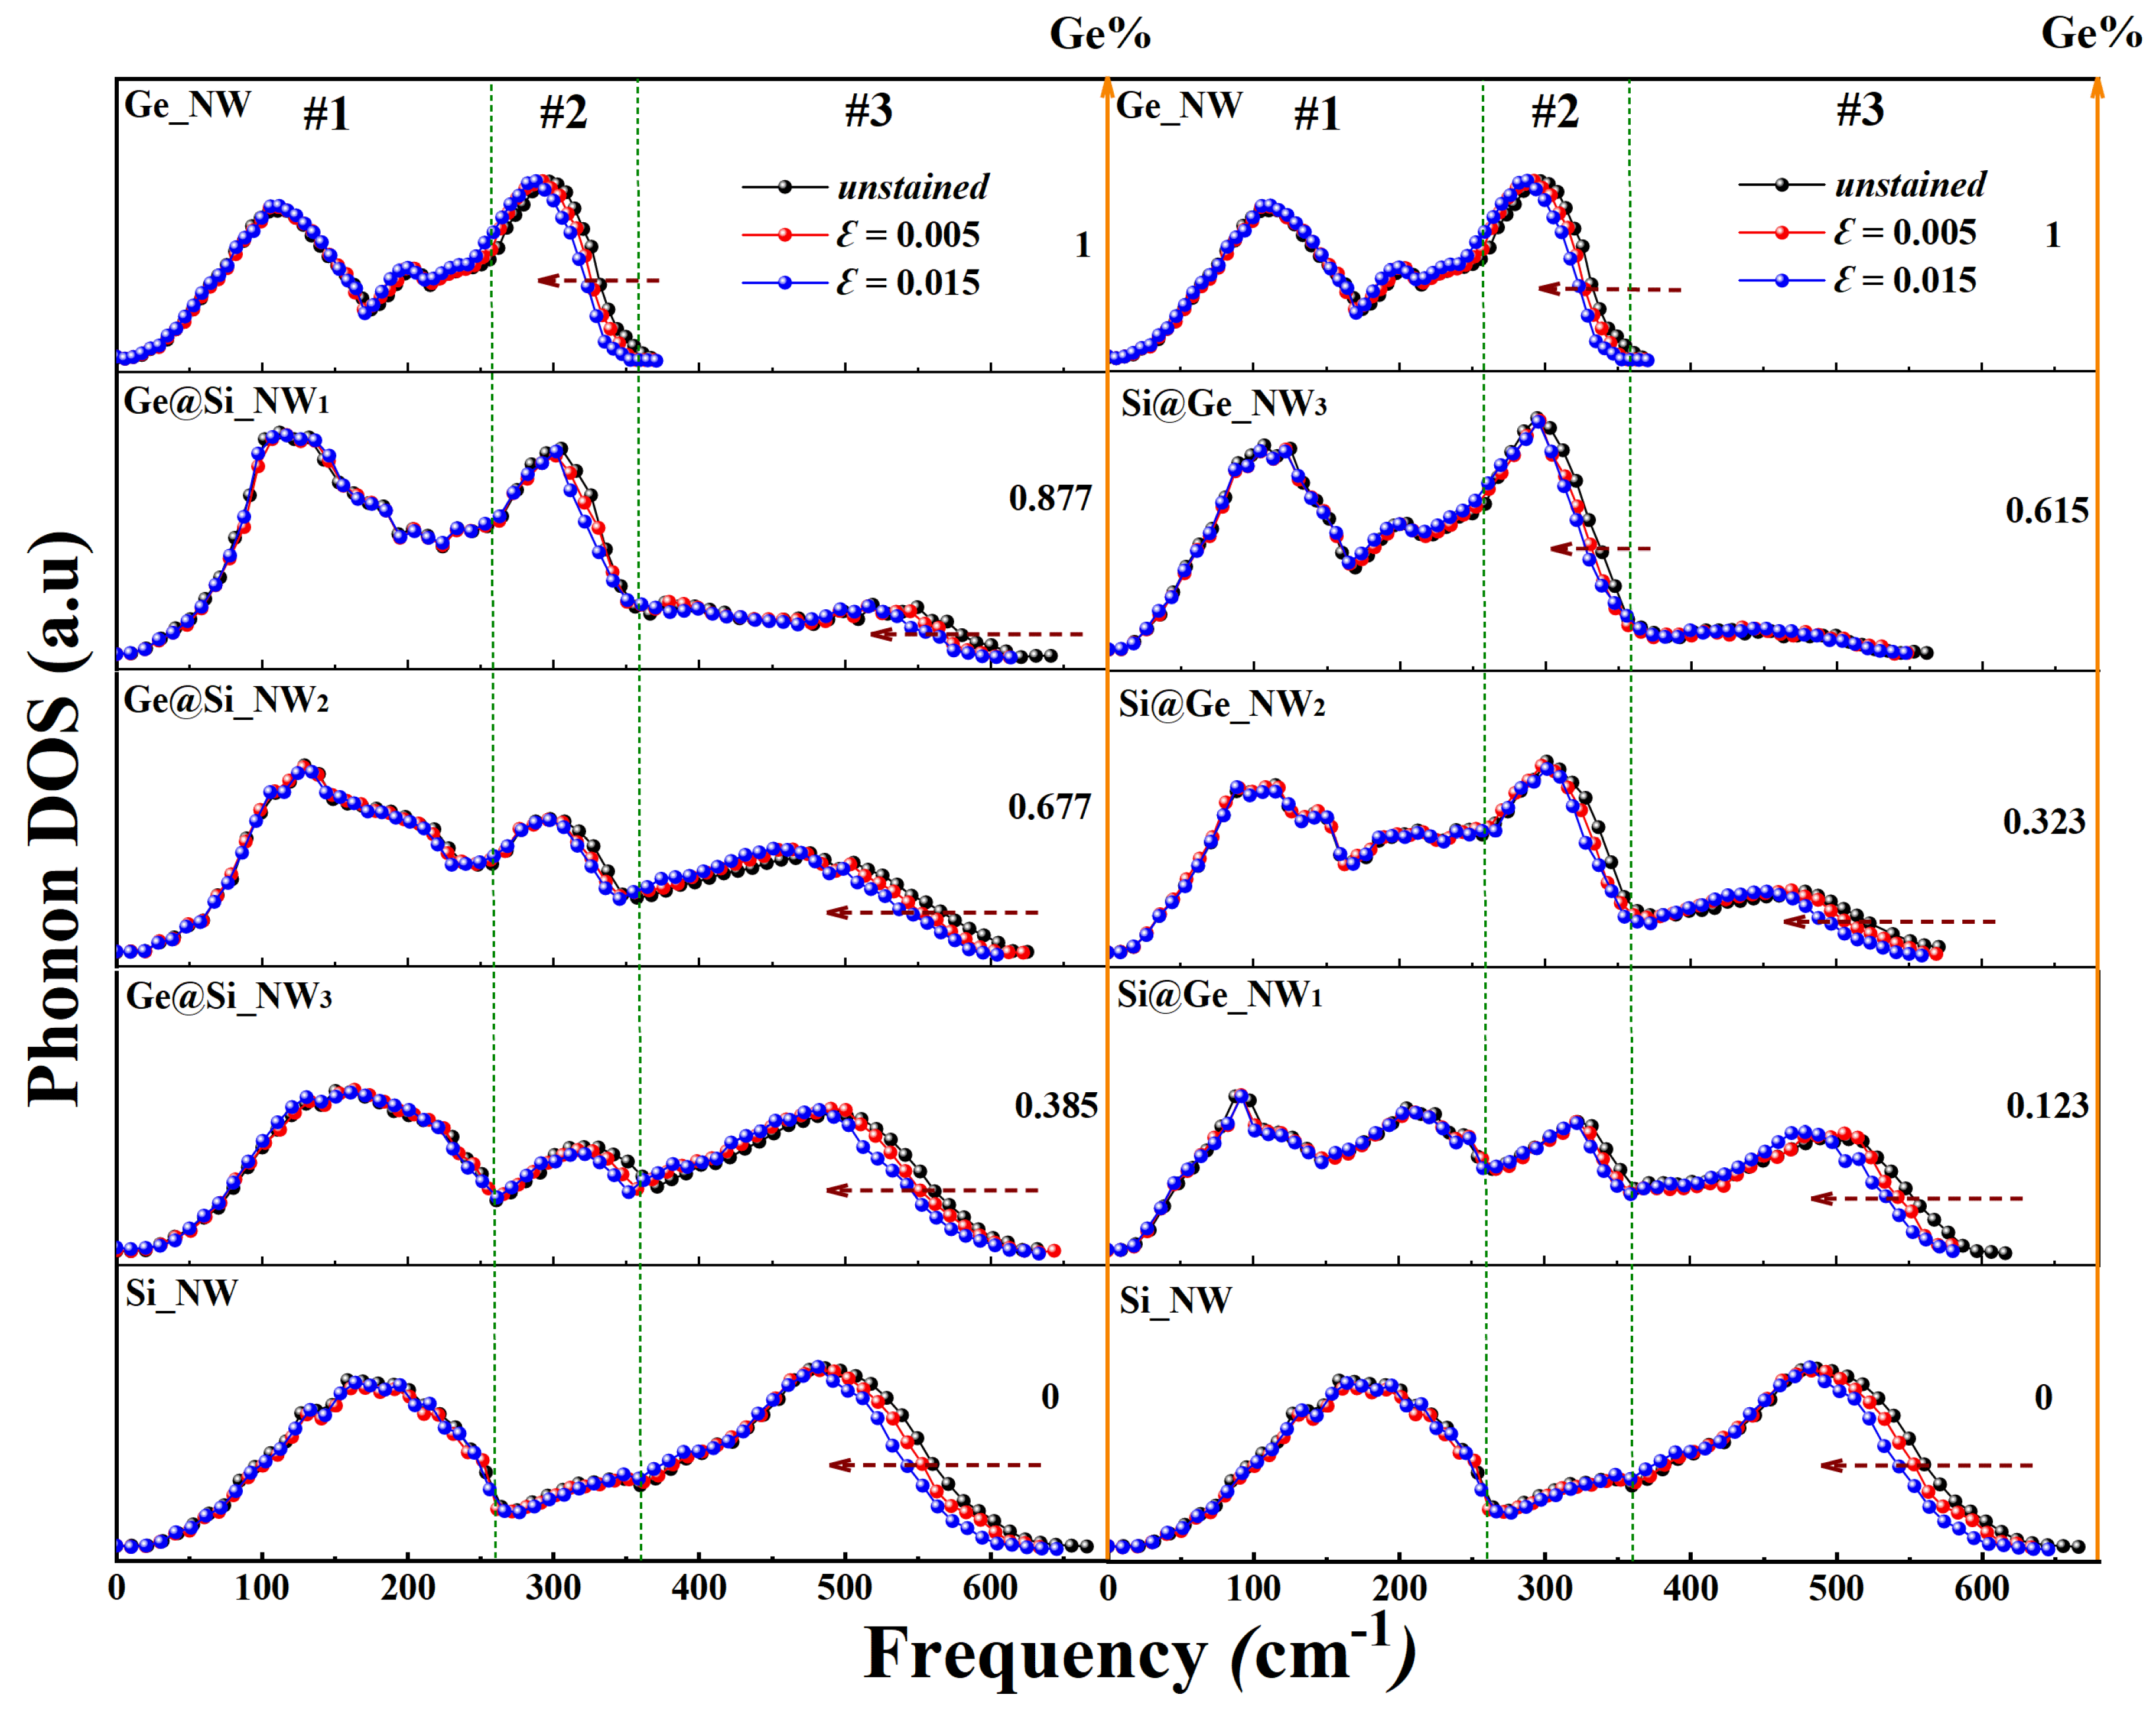
As shown in Figure 8, for these core–shell nanowires, compared to the pure Ge nanowire, the peak at around 120 cm−1 gradually widens and shifts to higher frequencies as Si atoms are introduced, and finally the transverse acoustic (TA) mode of the pure silicon nanowire occurs in region #1. Meanwhile, the longitudinal acoustic (LA) mode of Ge at around 200 cm−1 also shifted from the pure Ge nanowires mode towards the pure Si nanowires mode. The longitudinal optical (LO) mode at around 300 cm−1 shifted to a higher frequency and the peak value decreased in region #2, which eventually formed the longitudinal acoustic (LA) mode of the Si nanowire which was accompanied by an increase in the peak at 480 cm−1 in region #3. For the Si@Ge nanowires, after introducing the Ge atoms into the pure Si nanowire, the presence of the Ge atoms split the peak at around 180 cm−1 and gradually shifted to lower frequencies, eventually forming the TA and LA modes of the pure Ge nanowire in region #1. Then, with an increase in Ge concentration, the height of the peak at around 480 cm−1 decreased in region #3 and shifted to lower frequencies. Eventually, the longitudinal optical (LO) mode of the pure Ge nanowire in region #2 occurred together with an increase in the peak height at 300 cm−1. In addition, with increases in strain, the optical phonon modes at high frequency shifted towards lower frequency positions, indicating the occurrence of a phenomenon named ‘phonon softening’. Here, compared with the unstrained state, most phonons with high frequencies will have a lower energy under tension. This is due to the fact that, with an increase in strain, the elasticity recovery force weakens, resulting in a frequency shift from the optical mode to the lower values.
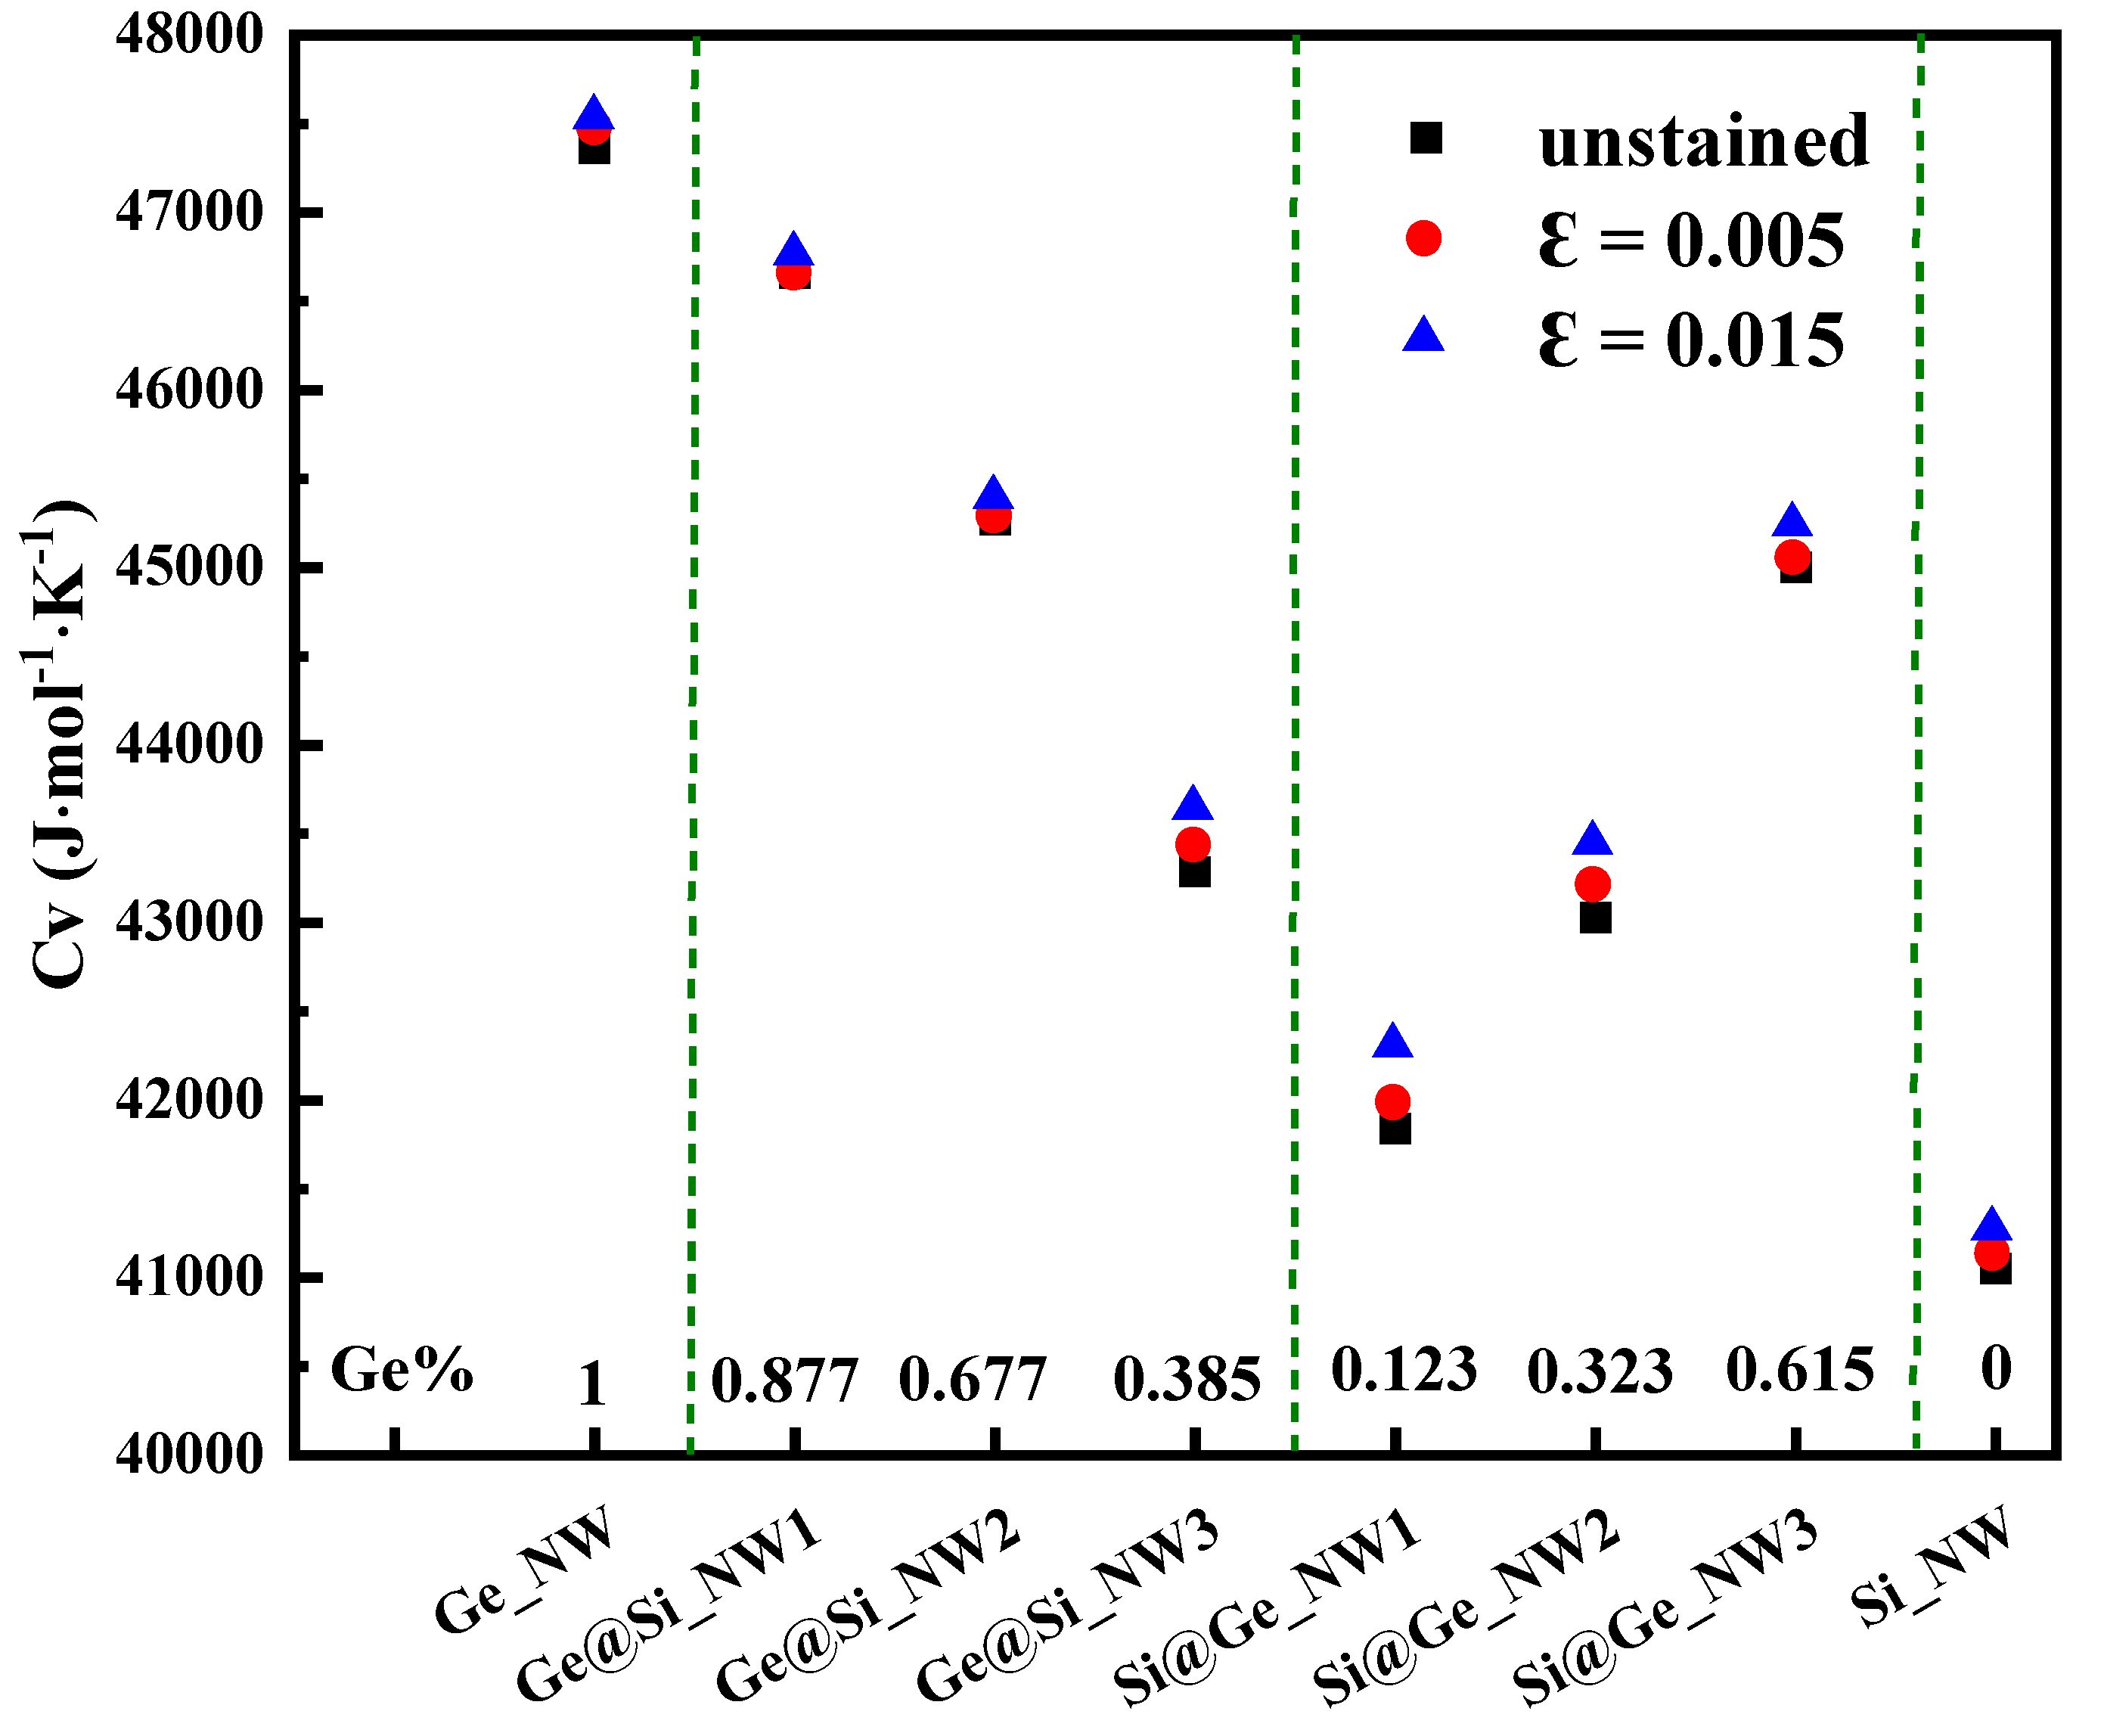
Figure 9 shows the heat capacity of the nanowires with different core–shell ratios at strains of 0, 0.005, and 0.015. As shown in Figure 9, the heat capacities of the unstained Si and Ge nanowires are 41,051 J·mol−1·K−1 and 47,359 J·mol−1·K−1, respectively, which is slightly higher than those of the bulk Si and Ge materials [49] due to the phonon’s confinement effect in the nanowires. As the Si or Ge content changes, the heat capacities of the core–shell nanowires lie between the heat capacity values of the pure Si and Ge nanowires. Moreover, because the phonon modes shift towards low frequencies with decreasing Ge content, the heat capacity of both the Ge@Si and Si@Ge nanowires decreases. It is also worth noting that the Ge@Si and Si@Ge nanowires with similar contents have similar heat capacities. Compared to the unstrained conditions, because of the strain applied, the energy corresponding to the vibrations decreased in the optical phonon modes, which resulted in an increase in the heat capacities of these nanowires.

4. Conclusions

In this work, the structure, atomic level stress, and mechanical properties, as well as thermal properties for the Ge@Si and Si@Ge core–shell nanowires with different core–shell ratios (with a wire axis in the [110] direction) were studied using molecular dynamics and Tersoff potentials. Through the tensile simulations at different temperatures, the nanowires presented elastic deformation, yield, strain strengthening, and necking at room temperature. However, there was no obvious elastic stage for all the nanowires at 800 K. The Lode–Nadai parameters present different loading states on the core and shell atoms. Furthermore, the Young’s modulus of the Ge@Si nanowires decreased compared with pure Ge nanowires, whereas the modulus of the Si@Ge nanowires increased compared with pure Si nanowires. Compared with pure Ge nanowires, elongations of the Ge@Si nanowires increased, but the tensile strength decreased. In addition, as the silicon content increased, elongation and tensile strength decreased. Finally, it was found that the pressures on the atoms under a small strain were small and most of them were subjected to positive and negative pressure. However, while the strain reached their respective tensile strengths, the pressure increased significantly and most of the atoms underwent positive pressure. In addition, the atomic level pressures of these nanowires present differences under tension, indicating the differences of the atomic packing within them. The vibrational modes, including forming, expanding, shifting, degenerating, and disappearing, are characterized by the phonon’s DOS. At room temperature, concentration of Ge in the nanowires greatly affects the heat capacities of the nanowires.

Author Contributions

Data curation, D.Z.; Formal analysis, D.Z.; Funding acquisition, L.Z.; Investigation, D.Z., Y.C. and J.L.; Methodology, D.Z.; Supervision, L.Z.; Writing—original draft, D.Z.; Writing—review & editing, L.Z. All authors have read and agreed to the published version of the manuscript.

Funding

This research was funded by the National Natural Science Foundation grant number 51671051. And The APC was funded by Lin Zhang.

Data Availability Statement

The datasets used and/or analyzed during the current study are available from the corresponding author on reasonable request.

Acknowledgments

This project was supported by the National Natural Science Foundation of China.

Conflicts of Interest

The authors declare no conflict of interest.

References

  1. Beattie, S.D.; Larcher, D.; Morcrette, M.; Simon, B.; Tarascon, J.-M. Si Electrodes for Li-Ion Batteries—A New Way to Look at an Old Problem. J. Electrochem. Soc. 2008, 155, A158. [Google Scholar] [CrossRef]
  2. Gu, M.; He, Y.; Zheng, J.; Wang, C. Nanoscale Silicon as Anode for Li-Ion Batteries: The Fundamentals, Promises, and Challenges. Nano Energy 2015, 17, 366–383. [Google Scholar] [CrossRef] [Green Version]
  3. Dai, F.; Zhao, D.; Zhang, L. Atomic Simulations of Packing Structures, Local Stress and Mechanical Properties for One Silicon Lattice with Single Vacancy on Heating. Materials 2021, 14, 3127. [Google Scholar] [CrossRef]
  4. Song, P.; Ma, Z.; Ma, J.; Yang, L.; Wei, J.; Zhao, Y.; Zhang, M.; Yang, F.; Wang, X. Recent Progress of Miniature MEMS Pressure Sensors. Micromachines 2020, 11, 56. [Google Scholar] [CrossRef] [PubMed] [Green Version]
  5. Li, W.; Sun, X.; Yu, Y. Si-, Ge-, Sn-Based Anode Materials for Lithium-Ion Batteries: From Structure Design to Electrochemical Performance. Small Methods 2017, 1, 1600037. [Google Scholar] [CrossRef] [Green Version]
  6. Tian, H.; Xin, F.; Wang, X.; He, W.; Han, W. High Capacity Group-IV Elements (Si, Ge, Sn) Based Anodes for Lithium-Ion Batteries. J. Mater. 2015, 1, 153–169. [Google Scholar] [CrossRef] [Green Version]
  7. Larcher, D.; Beattie, S.; Morcrette, M.; Edström, K.; Jumas, J.-C.; Tarascon, J.-M. Recent Findings and Prospects in the Field of Pure Metals as Negative Electrodes for Li-Ion Batteries. J. Mater. Chem. 2007, 17, 3759. [Google Scholar] [CrossRef]
  8. Zhang, M.; Zhang, T.; Ma, Y.; Chen, Y. Latest Development of Nanostructured Si/C Materials for Lithium Anode Studies and Applications. Energy Storage Mater. 2016, 4, 1–14. [Google Scholar] [CrossRef] [Green Version]
  9. Evanoff, K.; Magasinski, A.; Yang, J.; Yushin, G. Nanosilicon-Coated Graphene Granules as Anodes for Li-Ion Batteries. Adv. Energy Mater. 2011, 1, 495–498. [Google Scholar] [CrossRef]
  10. Zamfir, M.R.; Nguyen, H.T.; Moyen, E.; Lee, Y.H.; Pribat, D. Silicon Nanowires for Li-Based Battery Anodes: A Review. J. Mater. Chem. A 2013, 1, 9566. [Google Scholar] [CrossRef]
  11. Feng, K.; Li, M.; Liu, W.; Kashkooli, A.G.; Xiao, X.; Cai, M.; Chen, Z. Silicon-Based Anodes for Lithium-Ion Batteries: From Fundamentals to Practical Applications. Small 2018, 14, 1702737. [Google Scholar] [CrossRef] [PubMed]
  12. Song, T.; Cheng, H.; Choi, H.; Lee, J.-H.; Han, H.; Lee, D.H.; Yoo, D.S.; Kwon, M.-S.; Choi, J.-M.; Doo, S.G.; et al. Si/Ge Double-Layered Nanotube Array as a Lithium Ion Battery Anode. ACS Nano 2012, 6, 303–309. [Google Scholar] [CrossRef] [PubMed]
  13. Wu, Y.; Fan, R.; Yang, P. Block-by-Block Growth of Single-Crystalline Si/SiGe Superlattice Nanowires. Nano Lett. 2002, 2, 83–86. [Google Scholar] [CrossRef]
  14. Shimizu, T.; Zhang, Z.; Shingubara, S.; Senz, S. Vertical Epitaxial Wire-on-Wire Growth of Ge/Si on Si(100) Substrate. Nano Lett. 2009, 9, 4. [Google Scholar] [CrossRef]
  15. Dayeh, S.A.; Wang, J.; Li, N.; Huang, J.Y.; Gin, A.V.; Picraux, S.T. Growth, Defect Formation, and Morphology Control of GermaniumÀSilicon Semiconductor Nanowire Heterostructures. Nano Lett. 2011, 11, 4200–4206. [Google Scholar] [CrossRef] [PubMed]
  16. Varahramyan, K.M.; Ferrer, D.; Tutuc, E.; Banerjee, S.K. Band Engineered Epitaxial Ge–SixGe1−x Core-Shell Nanowire Heterostructures. Appl. Phys. Lett. 2009, 95, 033101. [Google Scholar] [CrossRef]
  17. Lauhon, L.J.; Gudiksen, M.S.; Wang, D.; Lieber, C.M. Epitaxial Core–Shell and Core–Multishell Nanowire Heterostructures. Nature 2002, 420, 57–61. [Google Scholar] [CrossRef]
  18. Bi, K.; Wang, J.; Wang, Y.; Sha, J.; Wang, Z.; Chen, M.; Chen, Y. The Thermal Conductivity of SiGe Heterostructure Nanowires with Different Cores and Shells. Phys. Lett. A 2012, 376, 2668–2671. [Google Scholar] [CrossRef]
  19. Xie, G.; Li, B.; Yang, L.; Cao, J.; Guo, Z.; Tang, M.; Zhong, J. Ultralow Thermal Conductivity in Si/Ge x Si 1−x Core-Shell Nanowires. J. Appl. Phys. 2013, 113, 083501. [Google Scholar] [CrossRef] [Green Version]
  20. Hu, M.; Giapis, K.P.; Goicochea, J.V.; Zhang, X.; Poulikakos, D. Significant Reduction of Thermal Conductivity in Si/Ge Core−Shell Nanowires. Nano Lett. 2011, 11, 618–623. [Google Scholar] [CrossRef] [PubMed]
  21. Dresselhaus, M.S.; Chen, G.; Tang, M.Y.; Yang, R.G.; Lee, H.; Wang, D.Z.; Ren, Z.F.; Fleurial, J.-P.; Gogna, P. New Directions for Low-Dimensional Thermoelectric Materials. Adv. Mater. 2007, 19, 1043–1053. [Google Scholar] [CrossRef]
  22. Mauser, K.W.; Solà-Garcia, M.; Liebtrau, M.; Damilano, B.; Coulon, P.-M.; Vézian, S.; Shields, P.A.; Meuret, S.; Polman, A. Employing Cathodoluminescence for Nanothermometry and Thermal Transport Measurements in Semiconductor Nanowires. ACS Nano 2021, 15, 11385–11395. [Google Scholar] [CrossRef] [PubMed]
  23. Lim, B.; Cui, X.Y.; Ringer, S.P. Strain-Mediated Bandgap Engineering of Straight and Bent Semiconductor Nanowires. Phys. Chem. Chem. Phys. 2021, 23, 5407–5414. [Google Scholar] [CrossRef] [PubMed]
  24. Li, J.-F.; Liu, W.-S.; Zhao, L.-D.; Zhou, M. High-Performance Nanostructured Thermoelectric Materials. NPG Asia Mater 2010, 2, 152–158. [Google Scholar] [CrossRef]
  25. Vineis, C.J.; Shakouri, A.; Majumdar, A.; Kanatzidis, M.G. Nanostructured Thermoelectrics: Big Efficiency Gains from Small Features. Adv. Mater. 2010, 22, 3970–3980. [Google Scholar] [CrossRef]
  26. Tang, D.-M.; Ren, C.-L.; Wang, M.-S.; Wei, X.; Kawamoto, N.; Liu, C.; Bando, Y.; Mitome, M.; Fukata, N.; Golberg, D. Mechanical Properties of Si Nanowires as Revealed by in Situ Transmission Electron Microscopy and Molecular Dynamics Simulations. Nano Lett. 2012, 12, 1898–1904. [Google Scholar] [CrossRef]
  27. Zhang, C.; Kvashnin, D.G.; Bourgeois, L.; Fernando, J.F.S.; Firestein, K.; Sorokin, P.B.; Fukata, N.; Golberg, D. Mechanical, Electrical, and Crystallographic Property Dynamics of Bent and Strained Ge/Si Core–Shell Nanowires as Revealed by in Situ Transmission Electron Microscopy. Nano Lett. 2018, 18, 7238–7246. [Google Scholar] [CrossRef] [Green Version]
  28. Jing, Y.; Meng, Q. Molecular Dynamics Simulations of the Mechanical Properties of Crystalline/Amorphous Silicon Core/Shell Nanowires. Phys. B Condens. Matter 2010, 405, 2413–2417. [Google Scholar] [CrossRef]
  29. Sarkar, J. Investigation of Mechanical Properties and Deformation Behavior of Single-Crystal Al-Cu Core-Shell Nanowire Generated Using Non-Equilibrium Molecular Dynamics Simulation. J. Nanopart. Res. 2018, 20, 153. [Google Scholar] [CrossRef]
  30. Sarkar, J.; Das, D.K. Molecular Dynamics Study of Defect and Dislocation Behaviors during Tensile Deformation of Copper-Silver Core-Shell Nanowires with Varying Core Diameter and Shell Thickness. J. Nanopart. Res. 2018, 20, 272. [Google Scholar] [CrossRef]
  31. Liu, X.W.; Hu, J.; Pan, B.C. The Composition-Dependent Mechanical Properties of Ge/Si Core–Shell Nanowires. Phys. E Low-Dimens. Syst. Nanostructures 2008, 40, 3042–3048. [Google Scholar] [CrossRef]
  32. Thanh, V.; Quang, T.; Hung, N.; Vu, H.; Truong, D. Investigate the Mechanical Properties of Si/Ge (Ge/Si) Core-Shell Nanowires: A Molecular Dynamics Study. Sci. Technol. Dev. J.-Eng. Technol. 2020, 3, first. [Google Scholar] [CrossRef]
  33. Zhu, Y.; Zhang, X.; Zhang, S.; Sun, X.; Wang, L.; Ma, M.; Liu, R. First-Principles Investigations on Thermodynamic Properties of the Ordered and Disordered Si0.5Ge0.5 Alloys. Appl. Phys. A 2014, 115, 667–670. [Google Scholar] [CrossRef]
  34. Zhang, Y.; Cao, J.X.; Xiao, Y.; Yan, X.H. Phonon Spectrum and Specific Heat of Silicon Nanowires. J. Appl. Phys. 2007, 102, 104303. [Google Scholar] [CrossRef]
  35. Xu, Y.; Li, G. Strain Effect Analysis on Phonon Thermal Conductivity of Two-Dimensional Nanocomposites. J. Appl. Phys. 2009, 106, 114302. [Google Scholar] [CrossRef]
  36. Meyer, R.; Scherthan, L.; Hochdörffer, T.; Sadashivaiah, S.; Wolny, J.A.; Klein, M.W.; Smaga, M.; Beck, T.; Schünemann, V.; Urbassek, H.M. Changes in the Phonon Density of States of Fe Induced by External Strain. Appl. Phys. A 2021, 127, 5. [Google Scholar] [CrossRef]
  37. Algharagholy, L.A.A.; Pope, T.; Lambert, C.J. Strain-Induced Bi-Thermoelectricity in Tapered Carbon Nanotubes. J. Phys. Condens. Matter 2018, 30, 105304. [Google Scholar] [CrossRef] [Green Version]
  38. Hunt, M.; Salmon, K.; Haney, J.; Evans, C.; Gozen, A.; Leachman, J. Ultimate Tensile Strengths of 3D Printed Carbon-Fiber Reinforced Thermoplastics in Liquid Nitrogen. IOP Conf. Ser. Mater. Sci. Eng. 2020, 755, 012118. [Google Scholar] [CrossRef]
  39. Xiang, J.; Lu, W.; Hu, Y.; Wu, Y.; Yan, H.; Lieber, C.M. Ge/Si Nanowire Heterostructures as High-Performance Field-Effect Transistors. Nature 2006, 441, 489–493. [Google Scholar] [CrossRef]
  40. Aryal, S.; Pati, R. Spin Filtering with Mn-Doped Ge-Core/Si-Shell Nanowires. Nanoscale Adv. 2020, 2, 1843–1849. [Google Scholar] [CrossRef]
  41. Stukowski, A. Visualization and Analysis of Atomistic Simulation Data with OVITO–the Open Visualization Tool. Model. Simul. Mater. Sci. Eng. 2009, 18, 015012. [Google Scholar] [CrossRef]
  42. Gale, J.D. Computer Session on Molecular Dynamics: Tutorial in Force Field Simulation of Materials with GULP. EPJ Web Conf. 2011, 14, 03005. [Google Scholar] [CrossRef] [Green Version]
  43. Gale, J.D.; Rohl, A.L. The General Utility Lattice Program (GULP). Mol. Simul. 2003, 29, 291–341. [Google Scholar] [CrossRef]
  44. Aryal, S.; Paudyal, D.; Pati, R. Cr-Doped Ge-Core/Si-Shell Nanowire: An Antiferromagnetic Semiconductor. Nano Lett. 2021, 21, 1856–1862. [Google Scholar] [CrossRef]
  45. Laasonen, K.; Panizon, E.; Bochicchio, D.; Ferrando, R. Competition between Icosahedral Motifs in AgCu, AgNi, and AgCo Nanoalloys: A Combined Atomistic–DFT Study. J. Phys. Chem. C 2013, 117, 26405–26413. [Google Scholar] [CrossRef]
  46. Bochicchio, D.; Ferrando, R.; Panizon, E.; Rossi, G. Structures and Segregation Patterns of Ag–Cu and Ag–Ni Nanoalloys Adsorbed on MgO(0 0 1). J. Phys. Condens. Matter 2016, 28, 064005. [Google Scholar] [CrossRef] [PubMed]
  47. Zhao, D.; Dai, F.; Li, J.; Zhang, L. Thermal Stability and Mechanical Properties of Si/Ge Superlattice Nanowires Having Inclination Interfaces from Simulations at Atomic Scale. Appl. Phys. A 2022, 128. [Google Scholar] [CrossRef]
  48. Smirnov, S.V.; Konovalov, A.V.; Myasnikova, M.V.; Khalevitsky, Y.V.; Smirnov, A.S.; Igumnov, A.S. A Hierarchial Modeling of Stress-Strain State of Multiphase Material Subjected to Uniaxial Loading. In AIP Conference Proceedings; AIP Publishing LLC: Ekaterinburg, Russia, 2016; p. 040066. [Google Scholar]
  49. Flubacher, P.; Leadbetter, A.J.; Morrison, J.A. The Heat Capacity of Pure Silicon and Germanium and Properties of Their Vibrational Frequency Spectra. Philos. Mag. 1959, 4, 273–294. [Google Scholar] [CrossRef]
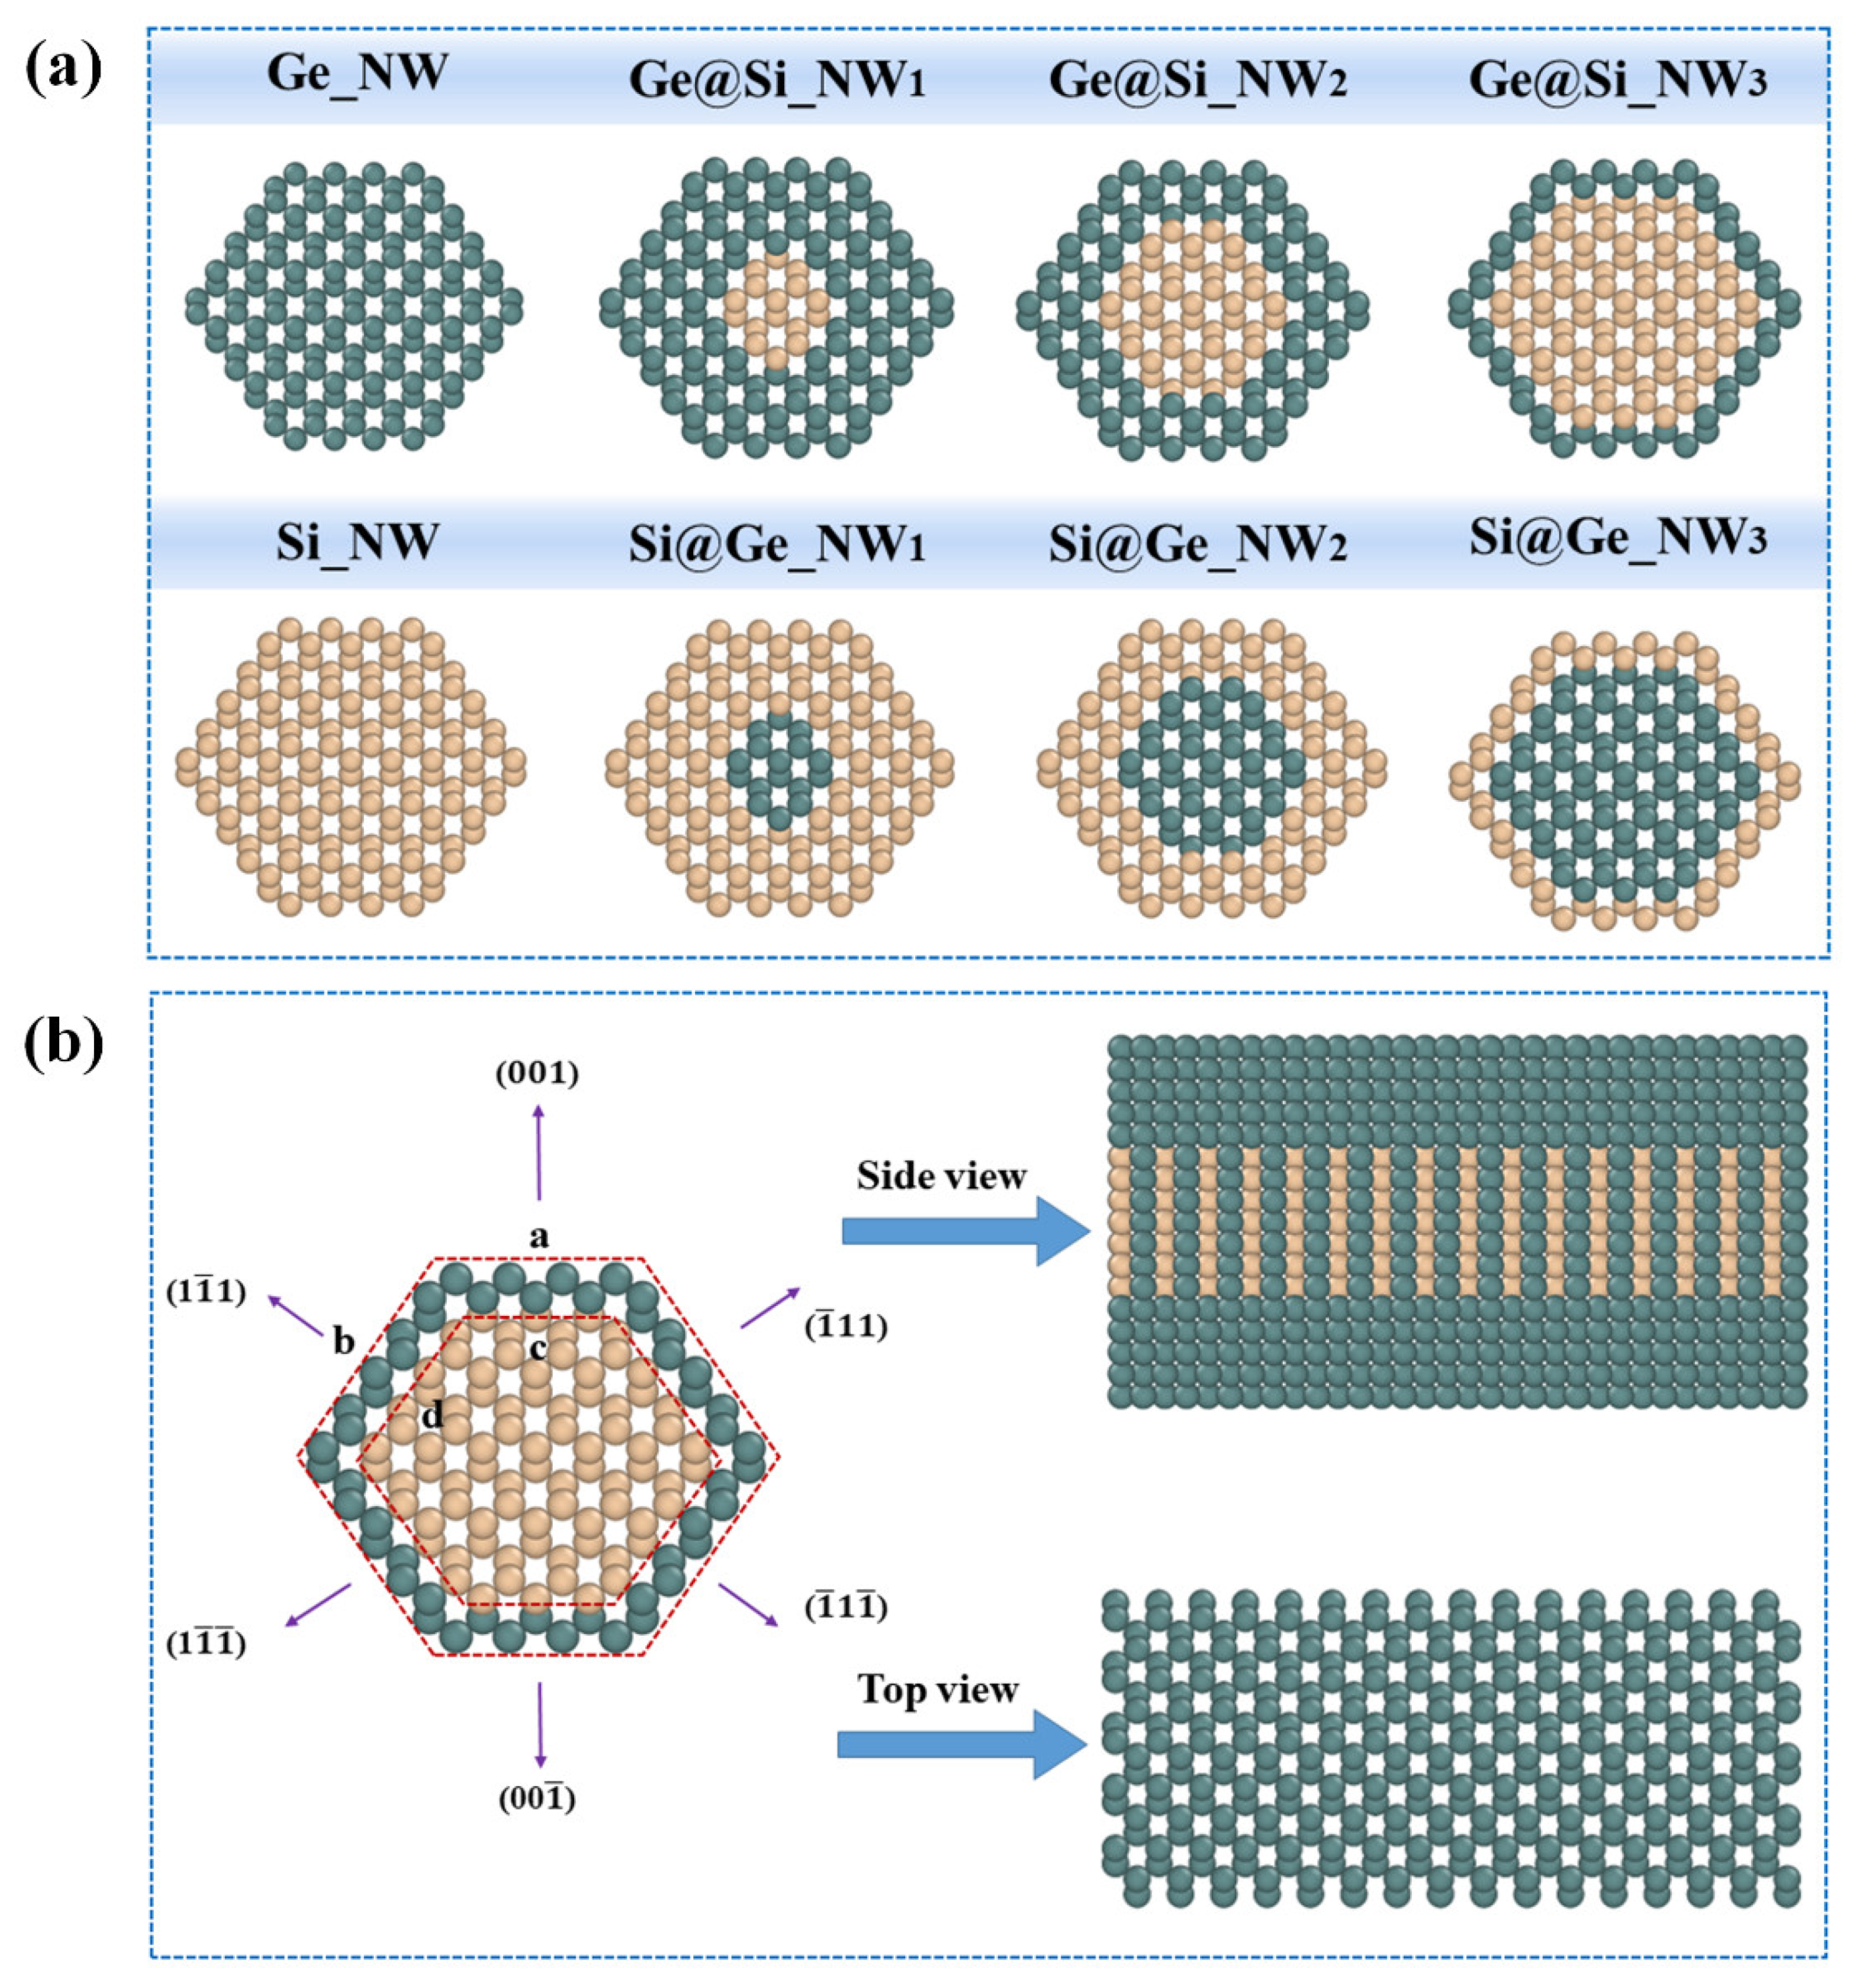
Figure 1. (a) Two-dimensional projections of the atomic structures and initial cross-sections for Ge@Si and Si@Ge nanowires from a [110]-oriented view; (b) a typical example of a two-dimensional projection of the atomic structure of all views for Ge@Si_NW3.
Crystals 12 01447 g001
Figure 2. Variation of potential energy per atom for Ge@Si and Si@Ge nanowires with different core–shell ratios.
Crystals 12 01447 g002
Figure 3. The g(r) of Ge@Si and Si@Ge nanowires with different core–shell ratios after structural relaxation at different temperatures: (a) 300 K; (b) 450 K; (c) 800 K.
Crystals 12 01447 g003
Figure 4. The stress–strain curves and packing images of Ge@Si and Si@Ge nanowires with different core–shell ratios at different temperatures during stretching processes: (a) 300 K; (b) 800 K.
Crystals 12 01447 g004
Figure 5. Young’s modulus of Ge@Si and Si@Ge nanowires with different core–shell ratios at 300 K.
Crystals 12 01447 g005
Figure 6. (a) The Lode–Nadai parameter distributions, where the dark grey and light purple lines correspond to 300 K, and the dark and dark purple lines represent 800 K: (Left) Ge@Si_NW1 and (Right) Si@Ge _NW2 and (b) Lode–Nadai structure distribution map during stretch processes at 300 K and 800 K. The different colors on the atoms (i) represent different Lode–Nadai parameters: (Left) small strain, ε = 0.02 and (Right) larger strain, corresponding to the strain in (a).
Crystals 12 01447 g006
Figure 7. Pressure distributions on the atoms for the Ge@Si and Si@Ge nanowires with different core–shell ratios at different temperatures during stretching processes: (a) 300 K; (b) 800 K.
Crystals 12 01447 g007
Figure 8. Phonon density of state (PDOS) for Ge@Si and Si@Ge nanowires with different core–shell ratios at 300 K.
Crystals 12 01447 g008
Figure 9. Heat capacity (Cv) of Ge@Si and Si@Ge nanowires with different core–shell ratios at 300 K.
Crystals 12 01447 g009
Table 1. Parameters that were used for silicon and germanium.
ParameterSiGe
A (eV)1.8308 × 1031.769 × 103
B (eV)4.7118 × 1024.1923 × 102
λ−1)2.47992.4551
μ−1)1.73221.7047
β1.1000 × 10−69.0166 × 10−7
n7.8734 × 10−17.5627 × 10⁻¹
c1.0039 × 1051.0643 × 105
d1.6217 × 1011.5652 × 101
h−5.9825 × 10⁻¹−4.3884 × 10⁻¹
R (Å)2.72.8
S (Å)3.03.1
χ S i G e = 1.00061
Table 2. The structural parameters of Ge@Si and Si@Ge nanowires with different core–shell ratios.
TypeSide Length of Shell
(nm)
LabelGe%Side Length of Core
(nm)
abcd
Pure_Ge1.55391.1520Ge_NW1--
Ge_shell_Si_core 1.55391.1520Ge@Si_NW10.87700.5918
Ge@Si_NW20.6770.38400.8903
Ge@Si_NW30.3850.76801.2369
Si_shell_Ge_core1.55391.1520Si@Ge_NW10.1230.76801.2369
Si@Ge_NW20.3230.38400.8903
Si@Ge_NW30.61500.5918
Pure_Si1.55391.1520Si_NW0--
Table 3. Tensile strength of Ge@Si and Si@Ge nanowires with different core–shell ratios at 300 K and 800 K.
Label300 K800 K
StrainTensile Strength
(Rm/GPa)
StrainTensile Strength
(Rm/GPa)
Ge_NW0.328.2130.246.333
Ge@Si_NW10.388.1540.285.967
Ge@Si_NW20.366.8500.285.625
Ge@Si_NW30.346.4710.265.013
Si@Ge_NW10.346.3550.265.949
Si@Ge_NW20.346.1800.265.635
Si@Ge_NW30.346.0960.265.530
Si_NW0.366.0160.305.766
Publisher’s Note: MDPI stays neutral with regard to jurisdictional claims in published maps and institutional affiliations.