Article

Robust UV Plasmonic Properties of Co-Doped Ag2Te

1
School of Electronic Science and Engineering, Nanjing University, Nanjing 210093, China
2
Henan Key Laboratory of Rare Earth Functional Materials, Zhoukou Normal University, Zhoukou 466001, China
3
School of Geography and Biological Information, Nanjing University of Posts and Telecommunications, Nanjing 210023, China
*
Authors to whom correspondence should be addressed.
Crystals 2022, 12(10), 1469; https://doi.org/10.3390/cryst12101469
Submission received: 22 September 2022 / Revised: 11 October 2022 / Accepted: 11 October 2022 / Published: 17 October 2022
(This article belongs to the Special Issue Advances in Polaritons)

Abstract

:
Ag2Te is a novel topological insulator system and a new candidate for plasmon resonance due to the existence of a Dirac cone in the low-energy region. Although the optical response spectrum of Ag2Te has been studied by theoretical and experimental methods, the plasmon resonance and stability of Co-doped Ag2Te remain elusive. Here, we theoretically report a new unconventional UV plasmon mode and its stability in Co-doped Ag2Te. Through density functional theory (DFT), we identify a deep UV plasmon mode within 15–40 eV, which results from the enhanced inter-band transition in this range. The deep UV plasmon is important for detection and lithography, but they have previously been difficult to obtain with traditional plasmon materials such as noble metals and graphene, while most of which only support plasmons in the visible and infrared spectra. Furthermore, we should highlight that the high-energy dielectric function is almost invariant under different doping amounts, indicating that the UV plasmon of Ag2Te is robust under Co doping. Our results predict a spectrum window of a robust deep UV plasmon mode for Ag2Te-related material systems.

1. Introduction

As a class of topological materials, Dirac semimetals have linear band dispersion around the conduction and valence band touching point, the so-called Dirac cone [1,2,3,4]. In recent years, topological Dirac materials have attracted wide attention for their ability to support nearly zero mass fermions around the Dirac cone, which can induce extremely high mobility and make the Dirac material an ideal system to support collective electromagnetic oscillations [5,6,7,8]. Graphene is a 2D topological Dirac material that hosts two pairs of Dirac cones in the Brillouin zone. Its infrared plasmon has been widely studied, but the 2.3% light absorption of monolayer graphene limits its further application [9,10]. A Dirac material system with a stronger light-matter interaction is urgently needed.
Recent reports revealed that the silver telluride material has unique properties for electronic and optical applications [11,12,13]. The Ag2Te monoclinic phase in particular has been proven to possess an isotropic Dirac cone, which makes Ag2Te exhibit topological properties [14]. The large number of massless fermions supplied by Dirac cones makes Ag2Te a promising candidate for collective electromagnetic oscillations [15,16]. The bulk character endows Ag2Te with a better light–matter interaction than graphene. Previous research on Ag2Te concentrated on its basic optical properties and topological behavior [11], but the physical picture of plasmon resonance remains unclear.
In recent years, great progress has been made in spintronics devices that use the spin of a semiconductor as a degree of freedom [17,18,19,20,21,22]. By doping a semiconductor with dilute magnetism, materials with both semiconductor and magnetic properties are obtained at room temperature, providing a promising approach for realizing the next generation of spin-based logic electronics [23,24]. Since the realization of room-temperature ferromagnetism of ZnO through Mn doping, doping of semiconductors with transition metals (Mn, In, Co and Cr) to achieve room-temperature ferromagnetism has become a common way to realize dilute magnetic semiconductors [25,26,27,28].
In this work, we comprehensively investigated the electronic structure and optical properties of Ag2Te through density functional theory (DFT). The reflectivity of Ag2Te coincides well with previous experimental results [15]. The real part of the dielectric function is negative when the optical energy is below 0.1 eV and in the range of 12–20 eV, in which the former comes from Drude free electrons, while the latter stems from a higher density of states (DOS) in the high-energy region. Surface plasmon polaritons (SPPs) are excited at the material interface where the real part of the dielectric function is negative on one side and positive on the other side. The plasmon of Ag2Te is supported in both the infrared and UV energy regions. The perturbation applied to the electronic structure through Co atom doping can open a band gap and make the semimetal become a semiconductor, while the UV plasmon is robust to Co atom doping.

2. Methods

We perform first-principles methods using CASTEP to calculate the electronic structure and energy. The generalized gradient approximation (GGA) of Perdew, Burke and Ernzerhof (PBE) is used for the exchange-correlation potential [29,30,31]. The plane-wave basis cutoff energy is 490 eV. SCF (Self Consistent Field) energy tolerance is 1 × 10 6 eV/atom. To analyze the electronic properties in the 6.25% doping concentration system, we use a 2 × 1 supercell of Ag2Te with an Ag atom substituted by a Co atom. For the 12.5% doping concentration, we use a 1 × 1 crystal cell. The geometry optimization energy convergence tolerance is set as 2.0 × 10 5 eV/atom. A 3 × 4 × 3 Monkhorst-Pack mesh grid is used to sample the Brillouin zone.
Optical properties are calculated by performing Kubo formula [32]: σ ( Ω ) = 2 e 2 Ω μ Ω μ d ω 2 π   d 2 k ( 2 π ) 2 · T r [ v ^ x A ^ ( k , ω + Ω ) v ^ x A ^ ( k , ω ) ] , where Ω is the energy of the incident light, A ^ ( k , ω ) derives from Green’s function G ^ x x ( z ) = d ω A ^ x x ( ω ) / [ 2 π ( z ω ) ]   , G ^ x x ( z ) express from G ^ 1 ( z ) = z I ^ H ^ , I ^ is unit matrix, k integration over Brillouin zone and   μ is the chemical potential set as 150 meV,   v ^ x = H ^ / k x . This means that once we have modelled the material in inverted space and written out its Hamiltonian, the conductivity function can be calculated using the Kubo formula. Dielectric function is obtained by: ε ( ω ) = 1 + i σ ( ω ) ε 0 ω . The optical properties of Ag2Te are calculated by the Kubo formula in CASTEP software. The optical properties of bilayer graphene are calculated by directly performing the Kubo formula. In the calculation of dielectric functions, we also consider the influence of the Drude model while the energy is below 0.25 eV. For the Drude model, the dielectric function can be obtained by ε ( ω ) = 1 ω p 2 ω 2 + i γ ω , where ω p = n e 2 ε 0 m . The ω is energy of light, ω p is oscillation energy of free electrons, n is concentration of electrons, m is mass of electrons and γ stands for scattering frequency, usually dependent on mobility. In the Drude model, carrier’s concentration and mobility determined the dielectric function. In our calculation of Ag2Te, the concentration of electrons n = 1.16 × 10 18   cm 3 [15]. According to this concentration of electrons, ω p = 0.25   eV . The mobility of electrons μ = 22,000   cm 2 / ( V   s ) [14]. It is close to the mobility of graphene. Therefore, we set the γ of Ag2Te as γ = 0.001   eV , which is the same order of graphene’s scattering frequency [5]. The dynamic reflectivity spectrum of Ag2Te is obtained from the dielectric function by R ( ω ) = ( ε ( ω ) 1 ε ( ω ) + 1 ) 2 .

3. Results and Discussion

3.1. Electronic Structure and Plasmonic Properties

Silver telluride material systems usually have two chemically stable stoichiometric crystals: AgTe and Ag2Te [33,34]. AgTe has the space group Pmnb with an orthorhombic crystal lattice, while Ag2Te exhibits a monoclinic phase ( β ) at room temperature, as shown in the crystal structure in Figure 1a. The band structure calculated by DFT is illustrated in Figure 1b. Analogous to graphene, the conduction band and valence band touch and form a dispersion-less Dirac point, making Ag2Te exhibit a high electron mobility of more than 22,000 cm2/Vs [14].
Previous works have predicted that Ag2Te is a good candidate for plasmon applications [11], which is attributed to the large number of massless free electrons provided by Dirac cones and the semimetal properties, similar to graphene and precious metals. The collective electromagnetic oscillation of free carriers is usually described by the Drude model, and it stems from an intraband transition, in which the number of free electrons dominates the frequency of the oscillation. As shown in Figure 2, the solid purple line represents the density of states (DOS) of Ag2Te. The DOS is minimized at the charge neutrality point and rapidly increases away from the Dirac point, which means that the optical properties of Ag2Te away from the Dirac cone are determined by the interband transition. Figure 2 depicts the contribution of the individual orbitals of each atom in Ag2Te to the DOS. It can be clearly observed that the density of states of silver telluride at −5 eV comes from the contribution of the d-orbital of the Ag and the p-orbital of the Te. The s-orbitals of the Te atom provide the DOS for the inner valence electrons. The doped Co atom introduces DOS in the d orbitals near Dirac, which we analyse later in this section.
The distribution of electrons at different energy scales strongly influences the optical properties of materials. As shown in Figure 3a, the calculated dielectric function   ε ( ω ) clearly exhibits a Drude model character in the low-energy region. The real part of the dielectric function is negative below 0.1 eV, namely, plasmon resonance exists in the far-infrared region with wavelengths above 10   μ m . The dielectric function grows sharply below 0.1, while when the optical energy exceeds 0.1 eV, the real part of the dielectric function decreases, and the imaginary part of the dielectric function increases. This phenomenon demonstrates that other mechanisms offset the Drude model above 0.1 eV. This corresponds to traditional plasmon materials such as metals and graphene, as shown in Figure S1a, and the reason can be attributed to the interband transition. When the optical energy reaches 10 eV, the real part of the dielectric function becomes negative again. This result coincides with the peak at approximately −10 eV in the DOS, from which we can infer that the strong interband transition and inner valence electrons oscillation causes a negative real part of the dielectric function. The calculated dielectric function is consistent with the previous experimental fit [15], which indicates that our calculation method was applied correctly.
The calculated reflectivity spectrum is illustrated in the inset of Figure 3a. It shows that light is strongly reflected in the low energy region (at less than 0.1 eV), after decaying rapidly with increasing energy, then rises again and finally decreases slowly with increasing energy. The small valley at 0.1 eV denotes intraband transition absorption, which is common in precious metals and graphene [16]. This reflectivity spectrum is in good agreement with previous experimental results [15]. Compared to the previous reflectance spectra in ref [11], our calculations are in better agreement with the experiment results.
To analyze the plasmon resonance mode in Ag2Te, we calculated the SPPs (Surface plasmon polaritons) dispersion at the interface of air and the Ag2Te material. As we know, a transverse magnetic (TM) mode SPPs exists at the interface when the real part of the dielectric function is opposite in sign in the two media. In other words, a TM mode SPPs is excited at the interface of air and a material with a negative real part of the dielectric function. For precious metals and graphene, the real part of the dielectric function is always negative when the optical energy ω is less than the plasmon resonance frequency ω p . For the Ag2Te material, the real part of the dielectric function is negative in the range from 10–20 eV. At the interface of air and Ag2Te, the TM SPPs dispersion can be described by solving the plasmon loss function [35] ( k , ω ) Im { 1 1 + i k 2 L k , ω σ ( ω ) ω } , where L q , ω = 2 π k ε ¯ ( ω ) . In the loss function, the optical conductivity is derived by ε ( ω ) = 1 + i σ ( ω ) ε 0 ω . The dielectric function ε ( ω ) was produced by CASTEP. Therefore, the loss function ( k , ω ) can been calculated by giving the value of wavenumber k and energy ω ; the calculation result is illustrated in Figure 3b. The white dashed curve denotes the SPPs dispersion relationship, and the red dashed line denotes the dispersion of light in free space. In contrast to graphene and precious metals, the SPPs dispersion in Ag2Te extends to the ultraviolet energy range, which coincides with the previous theoretical plasmon energy of 17.2 eV [11]. This plasmon resonance mode is very similar to the so-called plasmon γ -mode at approximately 0.4 eV in AB stacked bilayer graphene [36], for which the interband transition of inner-shell valence electron dominates the optical properties and makes the real part of the dielectric function negative, as shown in Figure S1b. From the dispersion relation, we can infer that at wavenumber k = 1.5 × 10 7   m 1 , plasmon resonance occurs at optical energy ω = 20   eV . This plasmon wavenumber can be provided by periodic ribbons with width [37] w = π k ; for k = 3 × 10 7   m 1 , w = 105   nm , which is consistent with the actual growth of Ag2Te nanowires, as shown in Figure S2. SPPs can be excited in the UV band by arranging the nanowires in a fixed period, thus greatly improving the interaction between light and the Ag2Te material.

3.2. Robust UV Optical Properties under Co Doping

In this section, we found that Co doping of Ag2Te can effectively modulate its low-energy electronic structure and achieve magnetic doping of Ag2Te while opening a band gap and maintaining its high-energy optical properties.
We perform the geometry optimization to the lattice of Ag2Te doped with Co. The principle of geometry optimization is to find the lowest energy of the system (see Methods for details). Co doping in Ag2Te is atomic substitutional doping, in which Co atoms replace Ag atoms. Considering the lattice symmetry of Ag2Te, there are four kinds of Co substitutions in the Ag2Te lattice; the positions replaced by Co atoms correspond to the positions of Ag1, Ag2, Ag5 and Ag6 in Figure S3a. We named each doping kind as types A, B, C and D. For each type, the enthalpy required to form a specific lattice structure is −31,427.94 eV, −31,428.53 eV, −31,427.99 eV and −31,426.74 eV, respectively. The differences in enthalpy are not negligible, indicating that only type B exists. The optimized geometry lattice constants are shown in Table 1. Compared to the original lattice, the doped lattice is slightly displaced to ensure the lowest overall energy. The above four energies are for a doping concentration of 12.5% Co, while the energies for 6.25% and 25% doping are shown in Figure S3.
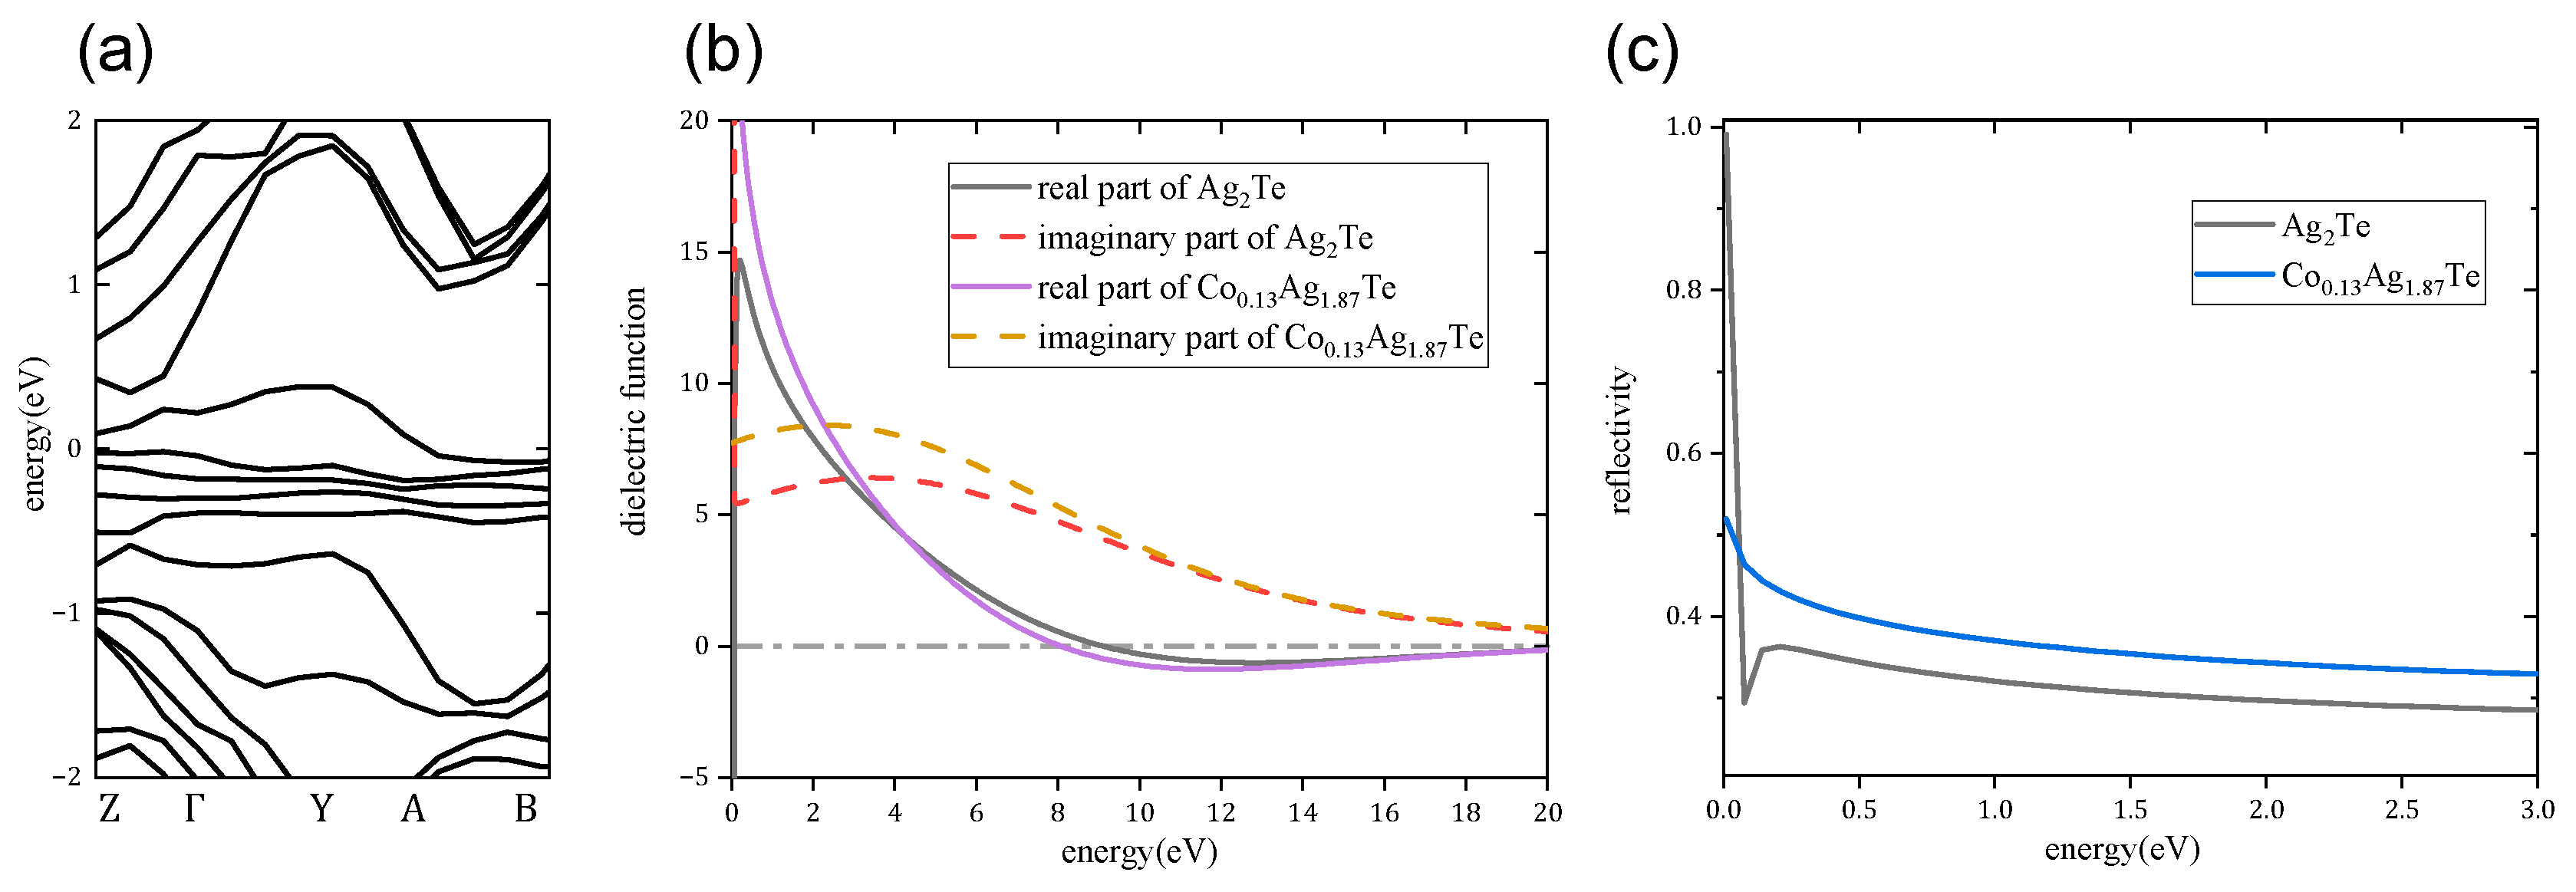
The DOS of Co is calculated in Figure 2. The doped Co atoms contribute the DOS from the d orbitals, which mainly affects the electronic structure near the Dirac point of Ag2Te. The energy band structure of Co0.13Ag1.87Te are shown in Figure 4a, and the energy band structures for the other doping concentrations are shown in Figure S3b,c. Compared with the energy band structure of undoped Ag2Te in Figure 1b, the energy band of Co0.13Ag1.87Te shows a significant band gap opening at the Dirac point. The highest point of the valence band is higher than the lowest point of the conduction band. Thus, the material can still be considered a half-metal, but the position of the energy valley is shifted. The disappearance of the Dirac cone of Co0.13Ag1.87Te is similar to the opening of the Dirac cone in the surface state in the Bi2Se3 system, with the difference being that Co doping of Ag2Te shows that magnetic doping can also change the bulk topological properties [38,39]. Similar to graphene, the existence of a Dirac cone originates from the fourfold degeneracy under the combination of time-reversal symmetry and inversion symmetry. Magnetic doping, in contrast, breaks both the time-reversal symmetry and the inversion symmetry of the material, which leads to opening of a band gap and a change in the topological properties of the material [40,41].
Co doping also changes the optical properties of Ag2Te. We should highlight that the opening of the Dirac cone leads to changes in the low-energy excitation of the material and a decreased number of Drude electrons. As embodied in the dielectric constant, the real part of the dielectric function of Co0.13Ag1.87Te below 0.1 eV is always positive, as shown in Figure 4b, while the real part of the dielectric function of undoped Ag2Te ranges from negative to positive below 0.1 eV according to the above calculation. A negative real part of the dielectric function of a material is necessary to produce SPPs [10]. Therefore, the far-infrared response of Ag2Te is affected by Co doping. There is no longer any plasmon resonance in the far-infrared waveband, and the reflectivity in the infrared range is greatly reduced (as shown in Figure 4c). In contrast, in the high-energy range, the electron transition in Ag2Te is not significantly affected by Co doping. In Figure 4b, the real part of the dielectric function of Co0.13Ag1.87Te in the energy range of 8–20 eV is similar to that of undoped Ag2Te, and they are both negative. This indicates that the UV plasmonic properties of the Ag2Te material are robust under Co doping. As shown in Figure S3, the dielectric function and reflectivity of Ag2Te have similar behaviors at higher and lower levels of doping, i.e., the low-energy optical transition is broken for both, but the interaction in the UV band remains.
The above results demonstrate that the low-energy excitation of Ag2Te materials significantly depends on the Dirac cone, in which a gap is opened under Co magnetic doping, thus affecting the low-energy excitation and infrared properties of the materials. The influence of magnetic doping on the high-energy electron transition of the material is negligible, which indicates that the UV optical properties of the Ag2Te material system are very stable for Co atom magnetic doping. This offers the possibility of changing the magnetic and semiconducting properties of the material without affecting the UV optical properties. The insensitivity of the high-energy UV properties of Ag2Te to impurities also provides the possibility of low-cost and reliable material growth.

4. Conclusions

Plasmons have long been a hot topic of the nanophotonics field due to their ability to enhance light-matter interactions at tiny scales. The surface plasmon resonance of metallic materials is generally excited at visible and near-infrared wavelengths, while the surface plasmon of graphene acts at mid-infrared wavelengths. Ag2Te, a new topological material system, provides a promising approach for realizing plasmon resonance in the UV spectrum because of its unique dielectric response properties. We investigated the optical properties and UV plasmonic properties of Ag2Te materials through DFT calculations. The reflectivity spectrum is almost consistent with previous experiments, indicating that our study method is correct. We should highlight that under Co doping of Ag2Te materials, magnetic doping opens the Dirac cone by breaking the time-reversal symmetry and inversion symmetry of the material, but the UV excitation of Ag2Te materials remains stable, indicating that Ag2Te is a versatile platform that can possess both magnetic and semiconducting properties while maintaining UV excitation. Our discovery not only reveals a novel material platform for robust UV plasmon resonance but also provides predictions of the doping properties of Ag2Te materials.

Supplementary Materials

The following supporting information can be downloaded at: https://www.mdpi.com/article/10.3390/cryst12101469/s1, Figure S1. Dielectric function of monolayer graphene (a) and AB stacked bilayer graphene (b). Figure S2. Scanning electron microscope (SEM) picture and energy dispersive spectroscopy (EDS) mapping for Ag2Te nanowires synthesized by hydrothermal method. Scale bar: 1 μ m . Figure S3. Electronic structure and optical properties for Co atom doped Ag2Te. (a) The lattice structure of Ag2Te, in which the position of Ag atoms is marked. (b,c) Calculated band structure for Co atom doped Ag2Te with doping concentration in 6.25% and 25%, respectively. The enthalpy is marked. (d,e) Optical reflectance (d) and dielectric function (e) under two concentration of Co atom doping.

Author Contributions

Conceptualization, S.Y. and Y.S.; methodology, X.S.; software, X.S. and H.S.; validation, Y.G. and Q.W.; formal analysis, S.Y.; investigation, X.S.; resources, S.Y.; data curation, X.S. writing—original draft preparation, X.S.; writing—review and editing, S.Y. and Y.S.; visualization, X.S.; supervision, S.Y.; project administration, Y.S.; funding acquisition, Y.S. All authors have read and agreed to the published version of the manuscript.

Funding

This work was supported by the National Key R&D Program of China (No. 2018YFA0209100) and the National Natural Science Foundation of China (Nos. 62274093, 61991431 and 61921005).

Institutional Review Board Statement

Not applicable.

Informed Consent Statement

Not applicable.

Data Availability Statement

The data presented in this study are available in the article.

Conflicts of Interest

The authors declare no conflict of interest.

References

  1. Chen, Y.L.; Chu, J.H.; Analytis, J.G.; Liu, Z.K.; Igarashi, K.; Kuo, H.H.; Qi, X.L.; Mo, S.K.; Moore, R.G.; Lu, D.H.; et al. Massive Dirac Fermion on the Surface of a Magnetically Doped Topological Insulator. Science 2010, 329, 659–662. [Google Scholar] [CrossRef] [PubMed] [Green Version]
  2. Young, S.M.; Zaheer, S.; Teo, J.C.Y.; Kane, C.L.; Mele, E.J.; Rappe, A.M. Dirac Semimetal in Three Dimensions. Phys. Rev. Lett. 2012, 108, 140405. [Google Scholar] [CrossRef] [PubMed] [Green Version]
  3. Young, S.M.; Kane, C.L. Dirac Semimetals in Two Dimensions. Phys. Rev. Lett. 2015, 115, 126803. [Google Scholar] [CrossRef] [PubMed] [Green Version]
  4. Gibson, Q.D.; Schoop, L.M.; Muechler, L.; Xie, L.S.; Hirschberger, M.; Ong, N.P.; Car, R.; Cava, R.J. Three-dimensional Dirac semimetals: Design principles and predictions of new materials. Phys. Rev. B 2015, 91, 205128. [Google Scholar] [CrossRef] [Green Version]
  5. Ju, L.; Geng, B.S.; Horng, J.; Girit, C.; Martin, M.; Hao, Z.; Bechtel, H.A.; Liang, X.G.; Zettl, A.; Shen, Y.R.; et al. Graphene plasmonics for tunable terahertz metamaterials. Nat. Nanotechnol. 2011, 6, 630–634. [Google Scholar] [CrossRef] [PubMed]
  6. Fei, Z.; Andreev, G.O.; Bao, W.Z.; Zhang, L.F.M.; McLeod, A.S.; Wang, C.; Stewart, M.K.; Zhao, Z.; Dominguez, G.; Thiemens, M.; et al. Infrared Nanoscopy of Dirac Plasmons at the Graphene-SiO2 Interface. Nano Lett. 2011, 11, 4701–4705. [Google Scholar] [CrossRef] [Green Version]
  7. Stauber, T. Plasmonics in Dirac systems: From graphene to topological insulators. J. Phys. Condens. Matter 2014, 26, 123201. [Google Scholar] [CrossRef] [Green Version]
  8. Kotov, O.V.; Lozovik, Y.E. Dielectric response and novel electromagnetic modes in three-dimensional Dirac semimetal films. Phys. Rev. B 2016, 93, 235417. [Google Scholar] [CrossRef] [Green Version]
  9. Nair, R.R.; Blake, P.; Grigorenko, A.N.; Novoselov, K.S.; Booth, T.J.; Stauber, T.; Peres, N.M.R.; Geim, A.K. Fine structure constant defines visual transparency of graphene. Science 2008, 320, 1308. [Google Scholar] [CrossRef] [PubMed] [Green Version]
  10. Grigorenko, A.N.; Polini, M.; Novoselov, K.S. Graphene plasmonics. Nat. Photonics 2012, 6, 749–758. [Google Scholar] [CrossRef]
  11. Zhu, J.; Pandey, R. Silver tellurides: Structural, elastic, and optical properties of AgTe and Ag2Te. J. Phys. Chem. Solids 2019, 129, 41–45. [Google Scholar] [CrossRef]
  12. Ouyang, J.; Graddage, N.; Lu, J.; Zhong, Y.; Chu, T.-Y.; Zhang, Y.; Wu, X.; Kodra, O.; Li, Z.; Tao, Y.; et al. Ag2Te Colloidal Quantum Dots for Near-Infrared-II Photodetectors. ACS Appl. Nano Mater. 2021, 4, 13587–13601. [Google Scholar] [CrossRef]
  13. Liu, Y.-W.; Ko, D.-K.; Oh, S.J.; Gordon, T.R.; Doan-Nguyen, V.; Paik, T.; Kang, Y.; Ye, X.; Jin, L.; Kagan, C.R.; et al. Near-Infrared Absorption of Monodisperse Silver Telluride (Ag2Te) Nanocrystals and Photoconductive Response of Their Self-Assembled Superlattices. Chem. Mater. 2011, 23, 4657–4659. [Google Scholar] [CrossRef]
  14. Lee, S.; In, J.; Yoo, Y.; Jo, Y.; Park, Y.C.; Kim, H.-j.; Koo, H.C.; Kim, J.; Kim, B.; Wang, K.L. Single Crystalline β-Ag2Te Nanowire as a New Topological Insulator. Nano Lett. 2012, 12, 4194–4199. [Google Scholar] [CrossRef] [PubMed]
  15. Yeh, T.-T.; Lin, W.H.; Tzeng, W.-Y.; Le, P.H.; Luo, C.-W.; Milenov, T.I. The optical properties of Ag2Te crystals from THz to UV. J. Alloys Compd. 2017, 725, 433–440. [Google Scholar] [CrossRef]
  16. Horng, J.; Chen, C.F.; Geng, B.S.; Girit, C.; Zhang, Y.B.; Hao, Z.; Bechtel, H.A.; Martin, M.; Zettl, A.; Crommie, M.F.; et al. Drude conductivity of Dirac fermions in graphene. Phys. Rev. B 2011, 83, 165113. [Google Scholar] [CrossRef] [Green Version]
  17. Baltz, V.; Manchon, A.; Tsoi, M.; Moriyama, T.; Ono, T.; Tserkovnyak, Y. Antiferromagnetic spintronics. Rev. Mod. Phys. 2018, 90, 015005. [Google Scholar] [CrossRef] [Green Version]
  18. Bauer, G.E.W.; Saitoh, E.; van Wees, B.J. Spin caloritronics. Nat. Mater. 2012, 11, 391–399. [Google Scholar] [CrossRef] [Green Version]
  19. Beaurepaire, E.; Merle, J.C.; Daunois, A.; Bigot, J.Y. Ultrafast spin dynamics in ferromagnetic nickel. Phys. Rev. Lett. 1996, 76, 4250–4253. [Google Scholar] [CrossRef]
  20. Bell, C.; Milikisyants, S.; Huber, M.; Aarts, J. Spin dynamics in a superconductor-ferromagnet proximity system. Phys. Rev. Lett. 2008, 100, 047002. [Google Scholar] [CrossRef] [PubMed]
  21. Chang, C.Z.; Li, M.D. Quantum anomalous Hall effect in time-reversal-symmetry breaking topological insulators. J. Phys. Condens. Matter 2016, 28, 123002. [Google Scholar] [CrossRef] [Green Version]
  22. Chen, J.Y.; Wong, T.M.; Chang, C.W.; Dong, C.Y.; Chen, Y.F. Self-polarized spin-nanolasers. Nat. Nanotechnol. 2014, 9, 845–850. [Google Scholar] [CrossRef]
  23. Prinz Gary, A. Magnetoelectronics. Science 1998, 282, 1660–1663. [Google Scholar] [CrossRef] [PubMed]
  24. Wolf, S.A.; Awschalom, D.D.; Buhrman, R.A.; Daughton, J.M.; von Molnár, S.; Roukes, M.L.; Chtchelkanova, A.Y.; Treger, D.M. Spintronics: A Spin-Based Electronics Vision for the Future. Science 2001, 294, 1488–1495. [Google Scholar] [CrossRef] [Green Version]
  25. Tietze, T.; Gacic, M.; Schütz, G.; Jakob, G.; Brück, S.; Goering, E. XMCD studies on Co and Li doped ZnO magnetic semiconductors. New J. Phys. 2008, 10, 055009. [Google Scholar] [CrossRef] [Green Version]
  26. Lin, L.; Yao, L.; Li, S.; Shi, Z.; Xie, K.; Huang, J.; Tao, H.; Zhang, Z. Influence of Mn and Co doping on optical and magnetic properties in 3C–SiC. J. Phys. Chem. Solids 2021, 153, 110002. [Google Scholar] [CrossRef]
  27. Chanda, A.; Rout, K.; Vasundhara, M.; Joshi, S.R.; Singh, J. Structural and magnetic study of undoped and cobalt doped TiO2 nanoparticles. RSC Adv. 2018, 8, 10939–10947. [Google Scholar] [CrossRef] [PubMed] [Green Version]
  28. Zhang, J.; Tse, K.; Wong, M.; Zhang, Y.; Zhu, J. A brief review of co-doping. Front. Phys. 2016, 11, 117405. [Google Scholar] [CrossRef] [Green Version]
  29. Kresse, G.; Furthmüller, J. Efficient iterative schemes for ab initio total-energy calculations using a plane-wave basis set. Phys. Rev. B 1996, 54, 11169–11186. [Google Scholar] [CrossRef] [PubMed]
  30. Kresse, G.; Joubert, D. From ultrasoft pseudopotentials to the projector augmented-wave method. Phys. Rev. B 1999, 59, 1758–1775. [Google Scholar] [CrossRef]
  31. Perdew, J.P.; Burke, K.; Ernzerhof, M. Generalized Gradient Approximation Made Simple. Phys. Rev. Lett. 1996, 77, 3865–3868. [Google Scholar] [CrossRef] [PubMed] [Green Version]
  32. Kotliar, G.; Savrasov, S.Y.; Haule, K.; Oudovenko, V.S.; Parcollet, O.; Marianetti, C.A. Electronic structure calculations with dynamical mean-field theory. Rev. Mod. Phys. 2006, 78, 865–951. [Google Scholar] [CrossRef] [Green Version]
  33. Kashida, S.; Watanabe, N.; Hasegawa, T.; Iida, H.; Mori, M. Electronic structure of Ag2Te, band calculation and photoelectron spectroscopy. Solid State Ion 2002, 148, 193–201. [Google Scholar] [CrossRef]
  34. Jahangirli, Z.; Alekperov, O.; Eyyubov, Q. Ab-Initio Investigation of the Electronic Structure, Optical Properties, and Lattice Dynamics of β-Ag2Te. Phys. Status Solidi B 2018, 255, 1800344. [Google Scholar] [CrossRef]
  35. Novelli, P.; Torre, I.; Koppens, F.H.L.; Taddei, F.; Polini, M. Optical and plasmonic properties of twisted bilayer graphene: Impact of interlayer tunneling asymmetry and ground-state charge inhomogeneity. Phys. Rev. B 2020, 102, 125403. [Google Scholar] [CrossRef]
  36. Low, T.; Guinea, F.; Yan, H.; Xia, F.; Avouris, P. Novel Midinfrared Plasmonic Properties of Bilayer Graphene. Phys. Rev. Lett. 2014, 112, 116801. [Google Scholar] [CrossRef] [PubMed] [Green Version]
  37. Yan, H.; Low, T.; Zhu, W.; Wu, Y.; Freitag, M.; Li, X.; Guinea, F.; Avouris, P.; Xia, F. Damping pathways of mid-infrared plasmons in graphene nanostructures. Nat. Photonics 2013, 7, 394–399. [Google Scholar] [CrossRef] [Green Version]
  38. Hor, Y.S.; Checkelsky, J.G.; Qu, D.; Ong, N.P.; Cava, R.J. Superconductivity and non-metallicity induced by doping the topological insulators Bi2Se3 and Bi2Te3. J. Phys. Chem. Solids 2011, 72, 572–576. [Google Scholar] [CrossRef] [Green Version]
  39. Zhang, J.-M.; Zhu, W.; Zhang, Y.; Xiao, D.; Yao, Y. Tailoring Magnetic Doping in the Topological Insulator Bi2Se3. Phys. Rev. Lett. 2012, 109, 266405. [Google Scholar] [CrossRef] [Green Version]
  40. Jin, K.-H.; Yeom, H.W.; Liu, F. Doping-induced topological phase transition in Bi: The role of quantum electronic stress. Phys. Rev. B 2020, 101, 035111. [Google Scholar] [CrossRef]
  41. Teng, J.; Liu, N.; Li, Y. Mn-doped topological insulators: A review. J. Semicond. 2019, 40, 081507. [Google Scholar] [CrossRef]
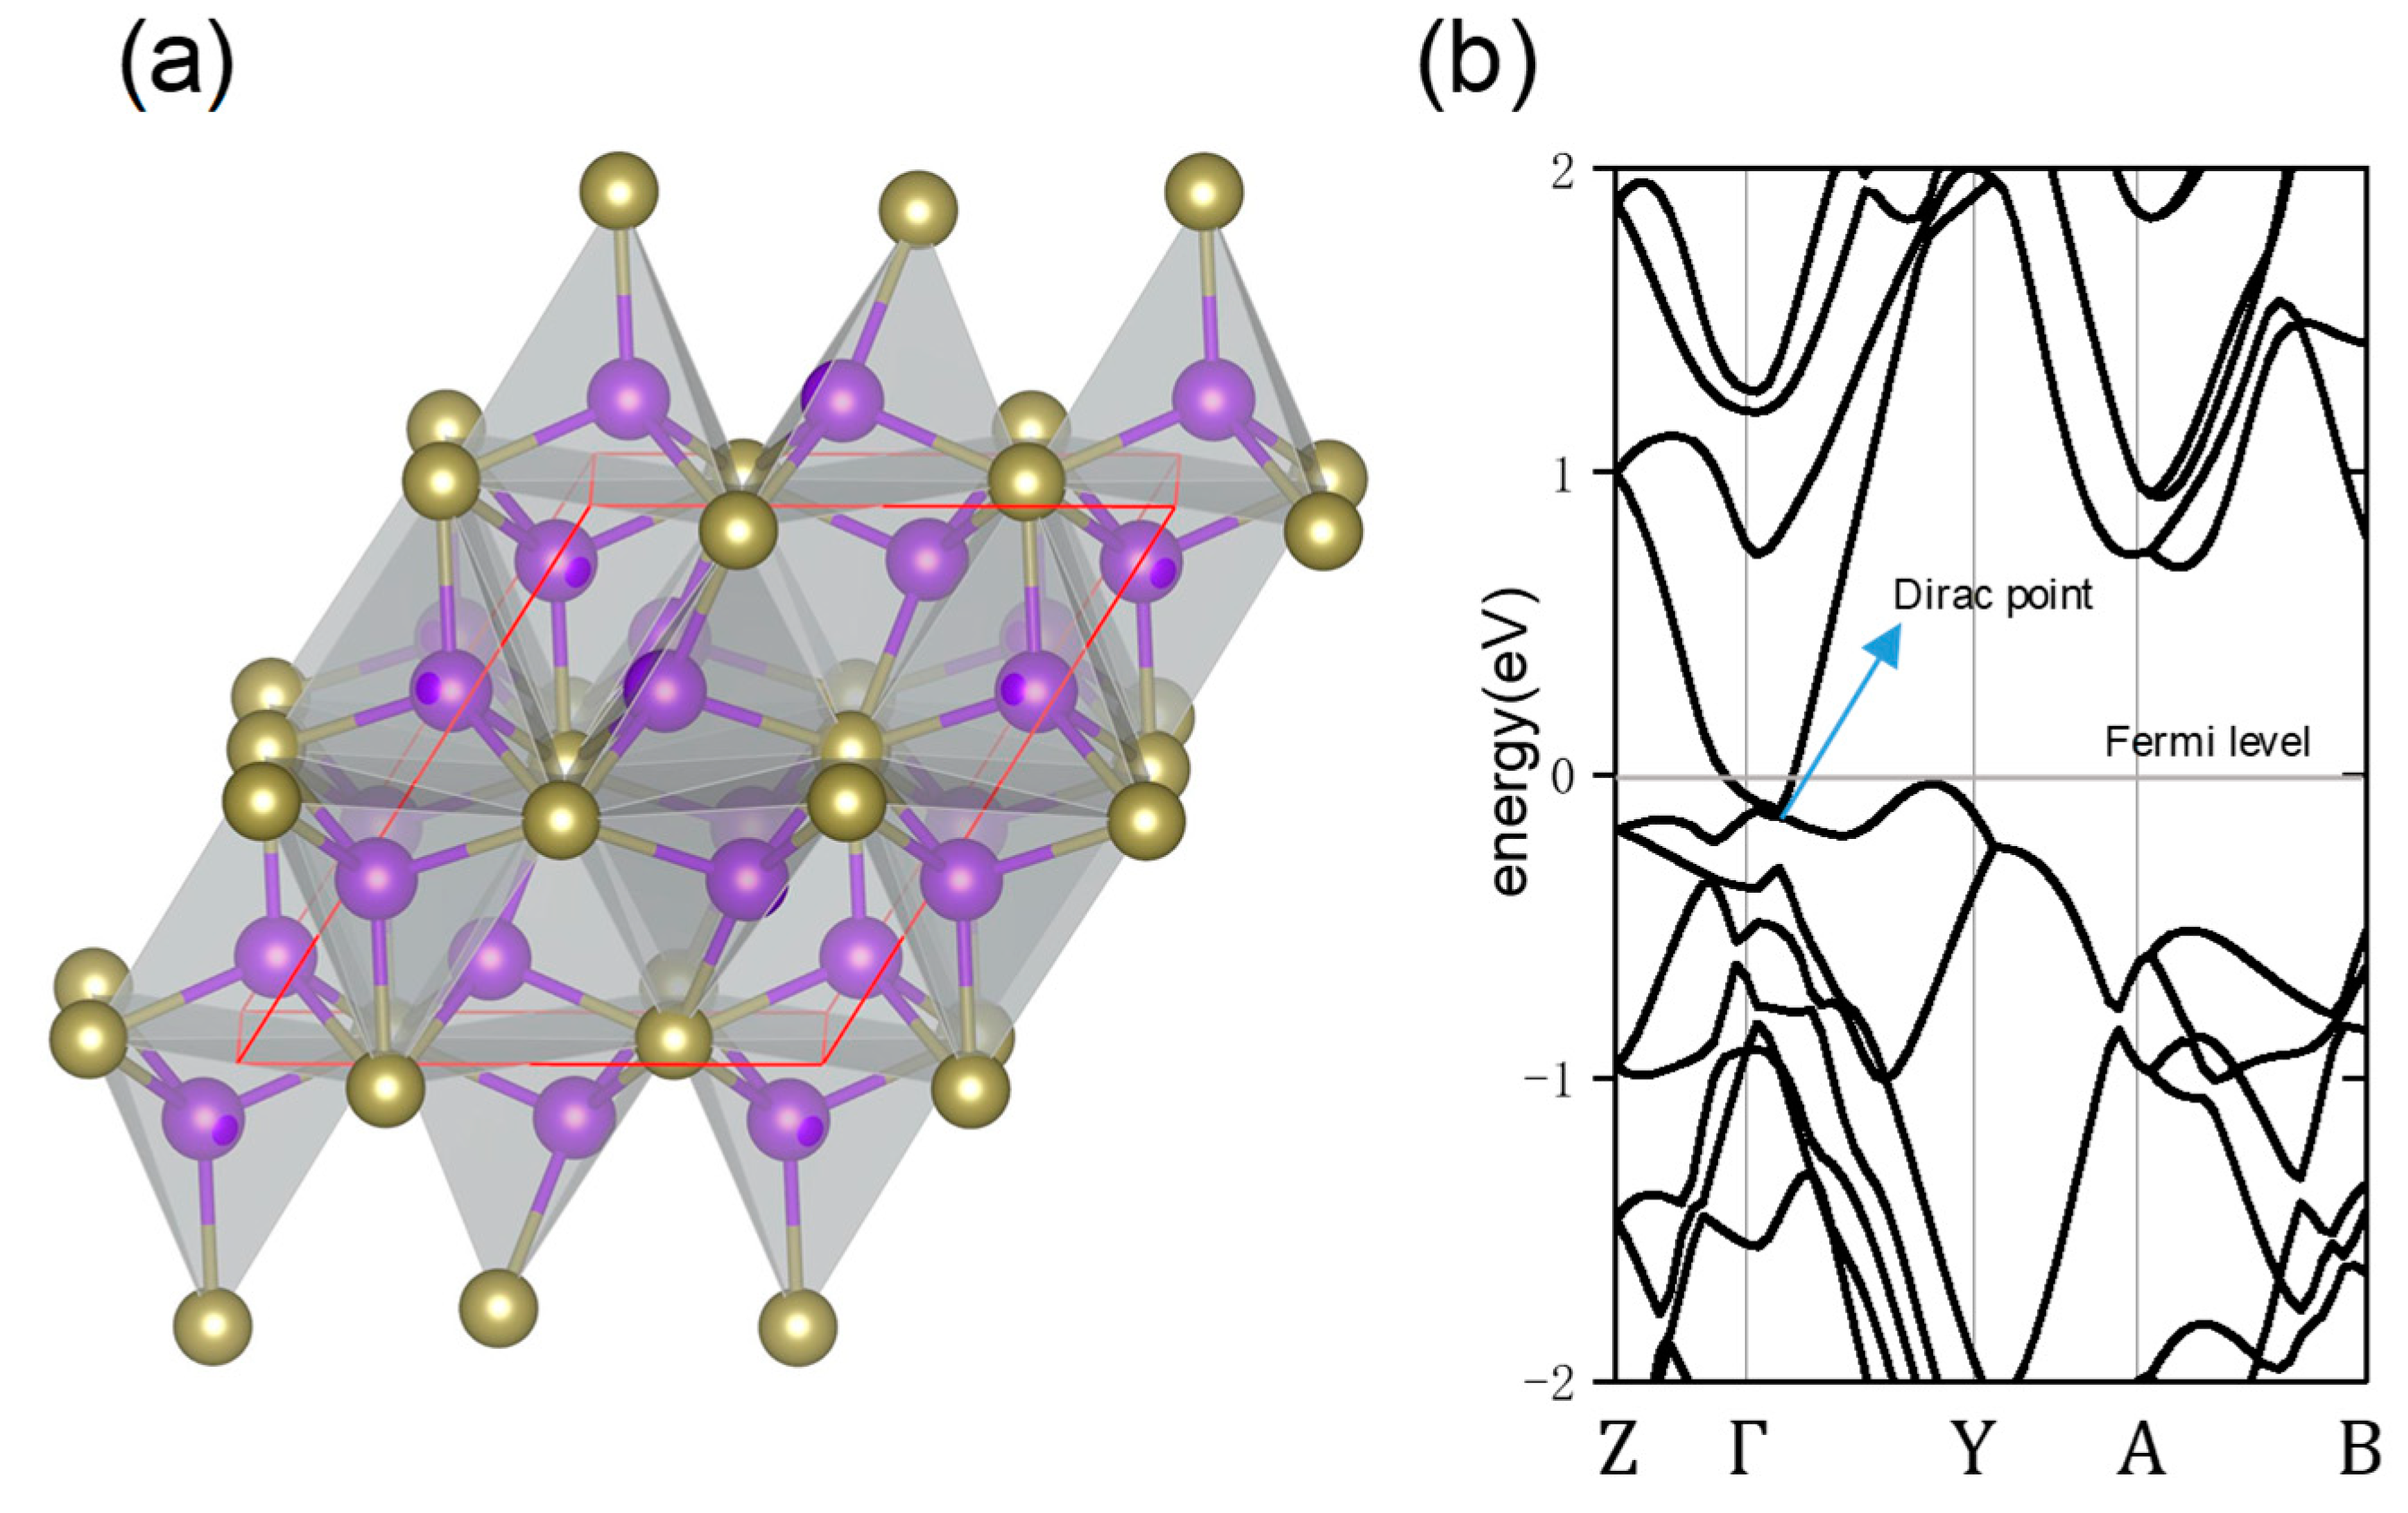
Figure 1. Electronic structure of Ag2Te. (a) Crystal structure of Ag2Te in the monoclinic phase; the yellow balls represent Ag atoms and the purple balls represent Te atoms. (b) Calculated band structure of Ag2Te, the Fermi level and Dirac point is marked in the figure.
Crystals 12 01469 g001
Figure 2. DOS function of Ag2Te. From top to bottom are the DOS contributions from the Te, Ag and Co atomic orbitals, with the total sum DOS at the bottom.
Crystals 12 01469 g002
Figure 3. Reflectivity and SPPs dispersion of Ag2Te. (a) Reflectivity calculated by the dielectric function. (b) The loss function of SPPs. The white dashed curve denotes the SPPs dispersion relationship, and the red dashed line denotes the dispersion of light in free space.
Crystals 12 01469 g003
Figure 4. Electronic structure and optical properties for Ag2Te and Co0.13Ag1.87Te. (a) Band structures of Co0.13Ag1.87Te. (b) Calculated dielectric function of Co0.13Ag1.87Te. The solid line represents the real part of the dielectric function, and the dashed line represents the imaginary part. (c) Reflectivity function for Ag2Te and Co0.13Ag1.87Te.
Crystals 12 01469 g004
Table 1. Lattice constants after different types of doping.
A (nm)B (nm)C (nm) α   ( ° ) β   ( ° ) γ   ( ° )
Original crystal0.8090.4480.89690.00123.3390.00
Type A doping0.8070.4450.95693.76123.0188.29
Type B doping0.8540.4370.81992.52125.8188.59
Type C doping0.8270.4530.93489.77125.7589.59
Type D doping0.8870.4430.95785.94129.0392.90
Publisher’s Note: MDPI stays neutral with regard to jurisdictional claims in published maps and institutional affiliations.