Article

Quasi-In Situ EBSD Study of Anisotropic Mechanical Behavior and Associated Microstructure Evolution in Zircaloy-4

1
International Joint Laboratory for Light Alloys (MOE), College of Materials Science and Engineering, Chongqing University, Chongqing 400044, China
2
Chongqing Key Laboratory for Science and Technology of Light Metals, Chongqing University, Chongqing 400044, China
3
Science and Technology on Reactor Fuel and Materials Laboratory, Nuclear Power Institute of China, Chengdu 610213, China
*
Authors to whom correspondence should be addressed.
Crystals 2022, 12(10), 1489; https://doi.org/10.3390/cryst12101489
Submission received: 23 September 2022 / Revised: 14 October 2022 / Accepted: 18 October 2022 / Published: 20 October 2022
(This article belongs to the Special Issue Advances in Zr-Based Alloys)

Abstract

:
The anisotropic mechanical behavior and associated microstructure evolution in annealed Zircaloy-4 were investigated at room temperature, using quasi-in situ tensile tests along the typical direction, rolling direction (RD), and transverse direction (TD). Herein, the in-grain misorientation axes (IGMA) and the nominal Schmid factors were evaluated to analyze the slip mode based on the electron backscatter diffraction. The IGMA result shows that there were anisotropic slip modes within grains, whose basal poles were parallel with the TD (TB) and placed within 40 to 50 degrees from the normal direction (ND) to the transverse direction (N (40°–50°) TB)), under different loading directions. When loading along the RD, the basal <a> slips were activated in the N (40°–50°) TB and TB orientation grains, while the second-order pyramidal slips were activated in the grains when loading along the TD. The relatively higher ultimate tensile strength and elongation in Zircaloy-4 when tensile along RD occurs due to its much higher frequency of soft grains (88.54%) than the TD sample (64.29%), and the synergy deformation among local grains. The present study demonstrated that the anisotropic mechanical behavior of Zircaloy-4 was attributed to the combined effects that exist between the anisotropic slip behavior and the different compatible deformation capabilities. Many shallow dimples and cleavage regions were observed on the fracture surface in the TD sample. Such fracture features are consistent with the lower ultimate tensile strength ~470 MPa and elongation ~14.5% in the deformed tensile Zircaloy-4 along the TD.

1. Introduction

Zirconium alloys are extensively applied in the nuclear power field, such in fuel cladding materials and position frameworks, due to their combination of good neutron transparency, excellent corrosion resistance, and outstanding mechanical properties. However, the α-Zr alloy exhibits pronounced anisotropic mechanical responses owing to its hexagonal close-packed (hcp) crystal structure with low crystallographic symmetry at room temperature [1]. These behaviors have also been extensively reported in other hcp metals e.g., titanium alloy [2,3] and magnesium alloy [4,5]. The same crystal structures are apparent between Zr (c/a = 1.593), Ti (c/a = 1.58), and Mg (c/a = 1.624); the different axis ratios of c/a result in discrepancies in the predominant slip mode [6].
To date, numerous simulations and experiments have been conducted on the plastic deformation mechanism of zirconium alloy. Whether there are polycrystals or single crystals, the prismatic <a> slip is most readily activated in plastic-deformed zirconium [7,8,9], which is consistent with the ab initio calculations by Clouet [10]. The first-order pyramidal <c + a> slip, {10 1 ¯ ¯ 2} <10 1 ¯ ¯ 1> tensile twinning, and basal slip are also crucial plastic deformation mechanisms [9,11,12,13,14,15]. Twinning always exhibits sensitivity to temperature [16], loading direction [17,18], and strain rate [9] as experimental factors. The inhomogeneous microstructure in zirconium alloy leads to inherently anisotropic mechanical behavior. For example, the yield strength in tensile Zircaloy-4 plates along the radial direction is higher than the transverse direction, in both the cold-worked stress-relieved or the various Nb-modified Zircaloy-4 alloys [19]. A similar research result has also been shown in a the zircaloy-2 cladding tube [20]. The heat treatment regime does not decrease the degree of anisotropy in zirconium alloys [21]. The effect of irradiation on the plastic anisotropy of zircaloy cladding tubes shows, through experiments and simulations, that the anisotropy of zircaloy is decreased after irradiation, because the prismatic <a> slip is more strongly suppressed, while the pyramidal slip mode becomes the dominate slip mode along with the prismatic <a> slip [22]. The studying of anisotropic mechanical responses based on the dislocation evolution in zirconium alloys has been reported [1,8,23]. However, research on the anisotropic mechanical behavior of hcp-Zr under external loading from the grain orientation viewpoint is lacking, especially related to the discrepancy of slip behaviors at the grain scale that through the quasi-in situ electron backscattered diffraction (EBSD) method.
Transmission electron microscopy techniques [1,7,8,24,25] and slip trace analysis [26,27,28] have been used to reveal the activation of slip and/or twinning modes, in both Zr and in other hcp metals. Despite this, both methods show obvious limitations in applied circumstances. The former requires substantial time to determine the slip mode of a large number of grains. In addition, this method has only been applied to materials with a small strain and it barely distinguishes the glide plane of severely deformed materials [7,8]. The latter is only suitable for coarse-grained metal materials exposed to a limited strain. In order to fulfill the reliable and efficient statistical requirements of slip modes in small-grain polycrystal samples, the in-grain misorientation axes (IGMA) method based on the orientation of individual grains was introduced in this study. The validity of the IGMA method for the determination of slip modes in hcp metals, such as Zr [29], Ti [30], and Mg [31], has been demonstrated in prior research.
Much less is known to date about the effects of grain orientation on anisotropic mechanical behavior, such as slip modes. In this paper, the combination of a quasi-in situ EBSD technique and the IGMA method was used to reveal the activity of slip modes in grains and the corresponding microstructure evolution, while the mechanical response and fracture behavior were also investigated.

2. Materials and Methods

Full recrystallized Zircaloy-4 was selected for investigation in this study. It contained 1.5, 0.2, 0.1, and 0.13 wt.% of Sn, Fe, Cr, and O, respectively, the remainder being Zr. The dimensions and structure of the dog-bone shape are shown in Figure 1, where RD, TD, and ND represent the rolling direction, transverse direction, and normal direction, respectively. The tensile samples were prepared by electrical discharge machining along the RD and TD. An electro-mechanical universal testing machine was used to conduct the tensile tests with a constant strain rate of 0.5 × 10⁻³/s at room temperature, and the quasi-in situ tests were interrupted at the presetting strain. The plastic strain ratio, ε, is the actual calculated strain value.
During tensile testing, the microstructure evolution was recorded by a NOVA400 field emission scanning electron microscope (SEM) coupled with EBSD and an electron channeling contrast (ECC) probe. The acceleration voltage and scanning step size were 20 KV and 0.5 μm, respectively. EBSD data were processed using professional software (Channel 5, HKL Technology-Oxford Instruments). At −30 °C, electropolishing of Zircaloy-4 samples was performed in a solution of 10% perchloric acid, 20% 2-butoxyethanol, and 70% methanol for 15~18 s after mechanically polishing to meet the surface quality requirements for the microstructure characterization.
The IGMA method was used to study the anisotropic mechanical behavior of Zircaloy-4. The active slip modes can be determined by matching the Taylor axis for the given slip mode and the IGMA experimental results. The activation of the slip mode induced a crystal lattice rotation that could be detected by EBSD. The Taylor axis corresponds to the common slip modes of α-Zr, as shown in Table 1. In order to meet the IGMA analysis requirements, the misorientation axes were only plotted with θ between 1.0 and 2.0 deg. Other detailed information on the IGMA method has been reported by Chun [30]. Meanwhile, the nominal Schmid factor (SFN) was evaluated to verify the universality of IGMA in the deformed Zircaloy-4 alloy at room temperature.

3. Results and Discussion

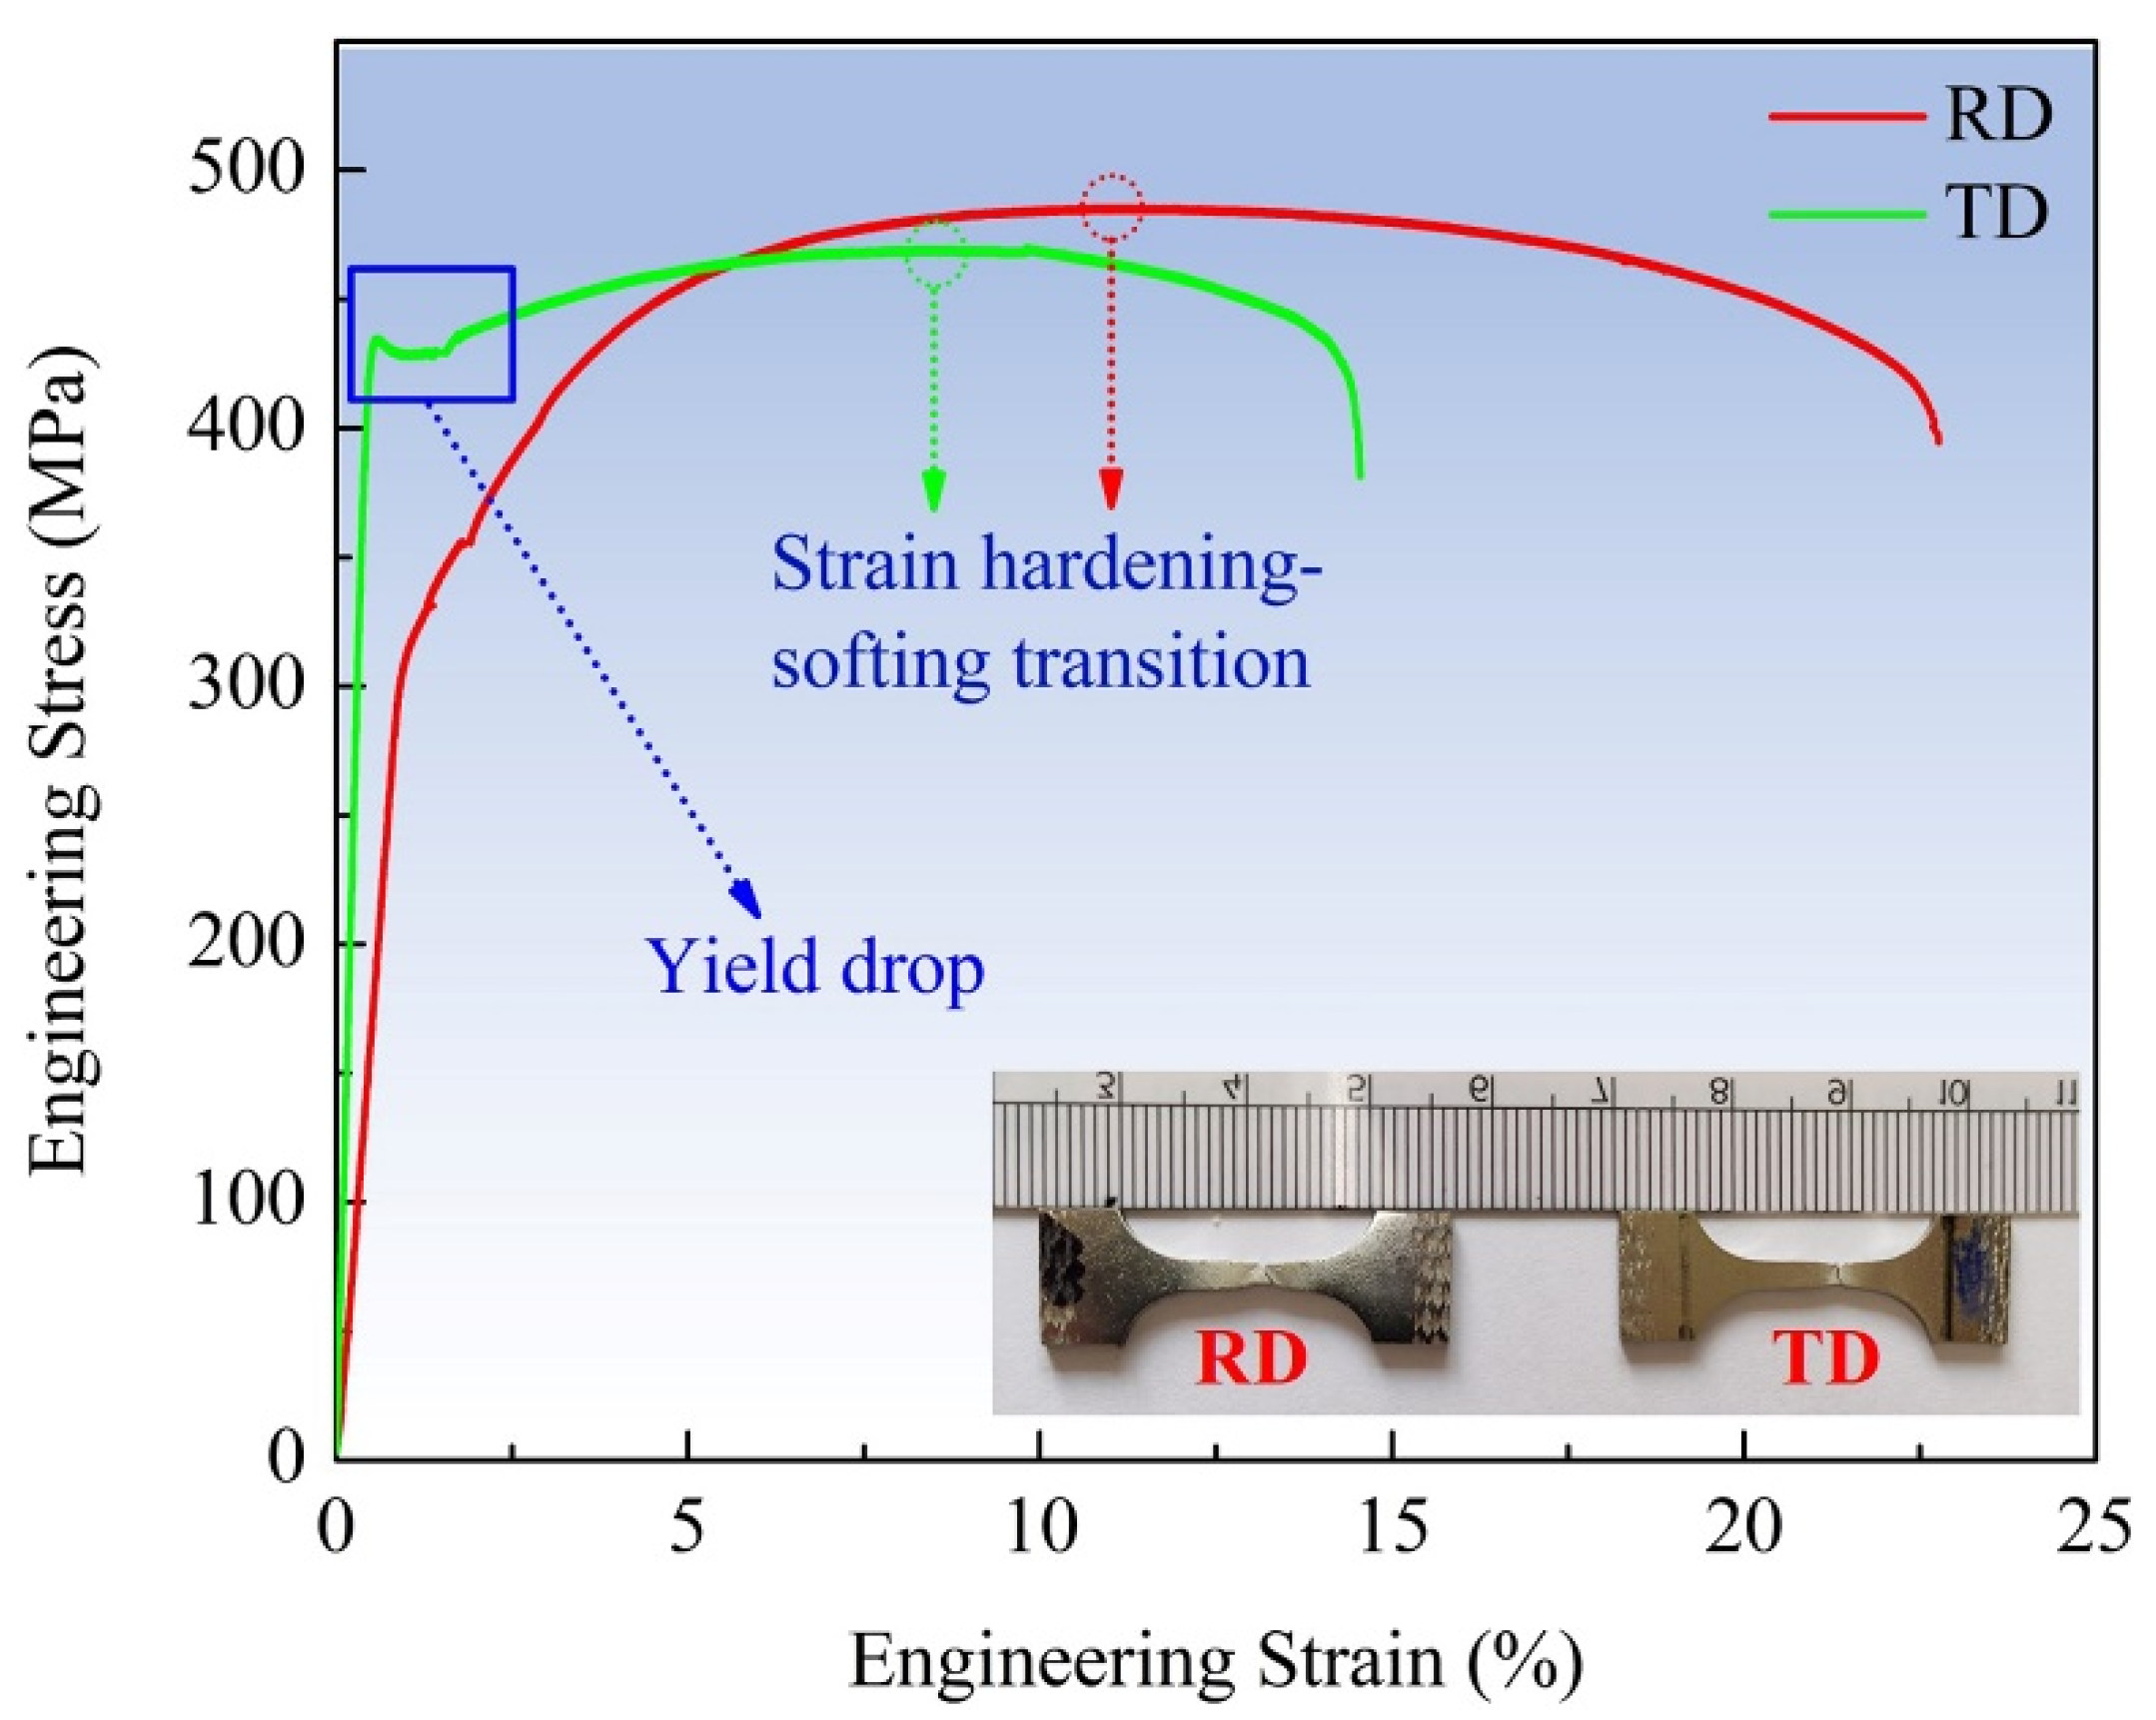
3.1. Mechanical and Fracture Behavior Response to the Loading Direction

The obtained engineering stress-strain curves of Zircaloy-4 along the RD and TD are shown in Figure 2. The TD sample exhibited a higher yield strength (YS~433 MPa) compared with the RD sample (~322 MPa). This yielding anisotropy has also been reported in previous studies of Zr, Mg, etc. [1,32], which has been ascribed to the deficiency of mobile dislocations [33]. The ultimate tensile strength (UTS~486 MPa) and uniform elongation (UE~22.8%) of the RD sample are notably higher than the TD sample (UTS~470 MPa, UE~14.5%). Discrepancies among the YS, UTS, and UE of Zircaloy-4 indicate that the anisotropic mechanical properties change along the loading direction. Additionally, a remarkable yield drop occurs in Zircaloy-4 along the TD compared with the RD sample. Shi et al. reported a gradual disappearance and re-appearance of yield drop upon introducing different pre-strain histories in zirconium alloy. This phenomenon is commonly associated with dislocation mobility and dislocation density. A lack of dislocation density causes the increase in flow stress to trigger the movement of dislocation. Shi et al. attributed such features to the lack of glissile dislocations at the initial plastic deformation stage [34], which is consistent with the mechanism proposed by Johnstok et al. [34].
Figure 3 presents the microscopic fractography of Zircaloy-4 after tensile fractures along different loading directions at 1000× and 4000× magnification. Both specimens show many dimples and tearing edges (Figure 3a–h). A relatively higher number of cleavage surfaces were observed in the TD sample, as the yellow lines denote in Figure 3c,g. Such features in the fracture morphology in the outer side position are more significant (Figure 3d,h). The hardening ability and deformation mechanisms of metals are more strongly associated with ductile fracture behaviors [2]. Shi et al. indicate that zirconium alloys exhibit promoted strain hardening capability when tensile along the RD than the TD from the dislocation viewpoint [1]. Compared with the RD tensile sample (Figure 3a,b,e,f), the TD sample was conducive to void nucleation, growth, and coalescence due to its weak hardening ability. Therefore, many relatively shallow dimples were observed on the fractured surface, as shown in Figure 3c,d,g,h. The macroscopic fracture morphology showed a cup-cone fracture surface, as the inserted figures in Figure 3a–d show. Necking at the fracture position was more remarkable in the RD sample than the TD sample, which indicates that the RD sample undergoes severe plastic deformation. Both the microstructure and macroscopic morphologies observed in the TD sample were associated with features in a lower ductility sample, which is consistent with the UE result in Zircaloy-4 under different loading directions.

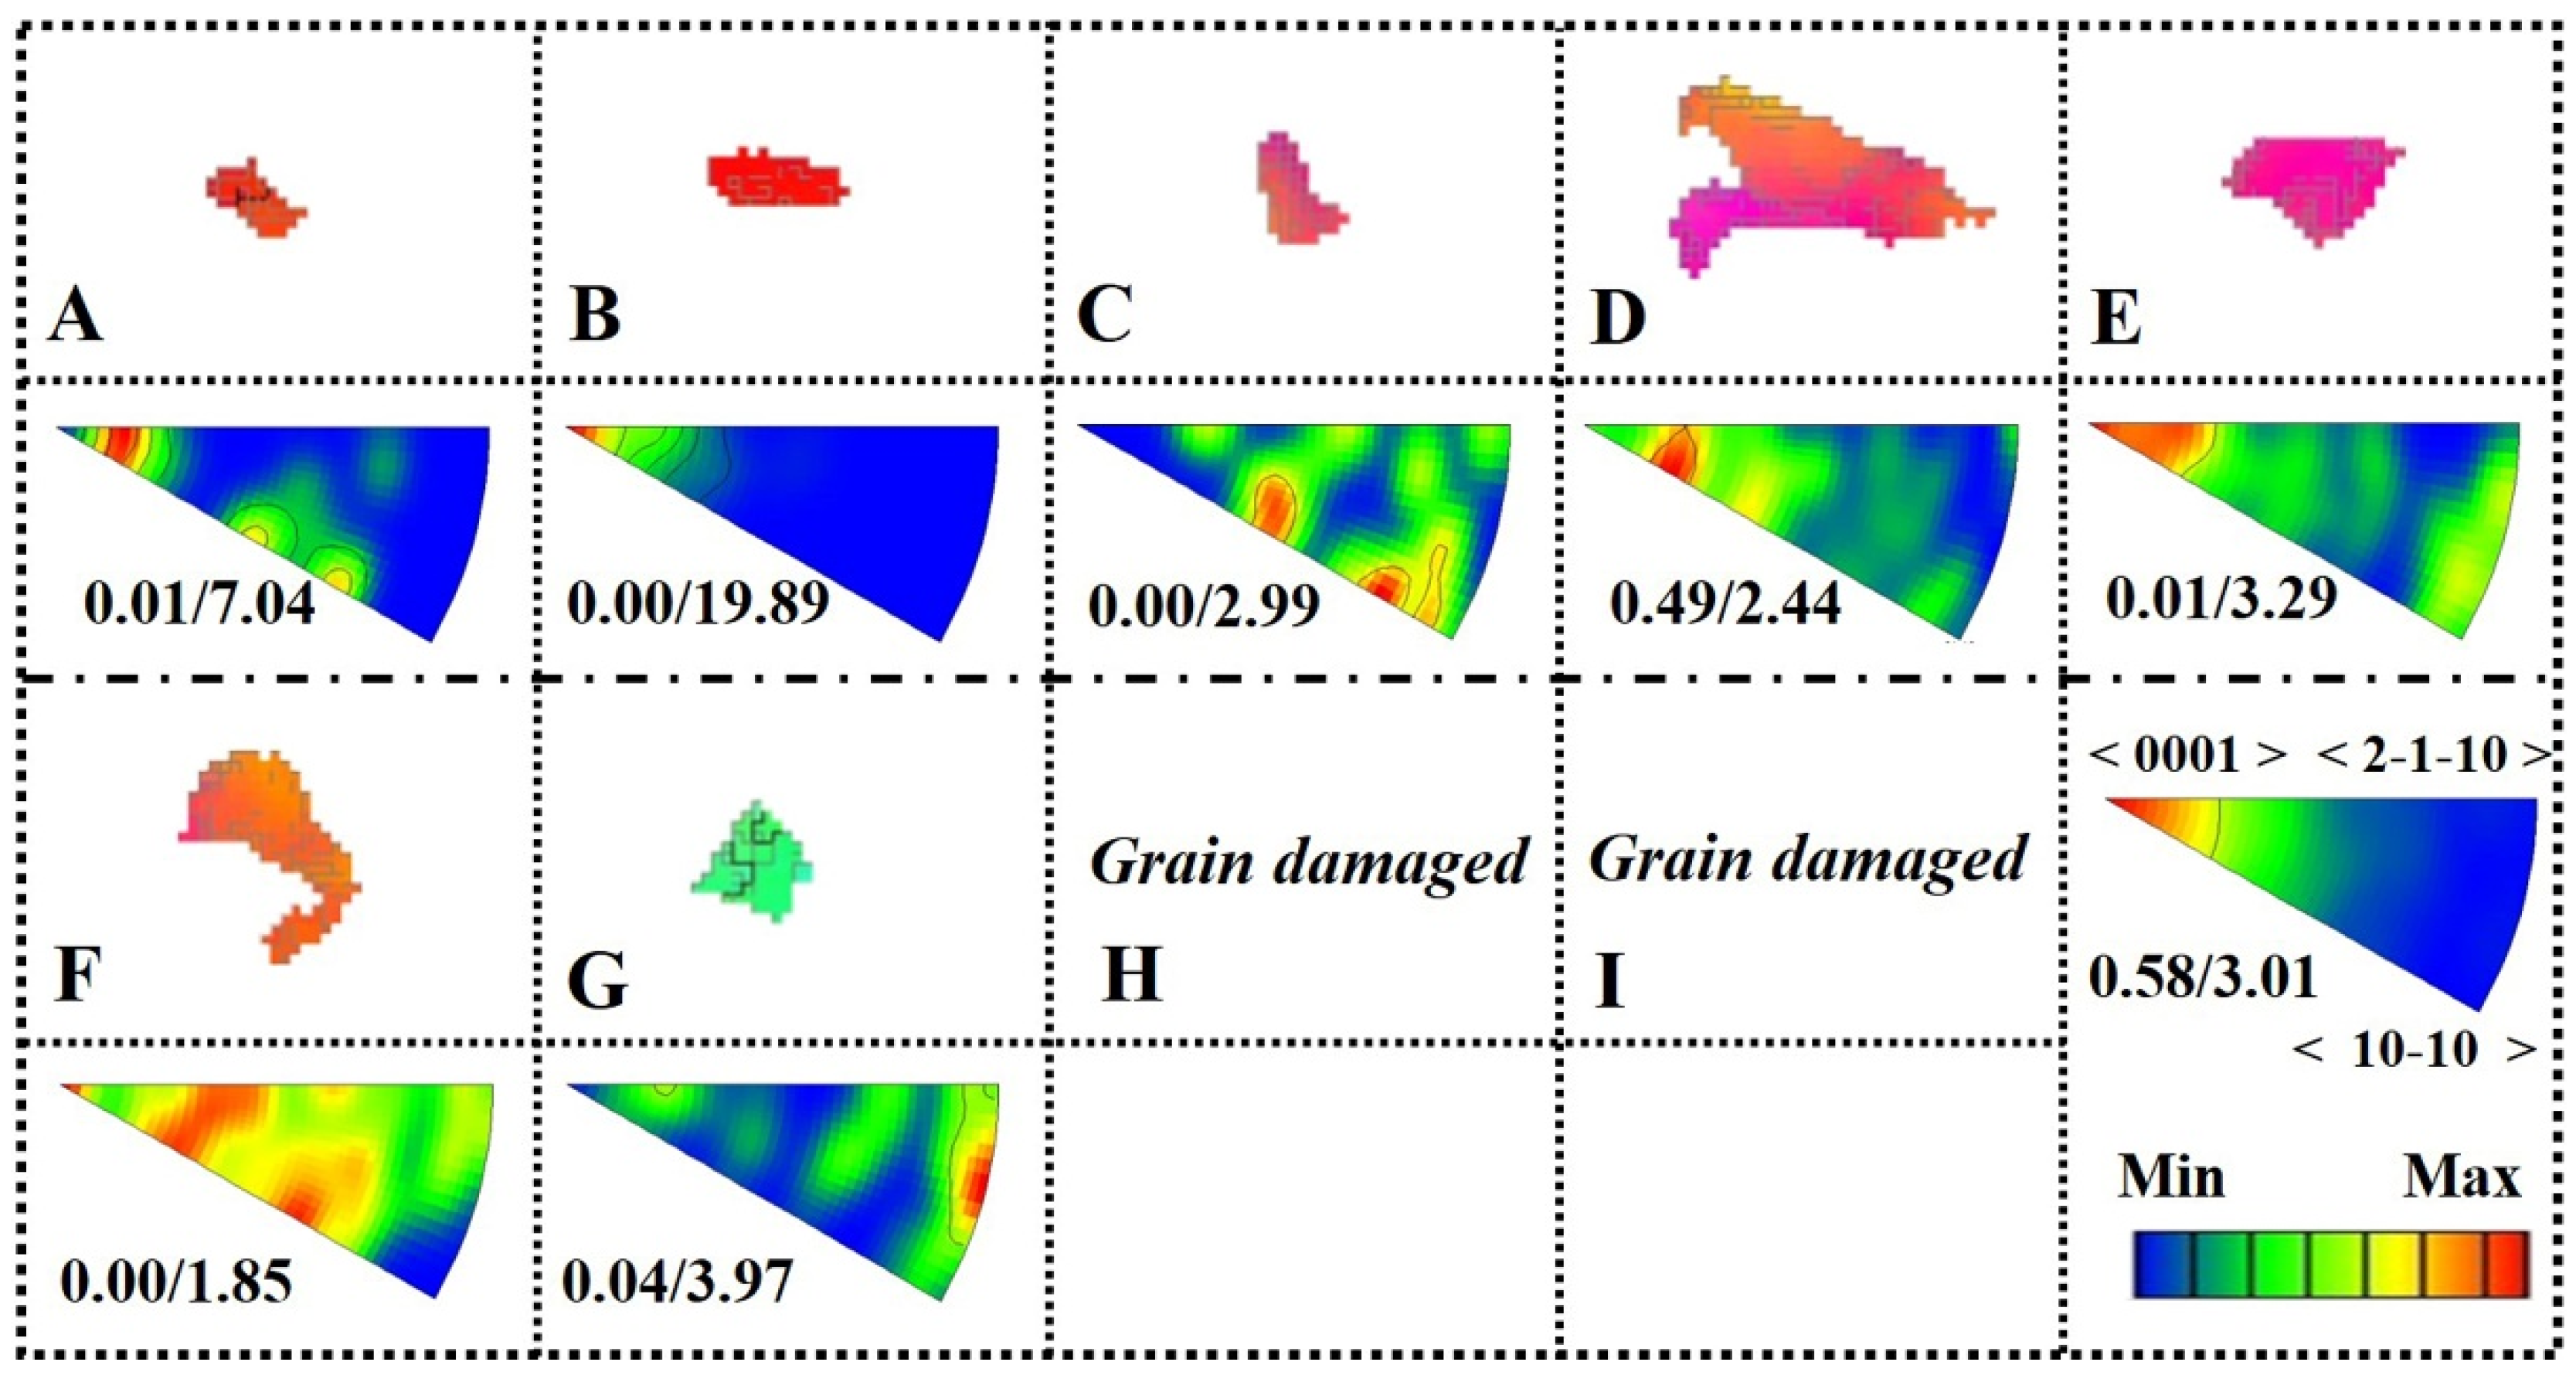
3.2. Microstructure Evolution during Deformation

To study the anisotropic mechanical behavior, the evolution of the microstructure during the RD/TD tensile test was observed. The inverse pole figure (IPF) and the associated grain boundary (GB) distribution map in the RD sample at 0.00% and 6.64% tensile strain are shown in Figure 4. High-angle grain boundaries (HAGBs, >10°) and low-angle grain boundaries (LAGBs, 2~10°) are denoted as the black and red lines, respectively. The initial undeformed microstructure consisted of equiaxed grain with a 4.78 μm average size, and the HAGBs were the predominate grain boundary, as depicted in Figure 4a,d. As the strain increased to 6.64%, the color distribution among grains exhibited evident evolution compared with the undeformed sample, which suggests that significant plastic strain occurs inside these grains, as Figure 4b shows. Combined with the LAGB distribution in Figure 4c, it can be seen that all of the grains suffered plastic deformation to some extent. Meanwhile, the proportions of HAGBs and LAGBs were 36.3% and 63.7%, respectively. It can also be observed that plastic deformation was in homogeneously distributed among grains, both in the IPF and GB distribution maps, which is attributed to the discrepancies in activated slip modes among grains with different crystal orientations under loading conditions, such as the activated likelihood of the identical slip mode or the transmission of slip mode between grains [28]. With an increase in the tensile strain, both LABGs formation and transformation to HAGBs were observed, as the white arrow denotes in Figure 4b. At the initial stage of plastic deformation, the local rearrangement of the high-density dislocations promoted the LAGBs to form and release energy. The GB misorientation increases further, which facilitated the transformation of LAGBs to HAGBs with progressive strain increases [1,35]. More importantly, an evident lattice rotation among grains with an increase in strain can be observed, as the yellow ellipse region denotes in Figure 4a,b.
The IPF and GB distribution map at 0.00% and 6.20% strain during the tensile process in Zircaloy-4 along TD are shown in Figure 5. The main features, i.e., the average size (4.69 μm) and LAGBs ratio (2.5%), of the as-received materials are in accordance with the observed information in Figure 4a,c. As the strain reached 6.20%, Figure 5b shows that most grains suffered severe plastic deformation, and their morphology was elongated significantly along the loading direction compared with the RD sample (Figure 4b). Additionally, the transformation from LAGBs to HAGBs was also observed in partial grains, as the white arrows denote in Figure 5b, which suggests that significant heterogeneous deformation exists within grains. At the same observed region, the density of LAGBs in the TD tensile sample was larger than in the RD sample, which indicates that the hindering effect of dislocation motion in the RD sample was less than in the TD sample. The feature where LAGBs were concentrated along GBs verified this inference further. The stronger hindering effect for dislocation motion in the TD sample may be the key factor that results in its higher yield strength than the RD sample. In order to evaluate the strain distribution during the tensile process under different loading directions, the local strain data quantified by kernel average misorientation (KAM) that based on the third nearest neighborhood in Zircaloy-4 with various strains under different loading directions are plotted in Figure 6. A higher KAM value corresponds to a higher local stress concentration or greater degree of plastic deformation [36,37]. It can be found that local strain concentration was positively proportional to the tensile strain, regardless of loading direction, and the local strain in the undeformed sample maintained a lower value. More importantly, the local grain misorientation in the TD sample was much larger than the RD sample, i.e., 1.76 at 6.64% strain for the RD sample versus 2.04 at 6.20% strain for the TD sample. Therefore, these observations, combined with the microstructure evolution, suggest that Zircaloy-4 possesses better synergistic deformation effects, namely good uniform plasticity, when tensile along the RD compared to the TD.

3.3. Slip Behaviors during Tensile along RD/TD

In order to further reveal the anisotropic mechanical and fracture behavior responses to the loading direction, slip modes of individual grains were statistically analyzed based on the IGMA and SFN methods. The lattice rotation caused by plastic deformation within the grain can be detected by EBSD, as introduced by Luan et al. [29] and Chun et al. [30]. The rotation axes that correspond to different slip modes in Zircaloy-4 alloy are listed in Table 1. Figure 7 shows the IGMA distribution that corresponds to the nine selected grains, as denoted A–I in Figure 4a. The IGMA distribution that corresponds to the overall region (Figure 4c) presents high concentrations of IGMA at <0001>, namely activated prismatic <a> slip systems [29,30]. The selected grain in the present study was divided into three groups based on its crystallographic orientation in terms of the position of the basal pole [30], with the basal pole parallel with the TD and ND denoted as TB (A–C) and NB orientation grains (D–F), respectively. “N (40°–50°) TB” means the basal poles of a grain located 40° to 50° from the ND to the TD. It can be observed that the activated prismatic <a> slip exists in three groups of grains without discrepancies, while the basal <a> slip only exists in the NB and TB orientation grains for the IGMA distribution around <10 1 ¯ ¯ 0> axis with higher intensity.
Table 2 shows the calculated SFN value for the nine selected grains, and the bold font represents the maximum value of the slip mode which is the most readily activated, indicating that prismatic <a> slip is the predominant activated slip system. However, the basal <a> slip may also be activated, regardless of whether it is in the IGMA evaluation or the prediction from the calculated SFN. The difference between IGMA and SFN may be ascribed to the lack of neighboring grain influences, because the SFN is only calculated based on the Euler angle inside the grain at the fixed loading direction.
The IGMA distribution for the selected grains in the TD sample is presented in Figure 8, and the corresponding SFN calculation results are listed in Table 3. The selected typical grains in the TD sample obey the identical definition as the RD sample. The only remaining three grains belong to the TB orientation and are marked as G through I in Figure 5a. Unfortunately, the H and I grains cannot be indexed by EBSD for further IGMA analysis, because of the severe plastic deformation within grains. Both characteristic IGMA distributions of overall grains in the deformed RD and TD samples exhibit stronger intensity at the <0001> axis (Figure 7 and Figure 8), which means the activation of prismatic <a> slip, because <0001> is a unique Taylor axis for the prismatic <a> slip mode [29,30,31]. The IGMA distributions of the selected individual grains between the TD and RD samples exhibit significant discrepancies. Firstly, the ratio of activated prismatic <a> slip in the TD sample is lower than in the RD sample, regardless of the grain’s crystallographic orientation, both the IGMA and SFN result supports this viewpoint. Secondly, only partially N (40°–50°) TB orientation grains (F grain in Figure 7 and Figure 8) can exhibit relatively uniform IGMA distribution with a maximum intensity of less than 2.0. A possible explanation for this is the coactivation of various slip modes around different Taylor axis within the deformed grains. Thirdly, the grains that belong to N (40°–50°) TB and TB orientations showed relatively higher intensities of IGMA around the <uvt0>, while the same type of grains in the RD sample showed IGMA distributions around <0001> with a higher intensity. The former distribution pattern was ascribed to coactivation of several slip variants of {11 2 ¯ ¯ 2} < 1 ¯ ¯ 1 ¯ ¯ 23> mode, as proposed by Chun et al., because the {11 2 ¯ 2} plane is more favored than the {10 1 ¯ 1} plane in hcp metals [30]. The latter distribution pattern led to the activation of basal <a> slip. As for the TB orientation grains (G–I), the SFN calculated result for the prismatic <a> slip in the RD sample is remarkably larger than the TD sample. More importantly, the calculated maximum SFN value for the G–I grain in the TD sample was less than 0.1, which means that it was almost impossible to activate the listed slip modes in Table 3.
Based on the combined analyses of IGMA distributions and SFN calculations in the tensile deformed Zircaloy-4 along the RD and TD, it may be reasonably concluded that a significant discrepancy exists in the N (40°–50°) TB and TB orientation grains. This is because the former tended to induce the basal <a> slip, while the latter tended to induce the coactivation of several slip variants of the second-order pyramidal slip.
By careful inspection of the IPF colored maps of RD and TD samples, evidence of coordination deformation can be observed, as the yellow ellipses show in Figure 4a. The color distribution of grains gradually became the same, which means that synergistic deformation effects exist in tensile Zircaloy-4 along the RD, while similar features did not exist in the tensile sample along the TD. Figure 9 shows the enlarged map of the region of interest region in Figure 4a and the corresponding misorientation angles distribution. It can be seen from the misorientation angles distribution in red and blue lines (Figure 9d–f) that the misorientation angles between 1#, 2#, and 3# grains (red dotted line) increased with an increase in strain. The misorientation angles between 1# and 2# increased slightly, while this value between 2# and 3# experienced a significant drop from 21.77° to 6.81°, indicating the disappearance of HAGB (>10°). However, similar features were not exhibited in the blue dotted line that consisted of 1#, 4#, and 5# grains, indicative of discrepancies compatible with deformation capability among grains. The strain could also be further accommodated by grain rotation, in addition to the activated slip modes [38]. Furthermore, we can infer that there were significant discrepancies in synergistic plastic deformation behavior in Zircaloy-4 alloys under different loading directions. Such anisotropic behavior has also been mentioned in other hcp metals [2,6].
To ensure statistical significance in the slip modes analyzed, SF distributions of various slip modes in the RD and TD samples are shown in Figure 10. Both show that the prismatic <a> slip is the preferable deformation mechanism. Further evidence can be found in Figure 11, which displays the cumulative distribution results of SFN with different slip modes at 6.64% strain in the RD sample and 6.20% strain in the TD sample. It is readily observed that both samples possess higher fractions of SFN for the prismatic <a> slip with higher SFN values (>0.4). This means prismatic <a> slip is the predominant activated slip mode [12,29,37]. Relative frequencies (RD~88.54% and TD~64.29%) and values of SFN for the prismatic <a> slip are remarkably higher in the RD sample than the TD (Figure 11), implying that most grains are favorably oriented for activating the prismatic slip, and then contribute to the plastic deformation. In addition to the prismatic <a> slip, the basal <a> slip possesses higher SFN and lower critical resolved shear stress (CRSS) than the pyramidal <a> slip in the RD sample [1]. This further verified the possibility of the activated basal <a> slip evaluated through IGMA. As for the TD sample, it is reasonable to conclude that the plastic slip is partially restricted for its weak compatible deformation capability and higher frequency of pyramidal <a> slip tendency.
The activation of the slip mode in an individual grain is determined by the IGMA method, which, combined with SFN calculation results, suggests there is the applicability of the IGMA method for slip behavior analysis in deformed Zircaloy-4 at the grain scale. This plays a significant guiding role in the analysis of the micromechanical behavior of local deformed circumstances in Zircaloy-4. These methods are applicable to investigate the plastic deformation at local areas, especially for the circumstances of hydrogen embrittlement, delayed hydrogen cracking, and oxidation corrosion, etc. [39]. In the present study, the quasi-in situ EBSD combined with mechanical tensile tests had limitations to some extent. For example, it was difficult to track the same characterized region when the Zircaloy-4 sample suffered severely from plastic deformation. Furthermore, a certain degree of manual error exists when being re-mounted to the specimen mount. Hence, more advanced and precise characterization methods, such as in situ EBSD, may be applied to obtain the observed microstructure evolution in real-time, and provide detailed experimental results revealing the potential plastic deformation mechanisms of this metal and its alloys.

4. Conclusions

In this study, the anisotropic mechanical behavior and the associated microstructure evolution in Zircaloy-4 along RD/TD tensile conditions were investigated via a quasi-in situ EBSD method. The following conclusions were drawn based on the experimental results and discussions.
(1)
Many shallow dimples and cleavage regions on the fracture surface and a cup-cone fracture morphology were observed. Such features are consistent with the lower ultimate tensile strength ~470 MPa and elongation ~14.5% in deformed tensile Zircaloy-4 along the TD;
(2)
Prismatic <a> slip is the predominant slip mode in Zircaloy-4 under tensile test, regardless of the loading direction;
(3)
The anisotropic slip behavior in individual grains of deformed Zircaloy-4 is attributed to the N (40°–50°) TB and TB orientation grains. The RD sample tends to induce basal <a> slip, while the TD sample tends to induce the coactivation of several slip variants of second-order pyramidal slip modes. Meanwhile, the coactivation of various slip modes only exists within grains belonging to the N (40°–50°) TB orientation;
(4)
The RD sample exhibits excellent compatible deformation capability, not only due to its much higher frequency (88.54%) of soft grains than the TD sample (64.29%), but also due to the synergy deformation among local grains.

Author Contributions

H.S.: methodology, investigation, formal analysis, data curation, visualization, writing—original draft, writing—review and editing. Y.Z.: investigation, data curation, writing—review and editing. C.S.: project administration, resources, validation, writing—review and editing. B.L. (Bingcheng Li): software, investigation, writing—review and editing. X.Z.: software, investigation. Y.S.: investigation. B.L. (Baifeng Luan): funding acquisition, project administration, resources, supervision, validation, writing—review and editing. All authors have read and agreed to the published version of the manuscript.

Funding

This research was funded by the National Natural Science Foundation of China (Grant No. U1867202 and U20A20232) and the graduate research and innovation foundation of Chongqing, China (Grant No. CYB21003); Author Baifeng Luan thanks the support of Fundamental Research Funds for the Central Universities (grant 2020CDJDPT001), and the “111” Project (B16007) by the Ministry of Education and the State Administration of Foreign Experts Affairs of China.

Data Availability Statement

The raw/processed data required to reproduce these findings cannot be shared at this time as the data also form part of an ongoing study.

Acknowledgments

Author Huanzheng Sun is thankful for the fruitful discussions with Quan Dong.

Conflicts of Interest

The authors declare no conflict of interest.

References

  1. Shi, H.; Zong, N.; Le, J.; Li, S.; Huang, G.; Li, J.; Mao, J.; Lu, W. Strain hardening versus softening: Anisotropic response of strain hardening-softening transition in a polycrystalline zirconium alloy at room temperature from dislocation viewpoint. Mater. Sci. Eng. A 2022, 847, 143344. [Google Scholar] [CrossRef]
  2. Yang, H.; Li, H.; Sun, H.; Zhang, Y.; Liu, X.; Zhan, M.; Liu, Y.; Fu, M. Anisotropic plasticity and fracture of alpha titanium sheets from cryogenic to warm temperatures. Int. J. Plast. 2022, 156, 103348. [Google Scholar] [CrossRef]
  3. Tang, B.; Wang, Q.; Guo, N.; Li, X.; Wang, Q.; Ghiotti, A.; Bruschi, S.; Luo, Z. Modeling anisotropic ductile fracture behavior of Ti-6Al-4V titanium alloy for sheet forming applications at room temperature. Int. J. Solids Struct. 2020, 207, 178–195. [Google Scholar] [CrossRef]
  4. Pan, S.; Huang, X.; Xin, Y.; Huang, G.; Li, Q.; Tan, C.; Liu, Q. The effect of hot rolling regime on texture and mechanical properties of an as-cast Mg–2Zn–2Gd plate. Mater. Sci. Eng. A 2018, 731, 288–295. [Google Scholar] [CrossRef]
  5. Yi, S.-B.; Davies, C.; Brokmeier, H.-G.; Bolmaro, R.; Kainer, K.; Homeyer, J. Deformation and texture evolution in AZ31 magnesium alloy during uniaxial loading. Acta Mater. 2006, 54, 549–562. [Google Scholar] [CrossRef]
  6. Lin, X. Plastic deformation of Hexagonal close-packed metals. Rare Metal. Mat. Eng. 1995, 24, 21–29. [Google Scholar]
  7. Akhtar, A. Schmid’s law and prismatic slip of zirconium. Scr. Mater 1975, 9, 859–861. [Google Scholar] [CrossRef]
  8. Akhtar, A. Prismatic slip in zirconium single crystals at elevated temperature. Met. Mater. Trans. A 1975, 6A, 1217–1222. [Google Scholar] [CrossRef]
  9. Knezevic, M.; Zecevic, M.; Beyerlein, I.J.; Bingert, J.F.; McCabe, R.J. Strain rate and temperature effects on the selection of primary and secondary slip and twinning systems in HCP Zr. Acta Mater. 2015, 88, 55–73. [Google Scholar] [CrossRef] [Green Version]
  10. Clouet, E. Screw dislocation in zirconium: An ab initio study. Phys. Rev. B 2012, 86, 144104. [Google Scholar] [CrossRef] [Green Version]
  11. Zhang, M.; Luan, B.; Li, S.; Cao, H.; Chu, L.; Gao, B.; Wang, L.; Yuan, G.; Liu, Q. Characterization of shock-induced anomalous {11–21} twinning activity in a β-cooled zirconium. Mater. Charact. 2020, 168, 110541. [Google Scholar] [CrossRef]
  12. Lu, Z.; Noordhoek, M.J.; Chernatynskiy, A.; Sinnott, S.B.; Phillpot, S.R. Deformation processes in polycrystalline Zr by molecular dynamics simulations. J. Nucl. Mater. 2015, 462, 147–159. [Google Scholar] [CrossRef] [Green Version]
  13. Yang, H.; Kano, S.; Chai, L.; Shen, J.; Zhao, Z.; McGrady, J.; Duan, Z.; Abe, H. Interaction between slip and {10–12} tensile twinning in Zr alloy: Quasi in situ electron backscatter diffraction study under uniaxial tensile test. J. Alloys Compd. 2019, 782, 659–666. [Google Scholar] [CrossRef]
  14. Xu, F.; Holt, R.; Daymond, M. Evidence for basal <a>-slip in Zircaloy-2 at room temperature from polycrystalline modeling. J. Nucl. Mater. 2008, 373, 217–225. [Google Scholar] [CrossRef]
  15. Maras, É.; Clouet, E. Secondary slip of screw dislocations in zirconium. Acta Mater. 2022, 223, 117398. [Google Scholar] [CrossRef]
  16. Luan, B.-F.; Ye, Q.; Chen, J.-W.; Yu, H.-B.; Zhou, D.-L.; Xin, Y.-C. Deformation twinning and textural evolution of pure zirconium during rolling at low temperature. Trans. Nonferrous Met. Soc. China 2012, 23, 2890–2895. [Google Scholar] [CrossRef]
  17. Chen, X.; Zeng, Q.; He, W.; Liu, Q. Pre-deformation enhanced {10–12} twinning in a zirconium alloy. Mater. Sci. Eng. A 2020, 789, 139650. [Google Scholar] [CrossRef]
  18. Paredes, M.; Wierzbicki, T. On mechanical response of Zircaloy-4 under a wider range of stress states: From uniaxial tension to uniaxial compression. Int. J. Solids Struct. 2020, 206, 198–223. [Google Scholar] [CrossRef]
  19. Murty, K.L.; Jallepalli, R.; Mahmood, S. Effects of recrystallization and Nb additions on texture and mechanical anisotropy of Zircaloy. Nucl. Eng. Des. 1994, 148, 1–15. [Google Scholar] [CrossRef]
  20. Murty, K.L.; Charit, I. Texture development and anisotropic deformation of zircaloys. Prog. Nucl. Energy 2006, 48, 325–359. [Google Scholar] [CrossRef]
  21. Godavarti, P.S.; Hussien, S.; Murty, K.L. Effect of Annealing Temperature on Yield Anisotropy of ZIRCALOY-4 TREX. Met. Mater. Trans. A 1988, 19, 1243–1255. [Google Scholar] [CrossRef]
  22. Nakatsuka, M.; Nagai, M. Reduction of Plastic Anisotropy of Zircaloy Cladding by Neutron Irradiation (I). J. Nucl. Sci. Technol. 1987, 24, 832–838. [Google Scholar] [CrossRef]
  23. Akhtar, A. Basal slip in zirconium. Acta Met. 1973, 21, 1–11. [Google Scholar] [CrossRef]
  24. Shi, H.; Zong, N.; Li, S.; Le, J.; Huang, G.; Li, J.; Mao, J.; Lu, W. The progressive intensification and attenuation of yield point phenomenon in a new polycrystalline zirconium alloy: Anisotropic response of work hardening-softening transition. Mater. Sci. Eng. A 2022, 848, 143385. [Google Scholar] [CrossRef]
  25. Koike, J.; Ohyama, R. Geometrical criterion for the activation of prismatic slip in AZ61 Mg alloy sheets deformed at room temperature. Acta Mater. 2005, 53, 1963–1972. [Google Scholar] [CrossRef]
  26. Zhu, G.; Wang, L.; Zhou, H.; Wang, J.; Shen, Y.; Tu, P.; Zhu, H.; Liu, W.; Jin, P.; Zeng, X. Improving ductility of a Mg alloy via non-basal <a> slip induced by Ca addition. Int. J. Plast. 2019, 120, 164–179. [Google Scholar] [CrossRef]
  27. Zhao, J.; Jiang, B.; Yuan, Y.; Wang, Q.; Yuan, M.; Tang, A.; Huang, G.; Zhang, D.; Pan, F. Understanding the enhanced ductility of Mg-Gd with Ca and Zn microalloying by slip trace analysis. J. Mater. Sci. Technol. 2021, 95, 25–28. [Google Scholar] [CrossRef]
  28. Ahmadikia, B.; Kumar, M.A.; Beyerlein, I.J. Effect of neighboring grain orientation on strain localization in slip bands in HCP materials. Int. J. Plast. 2021, 144, 103026. [Google Scholar] [CrossRef]
  29. Yu, H.; Luan, B.; Chen, J. EBSD analysis of the distribution of in-grain misorientation axes in cold-rolled Zr alloy. J. Chin. Electr. Microsc. Soc. 2011, 30, 10–14. [Google Scholar] [CrossRef]
  30. Chun, Y.B.; Battaini, M.; Davies, C.H.J.; Hwang, S.K. Distribution characteristics of in-grain misorientation axes in cold-rolled commercially pure titanium and their correlation with active slip modes. Met. Mater. Trans. A 2010, 41A, 3473–3487. [Google Scholar] [CrossRef]
  31. Zhu, Y.; Hou, D.; Li, Q. Quasi in-situ EBSD analysis of twinning-detwinning and slip behaviors in textured AZ31 magnesium alloy subjected to compressive-tensile loading. J. Magnes. Alloy. 2022, 10, 956–964. [Google Scholar] [CrossRef]
  32. Yi, S.; Bohlen, J.; Heinemann, F.; Letzig, D. Mechanical anisotropy and deep drawing behavior of AZ31 and ZE10 magnesium alloy sheets. Acta Mater. 2010, 58, 592–605. [Google Scholar] [CrossRef] [Green Version]
  33. Shi, H.; Li, J.; Mao, J.; Lu, W. The elimination of the yield point phenomenon in a new zirconium alloy: Influence of degree of recrystallization on the tensile properties. Scr. Mater. 2019, 169, 28–32. [Google Scholar] [CrossRef]
  34. Johnston, W.G.; Gilman, J.J. Dislocation velocities, dislocation densities, and plastic flow in lithium fluoride crystals. J. Appl. Phys. 1959, 30, 129–144. [Google Scholar] [CrossRef]
  35. Liu, Q.; Fang, L.; Xiong, Z.; Yang, J.; Tan, Y.; Liu, Y.; Zhang, Y.; Tan, Q.; Hao, C.; Cao, L.; et al. The response of dislocations, low angle grain boundaries and high angle grain boundaries at high strain rates. Mater. Sci. Eng. A 2021, 822, 141704. [Google Scholar] [CrossRef]
  36. Dong, S.; Yu, Q.; Jiang, Y.; Dong, J.; Wang, F.; Jin, L.; Ding, W. Characteristic cyclic plastic deformation in ZK60 magnesium alloy. Int. J. Plast. 2017, 91, 25–47. [Google Scholar] [CrossRef] [Green Version]
  37. Wu, X.; Suo, H.; Ji, Y.; Li, J.; Ma, L.; Liu, M.; Zhang, Z.; Wang, Q. Systematical analysis on the grain orientation evolution of pure nickel under plastic deformation by using in-situ EBSD. Mater. Sci. Eng. A 2020, 792, 139722. [Google Scholar] [CrossRef]
  38. Li, W.; Yamasaki, S.; Mitsuhara, M.; Nakashima, H. In situ EBSD study of deformation behavior of primary α phase in a bimodal Ti-6Al-4V alloy during uniaxial tensile tests. Mat. Sci. Eng. A 2020, 163, 110282. [Google Scholar] [CrossRef]
  39. Sun, H.; Zhang, Y.; Luan, B.; Zhu, X. In-situ EBSD analysis of hydrides phase transformation and its effect on micromechanical behavior in Zircaloy-4. No. 174 Shazhengjie, Shapingba, Chongqing, China. 2022; in press. [Google Scholar]
Figure 1. (a) Geometric dimensions of the specimen; and (b) the schematic diagram for the specific orientation specimen.
Crystals 12 01489 g001
Figure 2. Engineering stress strain curves of Zircaloy-4 along the RD and TD.
Crystals 12 01489 g002
Figure 3. Microscopic fractography of Zircaloy-4 sheet after tensile fracture at 1000× (ad) and the corresponding enlarged map at 4000× (gh). Fractography images at the middle (a,c,e,g) and edge position (b,d,f,h) of the fracture surface are shown.
Crystals 12 01489 g003
Figure 4. The IPF colored and grain boundary map of Zircaloy-4 after tensile test along RD at different strains, (a,c) 0.00%, (b,d) 6.64%. The legend that corresponds to the IPF colored map is shown in the bottom left; red, green, and blue show that the grain possesses the <0001>, <11 2 ¯ 0>, and <10 1 ¯ 0> orientations, respectively. This legend is applied in the following text.
Crystals 12 01489 g004
Figure 5. The IPF colored and grain boundary map of Zircaloy-4 after tensile test along TD at different strains, (a,c) 0.00%, (b,d) 6.20%.
Crystals 12 01489 g005
Figure 6. KAM distribution of Zircaloy-4 under various strains, (a) along RD, (b) along TD.
Crystals 12 01489 g006
Figure 7. Selected grain A–I from Figure 4a, the corresponding IGMA distribution below the selected grains map are used to determine the activated slip modes. The overall IGMA distribution of Figure 4c is shown in the bottom right corner. The maximum and minimum intensities of the IGMA distribution are also given at the bottom of each IGMA distribution. Intensity values less than 2.0 are considered IGMA without concentration.
Crystals 12 01489 g007
Figure 8. Selected grain A–I from Figure 5a, and the corresponding IGMA distribution below the selected grains map are used to determine the activated slip modes; the overall IGMA distribution of Figure 5b is shown in the bottom right corner. The maximum and minimum intensities of IGMA distribution are also given on the bottom of each IGMA distribution.
Crystals 12 01489 g008
Figure 9. Enlarged region (ac) of the yellow ellipse lines in Figure 4a at different strains and the corresponding misorientation angles distribution (df) along red and blue lines.
Crystals 12 01489 g009
Figure 10. SF distribution maps for basal <a> slip, prismatic <a> slip, and pyramidal slip system in the tensile Zircaloy-4 (ac) along the RD, and (df) along the TD.
Crystals 12 01489 g010
Figure 11. Cumulative distributions of SFN of grains calculated from the EBSD data of the RD and TD deformed samples.
Crystals 12 01489 g011
Table 1. Slip modes available in α-Zr and the corresponding Taylor axis.
Slip SystemSlip Plan, DirectionTaylor AxisVariants Number of Taylor Axis
Bas. <a> slip(0002), < 2 ¯ 10><0 1 ¯ 10>3
Prism. <a> slip(1 1 ¯ 00), < 1 ¯ 110><0001>1
Pyram. <a> slip(01 1 ¯ 1), < 1 ¯ 110><0 1 ¯ 12>6
Table 2. Calculated SFN values for slip modes of selected grains in the RD sample.
No.Euler Angle (φ1, Φ, φ2)Bas. <a>Prism. <a>Pyram. <a>
A66.65168.7159.210.1090.4650.212
B6.61169.1744.320.0140.4840.192
C14026.124.600.0890.480.206
D91.3536.0955.960.3170.2950.169
E170.4641.6836.330.0730.4350.182
F132.238.9134.510.2510.3730.216
G4.2983.9522.870.0490.4760.196
H2.296.951.250.0240.4880.197
I0.4281.451.830.0040.4490.176
Table 3. Calculated SFN values for slip modes of selected grains in TD sample.
No.Euler Angle (φ1, Φ, φ2)Bas. <a>Prism. <a>Pyram. <a>
A101.3174.0223.880.0670.4930.207
B164.895.8950.510.0200.4720.188
C165.99170.345.050.0270.4420.180
D93.93138.748.020.2400.2810.187
E83.84136.1538.390.3270.2630.173
F42.97135.4552.60.2730.3800.204
G79.5298.6152.250.1470.0300.049
H84.32102.0240.850.0600.0320.049
I89.6797.29.860.0800.0080.027
Publisher’s Note: MDPI stays neutral with regard to jurisdictional claims in published maps and institutional affiliations.

