Abstract
In this study, phase-field models were employed to simulate the effects of second-phase particles (SPPs) on grain growth of the AZ31 Mg alloy, under realistic spatial and temporal scales, at 350 °C, during annealing. The particle sizes ranged from 0 to 7 μm, and the particles with large volume fractions were used in the paper. The results reveal that the volume fractions and sizes of the SPP affect grain growth and that the volume fractions and sizes of the SPP on pinning exhibited critical values. When the SPP volume fraction is f = 5%, the SPP is at the maximum critical size, ; when the SPP size is , the SPP minimum critical volume fraction is fmin = 0.25% and the maximum critical volume fraction is fmax = 20%. The critical values increase with the increase of the sizes or volume fractions of the second-phase particles. Finally, the average grain size, particle size, and particle volume fraction obtained from the simulation were fitted according to the Zener relationship, and the obtained results showed that the fitting indices were in the range of 0.33–0.50. The results were compared with the experimental results. The simulation results obtained in this study will provide an important academic reference for understanding the mechanism and law of grain growth, an important reference for accurate control of grain size and properties of the material, a reference for the development of the annealing treatment process of Mg alloy, and a theoretical guide for the use of recrystallization process to control the microstructure of Mg alloy and improve the plastic-forming properties.
1. Introduction
Mg and its alloys, as the light metals at present, are known as the “modern green engineering materials” [1,2]. So, the vigorous development and application of Mg alloys for the alleviation of the shortage of domestic Fe, Al, and other metal mineral resources not only has great significance [3,4,5,6], but it will also play an irreplaceable important role in promoting the realization of the national strategy of becoming carbon neutral [7,8]. Among many Mg alloys, the AZ system is the earliest and most widely used Mg alloy, among which AZ31 Mg alloy is the most typical. However, the crystal structure of Mg is HCP, and there are few slip systems at room temperature, resulting in insufficient strength, stiffness, plasticity, and wear resistance, as well as an especially high temperature resistance, which limits their application.
As we know, the microstructure of the Mg alloy is one of the key factors that determine the mechanical properties according to the Hall–Petch formula [9]:
where is the material yield strength; is the constant, the yield strength of a single crystal independent metal; is the average diameter of the grain; and is a constant related to the property and grain size of materials. The strength and plasticity of the material are significantly improved with the reduction of the grain size. On the other hand, the crystallographic symmetry of the Mg alloy is low; while , it is much larger than that of BCC and FCC metals. Therefore, grain refinement can significantly improve the mechanical properties of Mg alloys.
Previously, Zener [10,11,12] investigated the effect of randomly distributed immobile hard SPPs on grain growth and derived the Zener theoretical model. The model [13] had spherical, mono-sized, and randomly distributed SPPs, which exhibited grain refinement. So, using SPPs as a reinforcing phase to prepare Mg-based composites is considered to be one of the most feasible methods to improve the comprehensive mechanical properties of Mg alloys.
Wang et al. fabricated pure Ti and Al2O3 particles–reinforced AZ31-based composites by using the friction stir processing, and the microstructure and tensile properties of these AZ31/Al2O3 and AZ31/Ti composites were examined and compared; the grain refinements and the corresponding hardening mechanisms were also analyzed and discussed. He et al. studied the grain growth of Mg alloys by using phase field models, and the authors found that, when the volume fraction of the second-phase particles is large, increasing the volume fraction of the particles will not further significantly refine the matrix grains; however, they did not further analyze its critical value.
It is well-known that it is very costly and expensive to rely solely on experiments, as it is often difficult to obtain accurate results due to the large number of trial-and-error experiments and the limitations of experimental conditions and equipment. Simulation can solve this problem very well. The common simulation methods are the front-tracking method [14,15], Monte-Carlo method [16,17], and phase field simulation method [18,19,20,21,22]. Compared with the other two simulation methods, the phase field method does not need to track the grain boundary position in the simulation of grain growth, and it is easy to deal with the problems of solute aggregation and second-phase precipitation on the grain boundary, so the phase field method was chosen for the study.
Studies using phase field models to simulate the second-phase particles’ pinning have also been reported. Lai et al. [21] studied the morphology and kinetics evolution of the Ni3Al phase during re-dissolution in Ni-15% Al alloys; the changes of the volume fraction and average particles’ radius of the Ni3Al phase were clarified with the phase field simulation. Sato et al. [22] studied the retardation effect of dispersed inert particles on δ—γ interface migration in carbon steel, during isothermal δ to γ transaction, using two-dimensional phase field simulations; they focused on the effects of the particles’ radius, particle spacing, and initial carbon concentration of δ phase, and the important findings are summarized. However, these studies either did not achieve real timescale and space-scale simulations, or the simulated timescales were too small to reach the industrial scale.
In this study, multi-order parametric phase-field models were used to simulate the grain growth of AZ31 Mg alloy containing micron-sized second-phase field on real space scales and timescales. The effects of the second-phase-field size and volume fraction on the microstructure, as well as the corresponding critical values of these two factors to achieve fine-grain strengthening through pinning, were investigated. The simulation results obtained in this study provide important academic references for understanding the mechanism and law of grain growth containing the second-phase particles and provide important reference values for accurate control of grain size and characteristics of micron materials.
2. Model Description
The phase-field model [23,24] is based on thermodynamics, which constructs a model of phase-field equations to describe the dynamics of system evolution by considering the combined effects of the ordering potential and thermodynamic driving force. The core idea [25] of the model is to transform the sharp interface problem in the process of tissue transformation into a diffuse interface problem by introducing one or more continuously varying order parameters, as doing so avoids the complex and tedious mathematical processing problems associated with real-time tracking of interfaces and greatly reduces the workload. The temporal evolution of the microstructure can be determined by the evaluation of the time-dependent Allen–Cahn equation and Cahn–Hilliard diffusion equation as follows [26]:
where L is the interfacial energetic coefficient; M is the diffusion mobility coefficient; t is time; r is the position; is the ordering parameter, which represents the grain orientation in this simulation, and p is set to 32 in this system, as suggested in a previous study [14]; and is the component field variable. According to Reference [14], the model is simplified, and only the diffusion at a higher content of Al composition field is taken into account without considering the diffusion of other alloying elements. Therefore, there is only one composition field variable in the model. F is the total free energy of the system. In this study, the system is assumed to be isotropic, so F expressed as follows [27]
where r is the position vector, and ; is the gradient energy coefficient and is the local free-energy density function. In order to introduce the second phase into the models, the following term, , could be added to :
where is used to describe the particle distribution. When , there is a particle, and when , there is no particle, while is considered to be constant with the time. Moreover, is the coefficient related to the interaction between the matrix and the particles. Since the interaction between the matrix and the particles have not been considered, the value of is 1 J mol−1.
The local free-energy density function used in this study can be expressed as follows [28]:
where is the composition at the lowest point of the free-energy composition curve at a certain temperature of the Al in the Mg alloy; n is the number of possible ordering parameters in the system; A0, , and are the constants associated with the free energy of the system; and are the coefficients for restored energy; and is the coupling term coefficient between and .
In the study, the grain boundary range is chosen in the model, which is different from the traditional grain boundary. Generally, the grain boundary refers to the structure with 3 or 4 atoms in the crystal that is different from other parts. However, the grain boundary range represents the energy difference between the interface and the matrix, and it reflects the distribution range of the interface energy in the direction perpendicular to the interface. At the same time, the calculation [20] shows that this range also corresponds to the interface segregation range of alloy elements. The width of the grain boundary scope is selected as a 4 grid size according to previous work [20].
This study was performed by using the AZ31 Mg alloy, and the annealing temperature was 350 °C. The alloy composition is w(Al) = 3%, w(Zn) = 1%, and Mg is the remainder. The added SPPs are set as insoluble particles. The simulation system is a two-dimensional system with a square grid as the calculation area and periodic boundary conditions. The total area of the simulation area is 150 μm × 150 μm, with 512 × 512 cells; that is, the width of each cell dx is 0.293 μm. The time step is typically selected to be relatively small to converge the results, but if it is too small, additional computational time will be required to form the required microstructure; hence, the time step selected for this simulation is 0.3 s. The shape of the SPP is circular. Since the recrystallization nucleation process is quite complex, the study treats the nucleation process by the phenomenological method and takes it as the initial condition, and the average simulation area, 4dx × 4dx, is used as the initial unit, and the radius of the grain nucleus in each unit is a random value between 0 and 2 grids. The initial composition is set according to the local initial value; when , it is in the new recrystallized grains, the composition c is 0.03, and the composition in other regions is 0.031. The parameters in the model are set as follows [29]: , A0 = −25.01 kJ mol−1, , , , , , , and . Different from the models proposed in References [30,31], the parameters in the models are all with physical meanings in order to achieve the realistic spatiotemporal simulation in this work.
3. Simulation Results of the AZ31 Mg Alloy
The evolution of the microstructure of AZ31 magnesium alloy with time was simulated by the constructed phase field model, and the simulation results are shown in Figure 1.
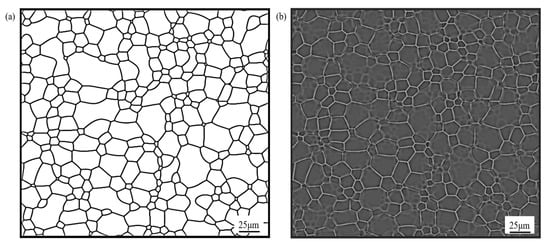
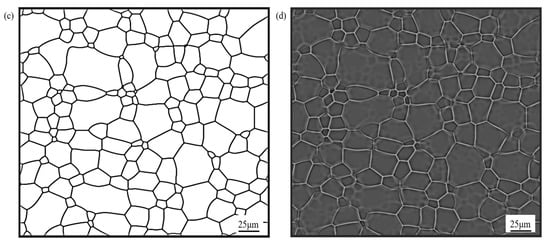
Figure 1.
Simulation results of microstructure evolution when t = 30 min and 60 min at 350 °C: (a,b) for the order field at 30 min, 60 min; (c,d) for concentration field at 30 min, 60 min.
It can be seen from Figure 1 that the microstructures simulated by the composition field and ordering parameters correspondence well, which proves that the free energy density function constructed in this paper is correct and proves the validity of the constructed phase field model. It can been seen from Figure 1b,d that the distribution of Al components is relatively uniform near the straight interface, while it is very uneven near the curved interface, leaving traces of the previous grain evolution. The simulation results are also in good agreement with the experimental results about the microstructure evolution [32].
The evolution of the microstructure of AZ31 Mg alloy containing SPP with time was simulated, and the results are shown in Figure 2.
Figure 2.
Microstructure evolution of AZ31 Mg alloy containing SPP with particle size r = 1 μm and volume fraction f = 5%: (a) t = 30 min, (b) t = 60 min, and (c) t = 90 min. (d) Backscattered electron image of the cross-section of the as-received Cu-0.21 wt.% O powder; white arrows indicate some of the second-phase particles [33].
Figure 2 shows the evolution of the microstructure of the AZ31 Mg alloy containing SPPs with a grain size of r = 1 μm and volume fraction of f = 5%. It can be found from Figure 2 that the number of grains in the system shows a trend of gradual decrease to basic stability, indicating that the grains are gradually growing. The simulated microstructure morphologies are consistent with the experimental observations [33].
It can also be found, due to the addition of SPP, that there is the occurrence of abnormal grain-growth phenomenon, as shown by the circle in Figure 2. The reason for this phenomenon is the uneven pinning of the SPP. It is shown in the circle that there are multiple SPPs on some grain boundaries and no SPPs on some grain boundaries, so during the grain-growth process, there is a difference in the migration rate of each grain boundary, and the unpinned grain boundaries migrate faster and easily merge with the surrounding grain boundaries to cause abnormal grain growth.
In order to further investigate the effect of the SPPs on the evolution of the microstructure, the change of the average grain size with time and with and without SPPs is shown in Figure 3.
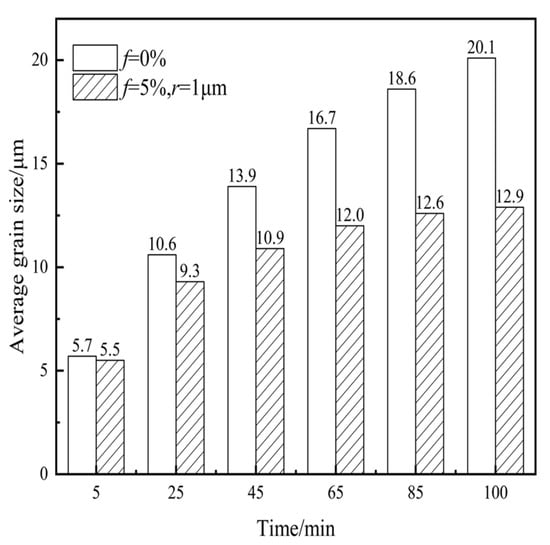
Figure 3.
Histogram of average grain size with time with and without SPPs.
It can be seen from Figure 3 that the average grain size is significantly refined when the AZ31 Mg alloy contains SPPs at the same time, indicating that the addition of SPPs can refine the grains to achieve fine-grain strengthening. This is because the grain-growth process is related to grain-boundary migration; however, particles were trapped in the grain boundaries and increased resistance to grain-boundary migration, leading to grain refinement.
The effect of the volume fraction of SPPs on the AZ31 Mg alloy microstructure was further investigated. Figure 4 shows the results.
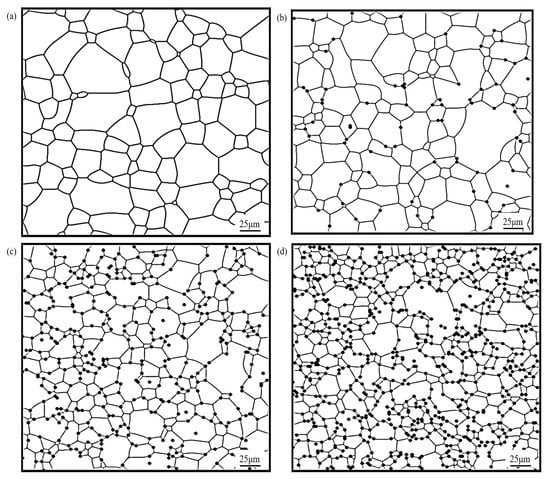
Figure 4.
Simulation results for different particle volume fractions and simulation time of t = 100 min for the second-phase particle size r = 1 μm: (a) f = 0%; (b) r = 1 μm, and f = 1%; (c) r = 1 μm, and f = 5%; (d) r = 1 μm, and f = 10%.
Figure 4 shows the results of the effect of particle volume fraction on the microstructure in the AZ31 Mg alloy, and the simulation results at t = 100 min were selected for comparison. Figure 4 shows that when the particle size is certain, the number of grains in the system gradually increases with the increase of the particle volume fraction, and an obvious grain-refinement phenomenon appears; when the particle volume fraction is small (as shown in Figure 4b), the number of grains in the system is smaller, the spacing between the grains is larger, and the overall pinning effect that can be played on the grain boundaries is weaker, so most of the grains can grow normally. When the volume fraction of particles is larger (Figure 4d), which means that the spacing between particles also decreases, the overall pinning effect on the grain boundary is enhanced, and the movement of the grain boundary is hindered more seriously, so the number of grains in the system increases, and the grain-refinement phenomenon is more significant. The effect of the size of the SPPs on the AZ31 Mg alloy microstructure was further investigated, as shown in Figure 5.
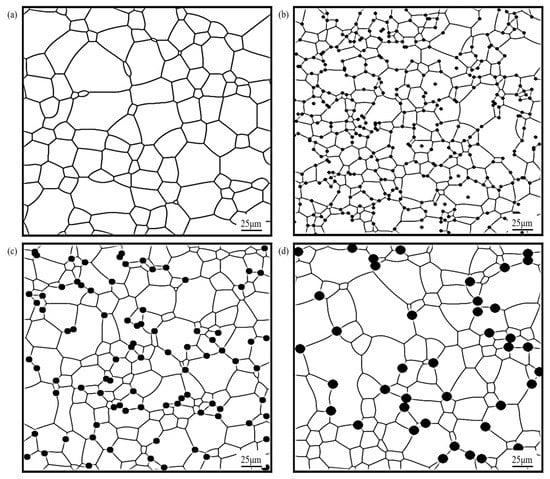
Figure 5.
Simulated results of grain growth at t = 100 min with varying sizes of the SPP: (a) f = 0%; (b) f = 5%, and r = 1 μm; (c) f = 5%, and r = 2 μm; (d) f = 5%, and r = 3 μm.
Figure 5 shows the simulation results of grain growth with different particle sizes. With the increase in the size of the added particles, the grain-refinement effect is reduced. According to the classical Zener model, the resistance to grain growth of the second phase at the grain boundary F is as follows:
where is the specific interfacial energy (); and are the SPP size and volume fraction, respectively. It can be seen that, the smaller the particle size and the more the volume fraction, the stronger the overall pinning effect of the particles on grain growth.
Overall, the addition of particles leads to limited grain growth, and the refining effect is influenced by the particle size, as well as the volume fraction.
4. Analysis and Discussion
4.1. Effect of SPP on the Grain Growth of Mg Alloy
According to the results of the effects of SPPs on the microstructure of the Mg alloy in Figure 4 and Figure 5, the quantitatively calculated curves of the average grain size evolution with the annealing time are plotted in Figure 6.
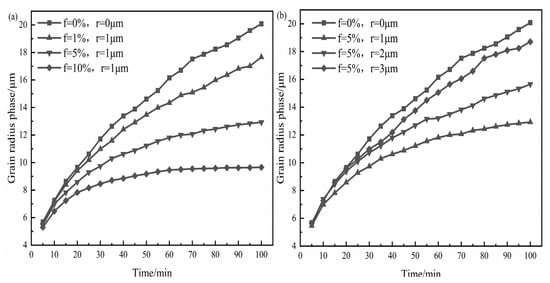
Figure 6.
Curves of the change in the average grain size as a function of annealing time: (a) various volume fractions of SPP and (b) various sizes of SPP.
It can be seen in Figure 6 that the average grain size during the initial stage of grain growth did not differ significantly between cases t < 10 min. With the increase in the simulation time, the grains gradually expand, the average size of the grains increases, and the difference of the change in the volume fractions and sizes of the grains become clear. This result is related to the fact that particles are randomly distributed, with few particles located at the grain boundary in the early stages of grain growth, and that grains with a large radius of curvature are present in the early stages of growth; hence, it is difficult to effectively impede grain growth due to the pinning force generated by particles. With the progress of evolution, grain-boundary migration leads to the gradual increase in the number of particles located at grain boundaries, the overall pinning effect of particles increases, and the effect of the difference in grain size and volume fraction gradually manifests itself; hence, the average grain-size curves gradually differentiate in the later stages.
Overall, particles mostly impede grain growth in the latter period of grain growth because their pinning effect on the grain boundaries is greater than that in the former stages.
4.2. Critical Value of SPP for Grain Boundary Pinning
The pinning effect of particles on grains is mainly manifested in the hindrance of grain growth. According to the grain-growth kinetic equation [34], we have the following:
where Rave is the average grain size, and it increases rapidly with the progress of evolution; m is the grain growth index; k is a constant related to time, and its unit is related to m; and R0 is a constant.
Moreover, m is obtained by fitting the growth-index equation and simulation results. Clearly, the higher the grain growth index, m, the slower the grain growth. With the progress of grain growth, the number of particles on the grain boundaries progressively increases, but the growth rate of the matrix grains gradually decreases and ultimately stabilizes.
It can be seen from Figure 6 that, the fewer the second-phase particles, the weaker their pinning force to the grain boundary. Therefore, the critical values of the second-phase particles were considered in the investigation, as they affect the grain growth.
4.2.1. Critical Volume Fraction of SPP for Grain Boundary Pinning
The critical values of the particle volume fraction are determined by the phase-field models. For example, the minimum critical volume fraction is determined by the comparison of the average grain size curve without the second-phase particle, and it is considered to be reached when two curves approximately coincide. When the particle volume fraction is less than the minimum critical volume fraction, the pining impact of particles on grain boundaries is extremely weak, approaching negligible.
Figure 7 shows the average grain size, Rave, as a function of time for each volume fraction of the particles at r = 0.5 μm, 1.0 μm, 1.5 μm, and 2.0 μm, and the minimal critical volume fraction, fmin, and maximum critical volume fraction, fmax, were obtained and are shown in Table 1.
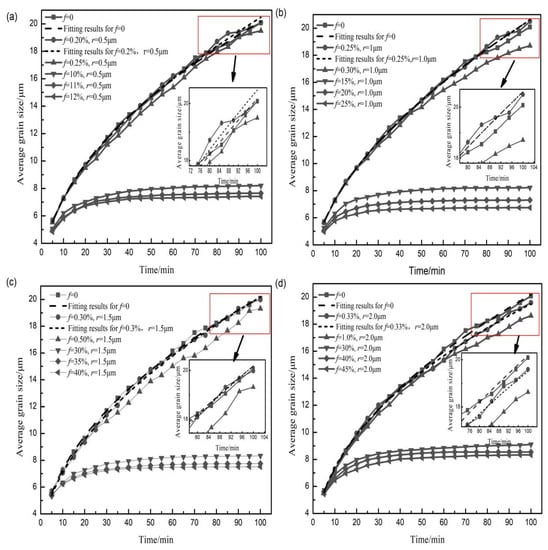
Figure 7.
Variation in the average grain size curve as a function of time under different volume fractions of the SPP: (a) r = 0.5 μm, (b) r = 1.0 μm, (c) r = 1.5 μm, and (d) r = 2.0 μm.

Table 1.
Comparison of the critical volume fractions for different second-phase particle sizes.
As can be observed from Table 1, the critical value of the volume fraction of the corresponding particles increases with the increase in the particle size.
According to the fitting of the curves in Figure 7 in terms of Equation (10), the grain-growth law was obtained and is shown in Table 2. The fitting results are consistent with the simulation results [35], as well as experimental results [36].
Table 2.
Variation of the parameters in the grain-growth-index equation with SPP volume fraction.
It could be seen from Table 2 that when the volume fraction of the SPP takes the minimum value, the grain growth index is relatively close under different SPP sizes, and this, to a certain extent, justifies the determined maximum critical size. The fitting degree, R2, is 0.99, indicating that the fitting is reasonable.
4.2.2. Critical Size of SPP for Grain Boundary Pinning
The particle size also exhibits the minimum critical size and the maximum critical size at a certain volume fraction. The simulation results are shown in Figure 8.
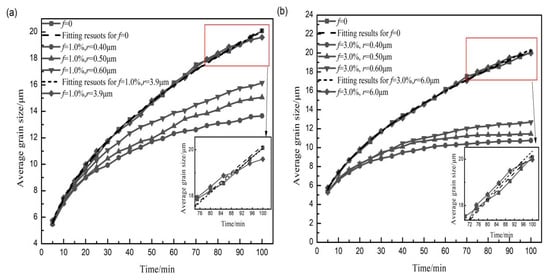
Figure 8.
Average grain size as a function of time for SPP at the critical size: (a) f = 1%, (b) f = 3%, (c) f = 5%, and (d) f = 7%.
Figure 8 shows a graph of the average grain size as a function of time for the critical size of particles for f = 1.0%, 3.0%, 5.0%, and 7.0%. As can be observed in Figure 8a, the grain-growth curve for particle size r = 3.9 μm overlaps well with that without the addition of particles, indicating that r = 3.9 μm is the maximum critical size for the volume fraction of particles. Similarly, the critical value of the largest second-phase particle sizes is also found in Figure 8b–d, making the growth curve of the grains close to the case in which there are no SPPs. The results are shown in Table 3.
Table 3.
Comparison of critical sizes for different SPP volume factions.
Table 3 shows the critical particle size value for each volume fraction. With the increase in the volume proportion of particles, the maximum critical size critical value of the corresponding particles increases (Table 3), and the minimum critical size is not observed.
According to the fitting of critical curves in Figure 8 and the Equation (10), the grain-growth law is obtained in Table 4. As can be observed from Table 4, the growth index is between 2 and 3, which means that the grain growth law is basically in line with the traditional grain-growth theory at this time, indicating that the SPPs have little influence on the grain growth, and the fitting degree, R2, is 0.99, too.
Table 4.
Variation of parameters in the grain growth index equation with second-phase particle size.
4.3. Zener Relationship Verification
The effect on the limited radius of grains, , is another manifestation of the pinning of the second-phase particle on grain boundaries. Zener posits the effect of particles on the limiting radius of the grain, assuming no particle growth [37]. In the Zener formula [38,39], we have the following:
where K is parameter, and b is the fitting index. Previous lots of simulated and experimental results [40,41] reveal that the fitting indices are in the range of −0.55 to −0.30. It is also known from Reference [42] that the experimental results based on thin aluminum strips showed that the curve-fitting index is around −0.5. The simulation results obtained in this simulation: the average grain size, second-phase particle size, and second-phase particle volume fraction were fitted by the Zener relationship, and the resulting curves are shown in Figure 9.
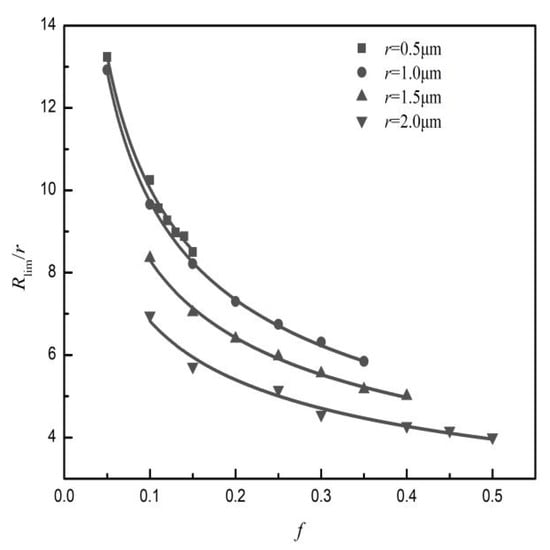
Figure 9.
Ratio of the average grain size and second-phase particle size, Rlim/r, versus the second-phase particle volume fraction, f.
The curves were fitted by using least squares via the Zener relationship. The corresponding relationship is expressed by the following equations:
The simulation results obtained in this study show that the fitting indices are in the range of 0.33–0.50.
On the other side, Yang et al. investigated the effect of second-phase particles on the microstructure of the laser-melted column during solidification by using the phase field method; the average grain radius, particle radius, and particle volume fraction were obtained from the simulations; and the fit index was 0.38, according to the Zener relationship. Huang et al. [43] investigated the second-phase particle precipitating at grain boundaries by the phase field method, and the simulation results showed that the effect of the second-phase particles on the limit grain sizes follows the Zener relationship, and the corresponding fitting index is 0.49. Du et al. [44] used the phase-field method to numerically simulate the pinning effect of differently shaped second-phase particles on the grain growth in polycrystalline structures; particles of spherical, cubical, ellipsoidal, and cuboidal shapes were added to the microstructure separately, with different volume fractions. The results obtained from the simulation were fitted to the Zener relationship, and the pinning forces were calculated based on the Zener theory. The results obtained from the simulation that the fit indices were 0.4–0.55. Olgeerd et al. [41] investigated the grain growth in polycrystalline calcite by the addition of Al2O3 particles, and the stable grain size reached during heat treatment was inversely proportional to l/f b, where b varied from 0.3 to 0.55. Thus, the simulation results obtained in this study are consistent with the simulation results [24,43,44] and experimental results [41,42].
5. Conclusions
In the simulations, the critical values of the particle size and volume fraction of the SPP that affect the growth of matrix grains during recrystallization are determined by the real space–time phase field model.
The critical value of the second-phase particle volume fraction contains the maximum and minimum critical volume fractions, which increase with the increase in the second-phase particle size.
Different from the critical volume fraction, only the maximum critical size increases with the increase in the second-phase particle volume fraction.
The values of the grain growth index, m, in the grain index equation and the average grain size curve confirm the validity of the critical value of the SPP determined in this study.
The simulation results obtained by fitting the Zener relationship for four second-phase particle sizes are compared to the relevant simulation results and experimental data, and the simulated results are in good agreement, indicating that the model is reliable.
Author Contributions
Conceptualization, Y.W.; methodology, Y.W.; validation, J.X., R.Z. and S.W.; formal analysis, J.X.; investigation, J.X.; resources, Y.W., J.C.; data curation, J.X., Q.L.; writing—original draft preparation, J.X.; writing—review and editing, Y.W., J.X.; visualization, Y.W., J.X.; supervision, Y.W.; project administration, Y.W.; funding acquisition, Y.W. All authors have read and agreed to the published version of the manuscript.
Funding
This research was funded by Project of Wuhan Polytechnic University grant number [2021Y31] and supported by Science Research Program of Hubei Provincial Department of Education, and the APC was funded by Science Research Program of Hubei Provincial Department of Education. Science Research Program of Hubei Provincial Department of Education, D20221606.
Institutional Review Board Statement
Not applicable.
Informed Consent Statement
Not applicable.
Data Availability Statement
Not applicable.
Acknowledgments
This study was supported by Project of Wuhan Polytechnic University (No. 2021Y31), China. Science Research Program of Hubei Provincial Department of Education, D20221606.
Conflicts of Interest
The authors declared that they have no conflicts of interest to this work.
References
- Wu, G.H.; Chen, Y.S.; Ding, W.J. Current research, application and future prospect of Magnesium alloys in aerospace industry. Manned Spacefl. 2016, 22, 281–292. [Google Scholar]
- Yang, Y.X.; Yang, W.F.; Mao, D.L.; Peng, J.H. Research and mechanical properties of Tantalum Carbide (TaC) reinforced AZ91 magnesium matrix composites. Hot Work. Technol. 2021, 50, 70–74. [Google Scholar]
- Shi, Z.Z.; Chen, H.T.; Zhang, K.; Dai, F.Z.; Liu, X.F. Crystallography of precipitates in Mg alloys. J. Magnes. Alloys 2021, 9, 416–431. [Google Scholar] [CrossRef]
- Zhang, J.; Jian, Y.; Zhao, X.; Meng, D.; Pan, F.; Han, Q. The tribological behavior of a surface-nanocrystallized magnesium alloy AZ31 sheet after ultrasonic shot peening treatment. J. Magnes. Alloys 2021, 9, 1187–1200. [Google Scholar] [CrossRef]
- Marzbanrad, B.; Razmpoosh, M.H.; Toyserkani, E.; Jahed, H. Role of heat balance on the microstructure evolution of cold spray coated AZ31B with AA7075. J. Magnes. Alloys 2021, 9, 1458–1469. [Google Scholar] [CrossRef]
- Wang, K.D. Mechanical Properties of Friction Stir Processed Mg-AZ31 Based Composites with Al2O3 Particles and Ti Particles. Master’s Thesis, Dalian University of Technology, Dalian, China, 2009. [Google Scholar]
- Fu, J.; Du, W.; Jia, L.; Wang, Y.; Zhu, X.; Du, X. Cooling rate controlled basal precipitates and age hardening response of solid-soluted Mg–Gd–Er–Zn–Zr alloy. J. Magnes. Alloys 2021, 9, 1261–1271. [Google Scholar] [CrossRef]
- Kim, Y.J.; Lee, J.U.; Kim, Y.M.; Park, S.H. Microstructural evolution and grain growth mechanism of pre-twinned magnesium alloy during annealing. J. Magnes. Alloys 2021, 9, 1233–1245. [Google Scholar] [CrossRef]
- Zhang, M.Q. Study on Fine Grain Strengthening of Mg-Y-Sm-Zn Magnesium Alloy. Master’s Thesis, XI’AN University of Architecture and Technology, Xi’an, China, 2019. [Google Scholar]
- Li, K.; Shen, Y.; Li, D.Y.; Peng, Y.H. Phase Field Study of Second Phase Particles-Pinning on Strain Induced Grain Boundary Migration. Mater. Sci. Forum 2020, 993, 967–975. [Google Scholar] [CrossRef]
- Teng, C.Y.; Fu, Y.; Ren, Z.Y.; Li, Y.H.; Wang, Y.; Ouyang, W.L. Phase Field Simulation of Grain Growth with Particle Pinning. Key Eng. Mater. 2016, 724, 8–11. [Google Scholar] [CrossRef]
- Chakrabarti, T.; Manna, S. Zener pinning through coherent precipitate: A phase-field study. Comput. Mater. Sci. 2018, 154, 84–90. [Google Scholar] [CrossRef]
- Chang, K.; Feng, W.; Chen, L. Effect of second-phase particle morphology on grain growth kinetics. Acta Mater. 2009, 57, 5229–5236. [Google Scholar] [CrossRef]
- Couturier, G.; Doherty, R.; Maurice, C.; Fortunier, R. 3D finite element simulation of the inhibition of normal grain growth by particles. Acta Mater. 2005, 53, 977–989. [Google Scholar] [CrossRef]
- Vanherpe, L.; Moelans, N.; Blanpain, B.; Vandewalle, S. Pinning effect of spheroid second-phase particles on grain growth studied by three-dimensional phase-field simulations. Comput. Mater. Sci. 2010, 49, 340–350. [Google Scholar] [CrossRef]
- Frazier, W.E.; Hu, S.; Joshi, V.V. A Potts Model parameter study of particle size, Monte Carlo temperature, and “Particle-Assisted Abnormal Grain Growth”. Comput. Mater. Sci. 2020, 185, 109945. [Google Scholar] [CrossRef]
- Haghighat, S.M.H.; Taheri, A.K. Investigation of limiting grain size and microstructure homogeneity in the presence of second phase particles using the Monte Carlo method. J. Mater. Processing Technol. 2008, 195, 195–203. [Google Scholar] [CrossRef]
- He, R. Simulation of Grain Growth in AZ31 Mg Alloy Influenced by Second-Phase Particles in Different Geometric Morphology. Master’s Thesis, Northeastern University, Shenyang, China, 2014. [Google Scholar]
- Wu, Y.; Zong, Y.; Jin, J. Grain growth in a nanostructured AZ31 Mg alloy containing second phase particles studied by phase field simulations. Sci. China Mater. 2016, 59, 355–362. [Google Scholar] [CrossRef]
- Xian-Gang, Z.; Ya-Ping, Z.; Ming-Tao, W.; Yan, W. A physical model to express grain boundaries in grain growth simulation by phase-field method. Acta Phys. Sin. 2011, 60, 755–763. [Google Scholar] [CrossRef]
- Lai, K.W.; Shi, S.J.; Yan, Z.W.; Li, Y.S.; Jin, S.S.; Wang, D.; Maqbool, S. Phase-field simulation of re-dissolution of γ′phase in Ni–Al alloy by continuous and second-order aging treatment. Rare Met. 2021, 40, 1155–1163. [Google Scholar] [CrossRef]
- Sato, D.; Ohno, M.; Matsuura, K. Phase-Field Simulations and Analysis of Effect of Dispersed Particles on Migration of Delta to Gamma Transformation Interface. Metall. Mater. Trans. A 2015, 46, 981–988. [Google Scholar] [CrossRef]
- Song, Y.; Wang, M.; Zong, Y.; He, R.; Jin, J. Grain Refinement by Second Phase Particles under Applied Stress in ZK60 Mg Alloy with Y through Phase Field Simulation. Materials 2018, 11, 1903. [Google Scholar] [CrossRef]
- Yang, J.; Li, Y.; Lee, C.; Kim, J. Numerical simulations of the dynamics of axisymmetric compound liquid threads with a phase-field model. Eur. J. Mech. B Fluids 2021, 89, 203–216. [Google Scholar] [CrossRef]
- Li, D.Y.; Zhang, J.; Deng, Z.C. Study on effects of reinforcement particles on microstructure in Laser Melt Casting Solidification by Phase-field Method. Hot Work. Technol. 2018, 47, 179–182. [Google Scholar]
- Zhao, Y.; Zhang, H.; Wei, H.; Zheng, Q.; Jin, T.; Sun, X. A phase field study for scaling rules of grain coarsening in polycrystalline system containing second-phase particles. Acta Metall. Sin. 2013, 49, 981–988. [Google Scholar] [CrossRef]
- Wu, Y. The Simulation and Research for a Part of Micro-Factors Influencing Recrystallization and Grain Growth in AZ31 Mg Alloy. Ph.D. Thesis, Northeastern University, Shenyang, China, 2010. [Google Scholar]
- Wu, Y. Simulation of Nanocrystalline Grain Growth and Abnormal Grain Growth for AZ31 Mg Alloy by Phase Field Methods. Master’s Thesis, Northeastern University, Shenyang, China, 2014. [Google Scholar]
- Wang, M.; Zong, B.Y.; Wang, G. Grain growth in AZ31 Mg alloy during recrystallization at different temperatures by phase field simulation. Comput. Mater. Sci. 2009, 45, 217–222. [Google Scholar] [CrossRef]
- Fan, D.; Chen, L.-Q. Computer simulation of grain growth using a continuum field model. Acta Mater. 1997, 45, 611–622. [Google Scholar] [CrossRef]
- Fan, D.; Chen, L.-Q. Computer simulation of topological Evolution in 2-D grain growth using a continuum diffuse-interface feild model. Acta Mater. 1997, 45, 1115–1126. [Google Scholar] [CrossRef]
- Liu, R.C.; Wang, L.Y.; Gu, L.G.; Huang, G.S. Study on annealing technique for wrought magnesium alloy plate and modeling research on the changing law of its grain size. Light Alloy. Fabr. Technol. 2004, 32, 22–25. [Google Scholar]
- Zhang, Y.; Brodusch, N.; Descartes, S.; Shockley, J.M.; Gauvin, R.; Chromik, R.R. The Effect of Submicron Second-Phase Particles on the Rate of Grain Refifinement in a Copper-Oxygen Alloy During Cold Spray. J. Spray Tech. 2017, 26, 1509–1516. [Google Scholar] [CrossRef]
- Zhou, G.Z.; Wang, Y.X.; Chen, Z. Phase-field method simulation of the effect of hard particles with different shapes on two-phase grain growth. Acta Metall. Sin. 2012, 48, 227–234. [Google Scholar] [CrossRef]
- Luo, Z.R.; Gao, Y.J.; Qiu, H.G. Effect of stick second-phase particles with different geometric orientations on grain growth simulated by phase field method. Chin. J. Nonferrous Met. 2010, 20, 2406–2411. [Google Scholar]
- Humphreys, F.J.; Hatherly, M. Recrystallization and Related Annealing Phenomena; Elsevier Ltd.: Amsterdam, The Netherlands, 2017; pp. 1–63. [Google Scholar]
- Li, Y.; Kim, J. Phase-field simulations of crystal growth with adaptive mesh refinement. Int. J. Heat Mass Transf. 2012, 55, 7926–7932. [Google Scholar] [CrossRef]
- Yoon, S.; Park, J.; Wang, J.; Lee, C.; Kim, J. Numerical Simulation of Dendritic Pattern Formation in an Isotropic Crystal Growth Model on Curved Surfaces. Symmetry 2020, 12, 1155. [Google Scholar] [CrossRef]
- Zhang, J.; Ludwig, W.; Zhang, Y.; Sørensen HH, B.; Rowenhorst, D.J.; Yamanaka, A.; Poulsen, H.F. Grain boundary mobilities in polycrystals. Acta Mater. 2020, 191, 211–220. [Google Scholar] [CrossRef]
- Li, J.J.; Wang, J.C.; Yang, G.C. Phase field simulations of grain growth in systems containing second-phase particles. Rare Met. Mater. Eng. 2008, 10, 1746–1750. [Google Scholar]
- Olgaard, D.L.; Evans, B. Effect of second-phase particles on grain growth in calcite. J. Am. Ceram. Soc. 1986, 69, C-272–C-277. [Google Scholar] [CrossRef]
- Longworth, H.P.; Thompson, C.V. Abnormal grain growth in aluminum alloy thin films. J. Appl. Phys. 1991, 69, 3929–3940. [Google Scholar] [CrossRef]
- Huang, Y.B.; Wang, Y.X.; Chen, Z. Phase Field Simulation of the Second Phase Particle Precipitation at Boundaries and Its Pinning Effect. Rare Met. Mater. Eng. 2012, 41, 1751–1755. [Google Scholar]
- Du, L.; Yang, S.; Zhang, P.; Du, H. Pinning effect of different shape second-phase particles on grain growth in polycrystalline: Numerical and analytical investigations. Compos. Interfaces 2018, 25, 357–368. [Google Scholar] [CrossRef]


Publisher’s Note: MDPI stays neutral with regard to jurisdictional claims in published maps and institutional affiliations. |
© 2022 by the authors. Licensee MDPI, Basel, Switzerland. This article is an open access article distributed under the terms and conditions of the Creative Commons Attribution (CC BY) license (https://creativecommons.org/licenses/by/4.0/).