Abstract
The microstructures of Mg-1Sn-2.5Y (wt%) alloys solidified under high pressures were investigated. In addition, a mathematical model was established to analyze the effects of solidification pressure and cooling rate on the average grain size. The results show that the alloy was solidified under high pressure and temperature gradient using the cooling rate difference in the high pressure chamber, resulting in the formation of the outer equiaxed zone, the columnar zone, and the equiaxed zone in the sample. With an increase in the solidification pressure, the columnar-to-equiaxed transition was inhibited in Mg-1Sn-2.5Y alloy. In the outer fine equiaxed zone and the columnar zone, the solubility of Sn in the Mg matrix increased with an increase in solidification pressure. The average secondary dendrite arm spacing decreased from 14–17 μm under 1 GPa to 9–11 μm under 1.5 GPa. Increases in pressure and cooling rate resulted in a reduction in average grain size.
1. Introduction
Pressure changes the structure of matter by changing the distance between atoms and produces new structures. High pressure technology has become an effective method to synthesize new materials [1,2,3,4], study the phase transition of known materials [5,6,7,8,9], and verify the theoretical model [10,11,12].
Under the pressure of GPa, the nucleation rate and growth rate change [13,14], the microstructure refinement occurs [15,16], and the solubility of solute in the matrix increases [17]. Cooling rate and temperature gradient, as important conditions in cooling conditions, have an important influence on the high-pressure solidification process. It is necessary to study the effect of solidification pressure and cooling rate on the microstructure of the alloy.
In recent years, the development of heat-resistant magnesium alloys has become one of the main focuses of magnesium alloy research. The Mg2Sn phase in the Mg-Sn alloy with a melting point of up to 771 °C gives it the potential to be used at high temperatures [18,19,20]. The addition of trace amounts of rare earth element Y to the Mg-Sn alloy improves its high temperature strength and corrosion resistance, and has age-hardening characteristics [21]. Therefore, this paper takes Mg-Sn-Y alloy as the research object.
In this paper, the microstructures of Mg-1Sn-2.5Y (wt%) alloy solidified under different pressures and cooling rates were studied. In addition, a mathematical model was established to analyze the effects of solidification pressure and cooling rate on the average grain size.
2. Experimental
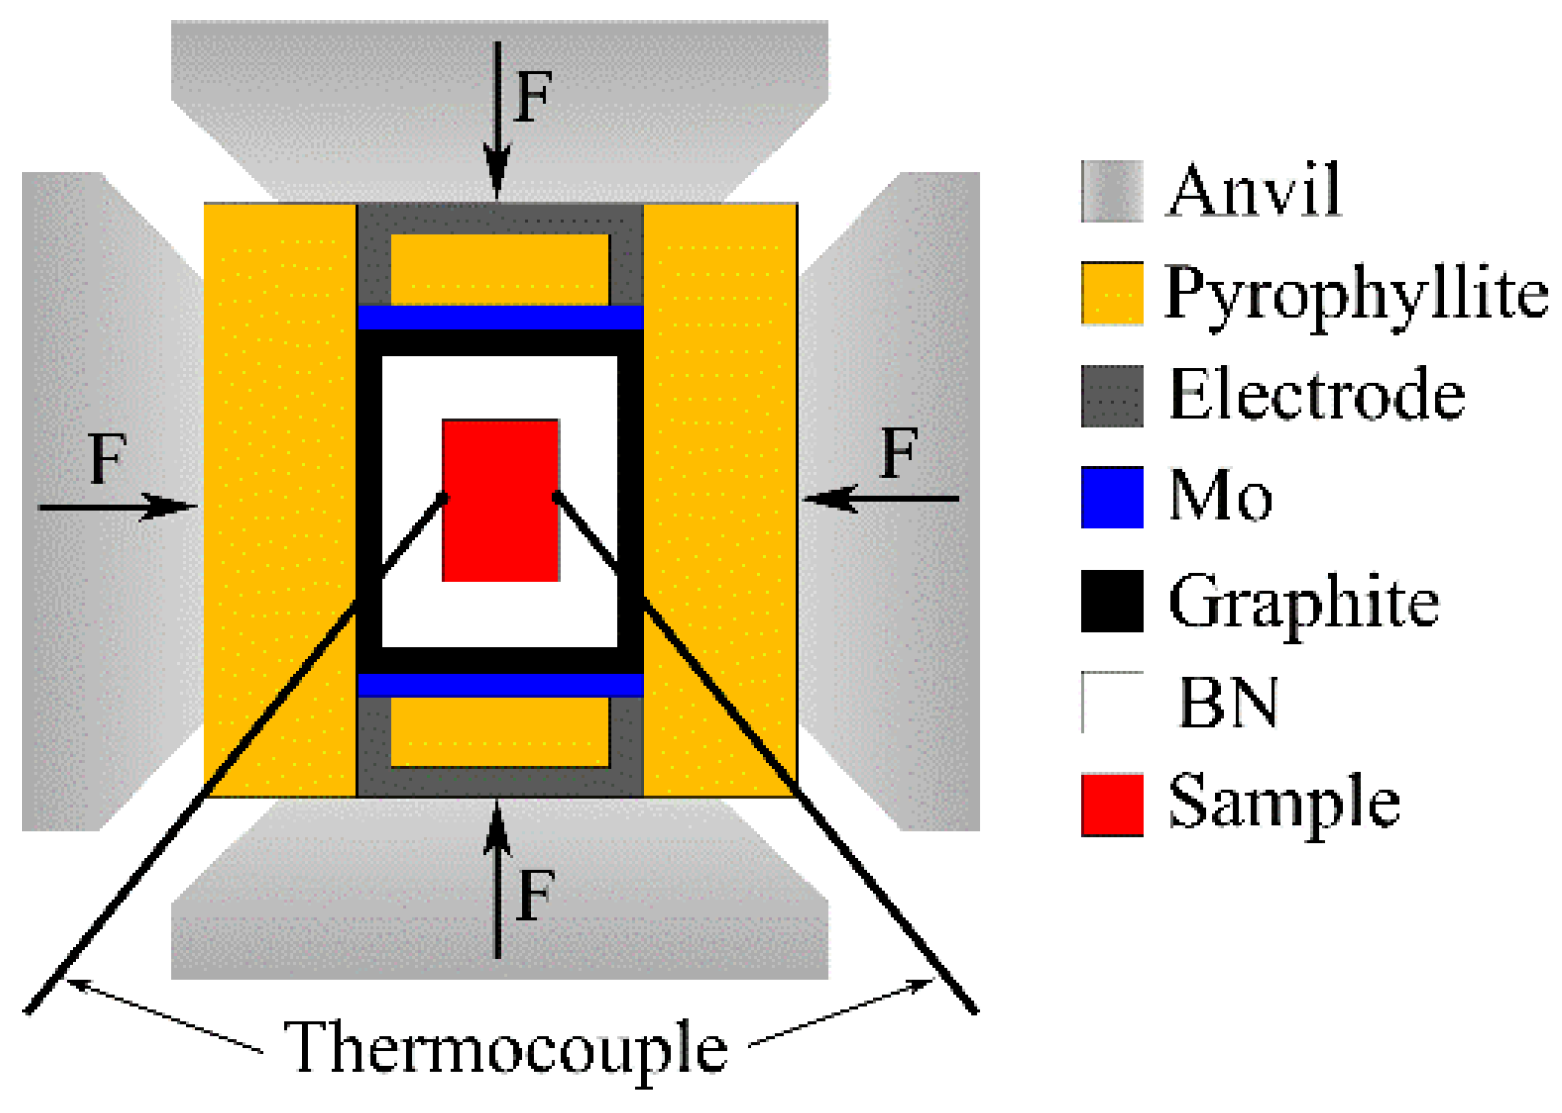
Mg-1Sn-2.5Y alloy was prepared by conventional casting from 99.9 wt% Mg, 99.9 wt% Sn, and Mg-30 wt% Y. The composition of the alloy is shown in Table 1. The samples for high-pressure solidification were cut into Φ20 × 18 mm cylinders. A six-anvil apparatus was used in the experiment, as shown in Figure 1. The experimental pressures were set as 1 GPa and 1.5 GPa. The B-type thermocouple was used to measure temperature. Different cooling rates could be obtained by changing the thickness of BN insulation layer and adjusting cooling water flow. The samples were etched with 5 vol% nitric acid solution for 10 s. Observation and analysis of the microstructure were carried out by a scanning electron microscopy (SEM, Quanta 200FEG). The analysis of the phases was carried out by X-ray diffraction (XRD, Empyrean).

Table 1.
The composition of the Mg-1Sn-2.5Y alloy.
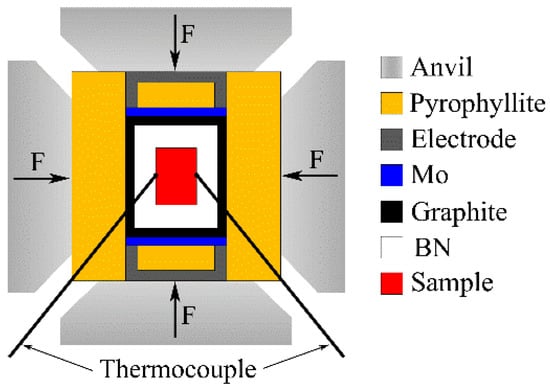
Figure 1.
Schematic diagram of the high pressure solidification experiment.
3. Results and Discussion
3.1. Microstructure Evolution of Mg-1Sn-2.5Y Alloys
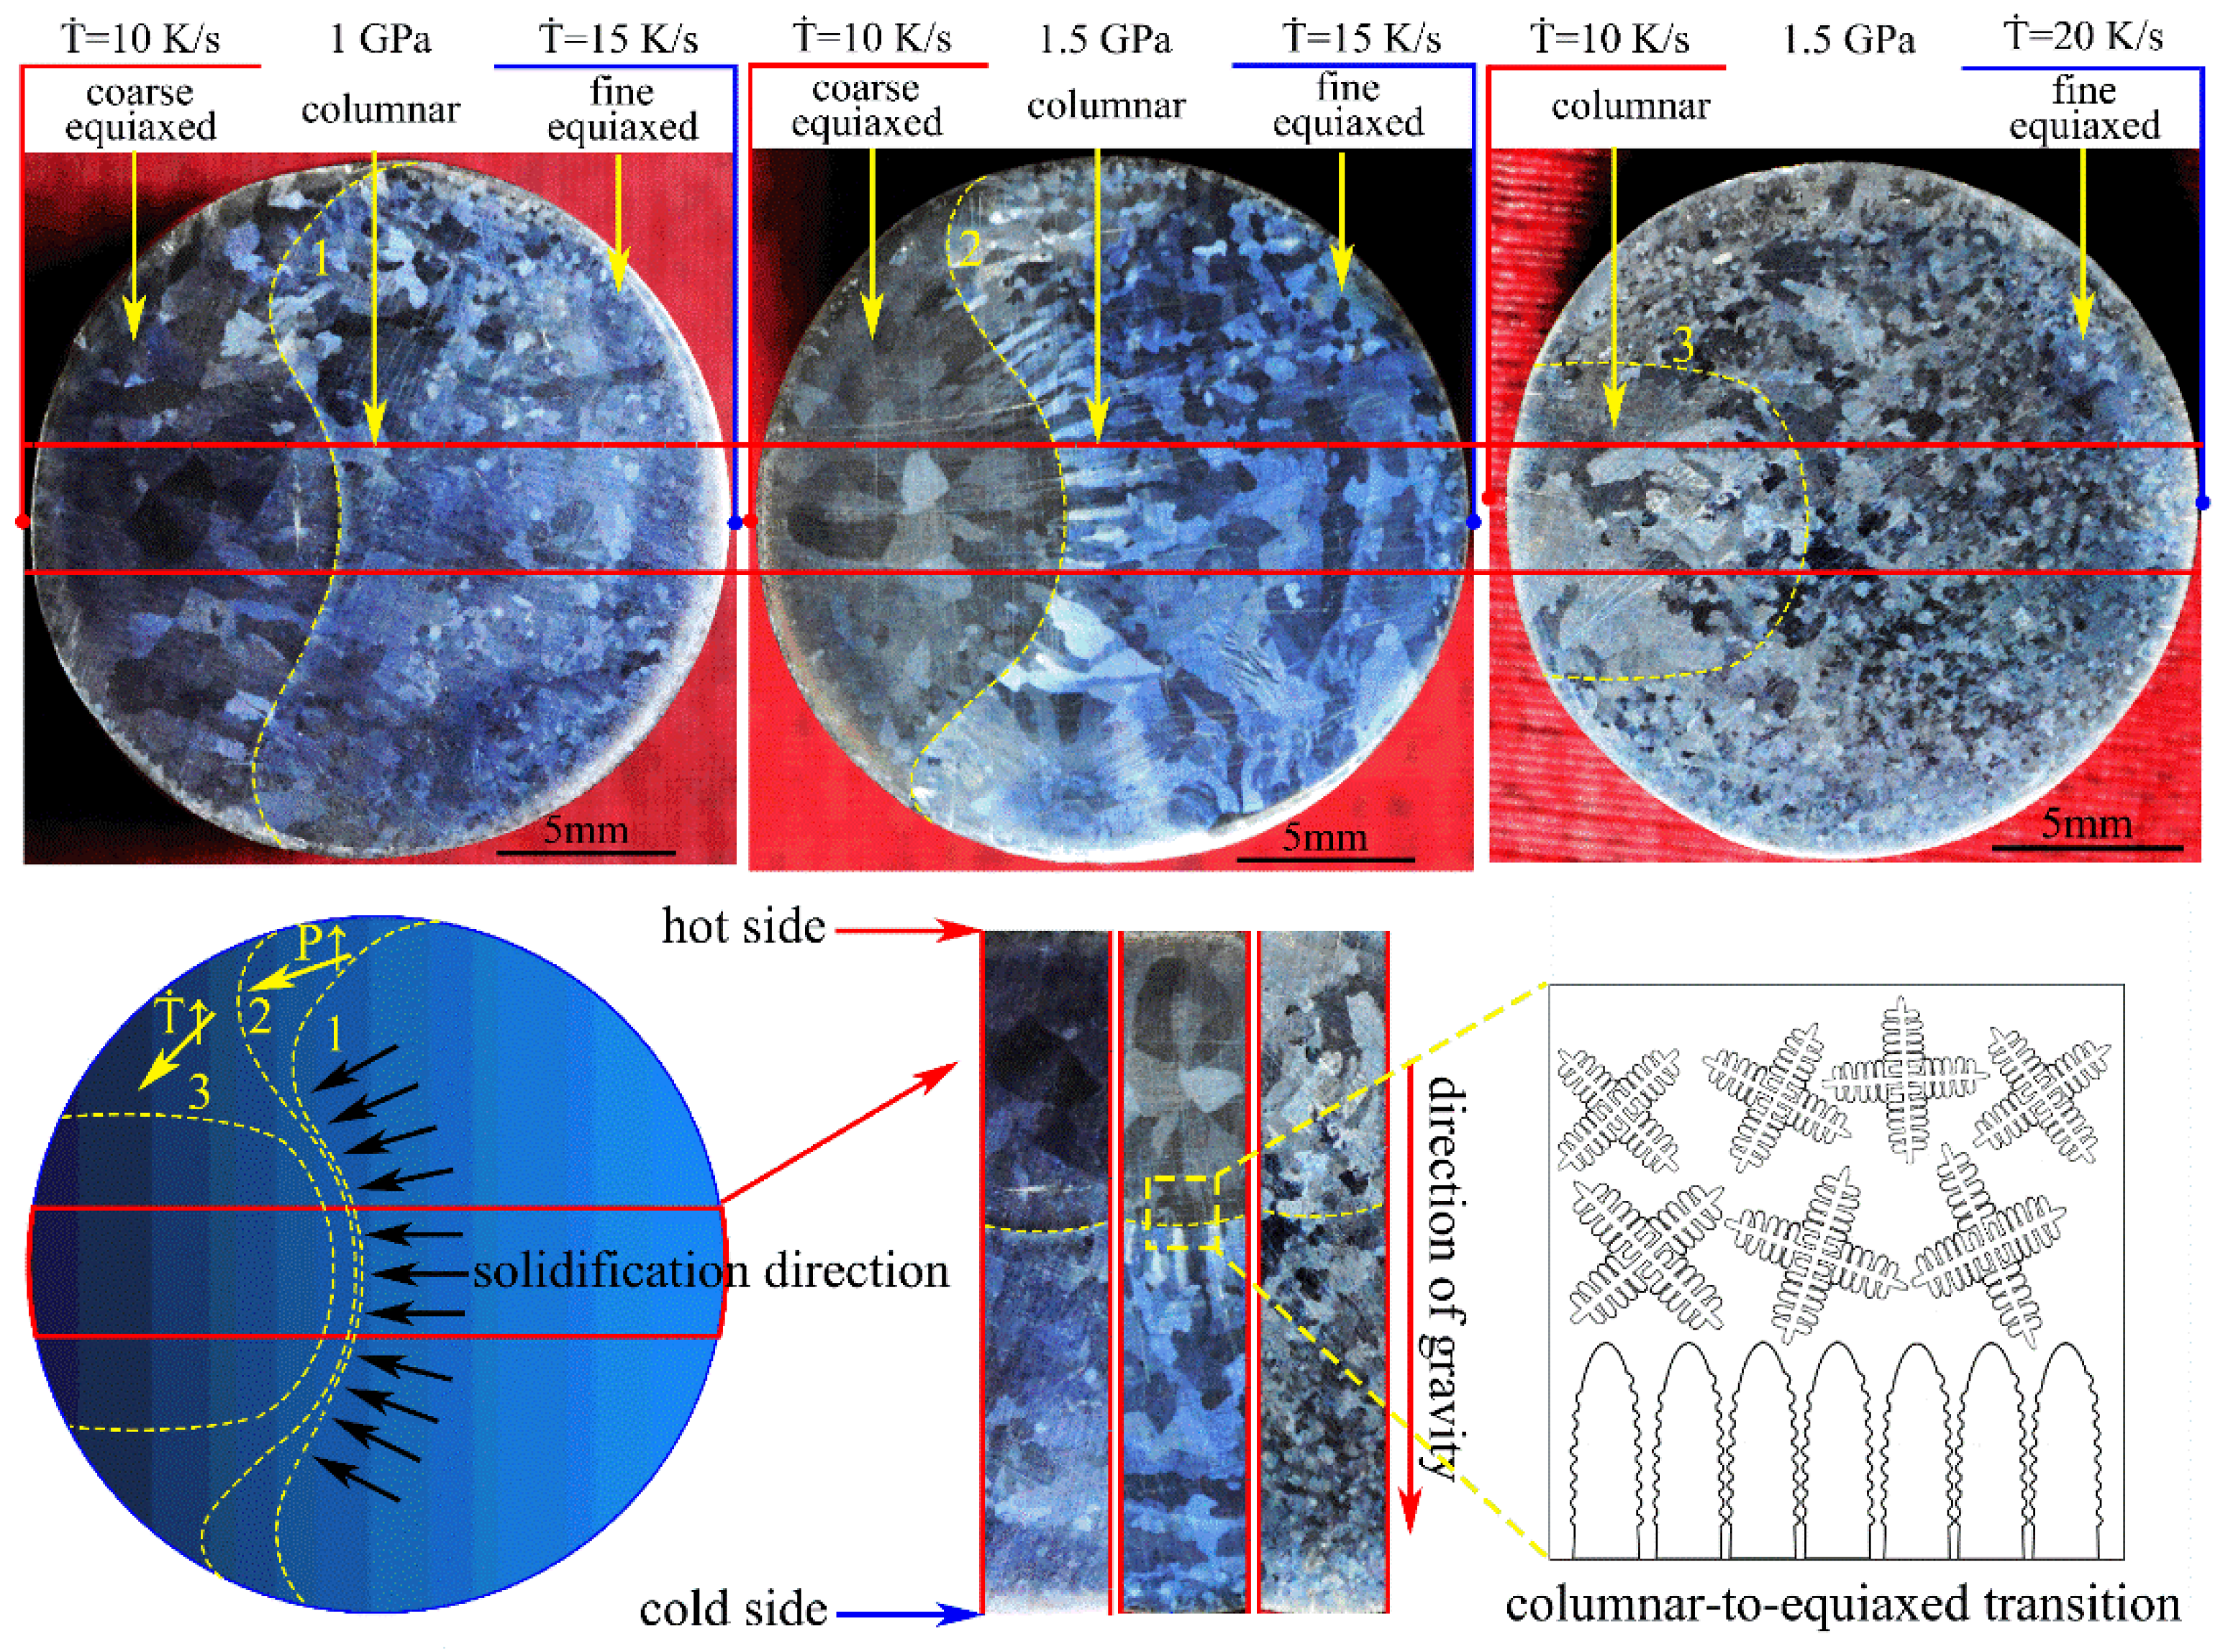
The macrostructures of the Mg-1Sn-2.5Y alloys solidified under high pressure and temperature gradient are shown in Figure 2. The alloy was solidified under high pressure and temperature gradient using the cooling rate difference in the high pressure chamber. The macrostructures consist of the outer fine equiaxed zone, the columnar zone, and the coarse equiaxed zone. The direction of heat flow in the red region is parallel to the direction of gravity according to the direction of columnar crystal. There is an obvious boundary between the columnar grains and the coarse equiaxed grains in the macrostructures of the Mg-1Sn-2.5Y alloys (marked with a yellow line 1 and 2). With an increase in solidification pressure, line 1 moved to line 2 and the columnar-to-equiaxed transition was inhibited in Mg-1Sn-2.5Y alloy. The inhibition of column-to-equiaxial transition by increasing pressure leads to the increase in interface stability, which is consistent with our previous research conclusions [11]. With an increase in cooling rate, line 2 moved to line 3, the area of the outer fine equiaxed zone increased, and the coarse equiaxed zone disappeared. The variation of line 1, 2, and 3 with pressures and cooling rates has obvious regularity, which indicates that this method of high-pressure solidification in a temperature gradient is reproducible.
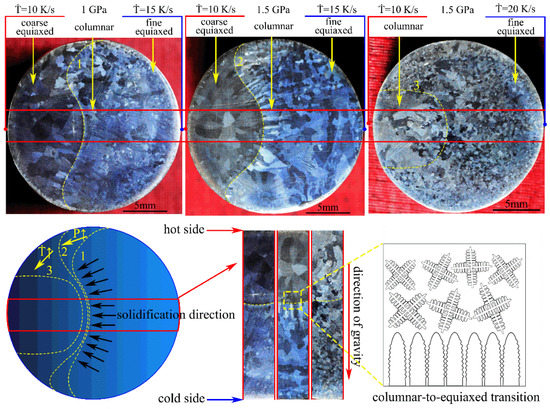
Figure 2.
Macrostructures of the Mg-1Sn-2.5Y alloys solidified under high pressure and temperature gradient.
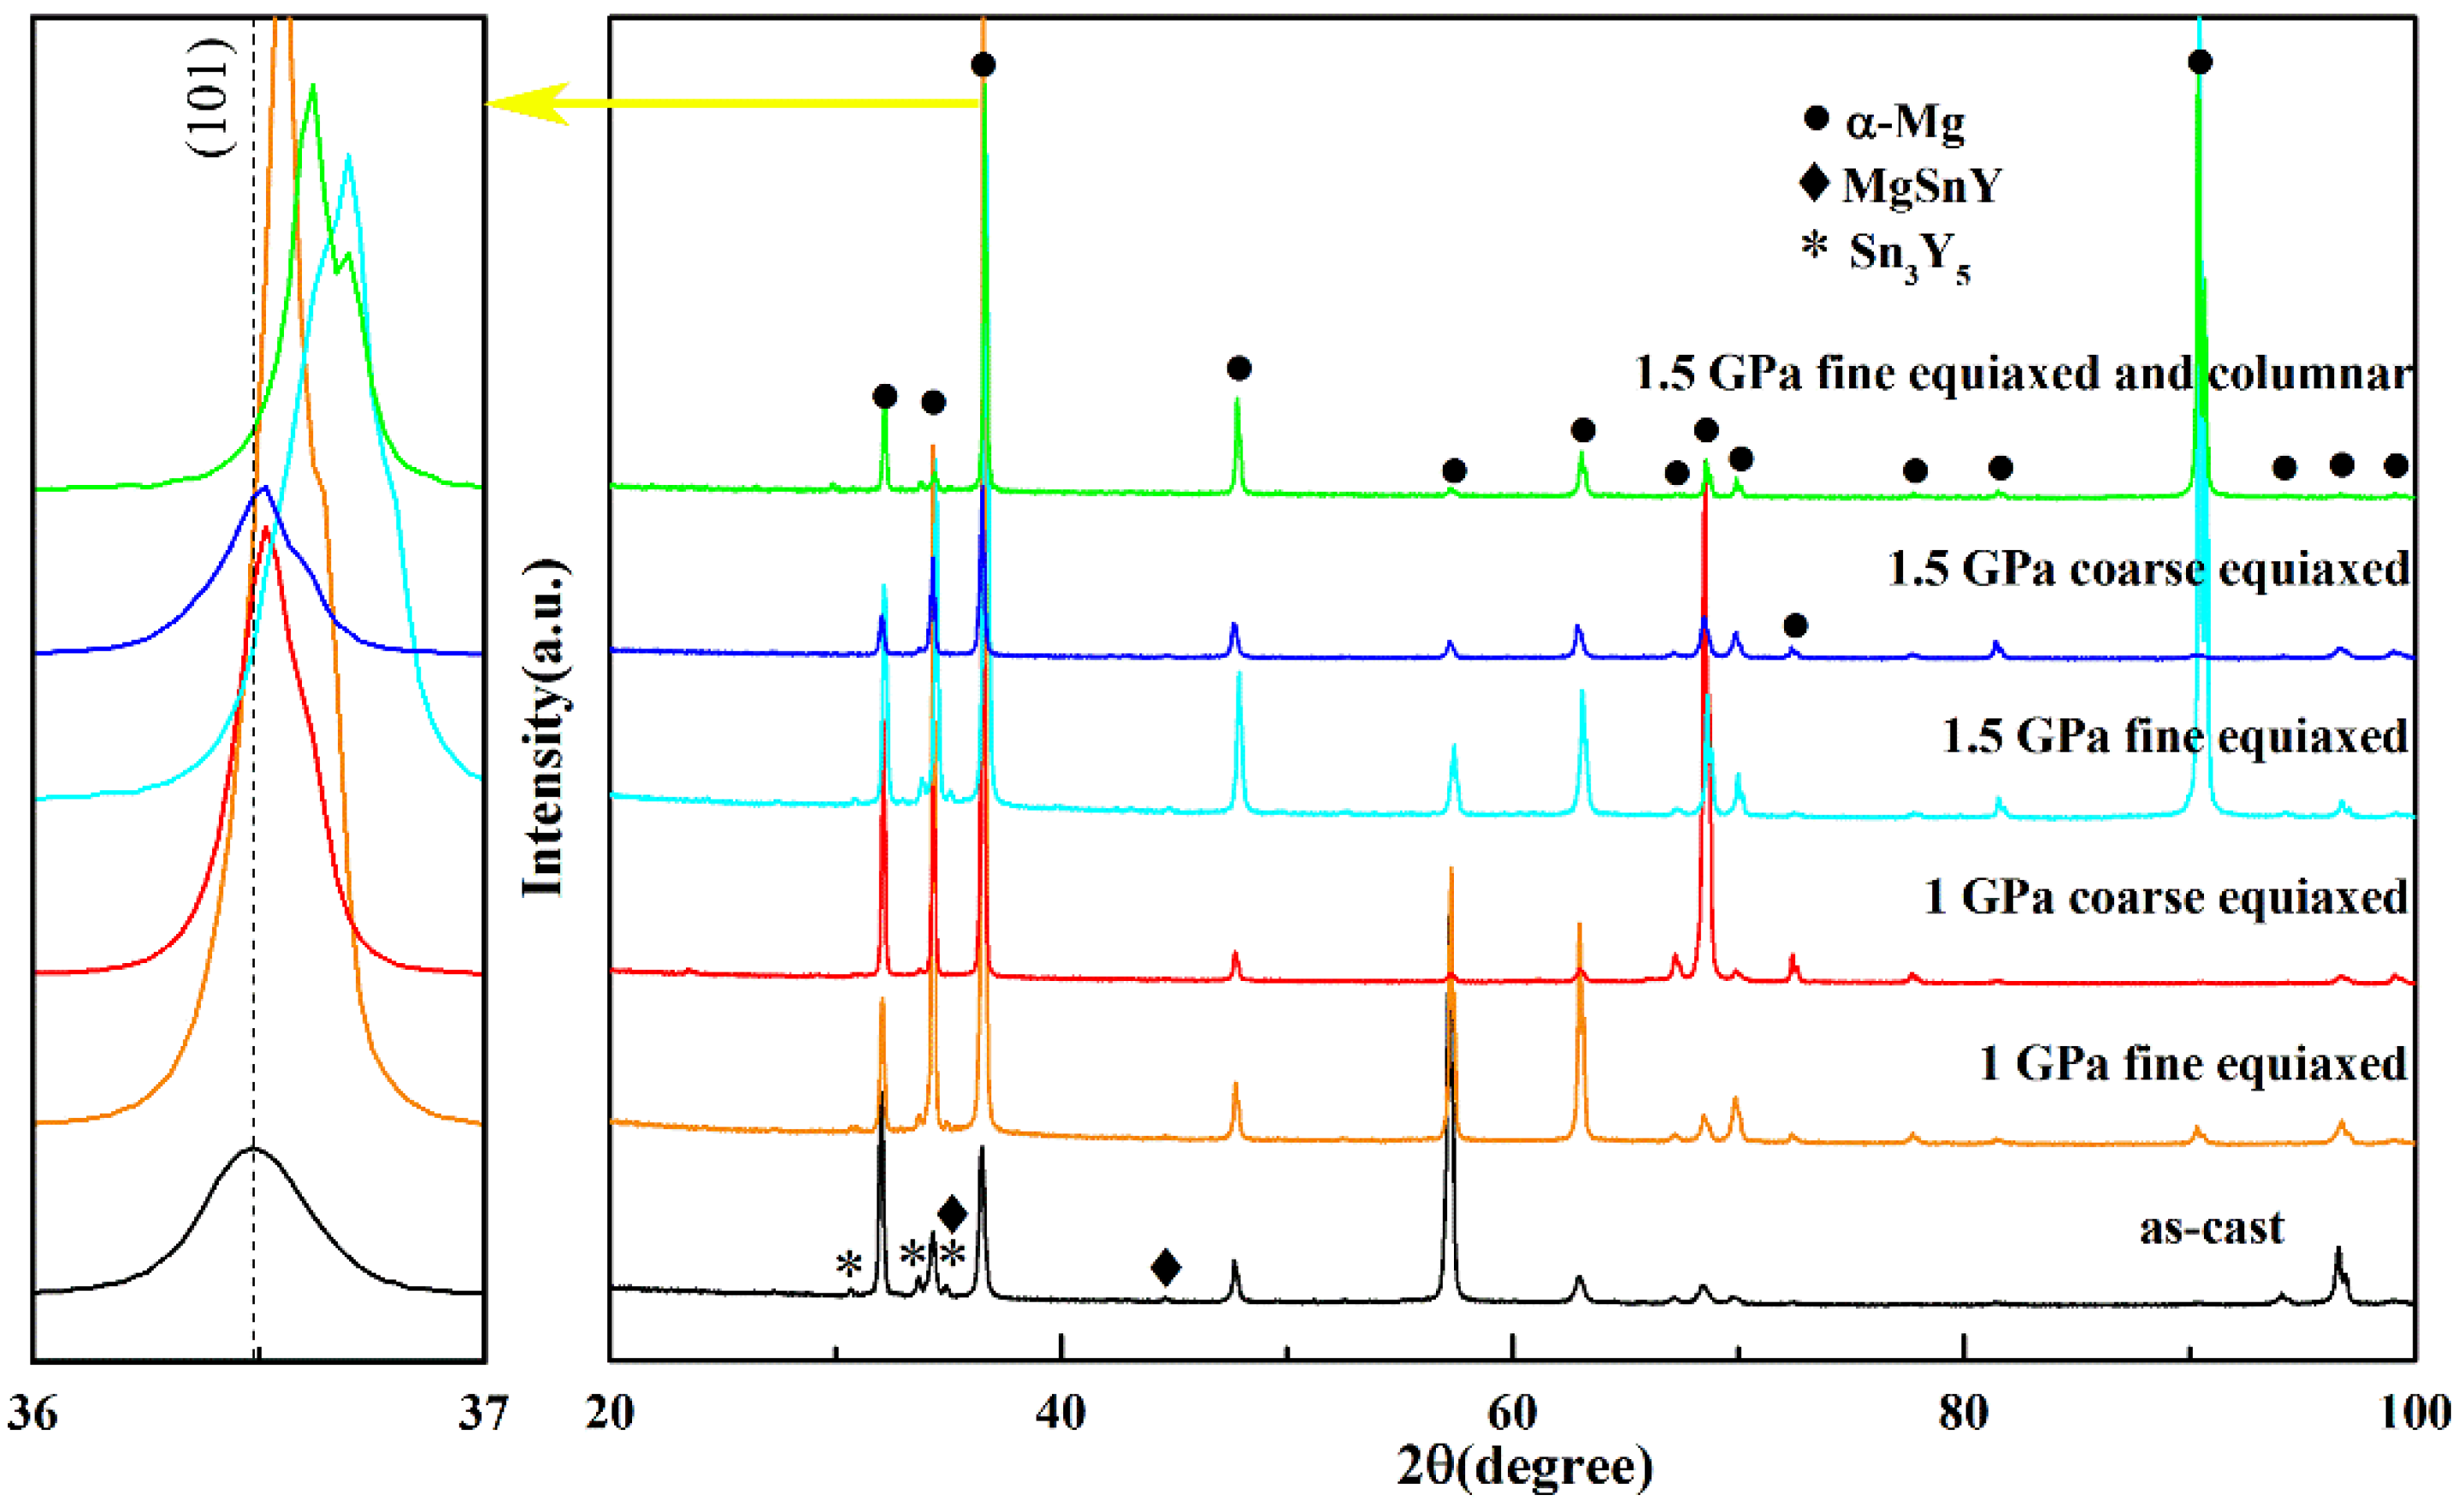
Figure 3 shows the XRD spectra of the Mg-1Sn-2.5Y alloys solidified under different cooling rates and pressures. The diffraction peaks of Mg, MgSnY, and Sn3Y5 phases can be seen for the Mg-1Sn-2.5Y alloys prepared under different pressures and cooling rates. In the outer fine equiaxed zone and the columnar zone, the diffraction peak of (101) plane of the Mg matrix shifted to higher angles with increasing solidification pressure, but barely shifted in the coarse equiaxed zone. From the Bragg equation, it follows that a decrease in the interplanar distance leads to an increase in the diffraction angle. As changes in solute content cause changes in interplanar distance [22,23], changes in solute content cause changes in diffraction angle. The atomic radii of Mg, Sn, and Y are 1.599 Å, 1.405 Å, and 1.803 Å, respectively. Therefore, in the outer fine equiaxed zone and the columnar zone, the solubility of Sn in the α-Mg matrix increased with increasing solidification pressure, resulting in an increase in the diffraction angle of the α-Mg matrix. It is worth noting that the green XRD spectrum has two diffraction peaks corresponding to the (101) plane of the α-Mg matrix, which is because the solubility of Sn is different in the fine equiaxed zone and the columnar zone. The difference in cooling rates leads to the growth velocities of grains, resulting in the difference in solubilities of Sn.
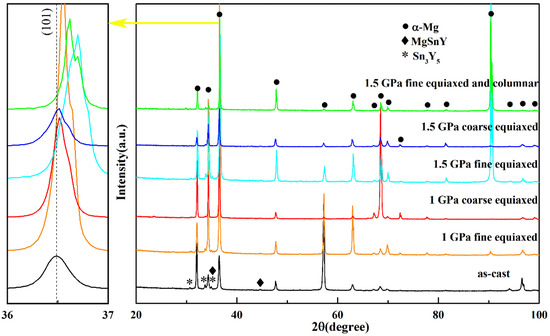
Figure 3.
XRD spectra of the Mg-1Sn-2.5Y alloys solidified under high pressures.
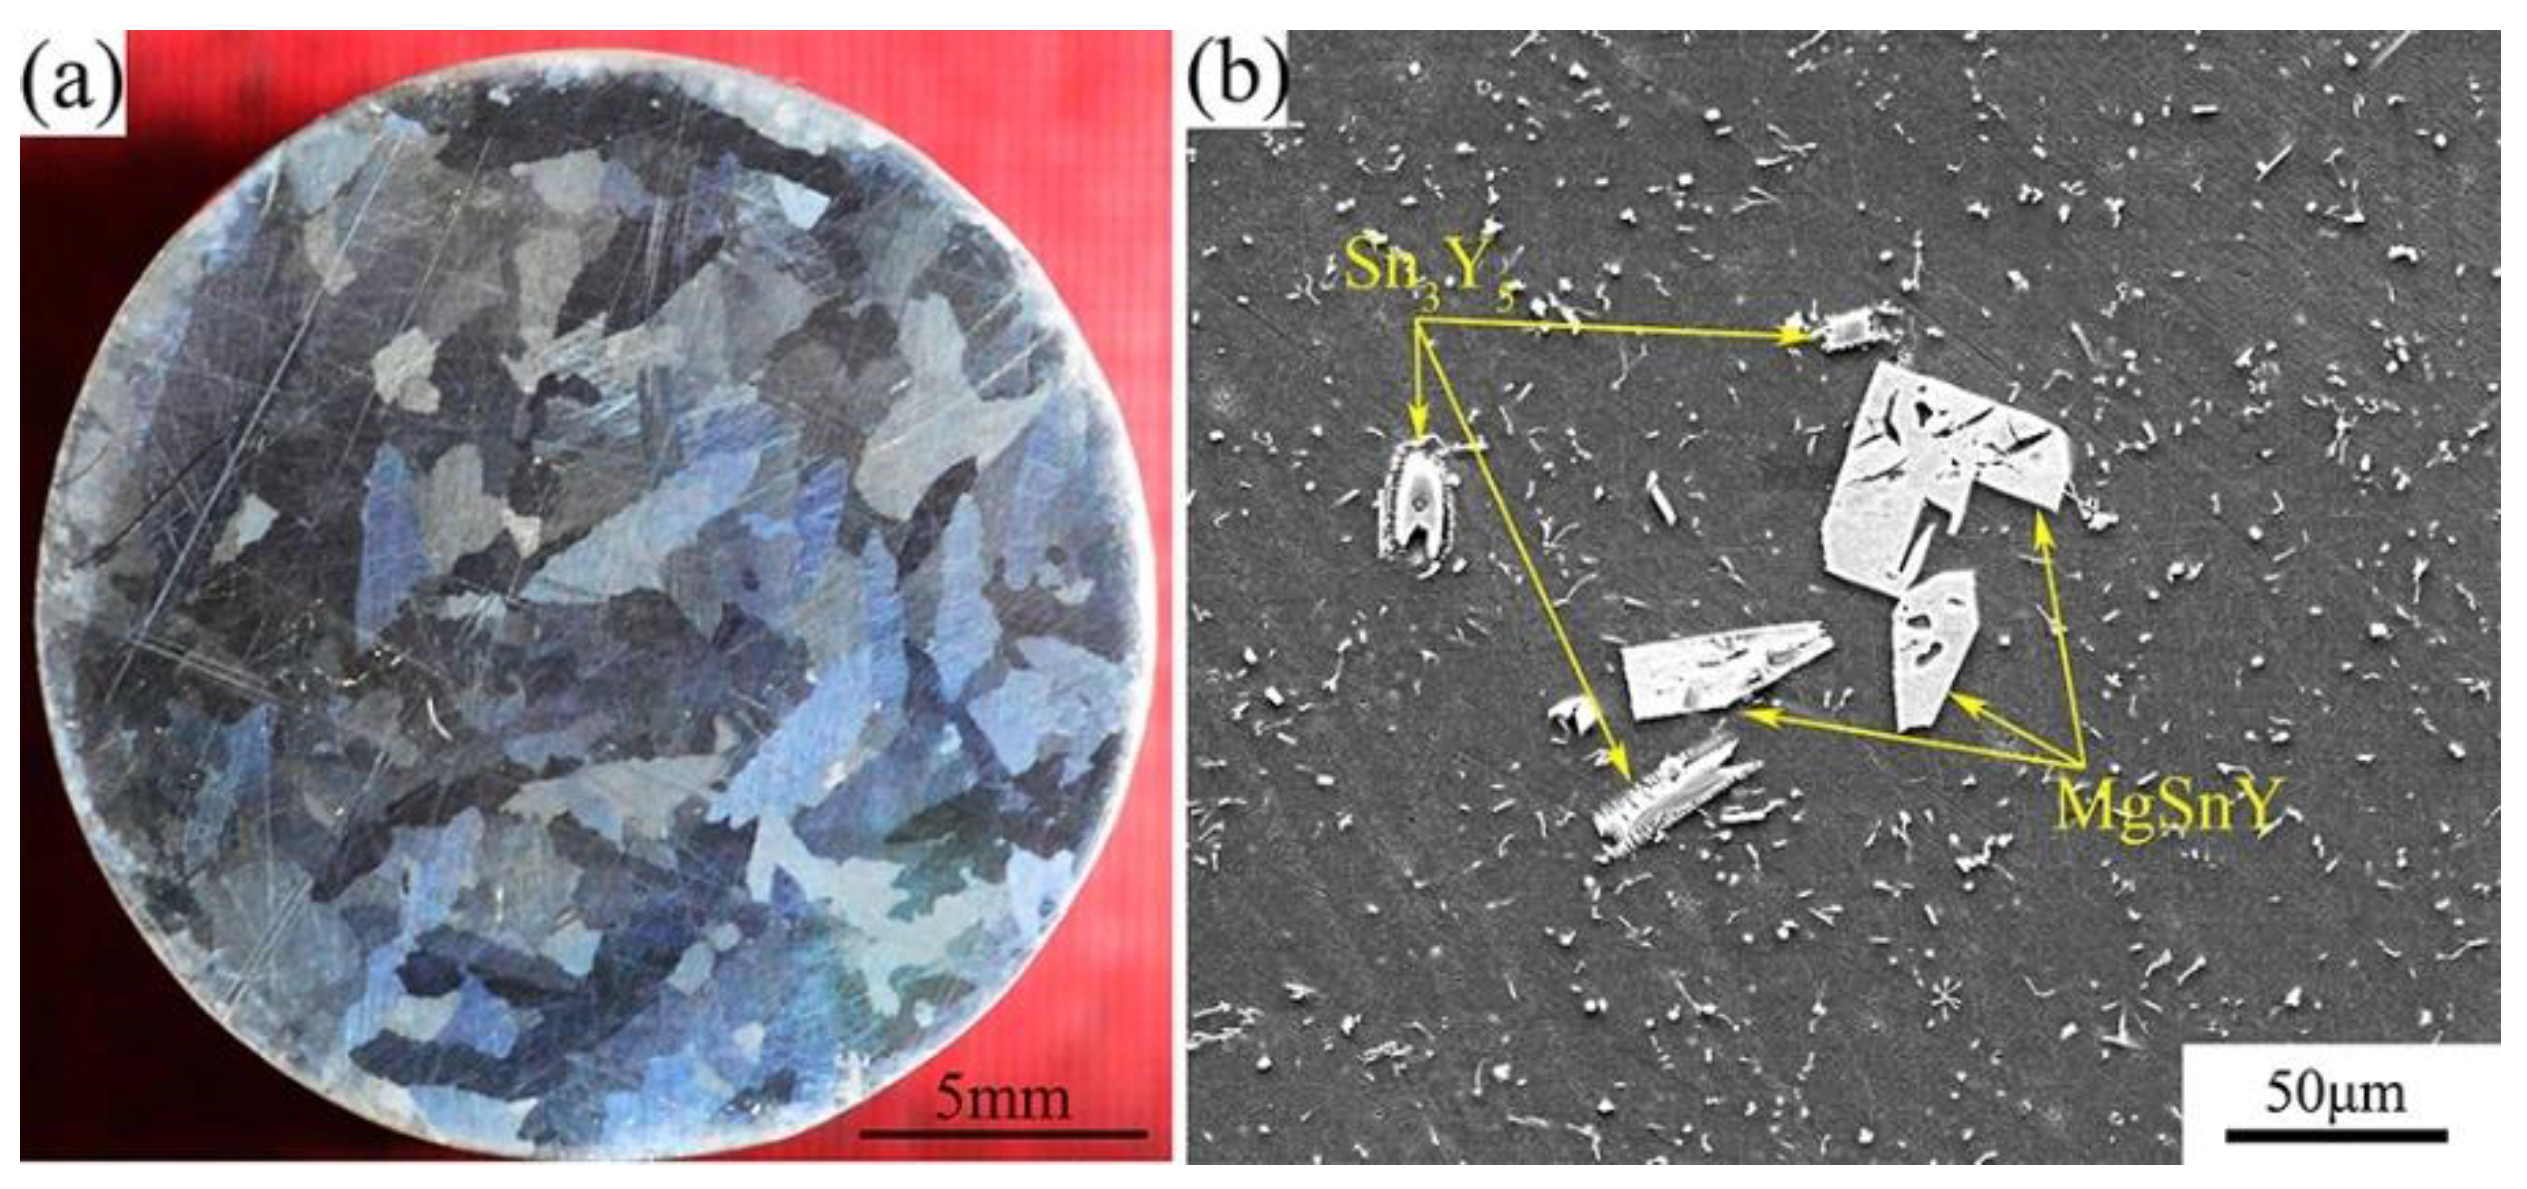
The macrostructure and microstructure of the Mg-1Sn-2.5Y alloy solidified under 1 atm are shown in Figure 4. The grains of the as-cast alloy are the coarse columnar, which are significantly different from those solidified under high pressure and temperature gradient (Figure 4a). The distribution of second phases is homogeneous on the α-Mg matrix, except for some coarse Sn3Y5 and MgSnY phases (Figure 4b).

Figure 4.
(a) Macrostructure and (b) microstructure of the Mg-1Sn-2.5Y alloy solidified under 1 atm.
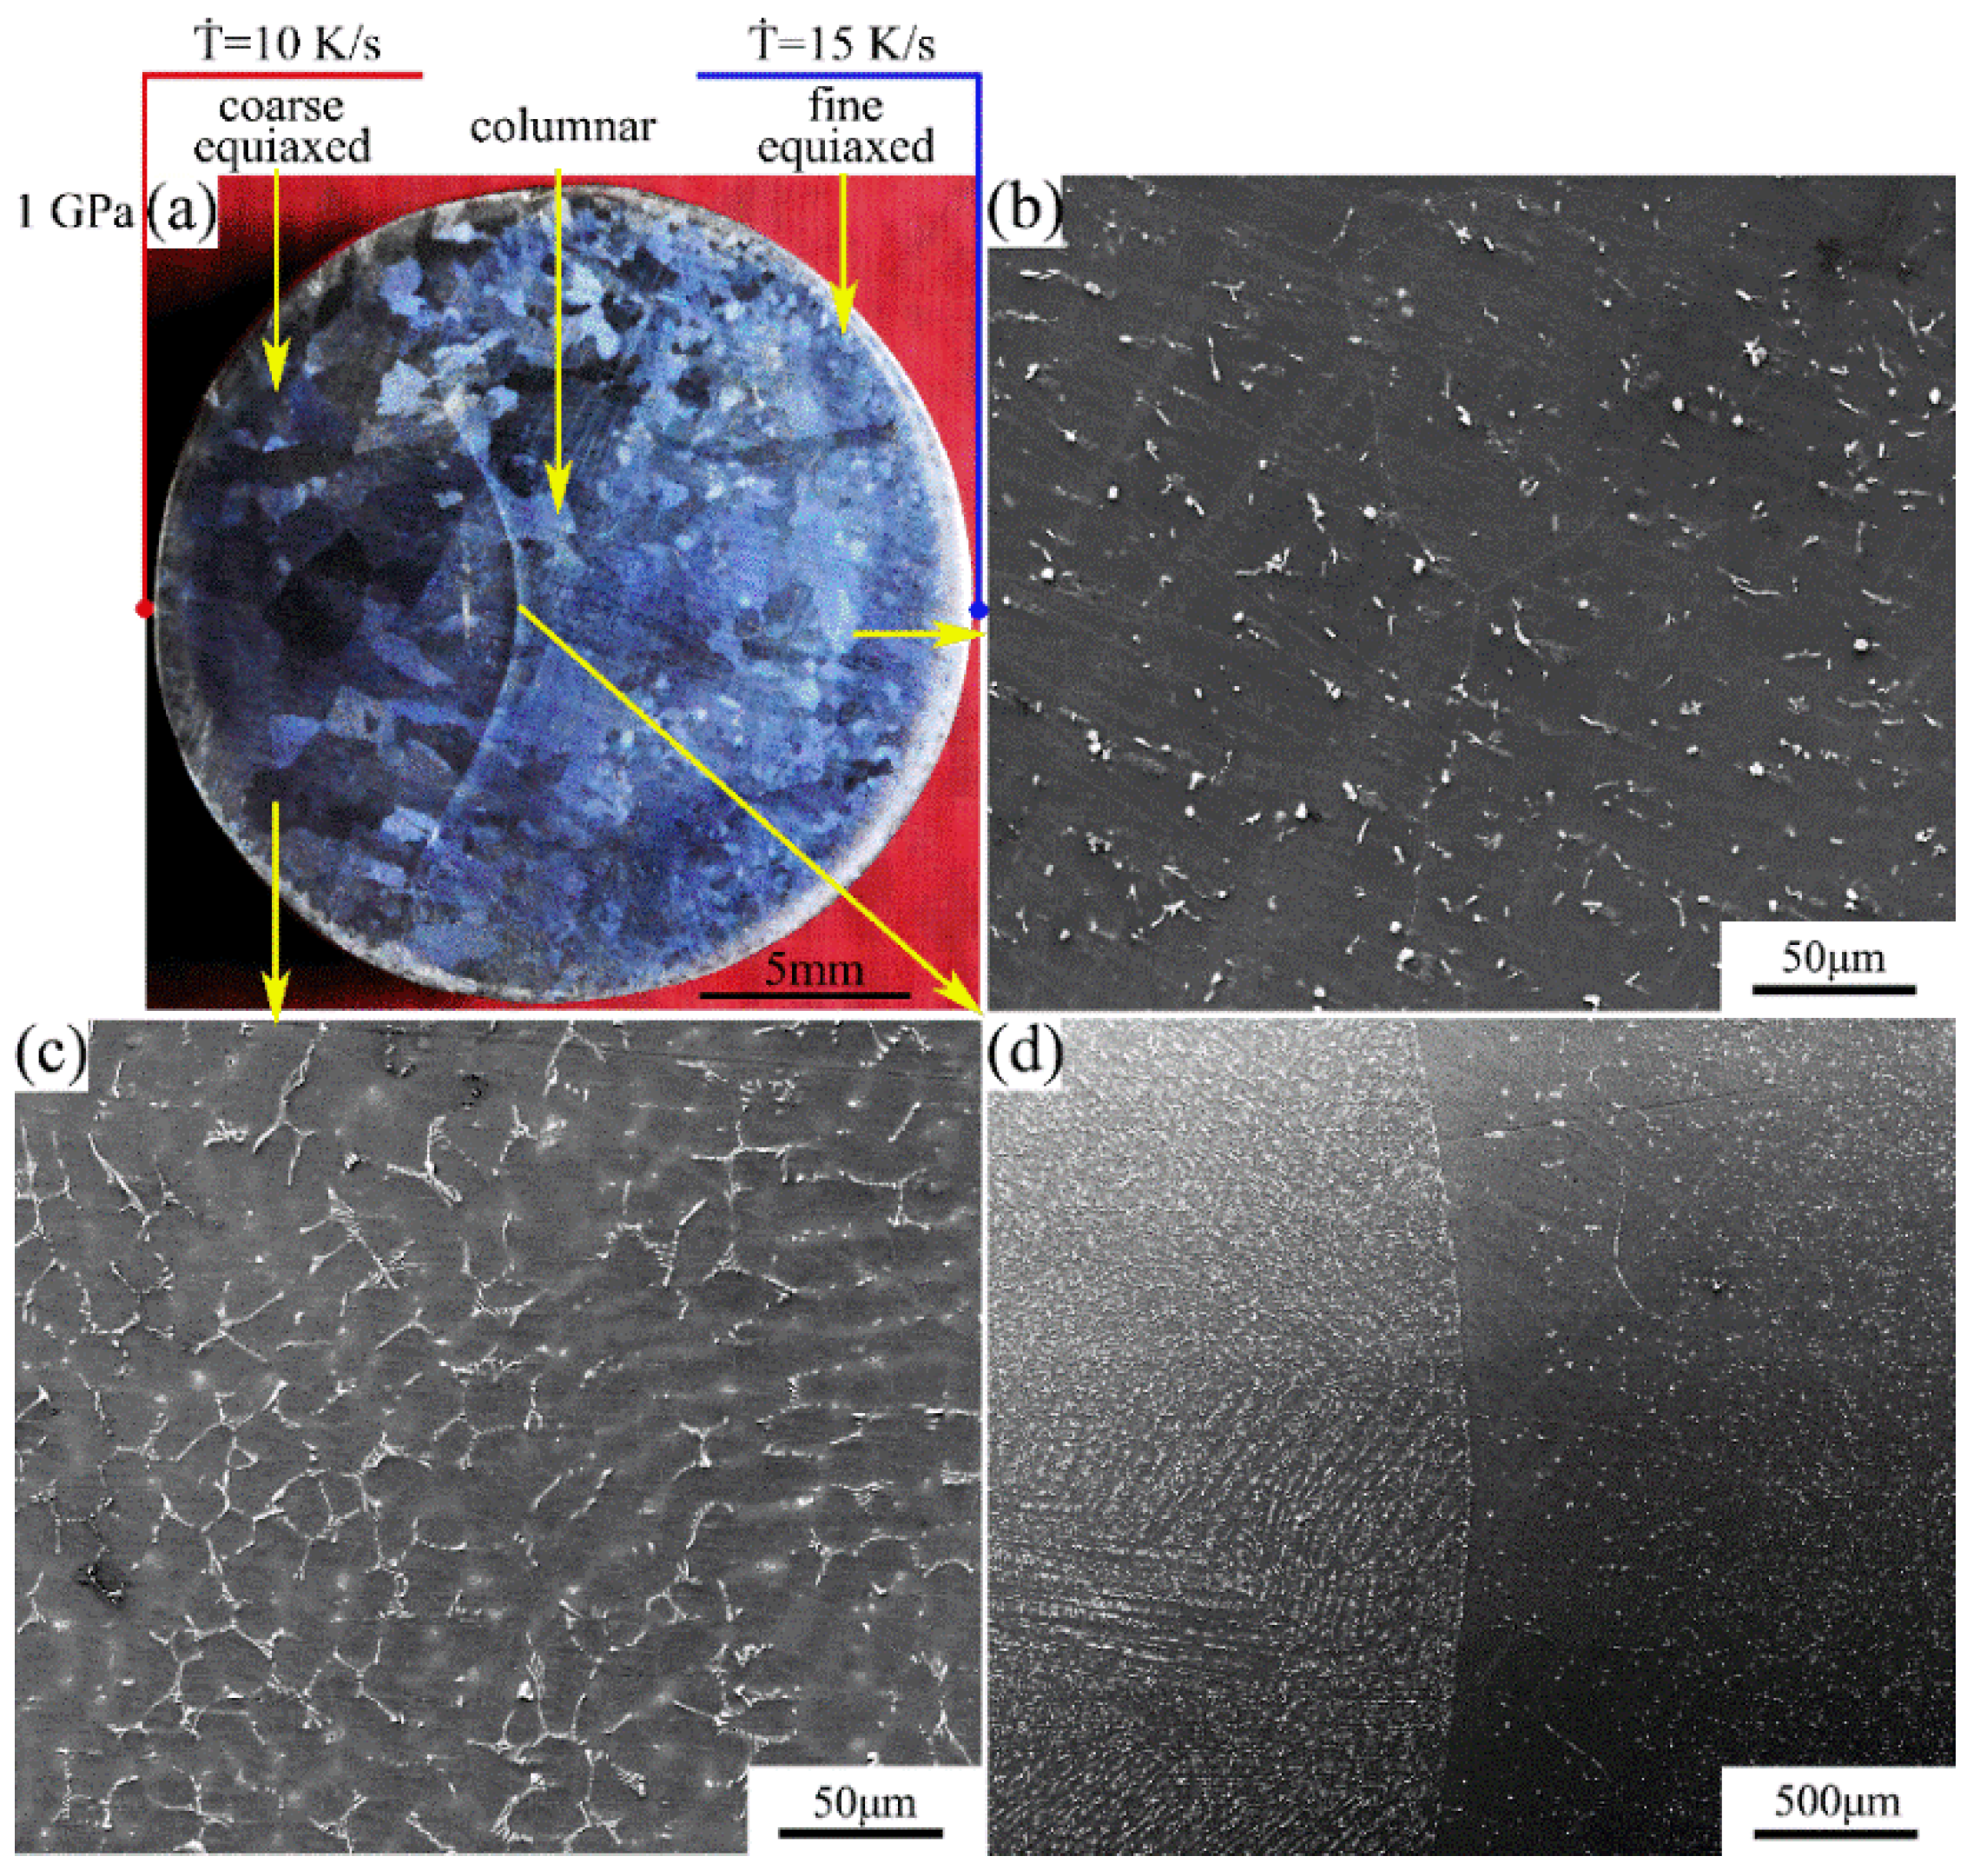
The macrostructure and microstructure of the Mg-1Sn-2.5Y alloy solidified at a cooling rate of 10–15 K/s under a pressure of 1 GPa are shown in Figure 5. The macrostructure consists of the outer fine equiaxed zone, the columnar zone, and the coarse equiaxed zone. With the increase in cooling rate, the average grain size decreases (Figure 5a). The second phases are uniformly distributed in the outer fine equiaxed zone and the columnar zone, and the coarse Sn3Y5 and MgSnY phases disappear (Figure 5b,d). This also indicates that the solubility of Sn in the α-Mg matrix increases. The microsegregation occurs in the coarse equiaxed zone, and solute is concentrated in the interdendritic regions. The average secondary dendrite arm spacing is 14–17 μm. Many precipitates in the microsegregation region weaken the specular reflection and enhance the diffuse reflection, making the microsegregation region in the macrograph darker (Figure 5a,c).
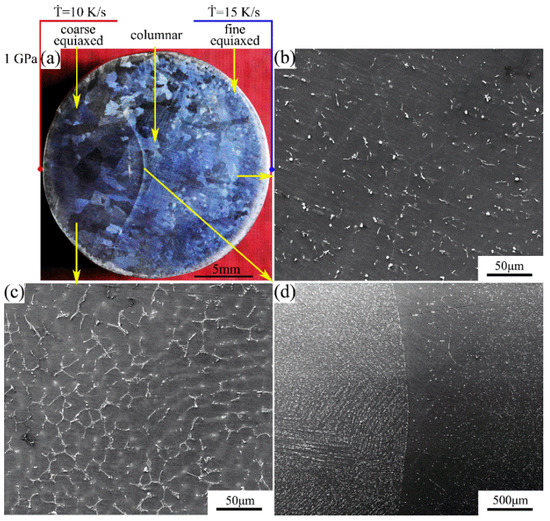
Figure 5.
(a) Macrostructure and (b–d) microstructure of the Mg-1Sn-2.5Y alloy solidified under a pressure of 1 GPa: (b) outer fine equiaxed zone; (c) coarse equiaxed zone; (d) columnar-to-equiaxed transition zone.
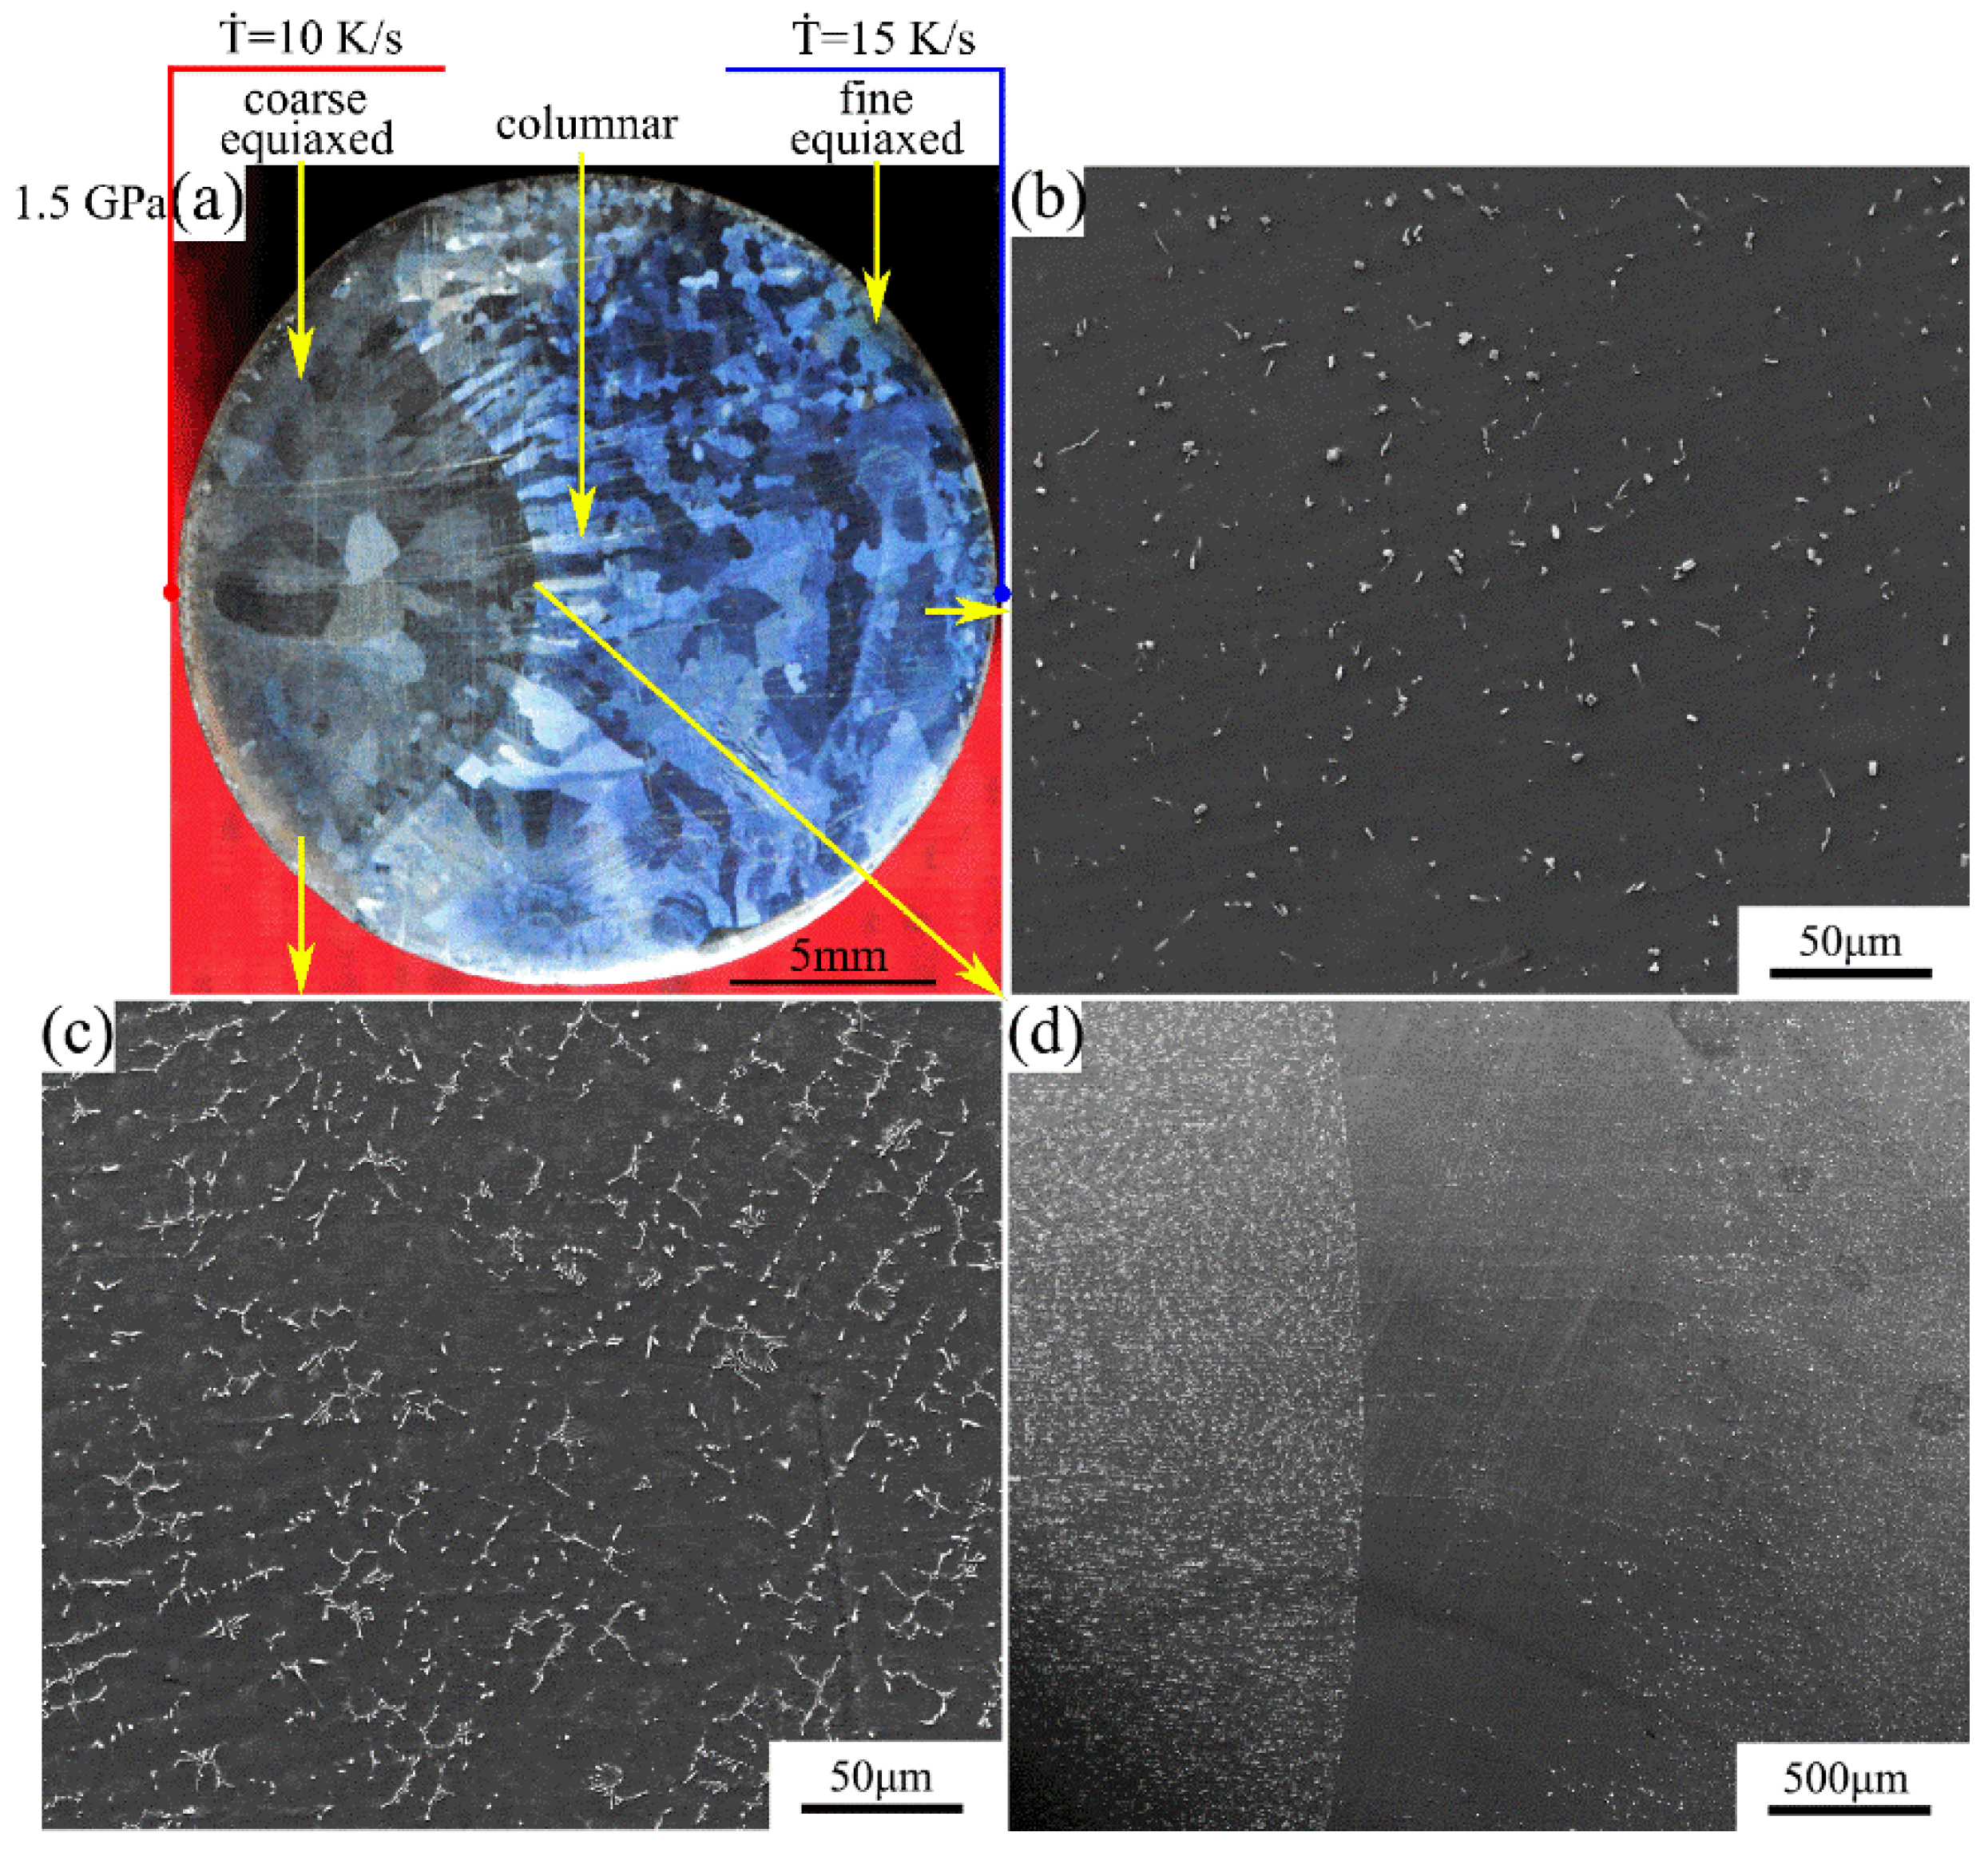
The macrostructure and microstructure of the Mg-1Sn-2.5Y alloy solidified at cooling rate of 10–15 K/s under a pressure of 1.5 GPa are shown in Figure 6. As shown in Figure 6a, the macrostructure of the sample is similar to that in Figure 5a. The average secondary dendrite arm spacing is 9–11 μm (Figure 6c). There are obvious columnar crystals perpendicular to the boundary in the columnar-to-equiaxed transition zone. In the outer fine equiaxed zone and the columnar zone, the distribution of second phases is homogeneous on the α-Mg matrix, and the coarse Sn3Y5 and MgSnY phases disappear (Figure 6b,d).

Figure 6.
(a) Macrostructure and (b–d) microstructure of the Mg-1Sn-2.5Y alloy solidified under a pressure of 1.5 GPa: (b) outer fine equiaxed zone; (c) coarse equiaxed zone; (d) columnar-to-equiaxed transition zone.
Comparing Figure 5a with Figure 6a, at the same cooling rate, one can see that the average grain size and the area of the coarse equiaxed zone decreased with increasing solidification pressure. Comparing Figure 5b with Figure 6b, with increasing solidification pressure, the amount of the second phases decreased and the solubility of Sn in the Mg matrix increased, leading to the increase in the diffraction angle of the α-Mg matrix in Figure 3. Comparing Figure 4b with Figure 5c and Figure 6c, the diffraction peak of the α-Mg matrix in the coarse equiaxed zone barely shifted in Figure 3, which can be attributed to an increase in the number of precipitated phases and a decrease in the solubility of Sn in the α-Mg matrix.
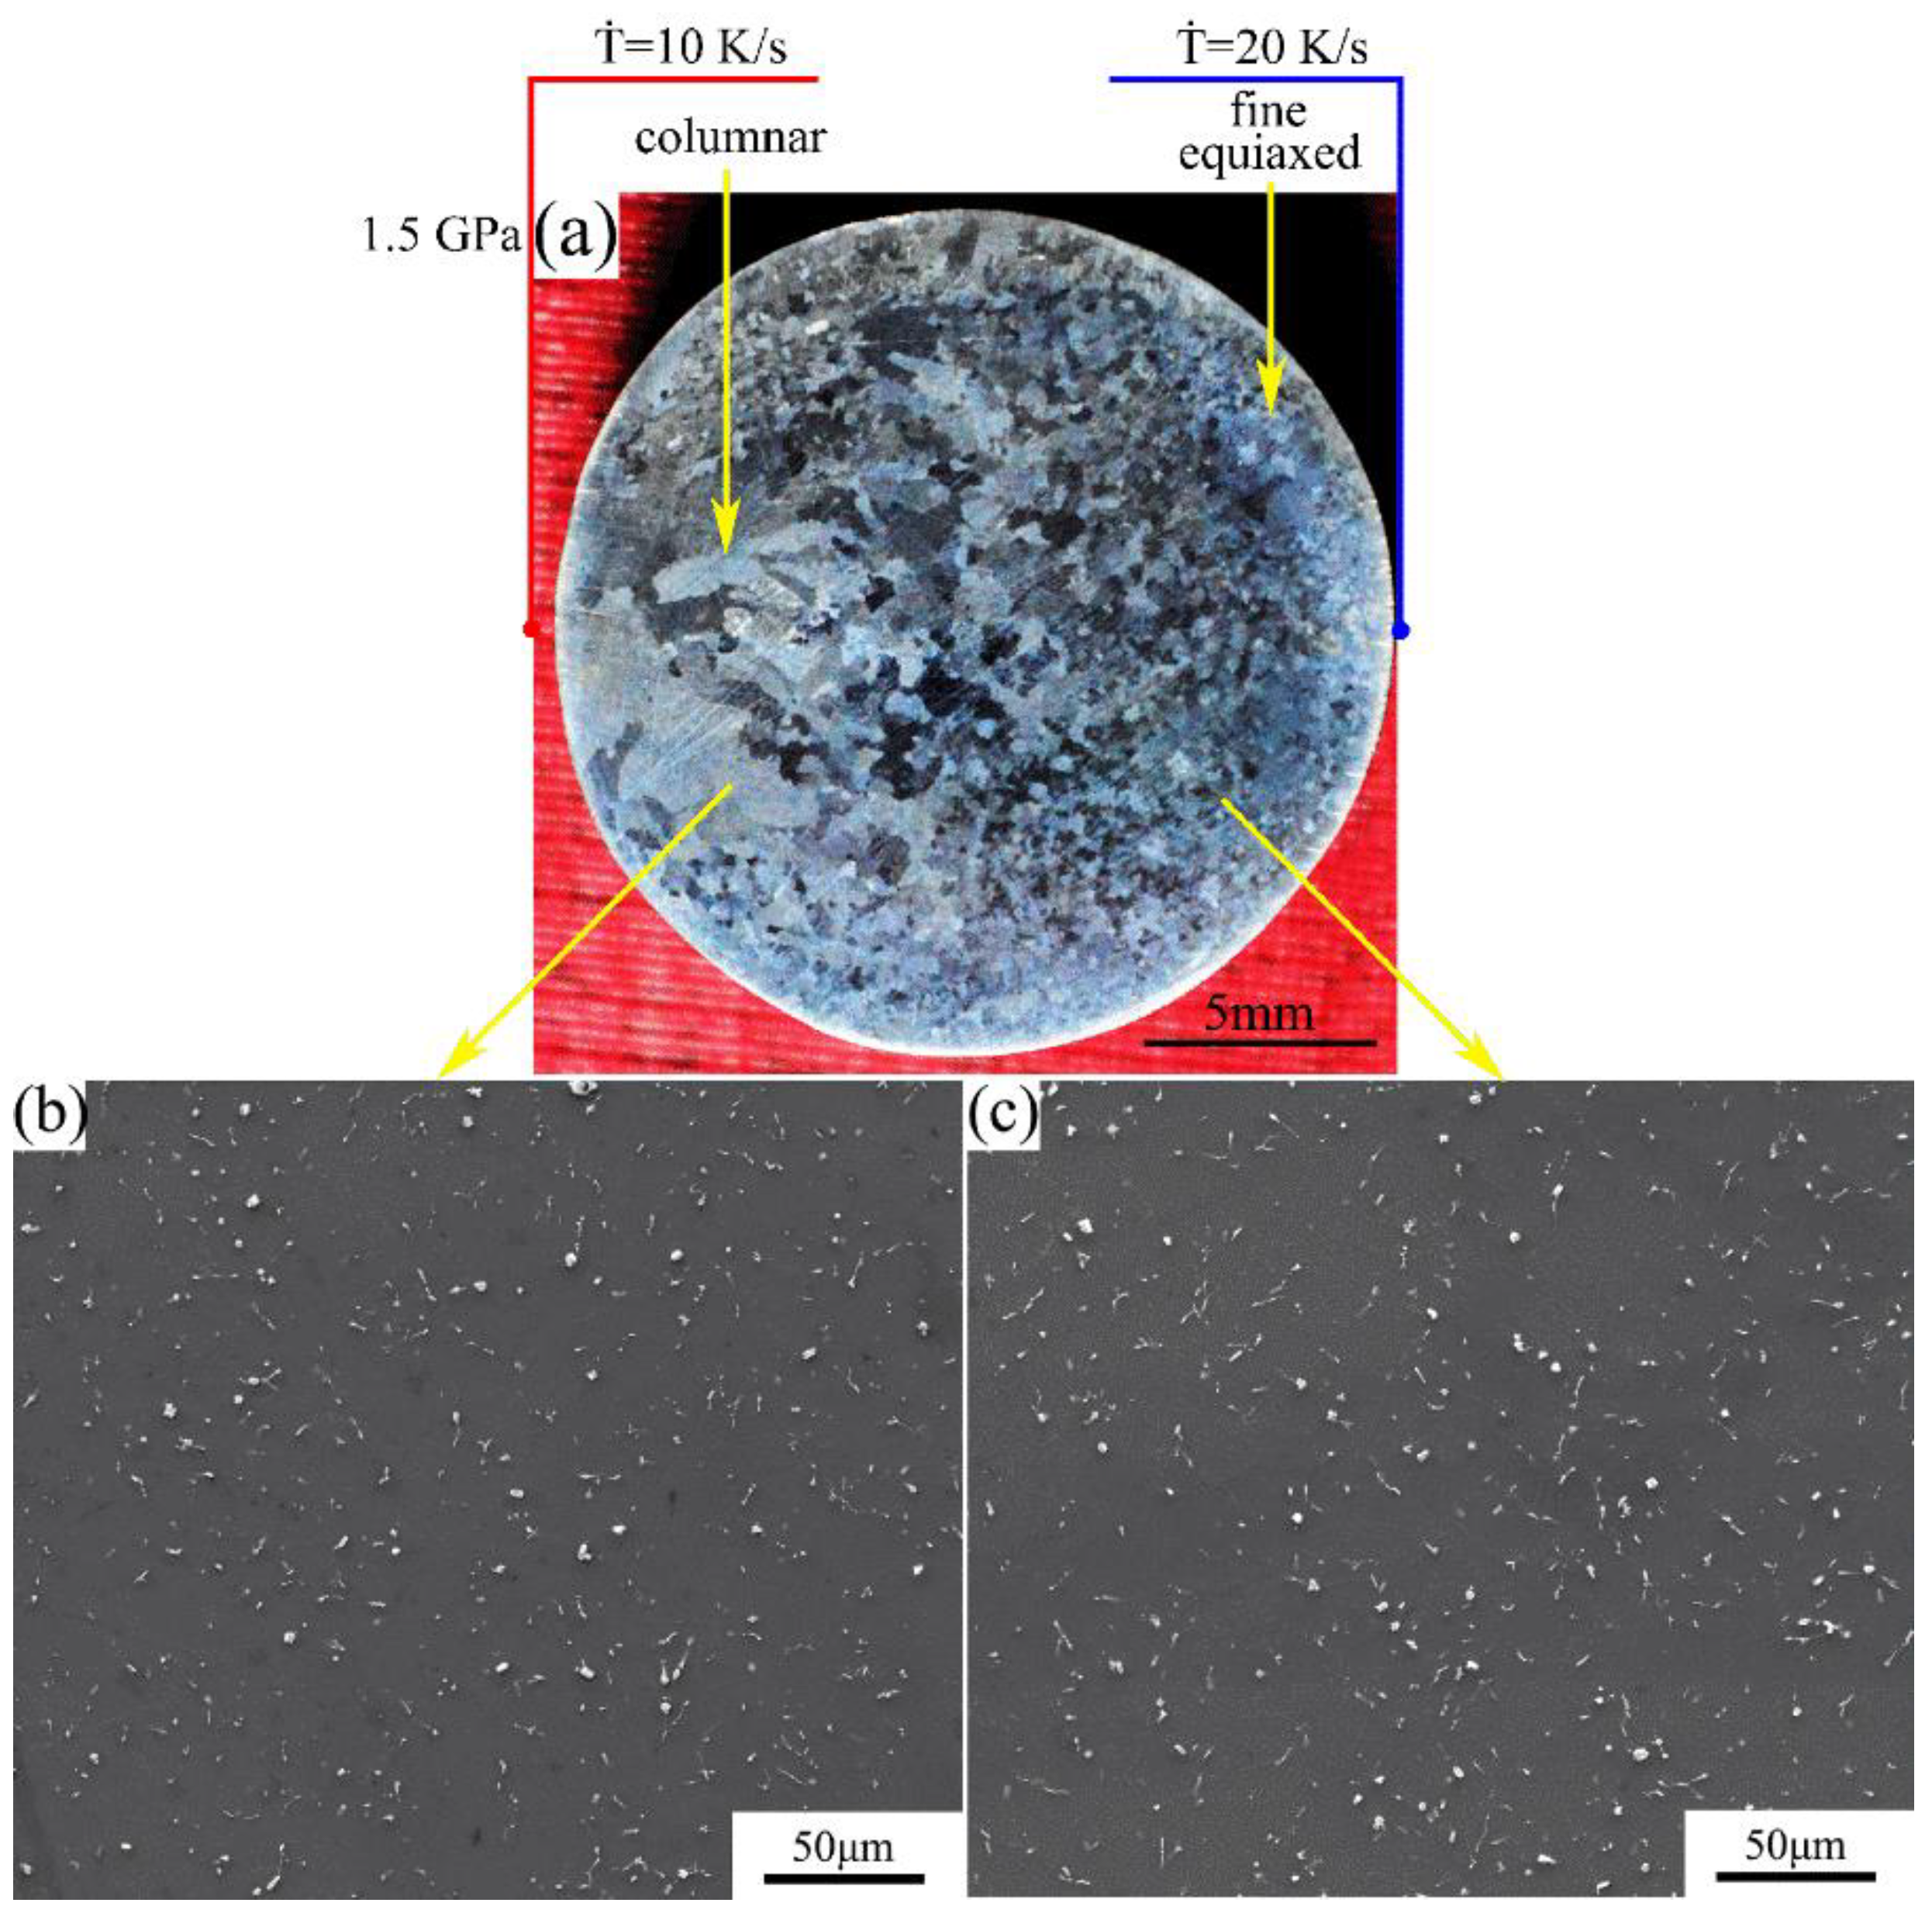
The macrostructure and microstructure of the Mg-1Sn-2.5Y alloy solidified at cooling rate of 10–20 K/s under a pressure of 1.5 GPa are shown in Figure 7. The macrostructure consists of the outer fine equiaxed zone and the columnar zone. With an increase in the cooling rate, the columnar-to-equiaxed transition was inhibited and the average grain size decreases (Figure 7a). In the outer fine equiaxed zone and the columnar zone, the distribution of second phases is homogeneous on the α-Mg matrix, and the coarse Sn3Y5 and MgSnY phases disappear (Figure 7b,c).
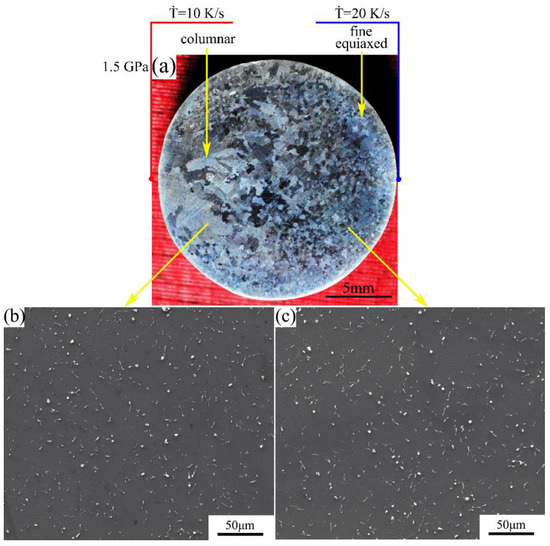
Figure 7.
(a) Macrostructure and (b,c) microstructure of the Mg-1Sn-2.5Y alloy solidified under a pressure of 1.5 GPa: (b) columnar zone; (c) outer fine equiaxed zone.
Comparing Figure 6 with Figure 7, under 1.5 GPa, the average grain size decreased and the area of the outer fine equiaxed zone increased with an increase in the cooling rate of the whole right side. The coarse equiaxed zone exists at a cooling rate of 10–15 K/s (Figure 5 and Figure 6), but disappears at a cooling rate of 10–20 K/s (Figure 7).
The grain size was measured by the random intercepts. The experimental data about the grain size of the Mg-1Sn-2.5Y alloy are shown in Table 2.
Table 2.
The grain size of the Mg-1Sn-2.5Y alloy.
3.2. Effects of Pressure and Cooling Rate on Average Grain Size
The average grain size can be expressed as follows [24,25,26]:
where d is the average grain size, I is the nucleation rate, V is the growth rate, ∆TC is the interval of crystallization, and Ṫ is the cooling rate.
The growth rate can be expressed as follows [27]:
where α is the interface factor, R is the gas constant, ɑ is the molecular displacement, D is the solute diffusion coefficient in liquid, T is the temperature, and ΔG is the molar free energy difference between the solid and liquid phases.
The solute diffusion coefficient under high pressures can be expressed as follows [28]:
where P is the pressure and V0 is the original volume of the liquid phase.
The molar free energy difference between solid and liquid phases under high pressures can be expressed as follows [29]:
where ΔV is the molar volume difference between the solid and liquid phases.
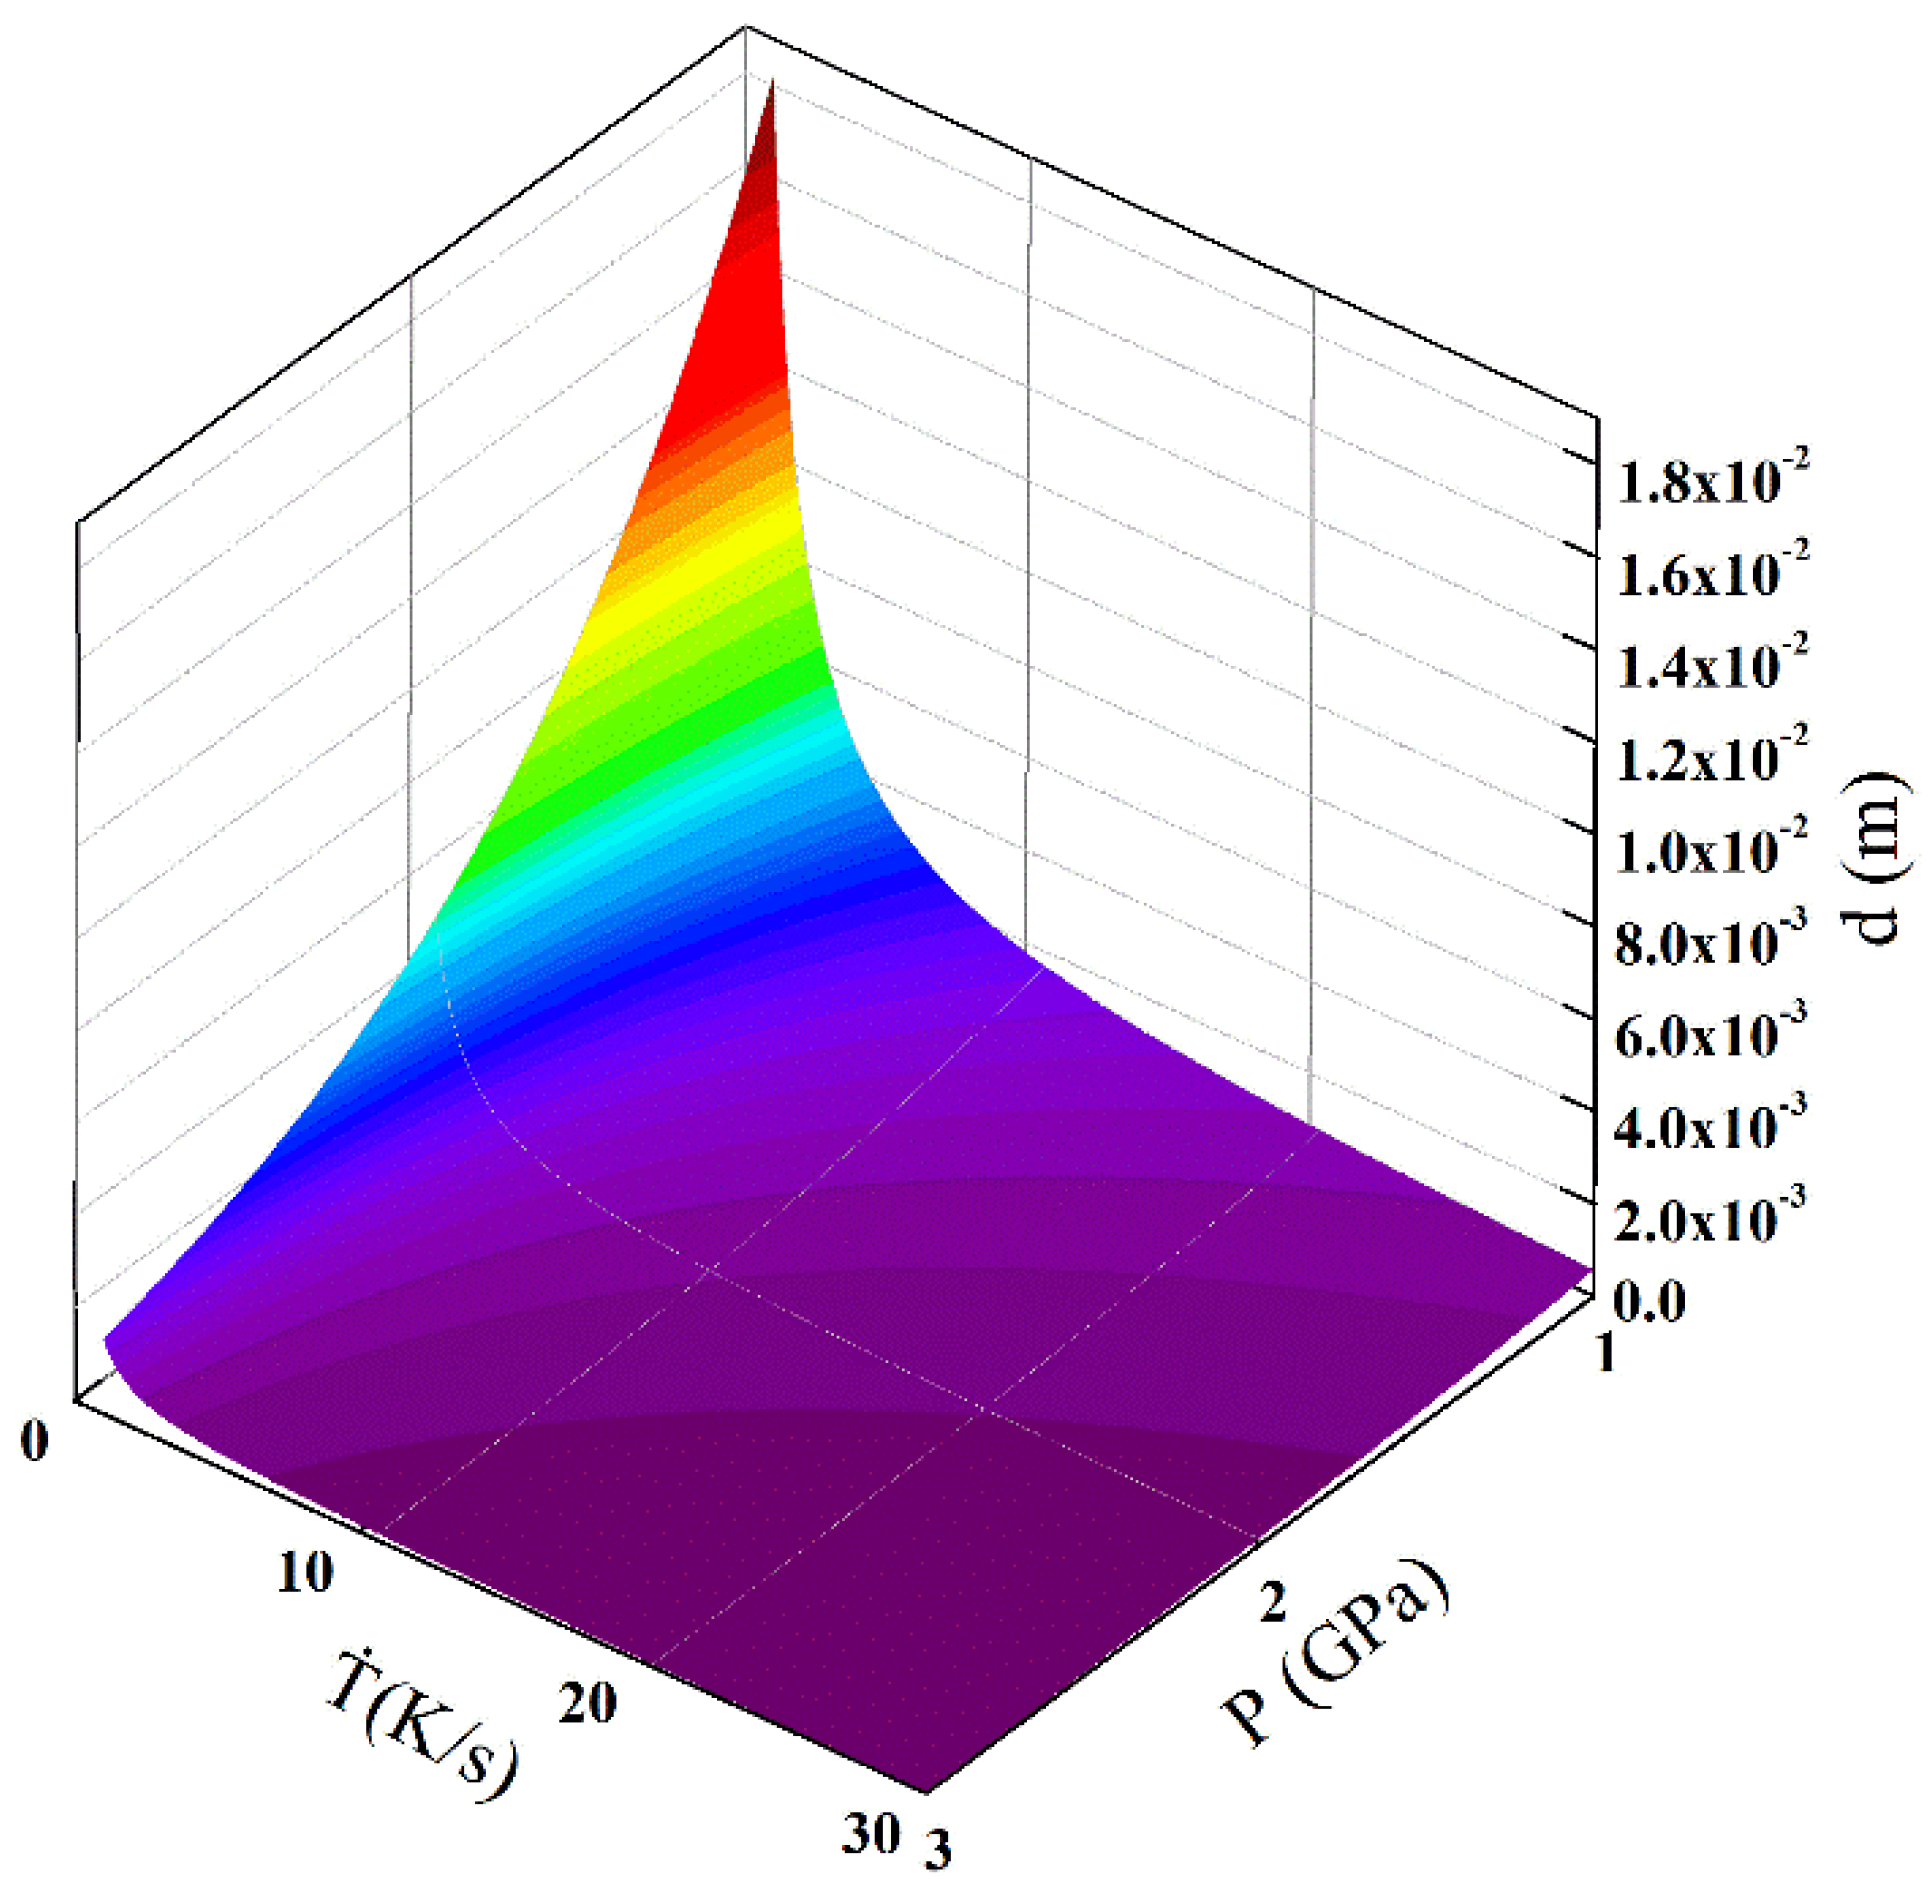
By inserting Equations (2)–(4) into Equation (1), Equation (1) is obtained as follows:
The equation reveals the effects of cooling rate and pressure on the average grain size. According to Equation (5), the average grain size can be predicted. As the atomic percent of Mg element in the Mg-1Sn-2.5Y alloy is 99.1%, the approximate calculation was made using the data of pure Mg. Figure 8 shows the calculation result of the average grain size under the effects of cooling rate and solidification pressure. At the same cooling rate, an increase in pressure causes a decrease in the average grain size. Under the same pressure, an increase in cooling rate causes a decrease in the average grain size. Compared with the influence of cooling rate on the average grain size, the effect of pressure on the average grain size is not negligible.

Figure 8.
Effects of solidification pressure and cooling rate on the average grain size.
3.3. Effect of Pressure on Secondary Dendrite Arm Spacing
The secondary dendrite arm spacing can be expressed as follows [30]:
where k is the solute distribution coefficient, tf is the solidification time, M is the coarsening parameter, Γ is the Gibbs–Thomson coefficient, C0 is the initial alloy concentration, is the segregation concentration, and m is the slope of the liquidus.
According to Equations (3), (6) and (7), the solute diffusion coefficient decreased exponentially with an increase in solidification pressure, resulting in the decrease in the secondary dendrite arm spacing. The calculation result fits with Figure 5c and Figure 6c. The average secondary dendrite arm spacing decreased from 14–17 μm under 1 GPa to 9–11 μm under 1.5 GPa.
4. Conclusions
The microstructures of Mg-1Sn-2.5Y alloys solidified under high pressures were investigated. The effects of cooling rate and solidification pressure on the average grain size and the secondary dendrite arm spacing were analyzed. The following conclusions can be obtained:
- (1)
- Mg-1Sn-2.5Y alloy was solidified under high pressure and temperature gradient using the cooling rate difference in the high pressure chamber, resulting in the formation of the outer fine equiaxed zone, the columnar zone, and the coarse equiaxed zone in alloys. With an increase in solidification pressure, the columnar-to-equiaxed transition was inhibited in Mg-1Sn-2.5Y alloy.
- (2)
- Increases in solidification pressure and cooling rate resulted in a reduction in the average grain size. The effect of pressure on the average grain size is not negligible compared with the effect of cooling rate on the average grain size.
- (3)
- The average secondary dendrite arm spacing decreased from 14–17 μm under 1 GPa to 9–11 μm under 1.5 GPa. In the outer fine equiaxed zone and the columnar zone, the solubility of Sn in the α-Mg matrix increased with an increase in solidification pressure.
Author Contributions
Conceptualization, C.Z.; Data curation, R.Z.; Formal analysis, R.Z.; Project administration, Z.W.; Validation, H.W.; Writing—original draft, R.Z.; Writing—review & editing, C.Z. All authors have read and agreed to the published version of the manuscript.
Funding
This work was supported by the “Head Goose” team project [XNAUEA5640208420] and the National Natural Science Foundation of China [Nos. 51774105].
Data Availability Statement
All data and models during the study appear in the submitted article.
Conflicts of Interest
The authors declare no conflict of interest.
References
- Strong, H.M.; Wentorf, R.H., Jr. Growth of large, high-quality diamond crystals at General Electric. Am. J. Phys. 1991, 59, 1005–1008. [Google Scholar] [CrossRef]
- Sumiya, H.; Satoh, S. High-pressure synthesis of high-purity diamond crystal. Diam. Relat. Mater. 1996, 5, 1359–1365. [Google Scholar] [CrossRef]
- Lysakovskyi, V.; Novikov, N.; Ivakhnenko, S.; Zanevskyy, O.A.; Kovalenko, T. Growth of Structurally Perfect Diamond Single Crystals at High Pressures and Temperatures. Review. J. Superhard Mater. 2018, 40, 315–324. [Google Scholar] [CrossRef]
- Zhou, X.; Feng, Z.; Zhu, L.; Xu, J.; Miyagi, L.; Dong, H.; Sheng, H.; Wang, Y.; Li, Q.; Ma, Y.; et al. High-pressure strengthening in ultrafine-grained metals. Nature 2020, 579, 67–72. [Google Scholar] [CrossRef] [PubMed]
- Drozdov, A.P.; Eremets, M.I.; Troyan, I.A.; Ksenofontov, V.; Shylin, S.I. Conventional superconductivity at 203 kelvin at high pressures in the sulfur hydride system. Nature 2015, 525, 73–76. [Google Scholar] [CrossRef]
- Drozdov, A.P.; Kong, P.P.; Minkov, V.S.; Besedin, S.P.; Kuzovnikov, M.A.; Mozaffari, S.; Balicas, L.; Balakirev, F.F.; Graf, D.E.; Prakapenka, V.B.; et al. Superconductivity at 250 K in lanthanum hydride under high pressures. Nature 2019, 569, 528–531. [Google Scholar] [CrossRef] [PubMed] [Green Version]
- Somayazulu, M.; Ahart, M.; Mishra, A.K.; Geballe, Z.M.; Baldini, M.; Meng, Y.; Struzhkin, V.V.; Hemley, R.J. Evidence for superconductivity above 260 K in lanthanum superhydride at megabar pressures. Phys. Rev. Lett. 2019, 122, 027001. [Google Scholar] [CrossRef] [Green Version]
- Snider, E.; Dasenbrock-Gammon, N.; McBride, R.; Debessai, M.; Vindana, H.; Vencatasamy, K.; Lawler, K.V.; Salamat, A.; Dias, R.P. Room-temperature superconductivity in a carbonaceous sulfur hydride. Nature 2020, 586, 373–377. [Google Scholar] [CrossRef]
- Zhang, H.; Wang, Y.; Peng, Y.; Zhu, P.; Liu, J.; Feng, Z.; Wu, G.; Huang, X. Unprecedented strength in pure iron via high-pressure induced nanotwinned martensite. Mater. Res. Lett. 2019, 7, 354–360. [Google Scholar] [CrossRef]
- Jiang, W.; Zou, C.M.; Wang, H.W.; Wei, Z.J. Modeling of eutectic spacing in binary alloy under high pressure solidification. J. Alloy. Compd. 2015, 646, 63–67. [Google Scholar] [CrossRef]
- Zhang, R.; Zou, C.; Wei, Z.; Wang, H.; Ran, Z.; Fang, N. Effects of high pressure and superheat temperature on microstructure evolution of Al-20Si alloy. J. Mater. Res. Technol. 2020, 9, 11622–11628. [Google Scholar] [CrossRef]
- Zhang, R.; Zou, C.M.; Wei, Z.J.; Wang, H.W. In situ formation of SiC in Al-40Si alloy during high-pressure solidification. Ceram. Int. 2021, 47, 24485–24493. [Google Scholar] [CrossRef]
- Wei, Z.J.; Wang, Z.L.; Wang, H.W.; Cao, L. Evolution of microstructures and phases of Al–Mg alloy under 4 GPa high pressure. J. Mater. Sci. 2007, 42, 7123–7128. [Google Scholar] [CrossRef]
- Jie, J.; Zou, C.; Brosh, E.; Wang, H.; Wei, Z.; Li, T. Microstructure and mechanical properties of an Al–Mg alloy solidified under high pressures. J. Alloy. Compd. 2013, 578, 394–404. [Google Scholar] [CrossRef]
- Jie, J.; Wang, H.; Zou, C.; Wei, Z.; Li, T. Precipitation in Al–Mg solid solution prepared by solidification under high pressure. Mater. Charact. 2014, 87, 19–26. [Google Scholar] [CrossRef]
- Liu, X.; Ma, P.; Jia, Y.D.; Wei, Z.J.; Suo, C.J.; Ji, P.C.; Shi, X.R.; Yu, Z.S.; Prashanth, K.G. Solidification of Al-xCu alloy under high pressures. J. Mater. Res. Technol. 2020, 9, 2983–2991. [Google Scholar] [CrossRef]
- Zhang, R.; Zou, C.M.; Wei, Z.J.; Wang, H.W.; Liu, C. Interconnected SiC-Si network reinforced Al-20Si composites fabricated by high pressure solidification. Ceram. Int. 2021, 47, 3597–3602. [Google Scholar] [CrossRef]
- Liu, H.; Chen, Y.; Zhao, H.; Wei, S.; Gao, W. Effects of strontium on microstructure and mechanical properties of as-cast Mg-5 wt.% Sn alloy. J. Alloy. Compd. 2010, 504, 345–350. [Google Scholar] [CrossRef]
- Lim, H.K.; Sohn, S.W.; Kim, D.H.; Lee, J.Y.; Kim, W.T.; Kim, D.H. Effect of addition of Sn on the microstructure and mechanical properties of Mg-MM (misch-metal) alloys. J. Alloy. Compd. 2008, 454, 515–522. [Google Scholar] [CrossRef]
- Wei, S.H.; Chen, Y.G.; Tang, Y.B.; Liu, M.; Xiao, S.; Zhang, X.; Zhao, Y. Compressive creep behavior of Mg-Sn binary alloy. Trans. Nonferrous Met. Soc. China 2008, 18, s214–s217. [Google Scholar] [CrossRef]
- Zhao, H.D.; Qin, G.W.; Ren, Y.P.; Pei, W.; Chen, D.; Guo, Y. Microstructure and tensile properties of as-extruded Mg-Sn-Y alloys. Trans. Nonferrous Met. Soc. China 2010, 20, s493–s497. [Google Scholar] [CrossRef]
- Mittemeijer, E.J. Fundamentals of Materials Science: The Microstructure Property Relationship Using Metals as Model Systems; Springer: Berlin/Heidelberg, Germany, 2010; pp. 380–384. [Google Scholar]
- Bendijk, A.; Delhez, R.; Katgerman, L.; De Keijser, T.H.; Mittemeijer, E.J.; Van Der Pers, N.M. Characterization of Al-Si-alloys rapidly quenched from the melt. J. Mater. Sci. 1980, 15, 2803–2810. [Google Scholar] [CrossRef]
- Turnbull, D.; Cohen, M.H. Crystallization kinetics and glass formation. Mod. Asp. Vitr. State 1960, 1, 38. [Google Scholar]
- Brazhkin, V.V.; Larchev, I.V.; Popova, S.V.; Skrotskaya, G.G. The influence of high pressure on the disordering of the crystal structure of solids rapidly quenched from the melt. Phys. Scr. 1989, 39, 338–340. [Google Scholar] [CrossRef]
- Li, D.; Wang, A.; Yao, B.; Ding, B.; Hu, Z. Synthesis of bulk nanocrystalline Ti–Cu alloy by pressure-quenching method. J. Mater. Res. 1996, 11, 2685–2688. [Google Scholar] [CrossRef]
- Turnbull, D. On the relation between crystallization rate and liquid structure. J. Phys. Chem. 1962, 66, 609–613. [Google Scholar] [CrossRef]
- Yu, X.F.; Zhang, G.Z.; Wang, X.Y.; Gao, Y.Y.; Jia, G.L.; Hao, Z.Y. Non-equilibrium microstructure of hyper-eutectic Al-Si alloy solidified under superhigh pressure. J. Mater. Sci. 1999, 34, 4149–4152. [Google Scholar] [CrossRef]
- Wang, W.H.; Wang, Z.X.; Zhao, D.Q.; Tang, M.B.; Utsumi, W.; Wang, X.-L. High-pressure suppression of crystallization in the metallic supercooled liquidZr41Ti14Cu12.5Ni10Be22.5: Influence of viscosity. Phys. Rev. B 2004, 70, 092203. [Google Scholar] [CrossRef]
- Rappaz, M.; Boettinger, W. On dendritic solidification of multicomponent alloys with unequal liquid diffusion coefficients. Acta Mater. 1999, 47, 3205–3219. [Google Scholar] [CrossRef]
Publisher’s Note: MDPI stays neutral with regard to jurisdictional claims in published maps and institutional affiliations. |
© 2022 by the authors. Licensee MDPI, Basel, Switzerland. This article is an open access article distributed under the terms and conditions of the Creative Commons Attribution (CC BY) license (https://creativecommons.org/licenses/by/4.0/).