Article

Molecular Dynamics Simulation of β-HMX Crystal Morphology Induced by Polymer Additives

State Key Laboratory of Explosion Science and Technology, Beijing Institute of Technology, Beijing 100811, China
*
Author to whom correspondence should be addressed.
Crystals 2022, 12(2), 164; https://doi.org/10.3390/cryst12020164
Submission received: 6 December 2021 / Revised: 14 January 2022 / Accepted: 20 January 2022 / Published: 24 January 2022

Abstract

:
To simulate the crystal morphology of β-HMX crystallized in the presence of different polymer additives in the solution, a modified attachment energy model was used to simulate the crystal morphology of β-HMX recrystallized in PVA-DMSO solution when the mass fractions of PVA were 0.5%, 1%, 3%, 5%, and 10%, respectively. When the mass fraction of additive was 10%, the simulation results were in good agreement with the experiment. Molecular dynamics simulations were performed on the solution systems of different types of polymer additives to predict the morphology of β-HMX crystals. In addition, the effect of water on the crystal morphology of β-HMX was studied, and the effect of additive PVA on the solute and solvent diffusion ability during crystal crystallization was studied. The simulation results have certain reference significance in the crystallization process of β-HMX under additive conditions.

Graphical Abstract

1. Introduction

Octahydro-1,3,5,7-tetranitro-1,3,5,7-tetrazocine (HMX) is an energetic material with high energy density, which has good thermal safety and detonation ability. Due to its high performance, high energy materials, such as formula explosives and solid propellants based on β-HMX, have been widely studied and used [1,2,3,4,5].
The development of the modern weapon industry puts forward higher requirements for energetic materials. A significant trend is that energetic materials need to have higher detonation performance and lower sensitivity. With the in-depth study of high energy and insensitive explosives, the influence of crystal shape, crystal surface state, and crystal internal defects on the performance of explosives has attracted wide attention from researchers [6,7,8,9,10,11,12,13]. Compared to the explosive crystals in the form of flakes and needles, spherical explosives can significantly increase the charge density and improve the detonation performance of the charge. They can also reduce the formation of hot spots, thereby reducing mechanical sensitivity and improving safety performance. Therefore, it is valuable to prepare spherical β-HMX by appropriate crystal morphology control technology.
There are many crystallization methods for explosive crystals [14,15,16,17], but the solution crystallization method is cheap and convenient. The crystal morphology of explosives is affected by various variables such as the solvent, additive, additive amount, and operating temperature, among which the additive is an important factor affecting the crystal appearance. Researchers have extensively studied the effects of different types of additives and additive volume fractions on crystal morphology, and have obtained a series of experimental results with reference significance [18,19,20,21]. Damiri et al. [22] studied the effect of additive PEG-400 on the crystal morphology of β-HMX by the solvent–nonsolvent method. Li et al. [23] studied the microscopic interaction of four additives on the {0 1 1} plane of urea by a molecular dynamics (MD) method and further explained the regulation principle of additives on crystal morphology.
Compared to the experiment, the computer simulation of explosive crystal morphology has the advantages of safety, low cost, and environmental protection, and the computer simulation experiment can display the microscopic behavior details of solvents, additives, and solutes that cannot be observed in the experiment. Therefore, the morphology of β-HMX crystal obtained from pure dimethyl sulfoxide (DMSO) was simulated. In addition, the crystal morphology of β-HMX in a DMSO–water binary system with water mass fractions of 5%, 10%, 15%, and 20% was simulated.
Coating a polymer film on the surface of explosive crystal or forming a core–shell structure can effectively reduce the sensitivity of explosives. Lin et al. [24] used a new high melting point paraffin wax (HPW) and PDA to coat HMX to obtain litchi-like microcapsules, which can significantly reduce the impact sensitivity and friction sensitivity and improve the thermal stability. Kosareva et al. [25] used supercritical CO2 as an anti-solvent to obtain polymer-coated HMX particles. The results show that the polymers at less than 3 wt% content can precipitate on the surface of HMX crystal as globular islands, which can significantly reduce the impact sensitivity. At present, the morphological simulation of energetic materials with polymer additives has not been reported, and the influence mechanism of polymer additives on crystal morphology is also unclear. Therefore, this study only attempted to predict the crystal morphology of HMX in the presence of polymer additives by a molecular dynamics method, while ignoring the effects of supersaturation, stirring, and impurities coverage on the crystal morphology.
To simulate the crystal morphology of β-HMX in the presence of polymer additives, the modified attachment energy model was used to simulate the crystal morphology of β-HMX recrystallized in a PVA–DMSO solution system when the mass fractions of polyvinyl alcohol (PVA) were 0.5%, 1%, 3%, 5%, and 10%, respectively. Thus, the optimal chain length that can have the effect of polymer additives on crystal morphology modification in the simulation experiment was determined. On this basis, the crystal morphology of β-HMX induced by polymer additives polyacrylic acid (PAA) and polyethyleneimine ethoxylated (PEI) was predicted by molecular dynamics simulation. The simulation results were compared with the experimental results obtained by the solvent–nonsolvent method.
The type and addition of additives have a significant influence on the modification of crystal morphology. The control of additives on crystal morphology depends not only on the specific functional groups and structures of additives but also on the effect of additives on the transport behavior of solvent and solute molecules during crystallization. Therefore, the diffusion ability of solvents and solutes in the crystallization systems at different temperatures near the crystal surface was studied in the presence and absence of additives.

2. Materials and Methods

2.1. Methods

For the simulation of crystal morphology, the attachment energy model based on the period bond chain (PBC) theory proposed by Hartman and Bennema [26,27] has been widely used in the simulation of explosive crystal morphology [13,28,29,30,31,32]. The attachment energy model is a model that considers crystal anisotropy and predicts crystal growth morphology in the vacuum by calculating the attachment energy between the different surfaces of crystals and growth layers. Attachment energy E a t t is defined as the energy released by the growth of a surface layer of d h k l thickness on the single surface {h k l} of the crystal. The energy released by this process is calculated as follows:
E a t t = E l a t t E s l i c e
where E l a t t represents the lattice energy of the crystal, and E s l i c e represents the energy required for the growth of a crystal slice with a thickness of d h k l .
In this model, the relative growth rate R h k l of the crystal plane {h k l} in the vacuum is proportional to the absolute value of the attachment energy of the corresponding crystal plane, expressed as follows:
R h k l   E a t t
The attachment energy model is a model to predict the crystal morphology in the vacuum, which does not consider the influence of solvent on the crystal morphology. The growth of crystals needs to overcome the solvation effect. In the process of crystal growth, solvent molecules need to be excluded from the crystal surface, and solute molecules grow on the crystal surface. The desolvation process consumes energy. Compared to the attachment energy in the vacuum, the apparent attachment energy is reduced.
To predict the crystal morphology under solvent conditions, the energy correction factor E s of the attachment energy E a t t is introduced to characterize this solvent effect. The modified calculation formula of attachment energy E a t t s is as follows:
E a t t s = E a t t S · E s
Similar to the condition in the vacuum, the crystal growth rate in solution is directly proportional to the modified attachment energy [33], expressed as follows:
R h k l s | E a t t s |
S is a correction factor reflecting the roughness of the crystal surface, defined as the ratio of the accessible solvent surfaces area A a c c of a unit cell to the surface area A h k l of the crystal surface of the unit cell.
S = A a c c A h k l
The energy correction factor E s represents the binding energy between the solvent and the crystal surface {h k l}, which can be calculated by the following formula:
E s = E i n t × A h k l A b o x
A b o x is the total area of the simulation model obtained by cutting along the plane {h k l} and establishing superlattices. E i n t represents the interaction energy between solvent molecules and the crystal surface {h k l}, which can be calculated by the following formula:
E i n t = E t o t E s u r E s o l
where E t o t is the total energy of the crystal surface and the solvent layer, E s u r is the energy of the crystal surface, and E s o l is the energy of only the solvent layer.
When other components exist in the solvent layer, such as polymers, the formula can be changed to
E i n t = E t o t E s u r E s o l E o
where E o is the energy of other components in the solvent layer.

2.2. Simulation Details

β-HMX belongs to a monoclinic system with the space group P21/C, a = 6.540 Å, b = 11.050 Å, c = 8.700 Å, β = 124.3°, α = γ = 90° [34]. On this study, we used the software Materials Studio 2017, the MD method, and the COMPASS force field [35].
Molecular dynamics simulation is a random simulation method. Under the action of a force field, the molecules in the model are subjected to van der Waals force, electrostatic force, and other interactions to move endlessly. When the model system reaches a dynamic equilibrium, it can truly reflect the state of the system at a certain time.
Under the COMPASS force field, the conjugate gradient algorithm was used to optimize the β-HMX molecule. Since the simulation work in this study was based on the dynamic simulation of molecular dynamics, the molecular dynamics method was used to process the crystal to validate the applicability of the COMPASS force field. The results show that the lattice parameters of the experimental data changed from a = 6.540 Å, b = 11.050 Å, c = 8.700 Å, β = 124.3°, α = γ = 90° to a = 6.407 Å, b = 10.826 Å, c = 8.523 Å, β = 124.3°, α = γ = 90°; the density also changed from 1.842 g/cm3 to 1.959 g/cm3, and the total potential energy changed from −695.445 kcal/mol to −687.735 kcal/mol. These results are acceptable. The simulation details include an NPT ensemble, a temperature of 298 K, a pressure of 0.1 GPa, a time step of 1 fs, and a simulation time of 200 ps. The temperature control method was Anderson, the collision ratio was 1.0, the pressure control method was the Berendsen method, and the force field method was COMPASS. “Fine” was selected for the quality, which means that the cutoff radius was 15.5 Å. When the NPT ensemble was selected, the lattice parameters changed with time, and the influence of the force field on the lattice parameters was observed. In this study, the NVT ensemble was selected, and the lattice parameters did not change over time.
The attachment energy model was selected to predict the crystal morphology of β-HMX in a vacuum, and the morphology growth surface in the vacuum was obtained. Then, β-HMX was cut along five main morphological growth planes and expanded into three-dimensional periodic superlattices. For the size selection of the superlattices, researchers found that the length and width of the simulation model were larger than twice the cut-off radius, and the simulation results were more accurate when the thicknesses of the solvent and crystal were larger than the cut-off radius, and the simulation results met the accuracy requirements when the cut-off radius was set to 15.5 Å [36].
For this purpose, the cut-off radius was set to 15.5 Å. The size of the extended β-HMX supercell is shown in Table 1. Subsequently, a three-dimensional periodic solvent box was established by using the Amorphous Cell tool. The length and width of the box were the same as the cell parameters of the five superlattices, and the thickness of the solvent box was set to be over the cut-off radius. The establishment process of the model is shown in Figure 1.
Using the COMPASS force field, all MD simulations were performed in the NVT ensemble. The Andersen thermostat was used to control the temperature, and the collision ratio was 1.0. The Ewald method was used to calculate the electrostatic interaction, the buffer width was 0.5 Å, and the accuracy was 0.0001 kcal mol−1. The atom-based method was used to calculate the van der Waals force, the cutoff distance was 15.5 Å, the spline width was 1 Å, and the buffer width was 0.5 Å.
The simulation time was 200 ps; the first 100 ps of the simulation time was used for system relaxation, and then the frames of the last 100 ps were collected for energy calculations. The time step was 1 fs; one frame was output every 500 steps. The calculation of energy was realized by Perl script in Materials Studio. By using the Energy command in the Forcite module, the total energy, the single crystal surface energy, and the single solvent layer energy of each frame were calculated in the last 100 ps, and then the average values were taken as the final results ( E t o t , E s u r , and E s o l ), which can be calculated by the following formula:
E x = 1 n i = 1 n E x i
where E x represents the final average energy E t o t , E s u r , and E s o l , n is the number of frames in the last 100 ps, and E x i is the energy of E t o t , E s u r , and E s o l in frame i.

3. Results and Discussion

3.1. Crystal Morphology of β-HMX in a Vacuum

The crystal morphology of β-HMX in a vacuum was simulated by the AE model. According to the periodic bond chain theory, the stronger the bond is, the faster the crystal plane grows. A crystal plane with a fast growth rate will eventually disappear, which is not reflected in the final crystal morphology. The simulation results show that the final crystal had only five crystal faces, the crystal morphology was gem-like, and the aspect ratio was 2.151. The simulated crystal shape is shown in Figure 2.
The final crystal growth planes were {1 0 0}, {1 0 −2}, {0 1 1}, {1 1 −1} and {0 2 0}, and the relevant parameters are listed in Table 2.
It can be seen from Table 2 that the areas of the main crystal planes of β-HMX in a vacuum were {0 1 1} > {1 1 −1} > {0 2 0} > {1 0 0} > {1 0 −2}. The {0 1 1} facet had the largest interplanar spacing of 6.03 Å, the smallest attachment energy of −23.35 kcal mol−1, and the area accounted for 62.28% of the total crystal area. The {1 0 −2} plane had the smallest interplanar spacing of 4.32 Å, so its area was the smallest, accounting for only 1.08% of the total crystal area; it was the least significant surface in the morphology.
To observe the structure of different crystal planes of β-HMX crystal, Figure 3 shows the molecular packing structures and the accessible solvent surfaces of the different crystal planes of β-HMX crystal, reflecting the surface chemical characteristics of the crystal. It can be seen that the nitro group of the {1 0 0} plane was directly exposed and perpendicular to the surface, and the nitro group was consistent with the normal growth direction of the crystal plane, making it is easy to form hydrogen bonds. The molecular arrangement of the surface was not uniform. There were many large voids on surface, making it easy to adsorb solvent molecules. The crystal faces {1 0 −2}, {0 1 1}, {1 1−1}, and {0 2 0} were relatively flat and the polarity was small.
The blue surface in the figure represents the accessible solvent surface, and Table 3 shows the values of the solvent-accessible area ( A a c c ), the surface area ( A h k l ) and the corresponding S of solvents with different β-HMX crystal surfaces. The value of S quantitatively represents the roughness of different crystal growth surfaces of β-HMX, and it affects the energy correction factor Es, thus having a key impact on the attachment energy of different crystal surfaces.
From the accessible solvent surfaces of the main crystal planes, it can be seen that the accessible solvent surface of the {1 0 −2} plane was relatively flat, and the angle between the nitro group and the horizontal plane was the smallest. Therefore, this plane was smooth, and it was not easy for the solvent molecules to form adsorption sites. The S value of the {1 0 0} surface was the largest, and the solvent-accessible surface was also the most complex, indicating that the {1 0 0} surface was easily occupied by solvent molecules.

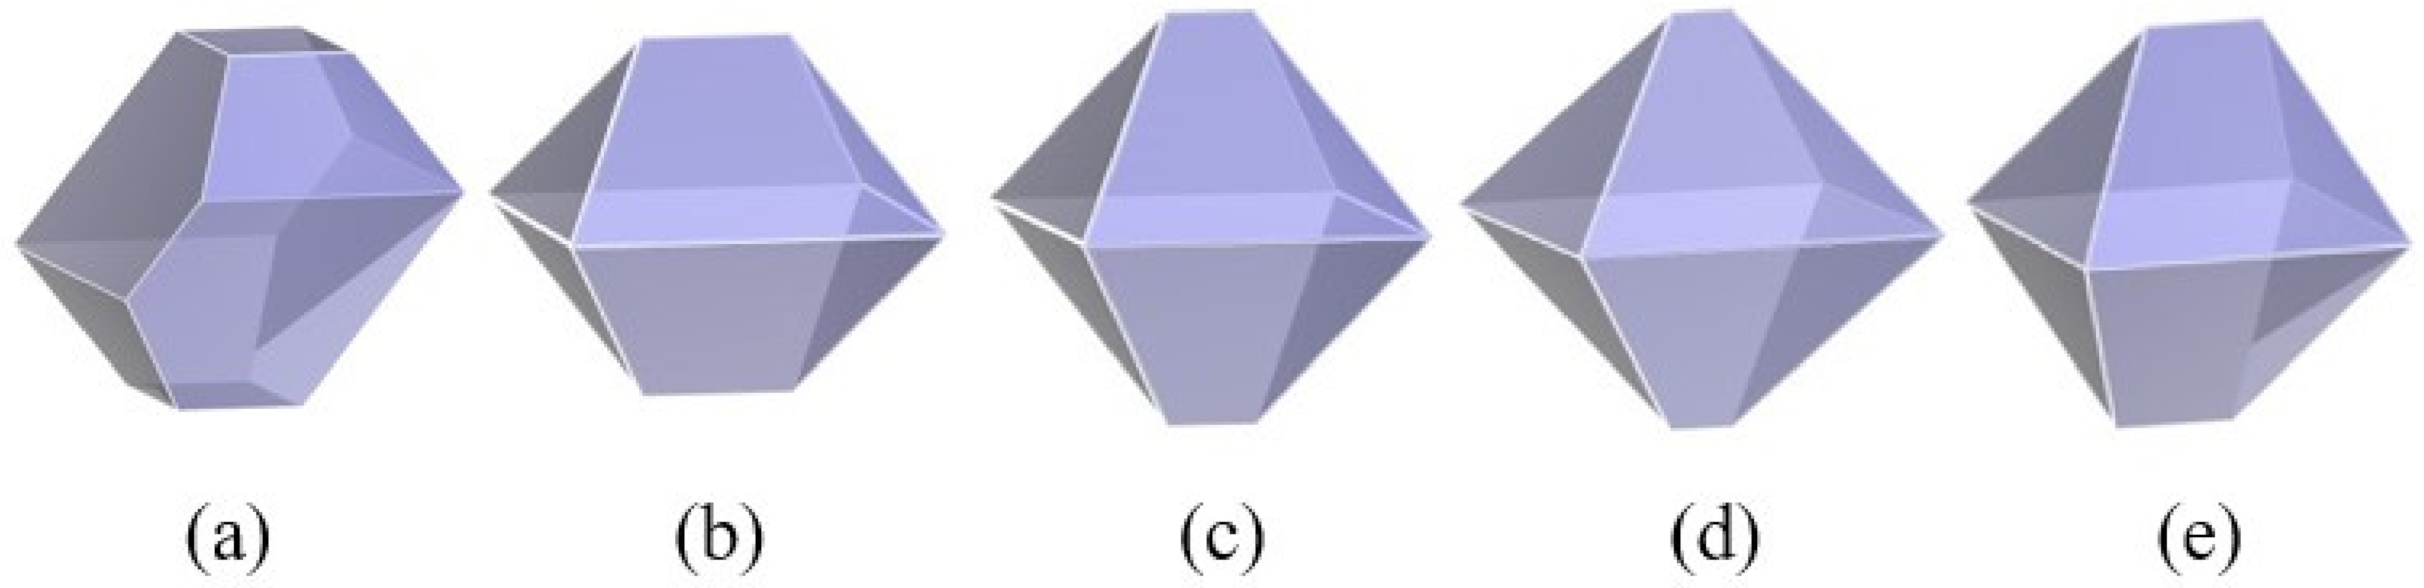
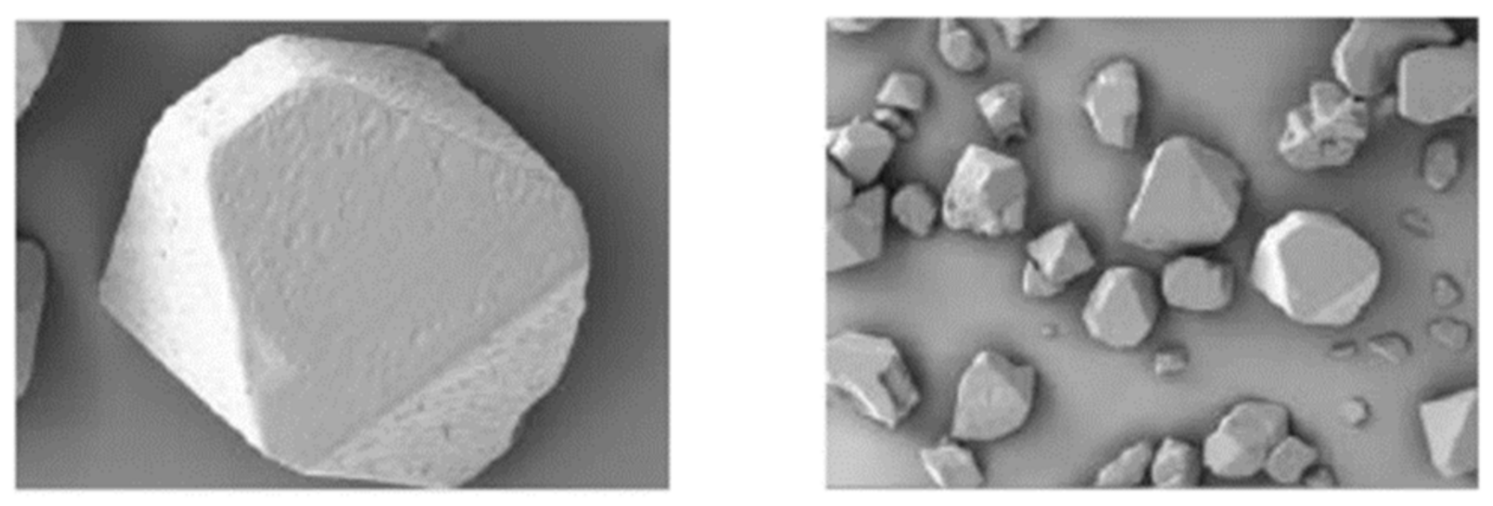
3.2. Effect of the Water Ratio on the Morphology of β-HMX

Unlike crystallization in a vacuum, solvent molecules need to be removed from the crystal surface during the crystal precipitation in the solvent, which consumes energy. The modified attachment energy model considers the desolvation effect and the chemical characteristics of the crystal surface, so the crystal morphology under solvent can be predicted by this model. Here, the attachment energy in the vacuum could be corrected by calculating the interaction energy between the solvent and the crystal surface {h k l} to predict the crystal morphology precipitated in the solvent.
To predict the crystal morphology of β-HMX under polymer additives, it is necessary to study the influence of water on crystal morphology because there is a small amount of water in the preparation process. Considering that DMSO has hygroscopicity and absorbs a small amount of water from the air, to verify whether the existence of water can change the crystal morphology, the crystal morphology was simulated when the mass fractions of water were 5%, 10%, 15%, and 20%. The interaction energy between the solvent layer and the crystal plane as well as some crystal habits obtained by the molecular dynamics simulation are shown in Table 4.
The morphology simulation of crystals in the DMSO–water system with different water mass fractions is shown in Figure 4.
According to the simulation results, the existence of water affected the crystal morphology. It can be seen that the modified attachment energy of {1 0 0} surface increased obviously, and the attachment energies of the {0 1 1} and {1 1 −1} surfaces decreased slightly. It can be seen from the packing structure diagram of the different crystal planes of β-HMX that the nitro group on the {1 0 0} crystal plane was directly exposed and perpendicular to the surface, which was the rough surface. After mixing with the solvent, it was easy to form hydrogen bonds with the water molecules. In addition, the molecular packing structure of this surface was loose, and there were large gaps between molecules. It was easy for water molecules to enter the gaps, forming a relatively stable structure. Therefore, the modified attachment energy of the {1 0 0} surface increased significantly, the crystal growth rate increased and, finally, disappeared from the crystal surface.
Wang et al. [37] obtained β-HMX crystals by the cooling method in DMSO solvent, as shown in Figure 5.
The crystal morphology of β-HMX obtained by the cooling crystallization method changed greatly compared to that under the vacuum condition. Obviously, the {0 2 0} plane and the {1 0 −2} plane of the crystal disappeared. It was also found that the crystal morphology was not all regular and identical. The {1 0 0} plane had different sizes, and the planes of some crystals even disappeared. Therefore, it can be inferred that due to the hygroscopicity of DMSO, the introduction of water changed the crystal morphology.
The simulated crystal morphology of β-HMX is in good agreement with the experimental results. It can be inferred from the experimental results that when the water content in the solution was low, the existence of water only affected the size of the {1 0 0} plane, rather than making it disappear completely. Under the influence of water, the aspect ratio of the β-HMX crystal was larger than that of the crystal obtained in pure solvent DMSO. Therefore, the crystallizer needed to be closed in the actual preparation experiment to prevent the solvent from absorbing water in the air and causing adverse effects.

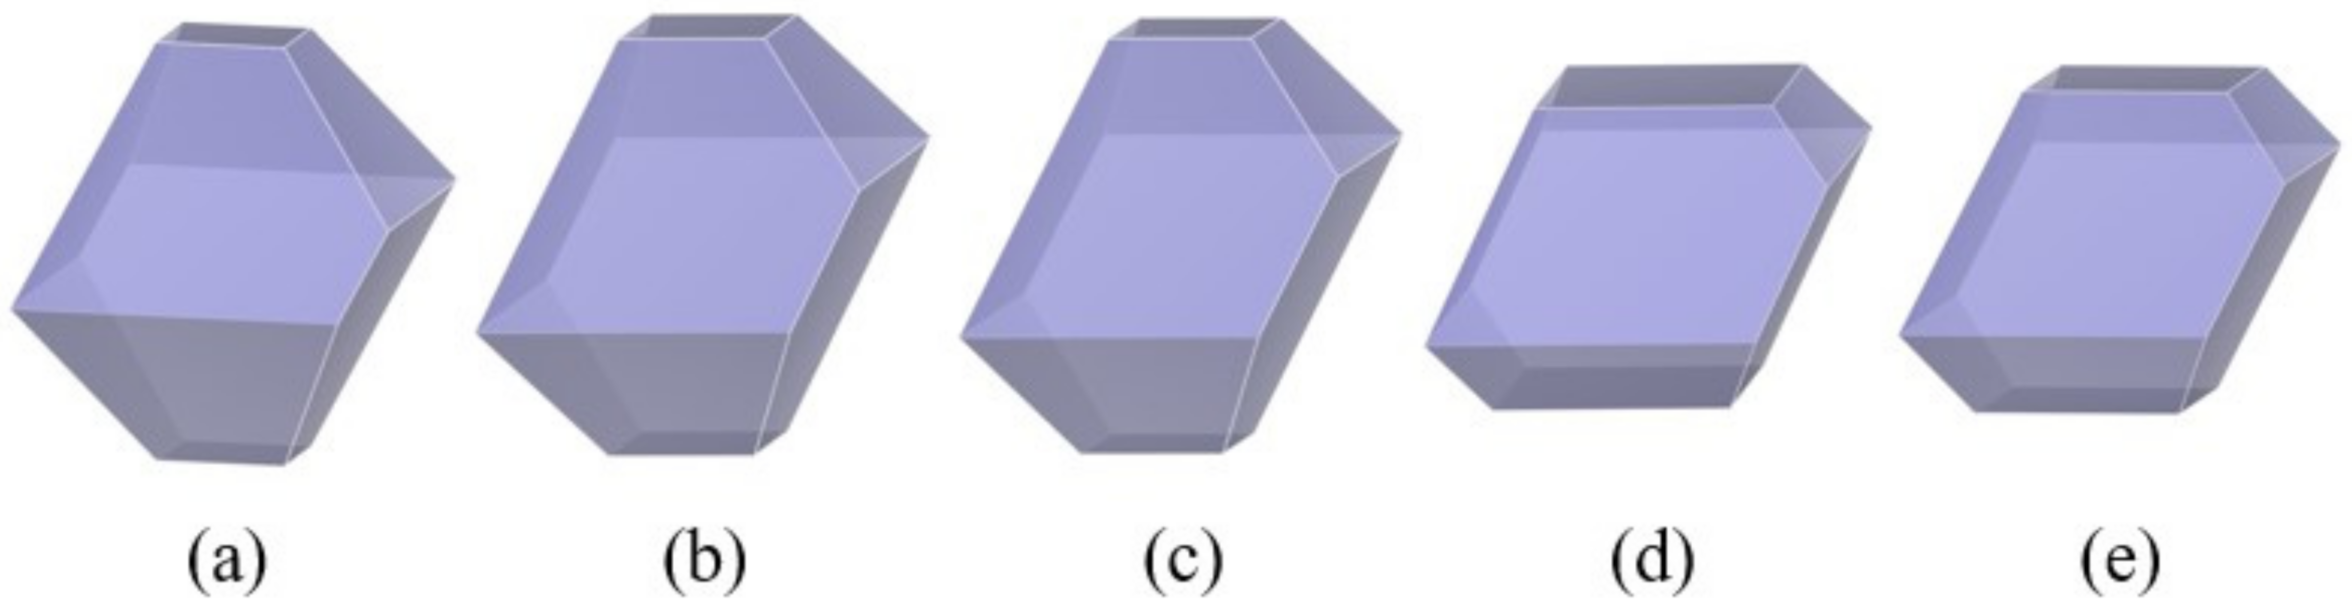
3.3. Effect of the Chain Length of Polymer Additives on the Morphology of β-HMX

The study of small-molecule additives on crystal morphology has been widely reported [18,21]. The study of polymer additives on the crystal morphology of β-HMX is rare. This may be due to the unclear mechanism of the effect of polymer additives on crystal morphology, and polymer additives are not cheap. In this study, three water-soluble polymers—polyacrylic acid (PAA), polyvinyl alcohol (PVA), and polyethyleneimine ethoxylated (PEI)—were selected to simulate the effect of polymer additives on crystal morphology. The molecular conformation diagram of the three additives is shown in Figure 6.
Unlike small molecules, the constituent units of polymers are chain units, and the remarkable characteristics of polymers are large molecular weights and the polydispersity of molecular weight. This leads to the different establishment process of the polymer–solvent box and the small molecule—solvent box. In general, for crystal morphology modification, the addition of 1% additive can play a role. To save computational costs, the time scale of the molecular dynamics simulation is set to the picosecond level. Due to the randomness of the model establishment and the poor mobility of polymers, polymers may not interact well with β-HMX supercells at this time scale. Therefore, it is necessary to study the effect of the polymer chain length on crystal morphology to find the optimal polymer chain length that can reflect the effect of additives on crystal morphology on a short time scale, namely the mass fraction of polymer additives.
Firstly, the number of DMSO molecules in the solvent box was 250 to ensure that the thickness of the solvent layer was greater than the cut-off radius of 15.5 Å. Then, taking PVA as an example, the crystal morphology of β-HMX was simulated when the mass fractions of additives were 0.5%, 1%, 3%, 5%, and 10%, respectively. Only one polymer chain was formed in the solvent box, and the change of the mass fraction of the additive was reflected in the change of the chain length of the polymer. In the process of building a solvent box, the polymer was simulated annealing-optimized to eliminate unreasonable conformation. Since the conformation of the constructed polymer was isotactic, the intramolecular interaction force was large, and the rigidity was strong, so the polymer chain presented a helical structure. The annealing process was completed in a vacuum with 10 annealing cycles. The chain number corresponding to the concentration of additive PVA is 2, 3, 10, 17, and 34, respectively. The interaction energies and crystal habits of β-HMX in a PVA–DMSO system with different mass fractions of PVA at 298 K were obtained by molecular dynamics simulation, as shown in Table 5. The simulated crystal morphology is shown in Figure 7.
It can be observed from the simulation diagram of the crystal morphology that when the mass fraction of PVA was less than 5%, the crystal morphology obtained was almost the same as that obtained in pure solvent DMSO, indicating that the simulation experiment could not well predict the crystal morphology when the additive amount was small. When the additive amount was 5%, the modification effect of additives on crystal morphology could be observed.
The simulation results are consistent with the experimental results of Wang, [38] that is, the solvent–nonsolvent method was used to prepare β-HMX crystals by adding water-soluble polymers into the water to form a certain concentration of nonsolvent, and the nonsolvent was slowly injected into DMSO solution through a peristaltic pump. Figure 8 shows the crystal morphology of β-HMX induced by additives PAA, PEI, and PVA. When the mass fraction of PVA was 5% or 10%, the simulation results are similar to the experimental results, indicating the accuracy of the simulation results. Due to the randomness of the model, 5% of the additive may have been located at the corner of the model, which may have resulted in a longer simulation time to achieve equilibrium. In order to save computing resources, the mass fraction of polymer additives was set to 10% in the simulations.

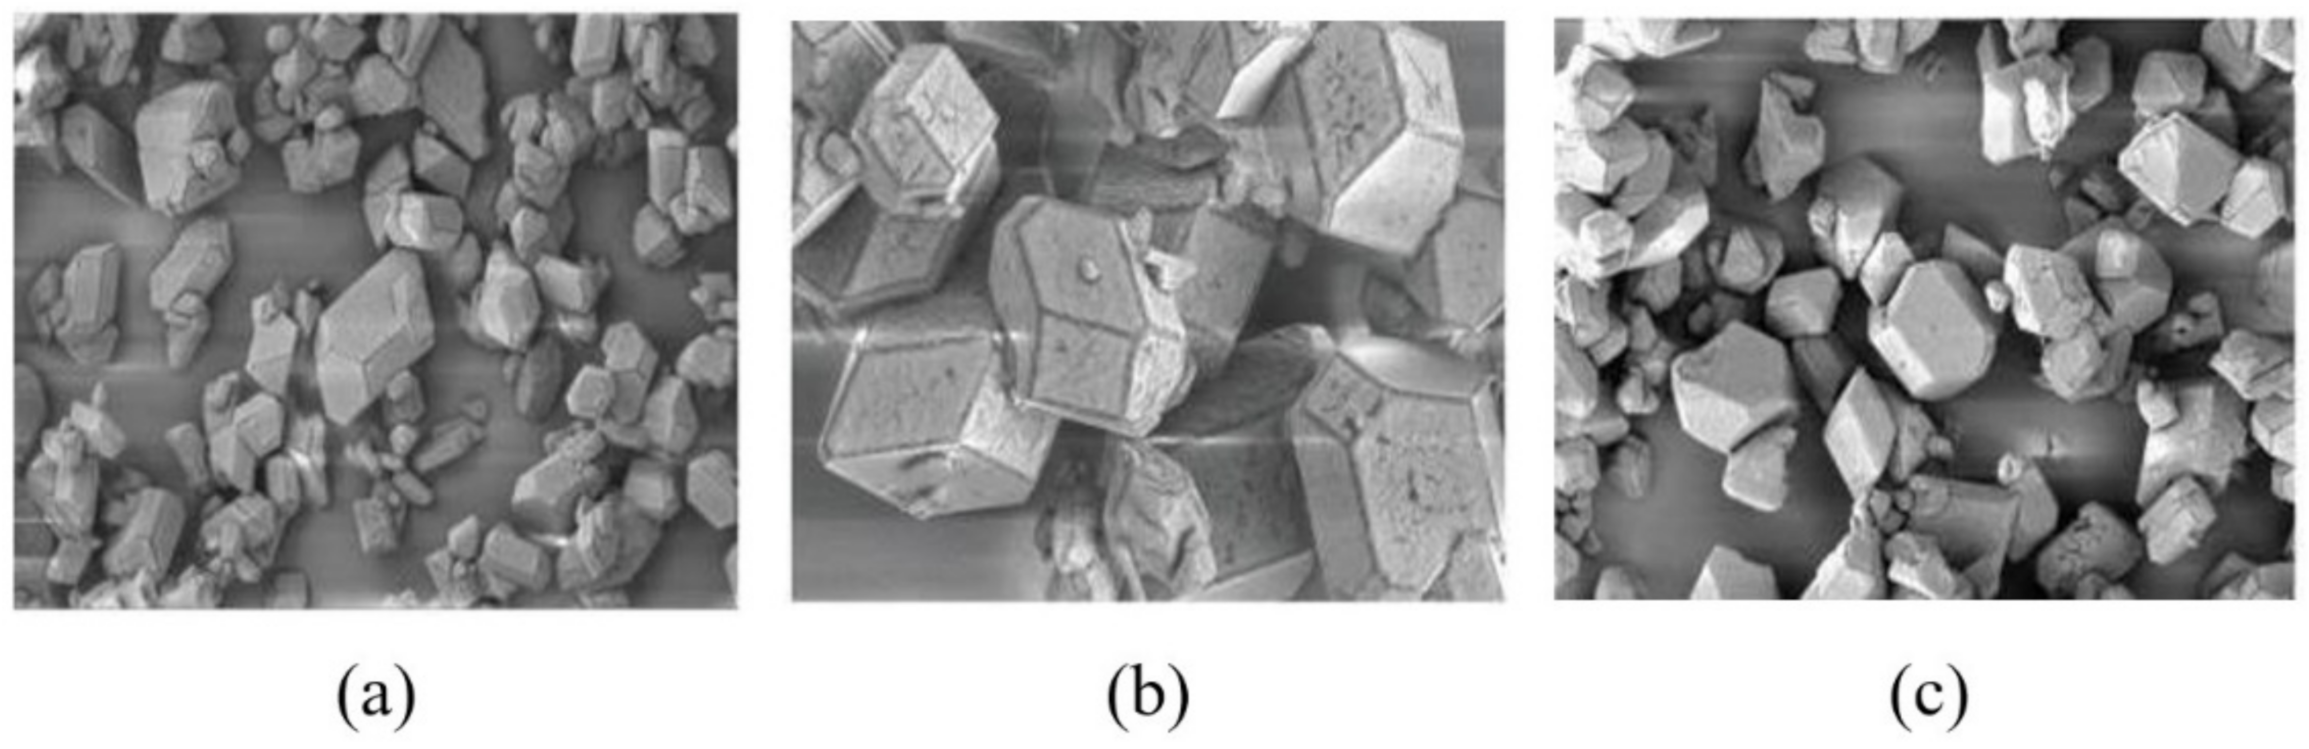
3.4. Effect of Different Polymer Additives on the Morphology of β-HMX Crystal

In Section 3.3, to describe the effect of additives on crystal morphology, we finally determined that the additive amount was 10% of the solvent mass. The additive amount in the actual experimental operation was 3% water [38], and the additive amount in the simulation experiment was different from that in the experimental operation. This is because the motion mode of polymers is through the creep of the chain segment, and the motion ability is not as good as small molecules. The time scale of molecular dynamics simulation is at the picosecond level, which may not be able to comprehensively demonstrate the motion of polymers. The use of long-chain polymers may shorten the time it takes additives to move to the crystal surface and is not prone to desorption.
It should be noted that the addition of 10% additives was only to predict the modification effect of additives on crystal morphology rather than the specific solution concentration in the actual operation. In addition, due to the polydispersity of the molecular weight of the polymers, mechanochemistry reactions also occurred in the stirring process, resulting in molecular chain rupture and entanglement. In the actual crystallization process, short-chain and long-chain molecules exist together, and the situation is quite complex.
On this basis, the crystal morphology of the mixed system of PAA–DMSO and PEI–DMSO was simulated. The interaction energies and crystal habits are shown in Table 6. The simulation results of β-HMX crystal morphology are shown in Figure 9.
Compared to the experimental results, the simulation results are in good agreement with the experimental results. Polymer additives played a role that should be played and had different modification effects on the morphology of β-HMX crystals. Among them, the β-HMX crystal under the influence of PAA consists of {0 1 1}, {1 1 −1}, and {1 0 0} planes. Unlike the β-HMX crystallization in pure solvent DMSO, the modified attachment energy of the {1 0 0} plane increased significantly, and the area percentage of this plane only accounted for 1.69%. This shows that the PAA molecules may have had a strong interaction with the {1 0 0} plane, which accelerated the growth rate of the plane and eventually narrowed the crystal plane.
The crystal morphology of β-HMX affected by PEI was different from that affected by other additives. The simulation results show that the β-HMX crystal in the presence of PEI consisted of the {0 1 1}, {1 1 −1}, {1 0 0}, and {1 0 −2} planes. In particular, the addition of polymer additive PEI made the β-HMX crystal present the {1 0 −2} plane. This may have been determined by the configuration of the PEI molecule itself.
The main chain of PEI contains nitrogen atoms, which can form hydrogen bonds under appropriate conditions. Although the {1 0 −2} plane was the flattest surface in the morphology, it also exposed nitrogen atoms well. Considering that the PEI molecular chain has good flexibility, that is, there are many conformations, there may have been strong interactions between the PEI molecules and the {1 0 −2} plane. The modified attachment energy and the growth rate decreased and, finally, the {1 0 −2} plane appeared on the β-HMX crystal.

3.5. Effect of Polymer Additives on Molecular Motion Ability in Solution

In Section 3.4, the crystal morphology of β-HMX under different additives in the simulation and experiment were discussed, along with the effect of additives on crystal morphology modification. On the one hand, the additive molecule itself can be adsorbed on the crystal surface, and solute molecules deposited on the crystal surface need to overcome the resistance of additives. On the other hand, in the process of crystallization, additives without adsorption on the crystal surface may affect the transport process of solute.
In fact, the relative molecular mass of polymer is at least more than 10,000, and the intermolecular and intramolecular interactions are large. The polymer in the solvent may adsorb solvent and solute. This behavior may have some effects on the morphology of crystals.
In this part, the molecular dynamics characteristics of PVA with a 10% mass fraction, a solvent, and a solute system on the {1 0 0} crystal plane at different temperatures were simulated. The modeling method was similar to the modeling process of the {1 1 −1} crystal plane in the DMSO–water binary solvent. The models were divided into two categories. One was the addition of DMSO and β-HMX molecules in the solvent box, and the other was the addition of DMSO, β-HMX, and PVA molecules in the solvent box. Figure 10 shows the established model.
Using the COMPASS force field and NVT ensemble, molecular dynamics simulations of the above two models were carried out at different temperatures. The simulation time was 600 ps so that the polymer could be fully relaxed. The nose method was used to control the temperature. The Ewald method was used to calculate the electrostatic interaction. The accuracy was 0.0001 kcal mol−1. The atom-based method was used to calculate the van der Waals force. The time step was 1 fs, the molecular dynamics data were collected every 500 steps, and the trajectory file was analyzed. To characterize the motion ability of the molecules, the mean square displacement (MSD) of the molecular motion was first obtained. MSD is a measure of the average molecular motion distance. Then, the diffusion coefficient (D) was calculated by the mean square displacement of the molecule, which is defined as
D = 1 6 lim t d d t i = 1 N | r t r 0 | 2
In this equation, r t r 0 represents the vector distance of a molecule moving from the initial position to the position at time t. In this system, the derivative of the sum of squares of the vector distance of N molecules to time is proportional to the diffusion coefficient of molecules. Figure 11 shows the changes of the MSD of DMSO and β-HMX with time in the crystallization system with or without PVA at different temperatures. Figure 12 shows the variation of the D of DMSO and β-HMX in the crystallization system with and without PVA at different temperatures. Figure 13 shows the dynamic equilibrium trajectory of the crystallization system at 400 ps at different temperatures.
It can be seen from Figure 11 that the MSD curve of the DMSO molecules was very obvious at a low temperature of 298 K and a high temperature of 378 K without adding polymer, while the curves of an intermediate temperature are mixed, indicating that the diffusion ability of DMSO is not sensitive to temperature at intermediate temperatures. This characteristic is obviously different from the diffusion characteristics after adding polymer. After the addition of polymer, the diffusion coefficient of DMSO molecules increased significantly with the increase in temperature.
When the polymer was not added, the diffusion ability of HMX molecules increased first, then decreased, and then increased with the increase in temperature. It is worth noting that the inflection point of the curve is about 338 K, when the solution temperature was relatively high, the crystal growth rate was relatively fast, and the solute diffusion ability was relatively low, that is, the crystal nucleation rate was relatively low. Therefore, the crystallization of β-HMX at 338 K may be beneficial for obtaining large crystals quickly.
By comparing the two diffusion coefficient diagrams of the solution and solute in Figure 12, it can be seen that the black curves are basically below the red curves. It can be concluded that the polymer additive PVA may have affected the transport process of the solvent and solute in the crystallization process of β-HMX crystal. This effect blocked the movement of the solvent and solute molecules to the crystal surface, and it can be seen from the diagram that the degree of obstruction to the solvent and solute was different at different temperatures.
It can be observed by comparing Figure 10 and Figure 13 that when the equilibrium state was reached, the polymer PVA was adsorbed on the crystal surface, and the density of the solute HMX molecules near the polymer PVA molecules was significantly higher than that at other positions. This indicates that the diffusion of PVA molecules on the {1 0 0} crystal plane to HMX molecules not only had a steric hindrance effect but also had a strong attraction effect.

4. Conclusions

In this study, the crystal morphology and packing structure of the main surface of β-HMX in the vacuum were investigated by using the attachment energy model. The molecular dynamics method was used to study the optimal polymer chain length, which can reflect the effect of additives on crystal morphology on a short time scale. On this basis, the crystal morphologies of two additives were simulated and verified by experiments, which proved the accuracy of the model. In addition, the influence of water on the morphology of β-HMX crystal and the motion characteristics of molecules on the crystal surface in the presence of polymer additives were simulated. The results of this work can be summarized as follows:
(1)
The crystal morphology of β-HMX in a vacuum obtained by the attachment energy model shows that the areas of the main crystal planes were {0 1 1} > {1 1 −1} > {0 2 0} > {1 0 0} > {1 0 −2}. The {1 0 0} plane had the largest polarity and uneven surface because the nitro groups were perpendicular to the crystal surface and the structure was loose with voids.
(2)
The simulation results of the β-HMX crystal morphology in the presence of water were compared with the experimental results, indicating that a small amount of water affected the size of the {1 0 0} plane, and the {1 0 0} plane disappeared completely in the presence of a large amount of water.
(3)
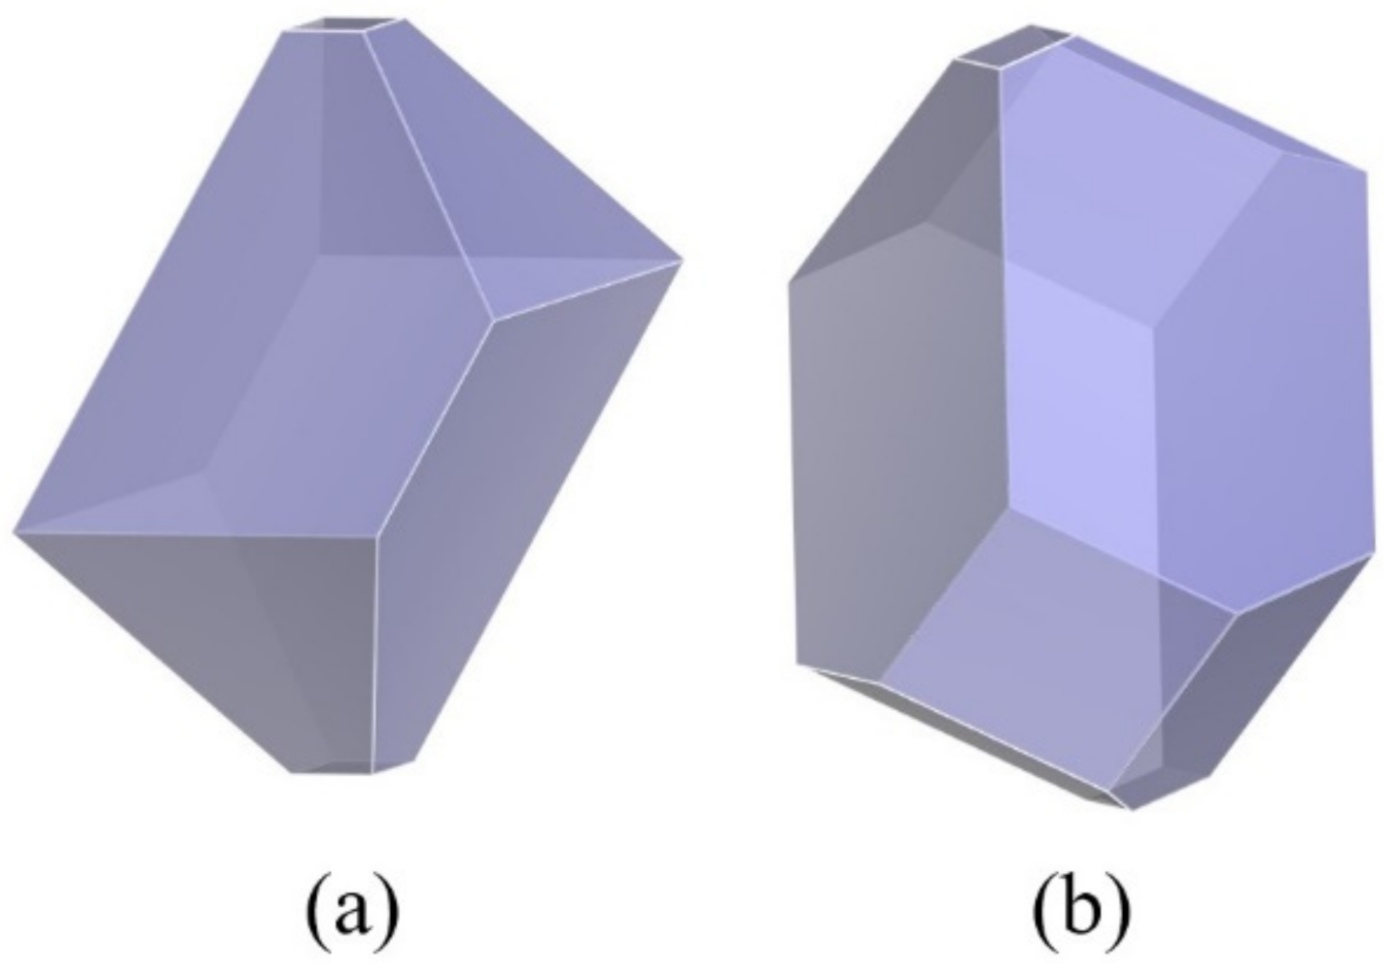
The interaction of the solvent box composed of solvent DMSO and polymer PVA with different chain lengths on different crystal faces of β-HMX was studied, and the crystal morphology was predicted. The results show that the relative molecular mass of the polymer additive was 5% of the solvent mass, and the modification effect of the additive on the crystal morphology could be observed in the simulation calculation.
(4)
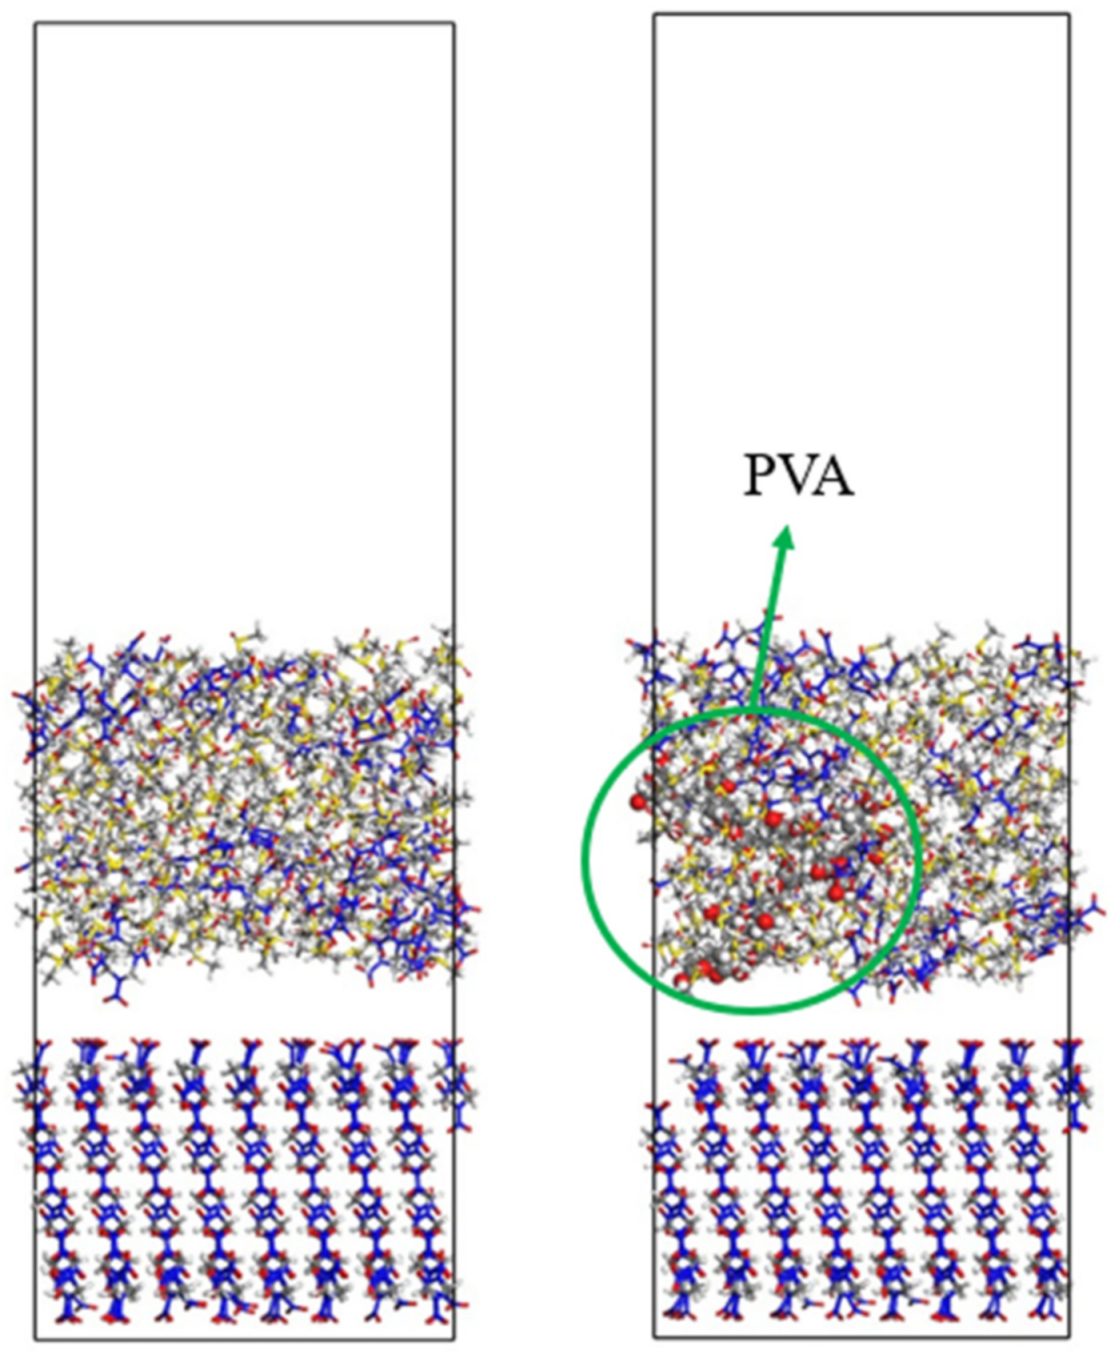
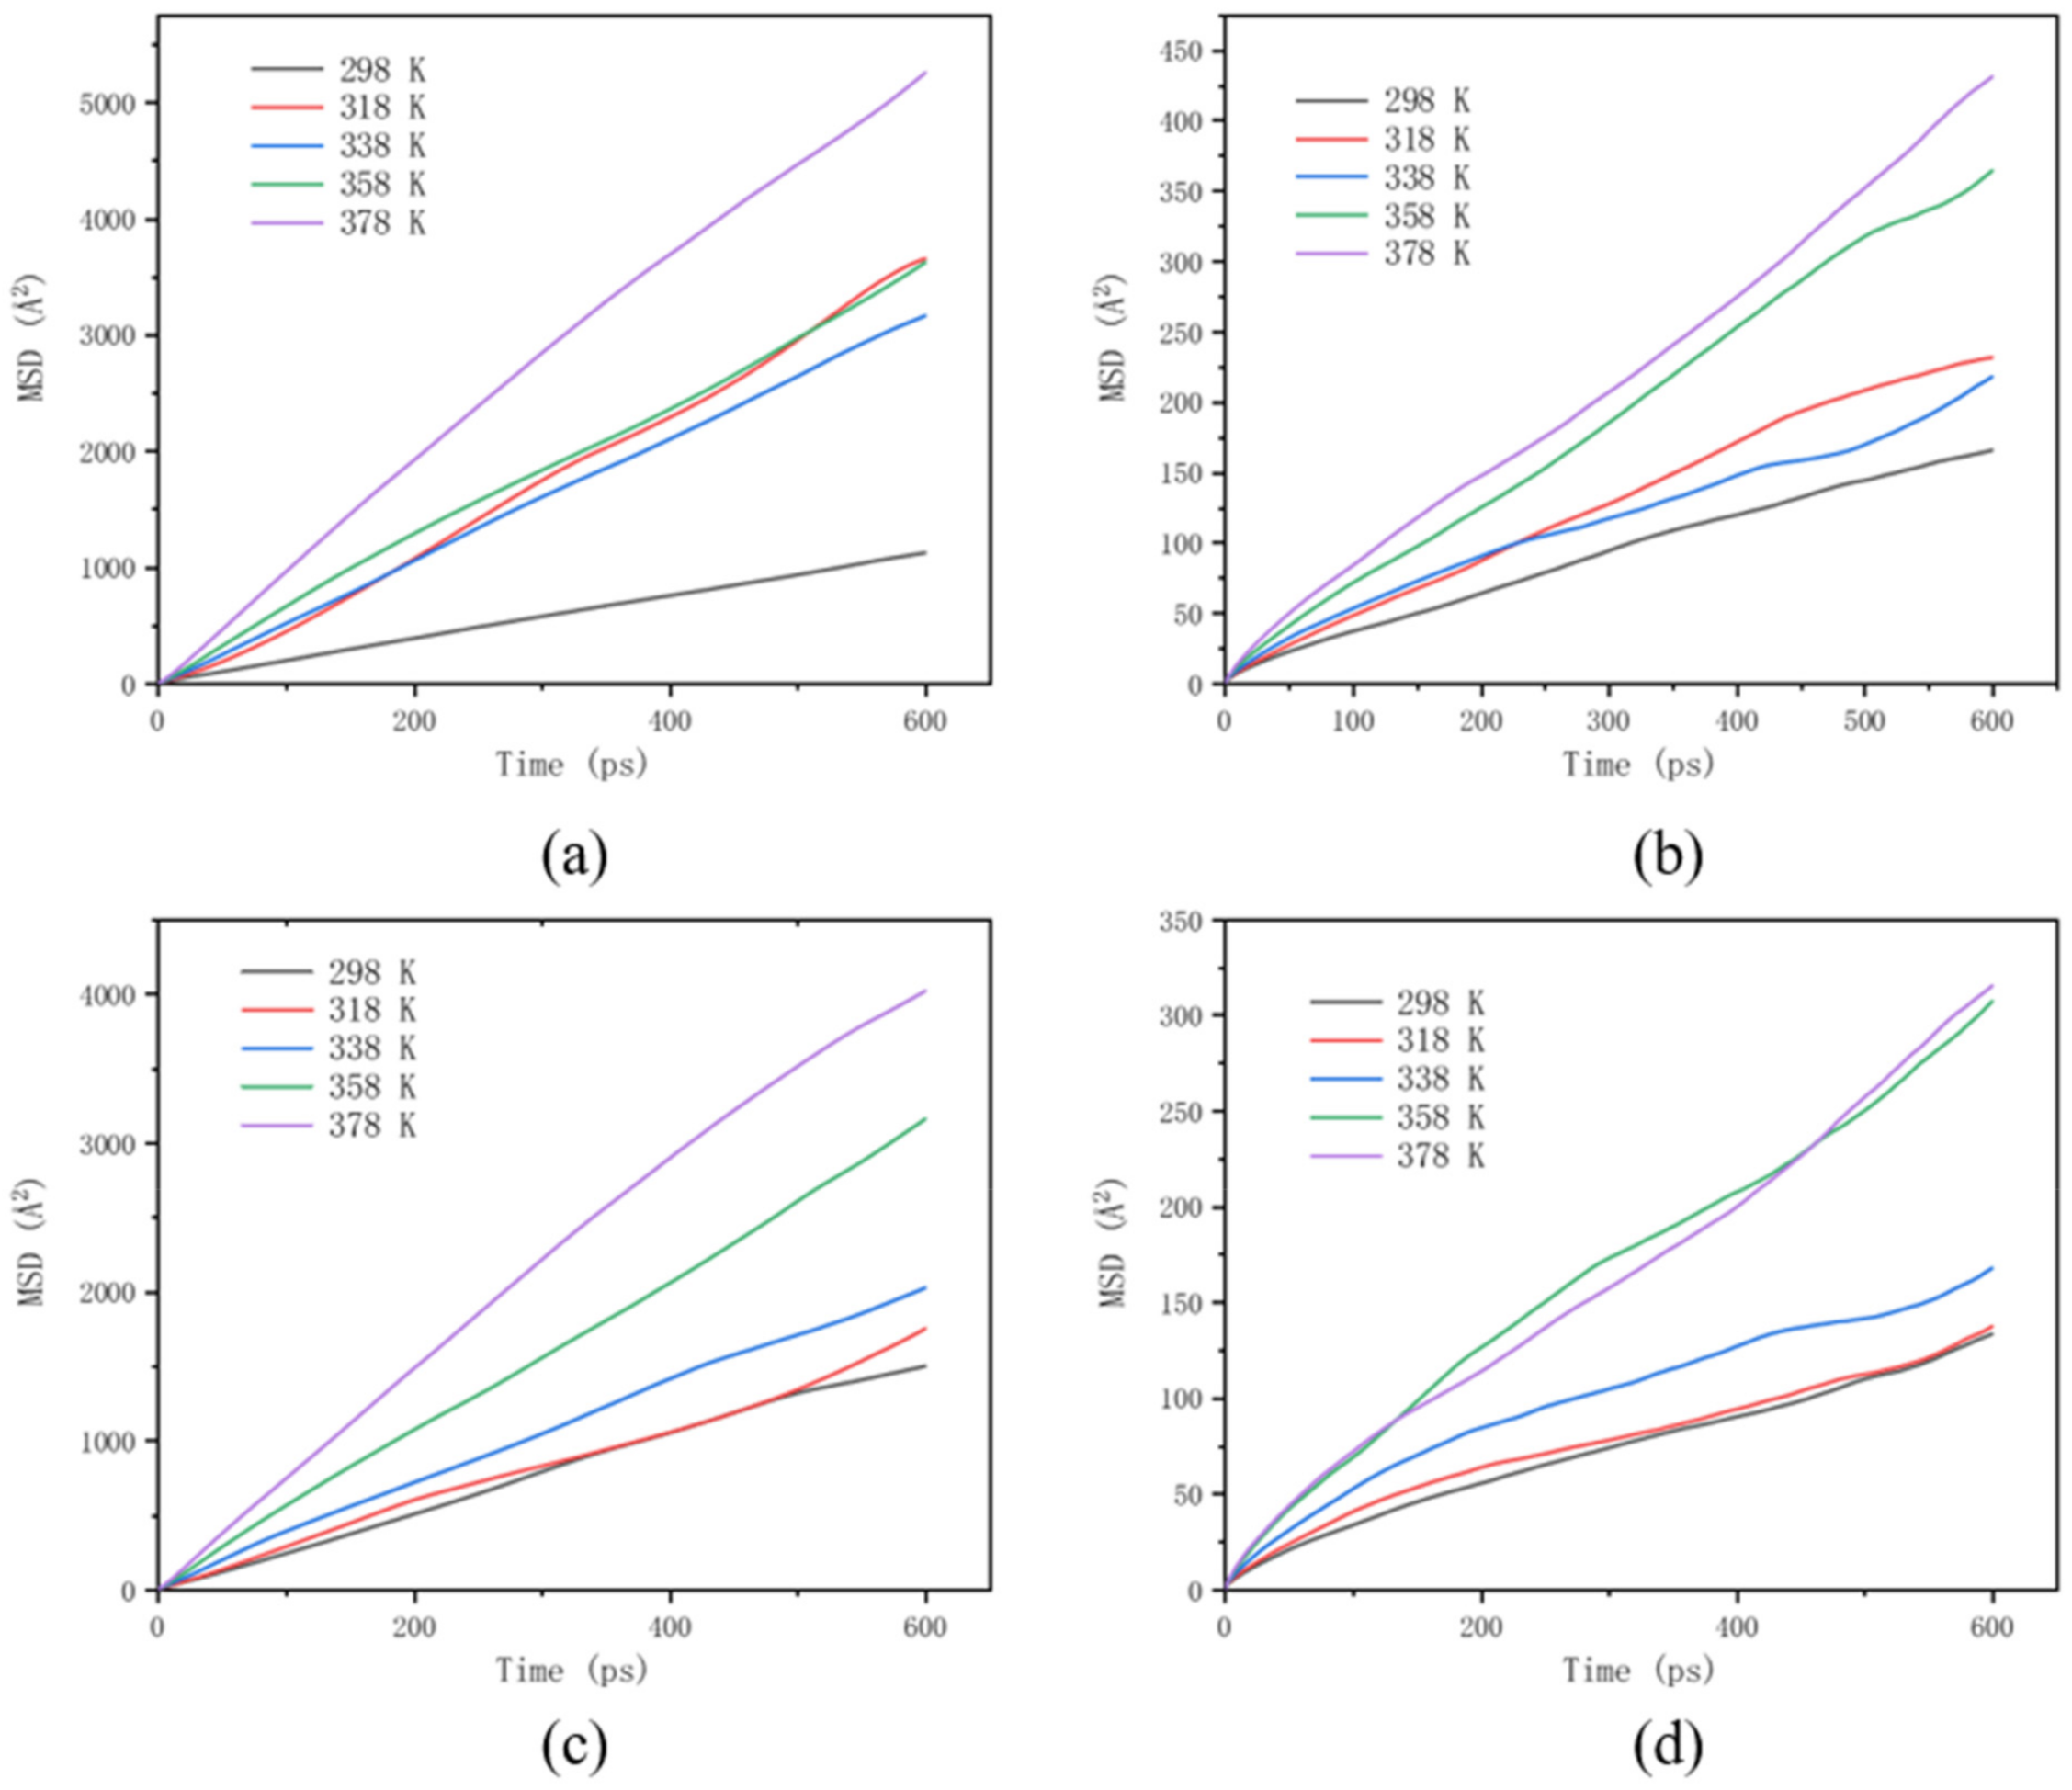
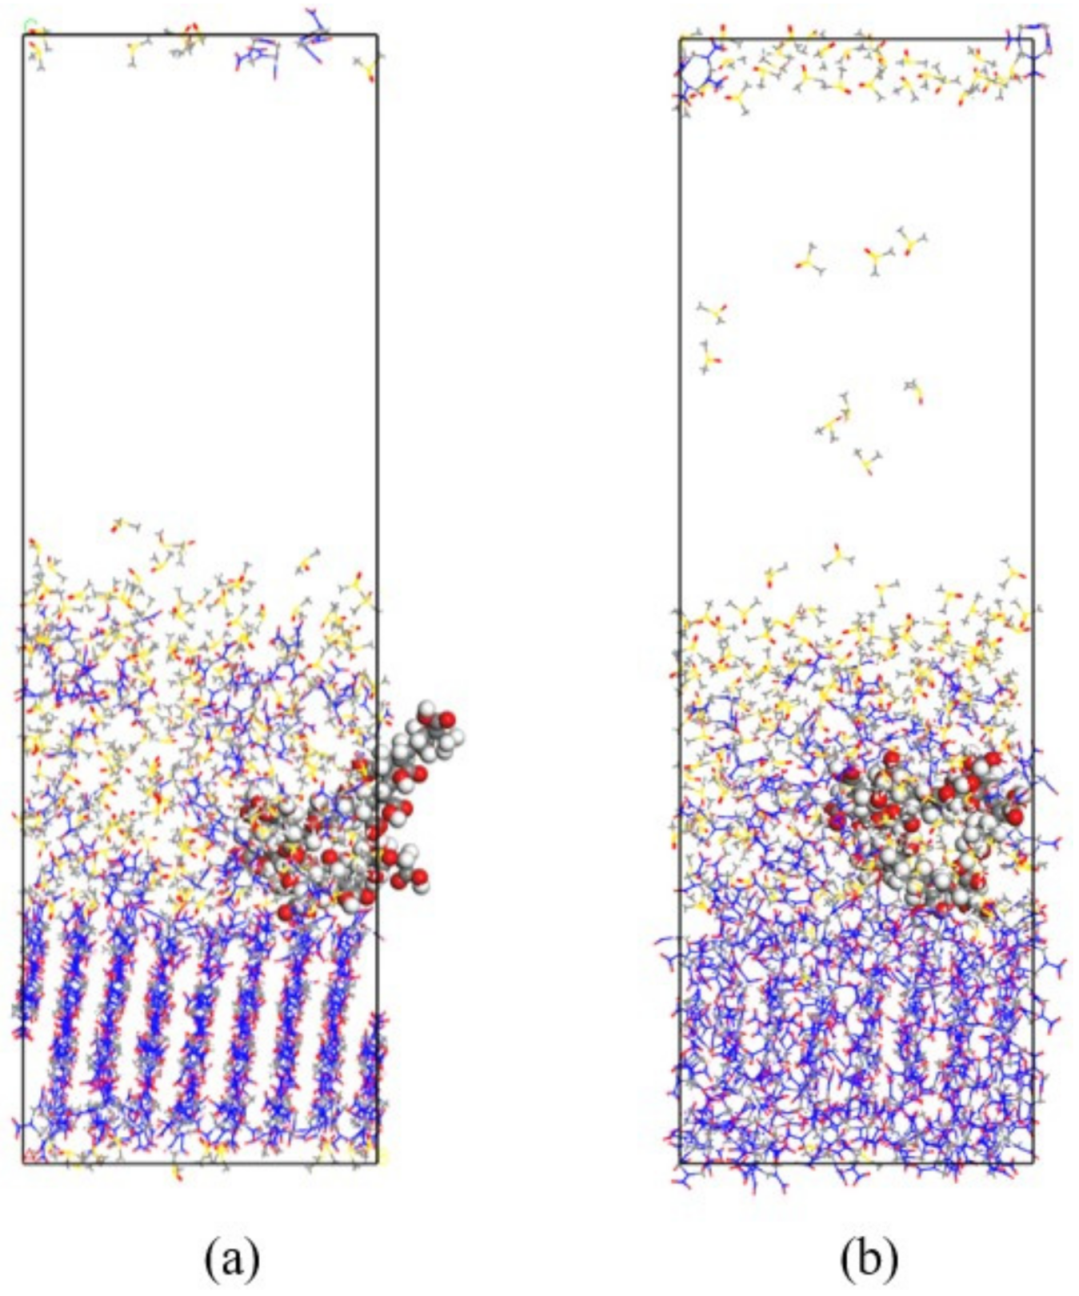
The crystal morphology of β-HMX in the presence of two additives was simulated and predicted, and the molecular dynamics characteristics of solute and solvent molecules in the crystallization process were studied. The results show that PVA blocked the movement of solvent and solute molecules, which may have affected the transport process and even the crystal morphology.
This research work was a simulation of the experiment, and the research results have certain reference significance for the study of crystal morphology.

Author Contributions

Conceptualization, L.Z. and X.Z.; formal analysis, L.Z. and S.Q.; investigation, L.Z. and X.Z.; visualization, L.Z., Y.L. and S.Q.; writing—original draft, L.Z. and S.Q.; project administration, J.R. and X.Z.; supervision, X.Z.; writing—review & editing, X.Z.; funding acquisition, X.Z. All authors have read and agreed to the published version of the manuscript.

Funding

This research received no external funding.

Institutional Review Board Statement

Not applicable.

Informed Consent Statement

Not applicable.

Data Availability Statement

Data available on request due to restrictions, that is, privacy or ethical restrictions.

Acknowledgments

Thanks to all members of the research group for their support.

Conflicts of Interest

The authors declare no conflict of interest.

References

  1. Naya, T.; Kohga, M. Influences of particle size and content of HMX on burning characteristics of HMX-based propellant. Aerosp. Sci. Technol. 2013, 27, 209–215. [Google Scholar] [CrossRef]
  2. Samudre, S.S.; Nair, U.R.; Gore, G.M.; Sinha, R.K.; Sikder, A.K.; Asthana, S.N. Studies on an Improved Plastic Bonded Explosive (PBX) for Shaped Charges. Propellants Explos. Pyrotech. 2009, 34, 145–150. [Google Scholar] [CrossRef]
  3. Vadhe, P.P.; Pawar, R.B.; Sinha, R.K.; Asthana, S.N.; Rao, A.S. Cast aluminized explosives (review). Combust. Explos. Shock Waves 2008, 44, 461–477. [Google Scholar] [CrossRef]
  4. Pereverzev, A.; Sewell, T. Elastic Coefficients of β-HMX as Functions of Pressure and Temperature from Molecular Dynamics. Cryst. 2020, 10, 1123. [Google Scholar] [CrossRef]
  5. Burch, A.C.; Yeager, J.D.; Bahr, D.F. Nanoindentation of HMX and Idoxuridine to Determine Mechanical Similarity. Crystals 2017, 7, 335. [Google Scholar] [CrossRef] [Green Version]
  6. Wang, D.-X.; Chen, S.-S.; Li, Y.-Y.; Yang, J.-Y.; Wei, T.-Y.; Jin, S.-H. An Investigation into the Effects of Additives on Crystal Characteristics and Impact Sensitivity of RDX. J. Energetic Mater. 2013, 32, 184–198. [Google Scholar] [CrossRef]
  7. Rane, C.V.; Ekambara, K.; Joshi, J.B.; Ramkrishna, D. Effect of impeller design and power consumption on crystal size distribution. AIChE J. 2014, 60, 3596–3613. [Google Scholar] [CrossRef]
  8. Duan, X.H.; Li, W.P.; Pei, C.H.; Zhou, X.Q. Molecular dynamics simulations of void defects in the energetic material HMX. J. Mol. Model. 2013, 19, 3893–3899. [Google Scholar] [CrossRef]
  9. Guillevic, M.; Pichot, V.; Cooper, J.; Coquerel, G.; Borne, L.; Spitzer, D. Optimization of an Antisolvent Method for RDX Recrystallization: Influence on Particle Size and Internal Defects. Cryst. Growth Des. 2019, 20, 130–138. [Google Scholar] [CrossRef]
  10. Dreger, Z.A.; Gupta, Y.M. Raman spectroscopy of high-pressure− high-temperature polymorph of hexahydro-1, 3, 5-trinitro-1, 3, 5-triazine (ε-RDX). J. Phys. Chem. A 2010, 114, 7038–7047. [Google Scholar] [CrossRef]
  11. Sabatini, J.J.; Oyler, K.D. Recent Advances in the Synthesis of High Explosive Materials. Crystals 2015, 6, 5. [Google Scholar] [CrossRef] [Green Version]
  12. Wang, L.; Chen, D.; Yu, Y.; Li, H. Solubility of Octahydro-1,3,5,7-tetranitro-1,3,5,7-tetrazocine in 12 Pure Organic Solvents from 298.15 to 358.15 K. J. Chem. Eng. Data 2020, 65, 2098–2108. [Google Scholar] [CrossRef]
  13. Chen, F.; Zhou, T.; Wang, M. Spheroidal crystal morphology of RDX in mixed solvent systems predicted by molecular dynamics. J. Phys. Chem. Solids 2019, 136, 109196. [Google Scholar] [CrossRef]
  14. Zhang, C.; Ji, C.; Li, H.; Zhou, Y.; Xu, J.; Xu, R.; Li, J.; Luo, Y. Occupancy Model for Predicting the Crystal Morphologies Influenced by Solvents and Temperature, and Its Application to Nitroamine Explosives. Cryst. Growth Des. 2013, 13, 282–290. [Google Scholar] [CrossRef]
  15. Kim, C.-K.; Lee, B.-C.; Lee, Y.-W.; Kim, H.S. Solvent effect on particle morphology in recrystallization of HMX (cyclotetramethylenetetranitramine) using supercritical carbon dioxide as antisolvent. Korean J. Chem. Eng. 2009, 26, 1125–1129. [Google Scholar] [CrossRef]
  16. Sivabalan, R.; Gore, G.; Nair, U.; Saikia, A.; Venugopalan, S.; Gandhe, B. Study on ultrasound assisted precipitation of CL-20 and its effect on morphology and sensitivity. J. Hazard. Mater. 2007, 139, 199–203. [Google Scholar] [CrossRef]
  17. Sun, J.-K.; Sobolev, Y.I.; Zhang, W.; Zhuang, Q.; Grzybowski, B.A. Enhancing crystal growth using polyelectrolyte solutions and shear flow. Nature 2020, 579, 73–79. [Google Scholar] [CrossRef]
  18. Mao, X.; Song, X.; Lu, G.; Sun, Y.; Xu, Y.; Yu, J. Control of Crystal Morphology and Size of Calcium Sulfate Whiskers in Aqueous HCl Solutions by Additives: Experimental and Molecular Dynamics Simulation Studies. Ind. Eng. Chem. Res. 2015, 54, 4781–4787. [Google Scholar] [CrossRef]
  19. Taborga, P.; Brito, I.; Graber, T. Effect of additives on size and shape of lithium carbonate crystals. J. Cryst. Growth 2017, 460, 5–12. [Google Scholar] [CrossRef]
  20. Parambil, J.V.; Poornachary, S.K.; Tan, R.B.; Heng, J.Y. Influence of solvent polarity and supersaturation on template-induced nucleation of carbamazepine crystal polymorphs. J. Cryst. Growth 2017, 469, 84–90. [Google Scholar] [CrossRef]
  21. Cai, Z.; Liu, Y.; Song, Y.; Guan, G.; Jiang, Y. The effect of tailor-made additives on crystal growth of methyl paraben: Experiments and modelling. J. Cryst. Growth 2017, 461, 1–9. [Google Scholar] [CrossRef]
  22. Damiri, S.; Namvar, S.; Panahi, H. Micro-seeding and soft template effects on the control of polymorph and morphology of HMX micro particles in solvent-antisolvent process. Def. Technol. 2017, 13, 392–396. [Google Scholar] [CrossRef]
  23. Li, D.; Cai, J.; Guo, B.; Wei, N.; Liu, Q.; Liu, B. Controllable crystallization of urea crystal face (0 0 1) by molecular simulation. J. Cryst. Growth 2019, 524, 125139. [Google Scholar] [CrossRef]
  24. Lin, C.; Zeng, C.; Wen, Y.; Gong, F.; He, G.; Li, Y.; Yang, Z.; Ding, L.; Li, J.; Guo, S. Litchi-like Core–Shell HMX@HPW@PDA Microparticles for Polymer-Bonded Energetic Composites with Low Sensitivity and High Mechanical Properties. ACS Appl. Mater. Interfaces 2019, 12, 4002–4013. [Google Scholar] [CrossRef] [PubMed]
  25. Kosareva, E.K.; Zharkov, M.N.; Meerov, D.B.; Gainutdinov, R.V.; Fomenkov, I.V.; Zlotin, S.G.; Pivkina, A.N.; Kuchurov, I.V.; Muravyev, N.V. HMX surface modification with polymers via sc-CO2 antisolvent process: A way to safe and easy-to-handle energetic materials. Chem. Eng. J. 2021, 428, 131363. [Google Scholar] [CrossRef]
  26. Hartman, P.; Bennema, P. The attachment energy as a habit controlling factor. J. Cryst. Growth 1980, 49, 145–156. [Google Scholar] [CrossRef]
  27. Hartman, P. The attachment energy as a habit controlling factor: III. Application to corundum. J. Cryst. Growth 1980, 49, 166–170. [Google Scholar] [CrossRef]
  28. Duan, X.; Wei, C.; Liu, Y.; Pei, C. A molecular dynamics simulation of solvent effects on the crystal morphology of HMX. J. Hazard. Mater. 2010, 174, 175–180. [Google Scholar] [CrossRef]
  29. Liu, Y.; Niu, S.; Lai, W.; Yu, T.; Ma, Y.; Gao, H.; Zhao, F.; Ge, Z. Crystal morphology prediction of energetic materials grown from solution: Insights into the accurate calculation of attachment energies. CrystEngComm 2019, 21, 4910–4917. [Google Scholar] [CrossRef]
  30. Liu, Y.; Yu, T.; Lai, W.; Ma, Y.; Cao, Y.; Liu, N.; Ge, Z.; Zhao, F. Deciphering Solvent Effect on Crystal Growth of Energetic Materials for Accurate Morphology Prediction. Cryst. Growth Des. 2020, 20, 521–524. [Google Scholar] [CrossRef]
  31. Yan, T.; Wang, J.-H.; Liu, Y.-C.; Zhao, J.; Yuan, J.-M.; Guo, J.-H. Growth and morphology of 1,3,5,7-tetranitro-1,3,5,7-tetraazacy-clooct ane (HMX) crystal. J. Cryst. Growth 2015, 430, 7–13. [Google Scholar] [CrossRef]
  32. Chen, G.; Xia, M.; Lei, W.; Wang, F.; Gong, X. Prediction of Crystal Morphology of Cyclotrimethylene Trinitramine in the Solvent Medium by Computer Simulation: A Case of Cyclohexanone Solvent. J. Phys. Chem. A 2014, 118, 11471–11478. [Google Scholar] [CrossRef] [PubMed]
  33. Chen, G.; Xia, M.; Lei, W.; Wang, F.; Gong, X. Molecular dynamics investigation of the effect of solvent adsorption on crystal habits of hexogen. Can. J. Chem. 2014, 92, 849–854. [Google Scholar] [CrossRef]
  34. Choi, C.S.; Boutin, H.P. A study of the crystal structure of β-cyclotetramethylene tetranitramine by neutron diffraction. Acta Crystallogr. Sect. B Struct. Crystallogr. Cryst. Chem. 1970, 26, 1235–1240. [Google Scholar] [CrossRef]
  35. Sun, H. COMPASS: An ab Initio Force-Field Optimized for Condensed-Phase ApplicationsOverview with Details on Alkane and Benzene Compounds. J. Phys. Chem. B 1998, 102, 7338–7364. [Google Scholar] [CrossRef]
  36. Li, J.; Jin, S.; Lan, G.; Xu, Z.; Wu, N.; Chen, S.; Li, L. The effect of solution conditions on the crystal morphology of β-HMX by molecular dynamics simulations. J. Cryst. Growth 2019, 507, 38–45. [Google Scholar] [CrossRef]
  37. Lei, W.; Dong, C.; Li, H.-Z.; Duan, X.-H.; Yu, Y.-W. Crystal Morphology of β—HMX under Eight Solvents System Using Molecular Dynamics Simulation and Experiment. Chinese J. Energetic Mater. 2020, 28, 317–329. [Google Scholar] [CrossRef]
  38. Wang, L. Study on the crystallization thermodynamics and crystal morphology control of HMX. Ph.D. Thesis, North University of China, Taiyuan, China, 2020. [Google Scholar]
Figure 1. The modeling process of {1 1 −1} crystal plane in DMSO–water binary solvent.
Crystals 12 00164 g001
Figure 2. Crystal morphology of β-HMX in a vacuum by AE model.
Crystals 12 00164 g002
Figure 3. Packing structure and solvent accessible surface of different crystal planes. (a) {1 0 −2} plane, (b) {0 1 1} plane, (c) {1 1 −1} plane, (d) {0 2 0} plane, and (e) {1 0 0} plane.
Crystals 12 00164 g003
Figure 4. Crystal morphology simulation diagram of β-HMX in DMSO–water system with different mass fractions of water. (a) 0%, (b) 5%, (c) 10%, (d) 15%, and (e) 20%.
Crystals 12 00164 g004
Figure 5. Morphology of β-HMX crystals obtained from DMSO by cooling [37].
Crystals 12 00164 g005
Figure 6. Additive conformations. (a) PAA, (b) PEI, and (c) PVA.
Crystals 12 00164 g006
Figure 7. Simulation of β-HMX crystal morphology in PVA–DMSO system with different mass fractions of PVA at 298 K. (a) 0.5%, (b) 1%, (c) 3%, (d) 5%, and (e) 10%.
Crystals 12 00164 g007
Figure 8. Crystal morphology of β-HMX induced by additives PAA, PEI, and PVA at 298 K (a) PAA-induced, (b) PEI-induced, and (c) PVA-induced [38].
Crystals 12 00164 g008
Figure 9. Simulation of β-HMX crystal morphology in PAA–DMSO and PEI–DMSO systems with the mass fraction of 10% at 298 K. (a) PAA-induced, (b) PEI-induced.
Crystals 12 00164 g009
Figure 10. Modeling process of the effect of additives on solvent and solute movement in the crystallization process.
Crystals 12 00164 g010
Figure 11. The changes of MSD of DMSO and β-HMX with time in the crystallization system with or without PVA at different temperatures. (a) DMSO–MSD (with no polymer), (b) HMX–MSD (with no polymer), (c) DMSO–MSD (with polymer), and (d) HMX–MSD (with polymer).
Crystals 12 00164 g011
Figure 12. The variation of D of DMSO and β-HMX in the crystallization system with and without PVA at different temperatures. (a) The changing trend of D of DMSO with temperature in the presence of PVA or not, and (b) The changing trend of D of HMX with temperature in the presence of PVA or not.
Crystals 12 00164 g012
Figure 13. The dynamic equilibrium trajectory of the crystallization system at 400 ps at different temperatures. (a) 357 K and (b) 378 K.
Crystals 12 00164 g013
Table 1. Extending the size of β-HMX supercells.
Abox/Å2a/Åb/Åc/ÅU × VThickness
{0 1 1}1237.6938.5432.3423.863 × 54
{0 2 0}1209.7138.1732.3421.125 × 54
{1 1 −1}1388.1738.1736.5722.275 × 34
{1 0 0}1482.8441.3335.8823.984 × 44
{1 0 −2}1357.1641.3332.8321.394 × 35
Table 2. Parameters of the main growth surface of β-HMX in a vacuum.
hkldhklSurface Area/Å2Eatt(Total)/kcal·mol−1Multiplicity% Total Facet Area
{0 1 1}6.0386.21−23.35462.28
{0 2 0}5.5347.00−34.8025.55
{1 1 −1}5.5294.04−36.58429.83
{1 0 0}5.4096.14−48.6421.26
{1 0 −2}4.32120.30−39.9721.08
Table 3. Aacc, Ahkl, and corresponding S values of different β-HMX crystal planes.
hklAacc/Å2Ahkl2S
{0 1 1}111.9081.541.37
{0 2 0}65.6447.231.39
{1 1 −1}134.1091.741.46
{1 0 0}192.2185.942.24
{1 0 −2}144.01107.581.34
Table 4. Interaction energies and crystal habits of β-HMX in DMSO–water system with different mass fractions of water at 298 K.
RatioE/kcal·mol−1{0 1 1}{1 1 −1}{1 0 0}{0 2 0}{1 0 −2}
0.00Etot−30,766.54−30,578.96−32,430.80−25,877.68−30,658.02
Esur−28,283.68−28,068.28−29,823.86−23,358.82−28,163.40
Esol−2237.60−2206.11−2106.37−2238.73−2213.12
Eint−245.26−304.57−500.57−280.13−281.50
Eatt-s−7.04−9.159.52−24.86−17.64
Area percent (%)60.1631.058.790.000.00
Aspect ratio1.80 Volume/Å33314.45
0.05Etot−31,352.37−31,214.67−33,032.86−26,434.76−31,265.86
Esur−28,484.00−28,323.34−30,043.34−23,557.29−28,370.54
Esol−2603.56−2572.19−2460.07−2579.37−2591.87
Eint−264.81−319.14−529.45−298.10−303.45
Eatt-s−5.20−7.6513.39−23.86−15.32
Area percent (%)67.2132.790.000.000.00
Aspect ratio2.36 Volume/Å31663.01
0.10Etot−31,813.00−31,698.93−33,477.33−26,942.03−31,715.94
Esur−28,484.94−28,317.79−30,044.89−23,576.53−28,371.33
Esol−3057.15−3041.24−2891.98−3072.08−3024.44
Eint−270.91−339.90−540.46−293.42−320.17
Eatt-s−4.62−5.5014.86−24.12−13.56
Area percent (%)59.8040.200.000.000.00
Aspect ratio2.08 Volume/Å3889.45
0.15Etot−32,383.64−32,222.03−34,042.98−27,493.64−32,260.99
Esur−28,480.75−28,315.91−30,043.96−23,564.87−28,365.82
Esol−3636.43−3549.40−3484.65−3632.15−3563.79
Eint−266.46−356.72−514.37−296.62−331.38
Eatt-s−5.04−3.7611.37−23.94−12.38
Area percent (%)39.0660.940.000.000.00
Aspect ratio2.26 Volume/Å3581.85
0.20Etot−33,017.37−32,842.52−34,628.74−28,081.06−32,899.70
Esur−28,490.71−28,319.10−30,037.15−23,566.42−28,379.70
Esol−4245.34−4178.96−4069.64−4204.66−4197.7
Eint−281.32−344.46−521.95−309.99−322.22
Eatt-s−3.64−5.0312.38−23.20−13.34
Area percent (%)65.1734.830.000.000.00
Aspect ratio2.27 Volume/Å3527.47
Table 5. Interaction energies and crystal habits of β-HMX in PVA–DMSO system with different mass fractions of PVA at 298 K.
Ratio (%)E/kcal·mol−1{0 1 1}{1 1 −1}{1 0 0}{0 2 0}{1 0 −2}
0.5%Etot−30,880.20−30,740.17−32,542.29−26,010.75−30,775.20
Esur−28,348.79−28,180.18−29,887.28−23,454.63−28,223.37
Esol−2287.13−2248.49−2152.38−2270.38−2271.17
Eint−244.28−311.50−502.63−285.74−280.66
Eatt-s−7.14−8.449.80−24.55−17.73
Area percent (%)57.1936.236.590.000.00
Aspect ratio1.74 Volume/Å33111.26
1%Etot−30,897.80−30,754.38−32,571.84−26,036.31−30,806.18
Esur−28,351.52−28,188.67−29,896.64−23,446.25−28,225.52
Esol−2295.01−2256.41−2177.98−2306.54−2292.15
Eint−251.26−309.30−497.22−283.52−288.51
Eatt-s−6.48−8.669.07−24.67−16.90
Area percent (%)61.4230.298.300.000.00
Aspect ratio1.83 Volume/Å32688.31
3%Etot−31,059.37−30,913.49−32,729.16−26,188.59−30,948.01
Esur−28,347.40−28,189.51−29,895.77−23,443.74−28,230.69
Esol−2456.37−2414.52−2337.52−2455.73−2426.53
Eint−255.60−309.46−495.87−289.11−290.79
Eatt-s−6.07−8.658.89−24.36−16.66
Area percent (%)63.7128.058.240.000.00
Aspect ratio1.91 Volume/Å32396.22
5%Etot−31,229.13−31,061.91−32,888.67−26,355.00−31,108.00
Esur−28,346.02−28,184.10−29,913.24−23,455.19−28,235.15
Esol−2630.58−2568.76−2499.61−2611.79−2585.25
Eint−252.53−309.05−475.82−288.01−287.60
Eatt-s−6.36−8.696.21−24.42−17.00
Area percent (%)58.0120.3221.670.000.00
Aspect ratio1.90 Volume/Å32200.81
10%Etot−31,579.84−31,416.35−33,214.59−26,710.83−31,479.70
Esur−28,346.54−28,185.63−29,899.95−23,450.45−28,226.09
Esol−2977.29−2919.23−2835.49−2975.52−2962.76
Eint−256.01−311.49−479.16−284.86−290.85
Eatt-s−6.03−8.446.66−24.59−16.65
Area percent (%)60.1922.2017.610.000.00
Aspect ratio1.89 Volume/Å32049.35
Table 6. Interaction energies and crystal habits of HMX in 10% additive at 298 K.
hkl{0 1 1}{1 1 −1}{1 0 0}{0 2 0}{1 0 −2}
PAAEtot−31,230.07−31,065.25−32,896.09−26,323.79−31,104.88
Esur−28,352.24−28,177.58−29,896.12−23,452.25−28,232.23
Esol−2626.28−2583.04−2478.41−2586.87−2591.39
Eint−251.55−304.64−521.57−284.67−281.26
Eatt-s−6.45−9.1512.33−24.61−17.66
Area percent (%)65.5232.791.690.000.00
Aspect ratio1.96 Volume/Å33015.05
PEIEtot−30,544.08−30,378.86−32,209.80−25,669.36−30,455.21
Esur−28,346.89−28,185.26−29,898.30−23,447.44−28,203.71
Esol−1934.56−1899.78−1813.94−1938.37−1903.81
Eint−262.64−293.82−497.56−283.56−347.69
Eatt-s−5.40−10.269.12−24.67−10.66
Area percent (%)71.4316.2010.800.001.58
Aspect ratio2.24 Volume/Å32317.52
Publisher’s Note: MDPI stays neutral with regard to jurisdictional claims in published maps and institutional affiliations.

