
Dielectric Properties of Liquid Crystal Polymer Substrates in the Region from 90 to 140 GHz

 , , and
Abstract
:1. Introduction
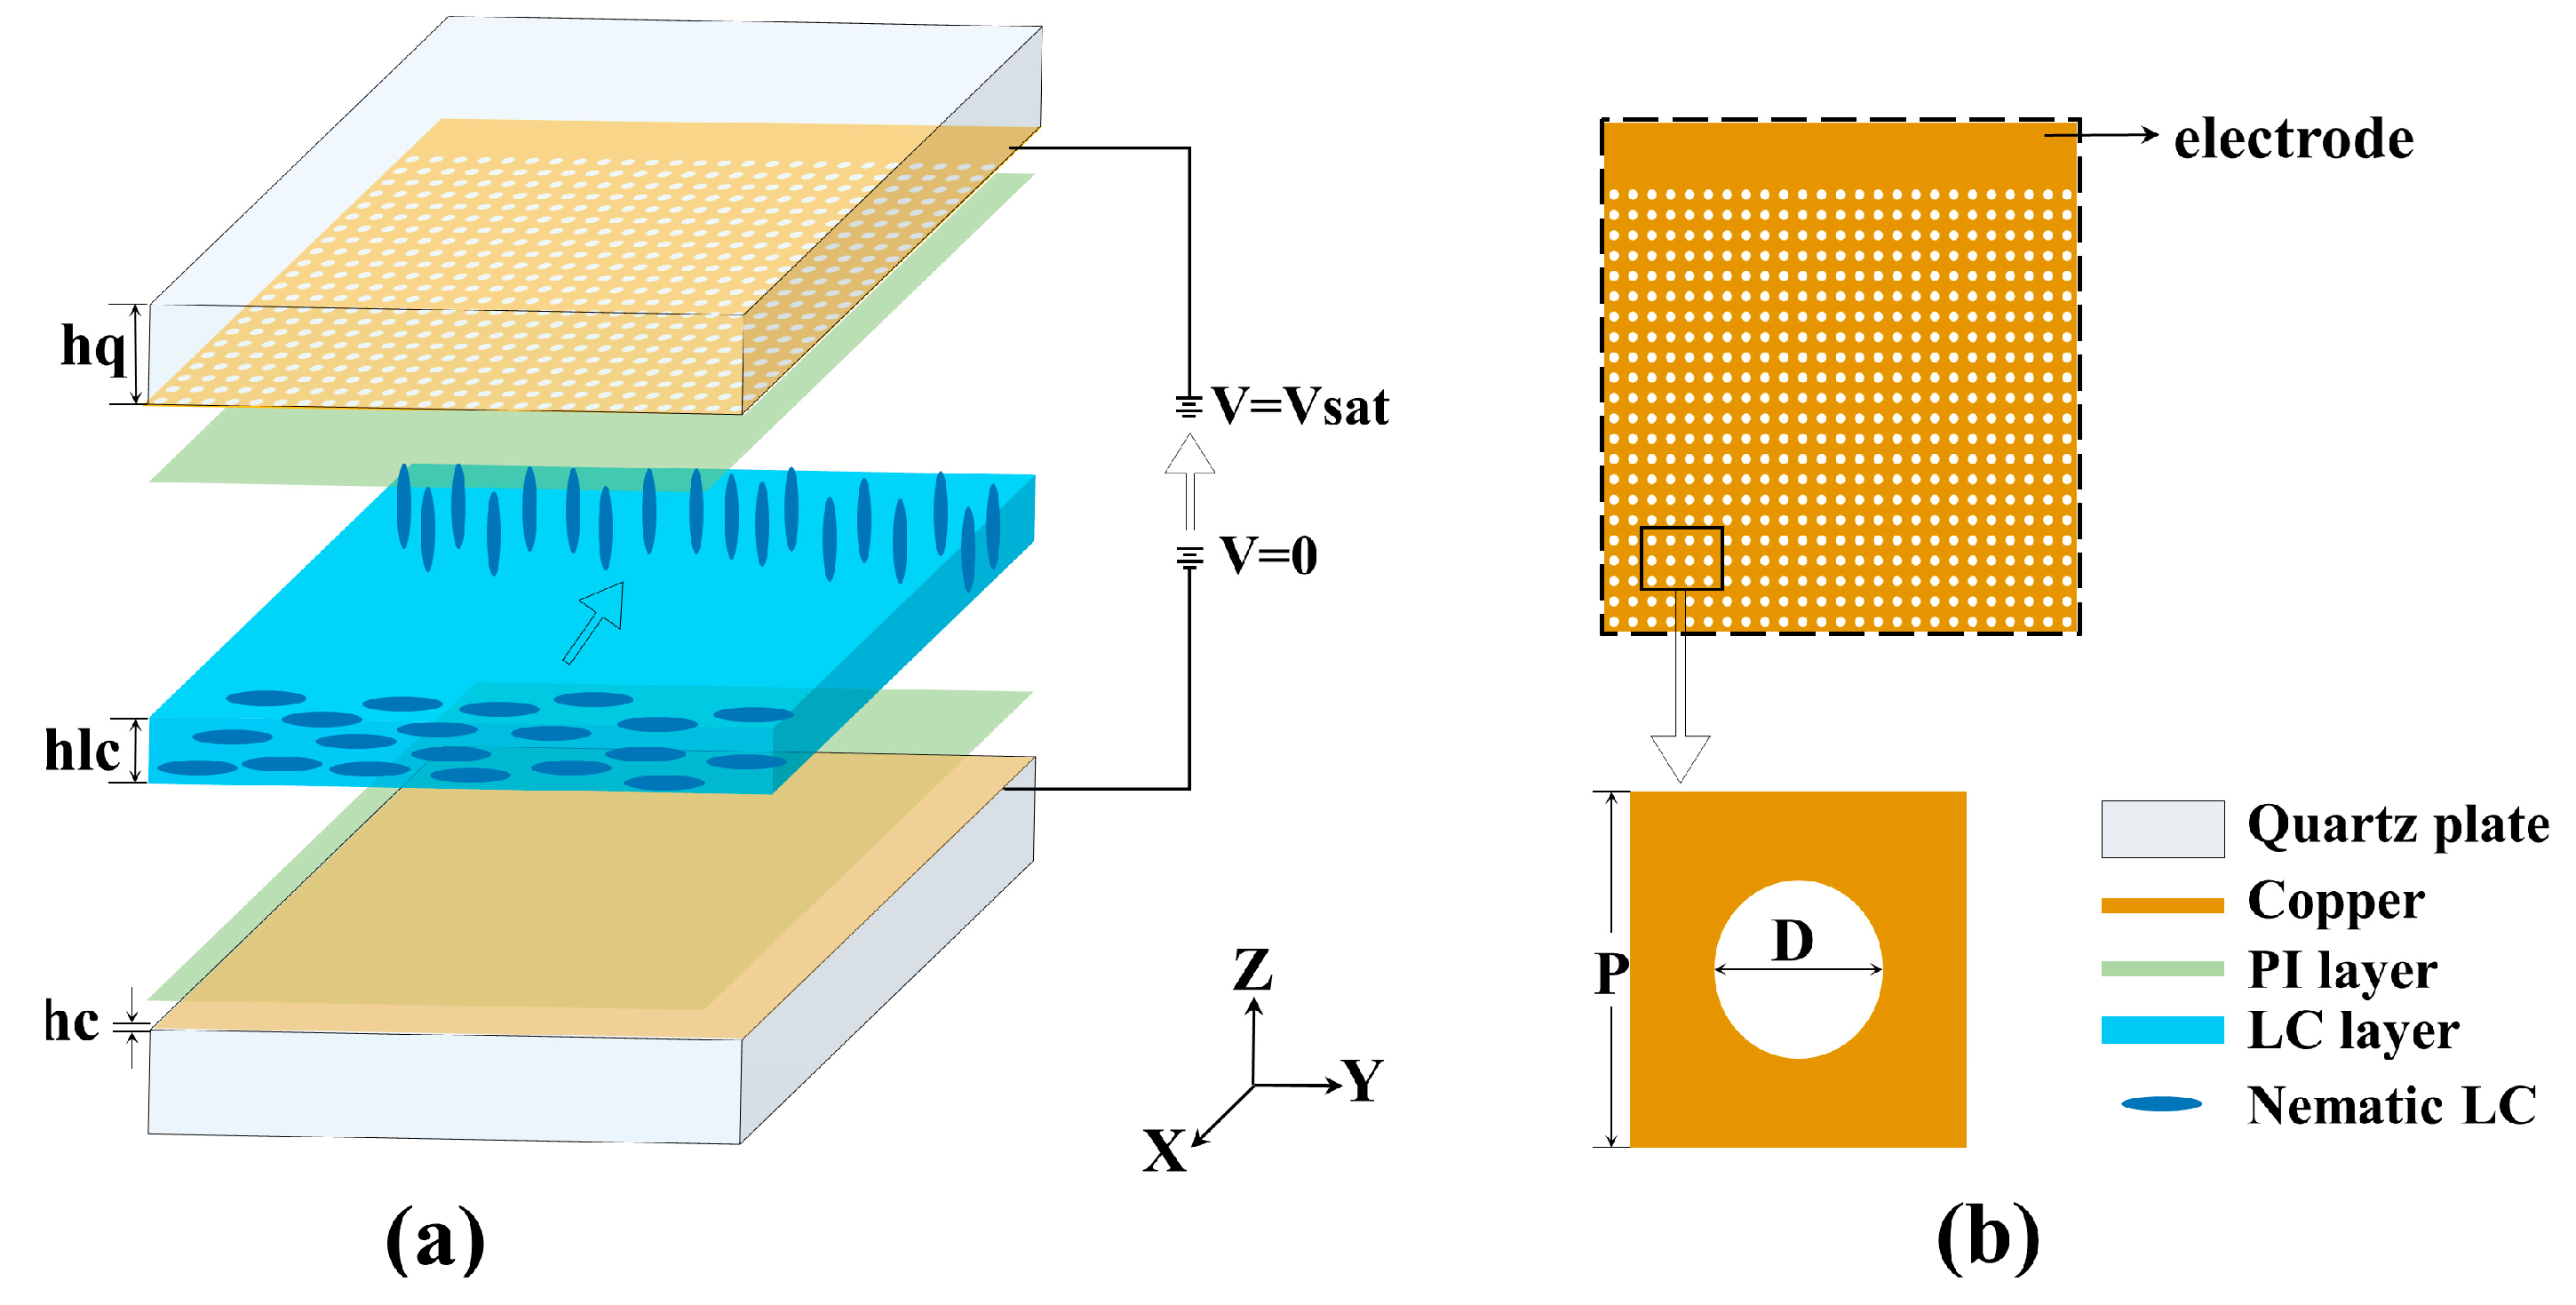
2. Methods
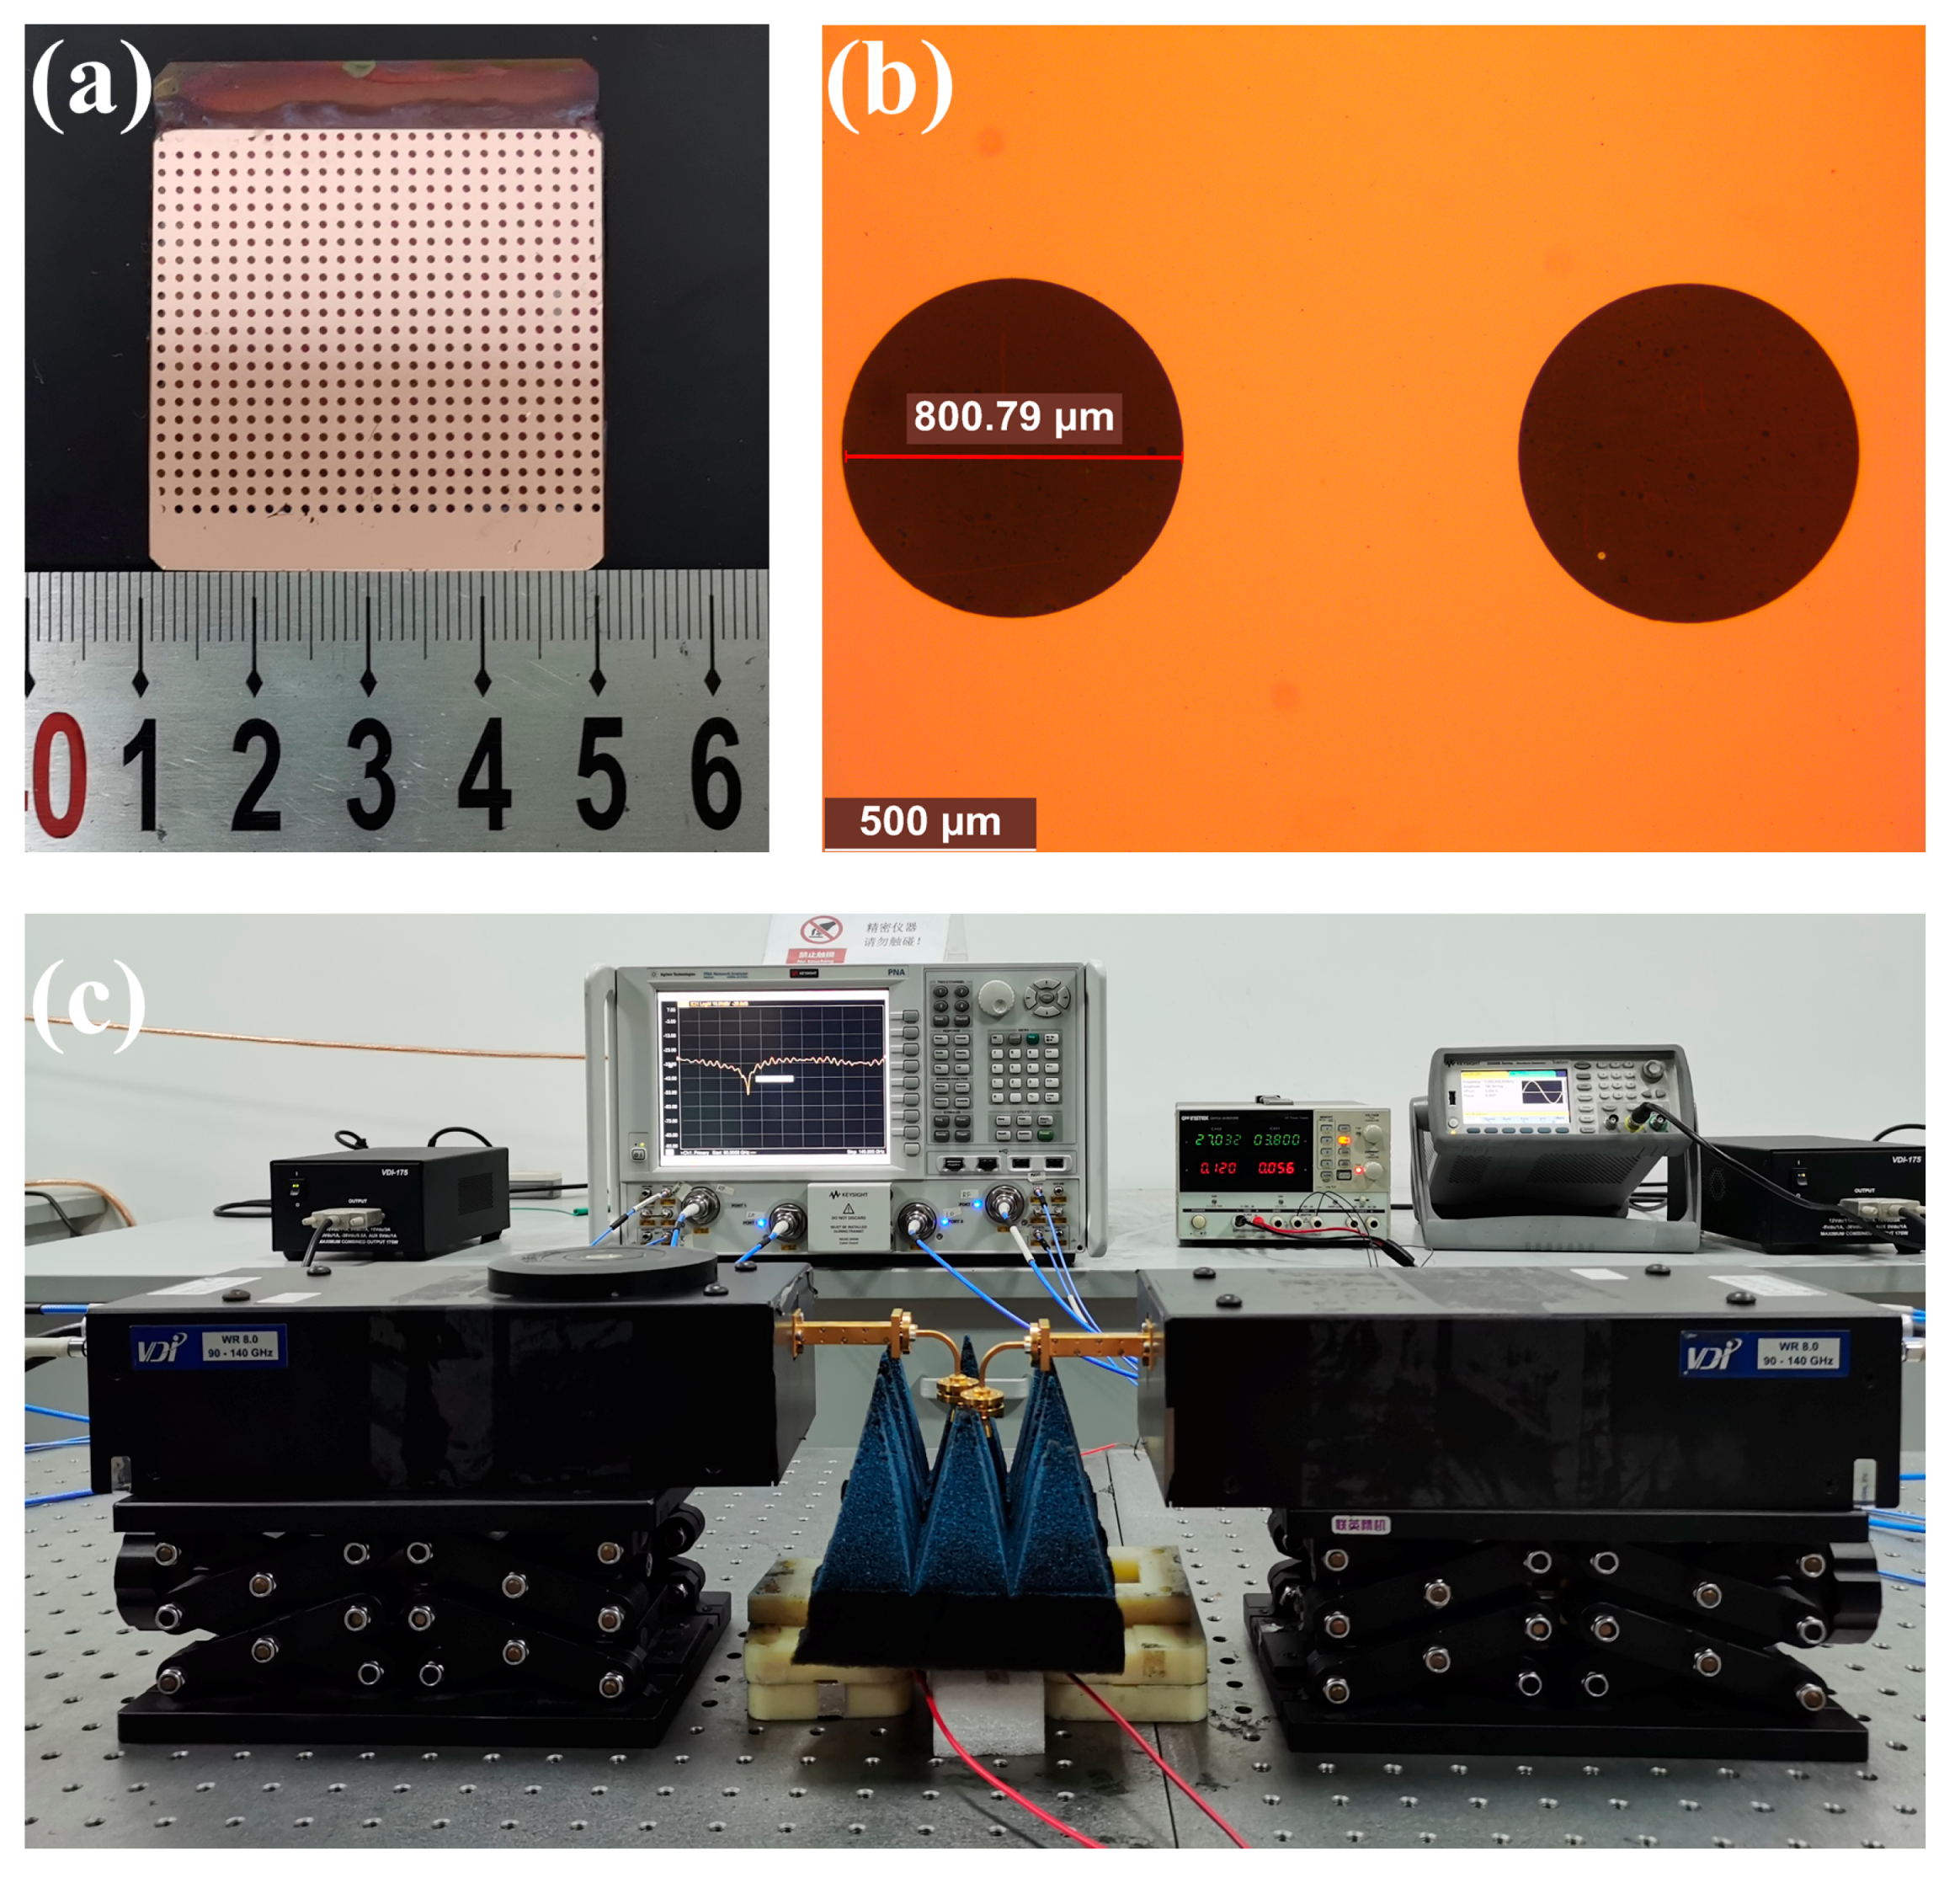
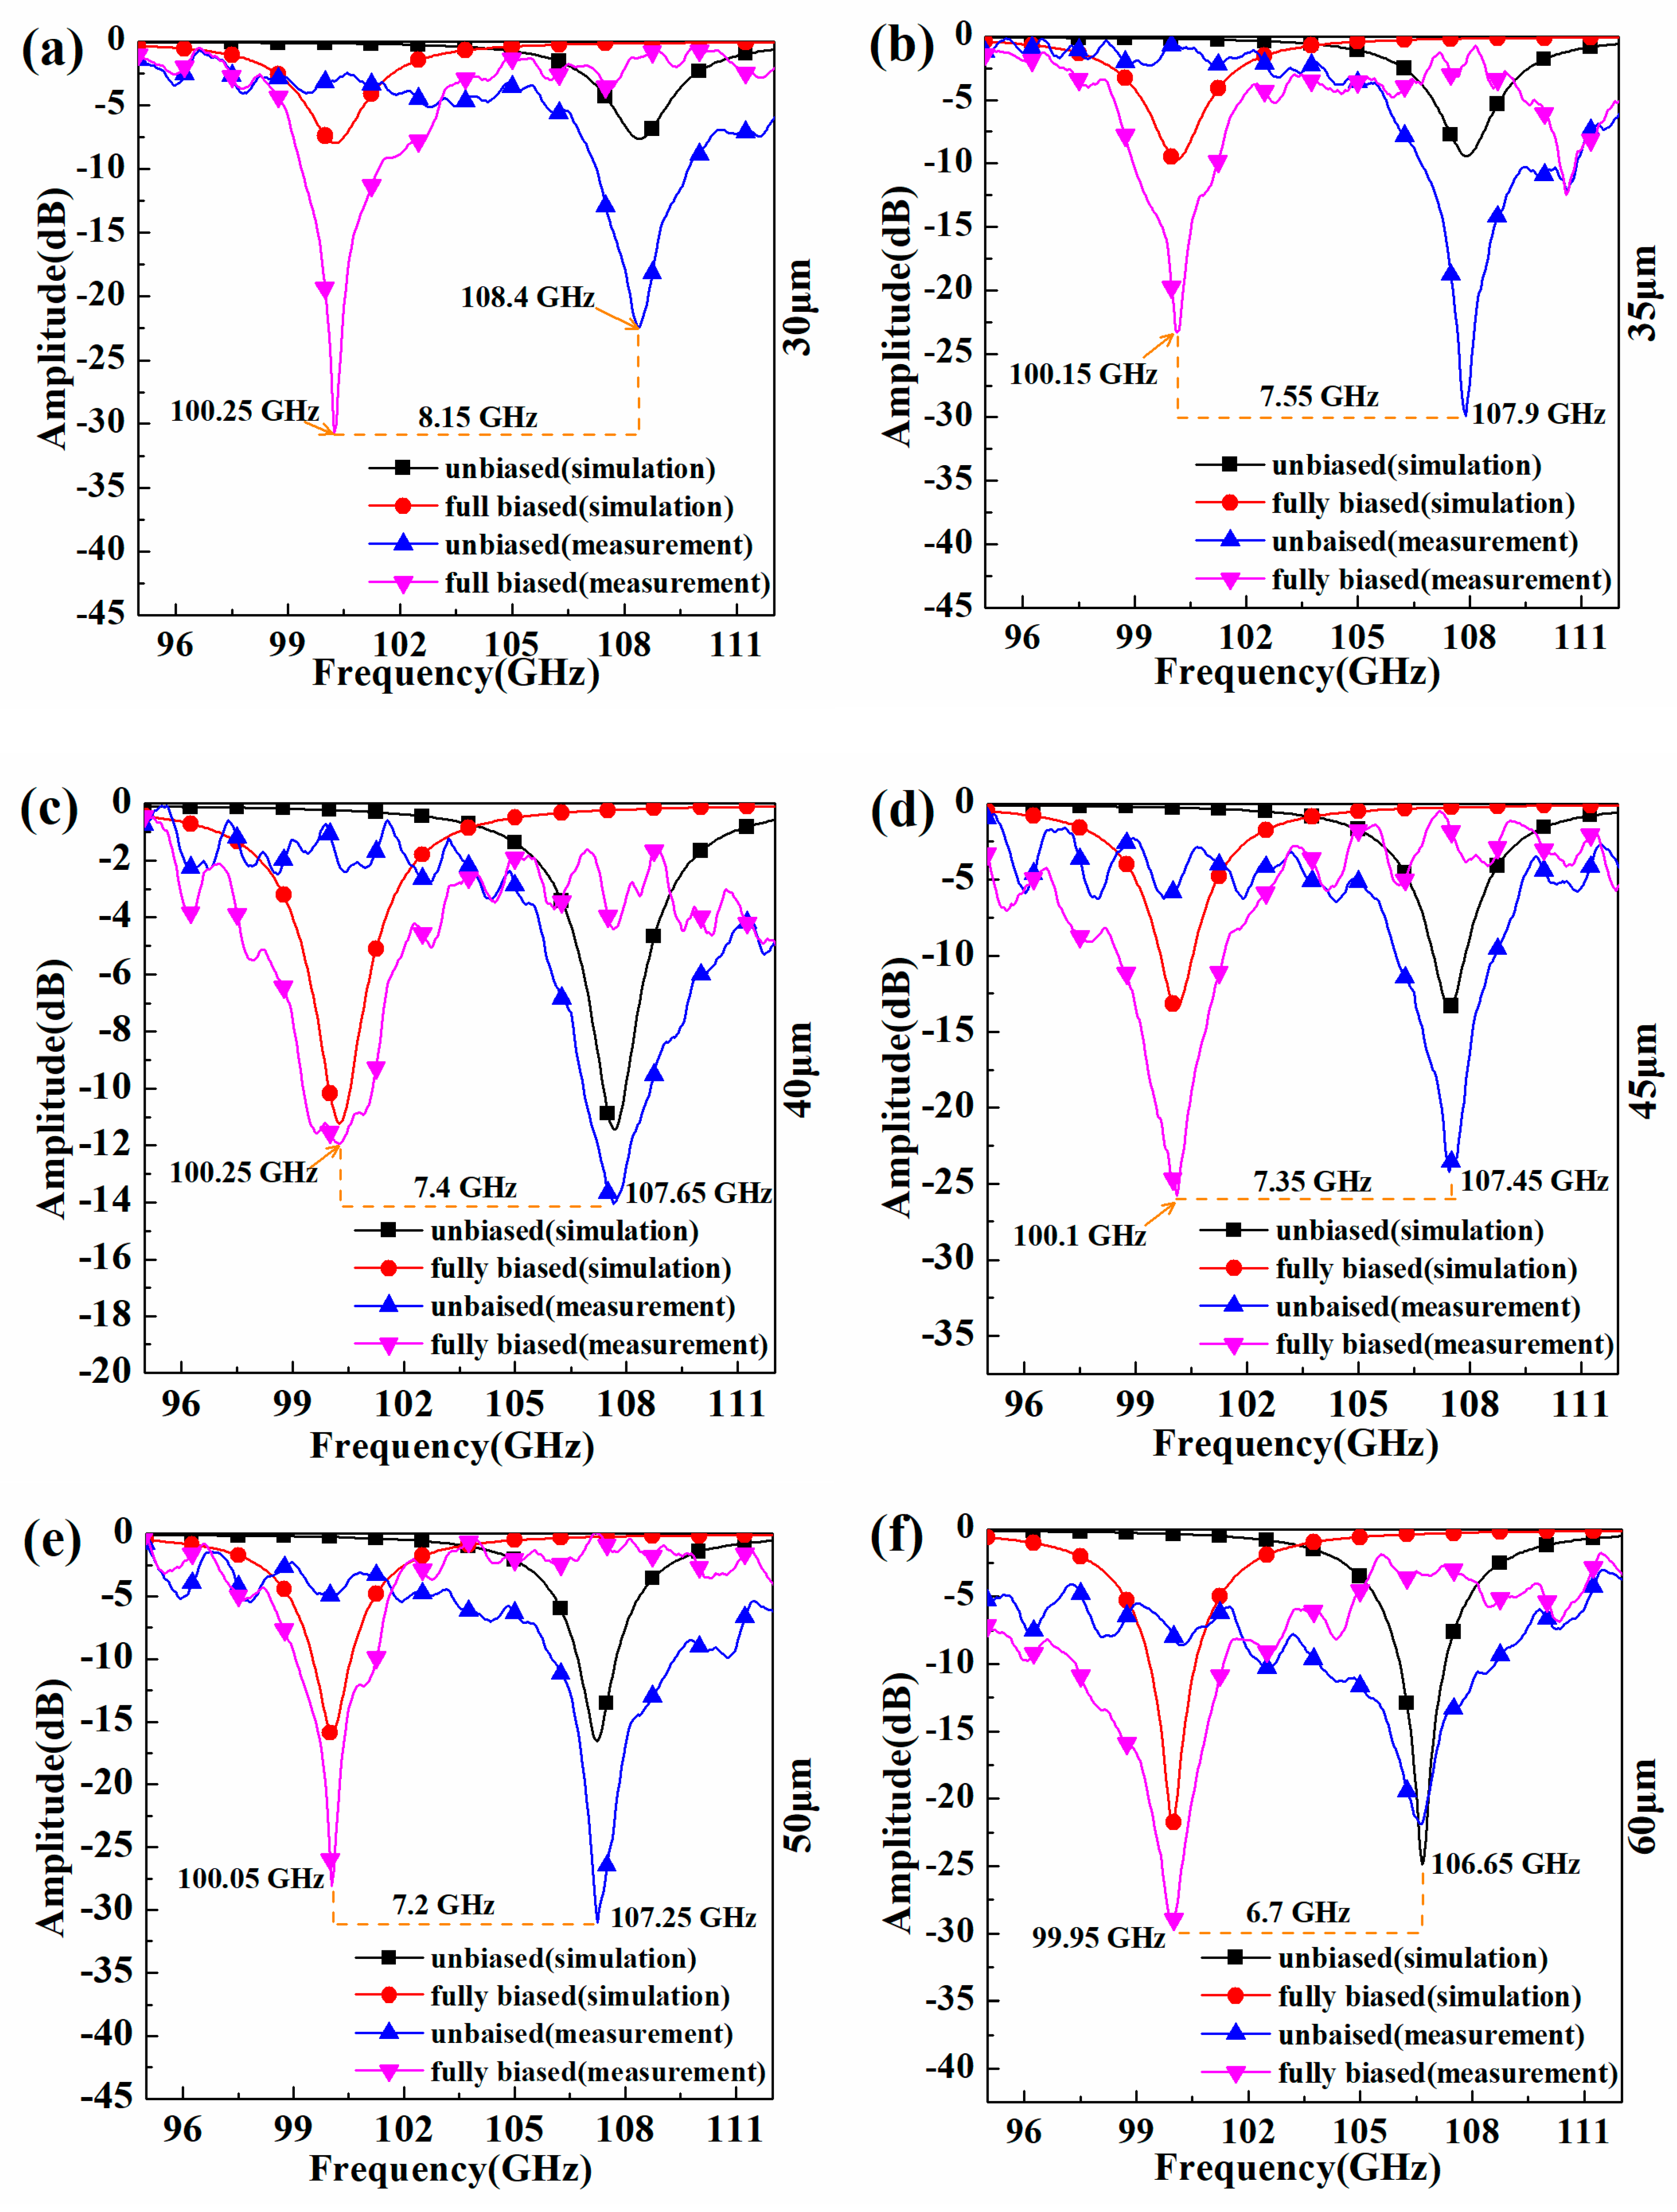
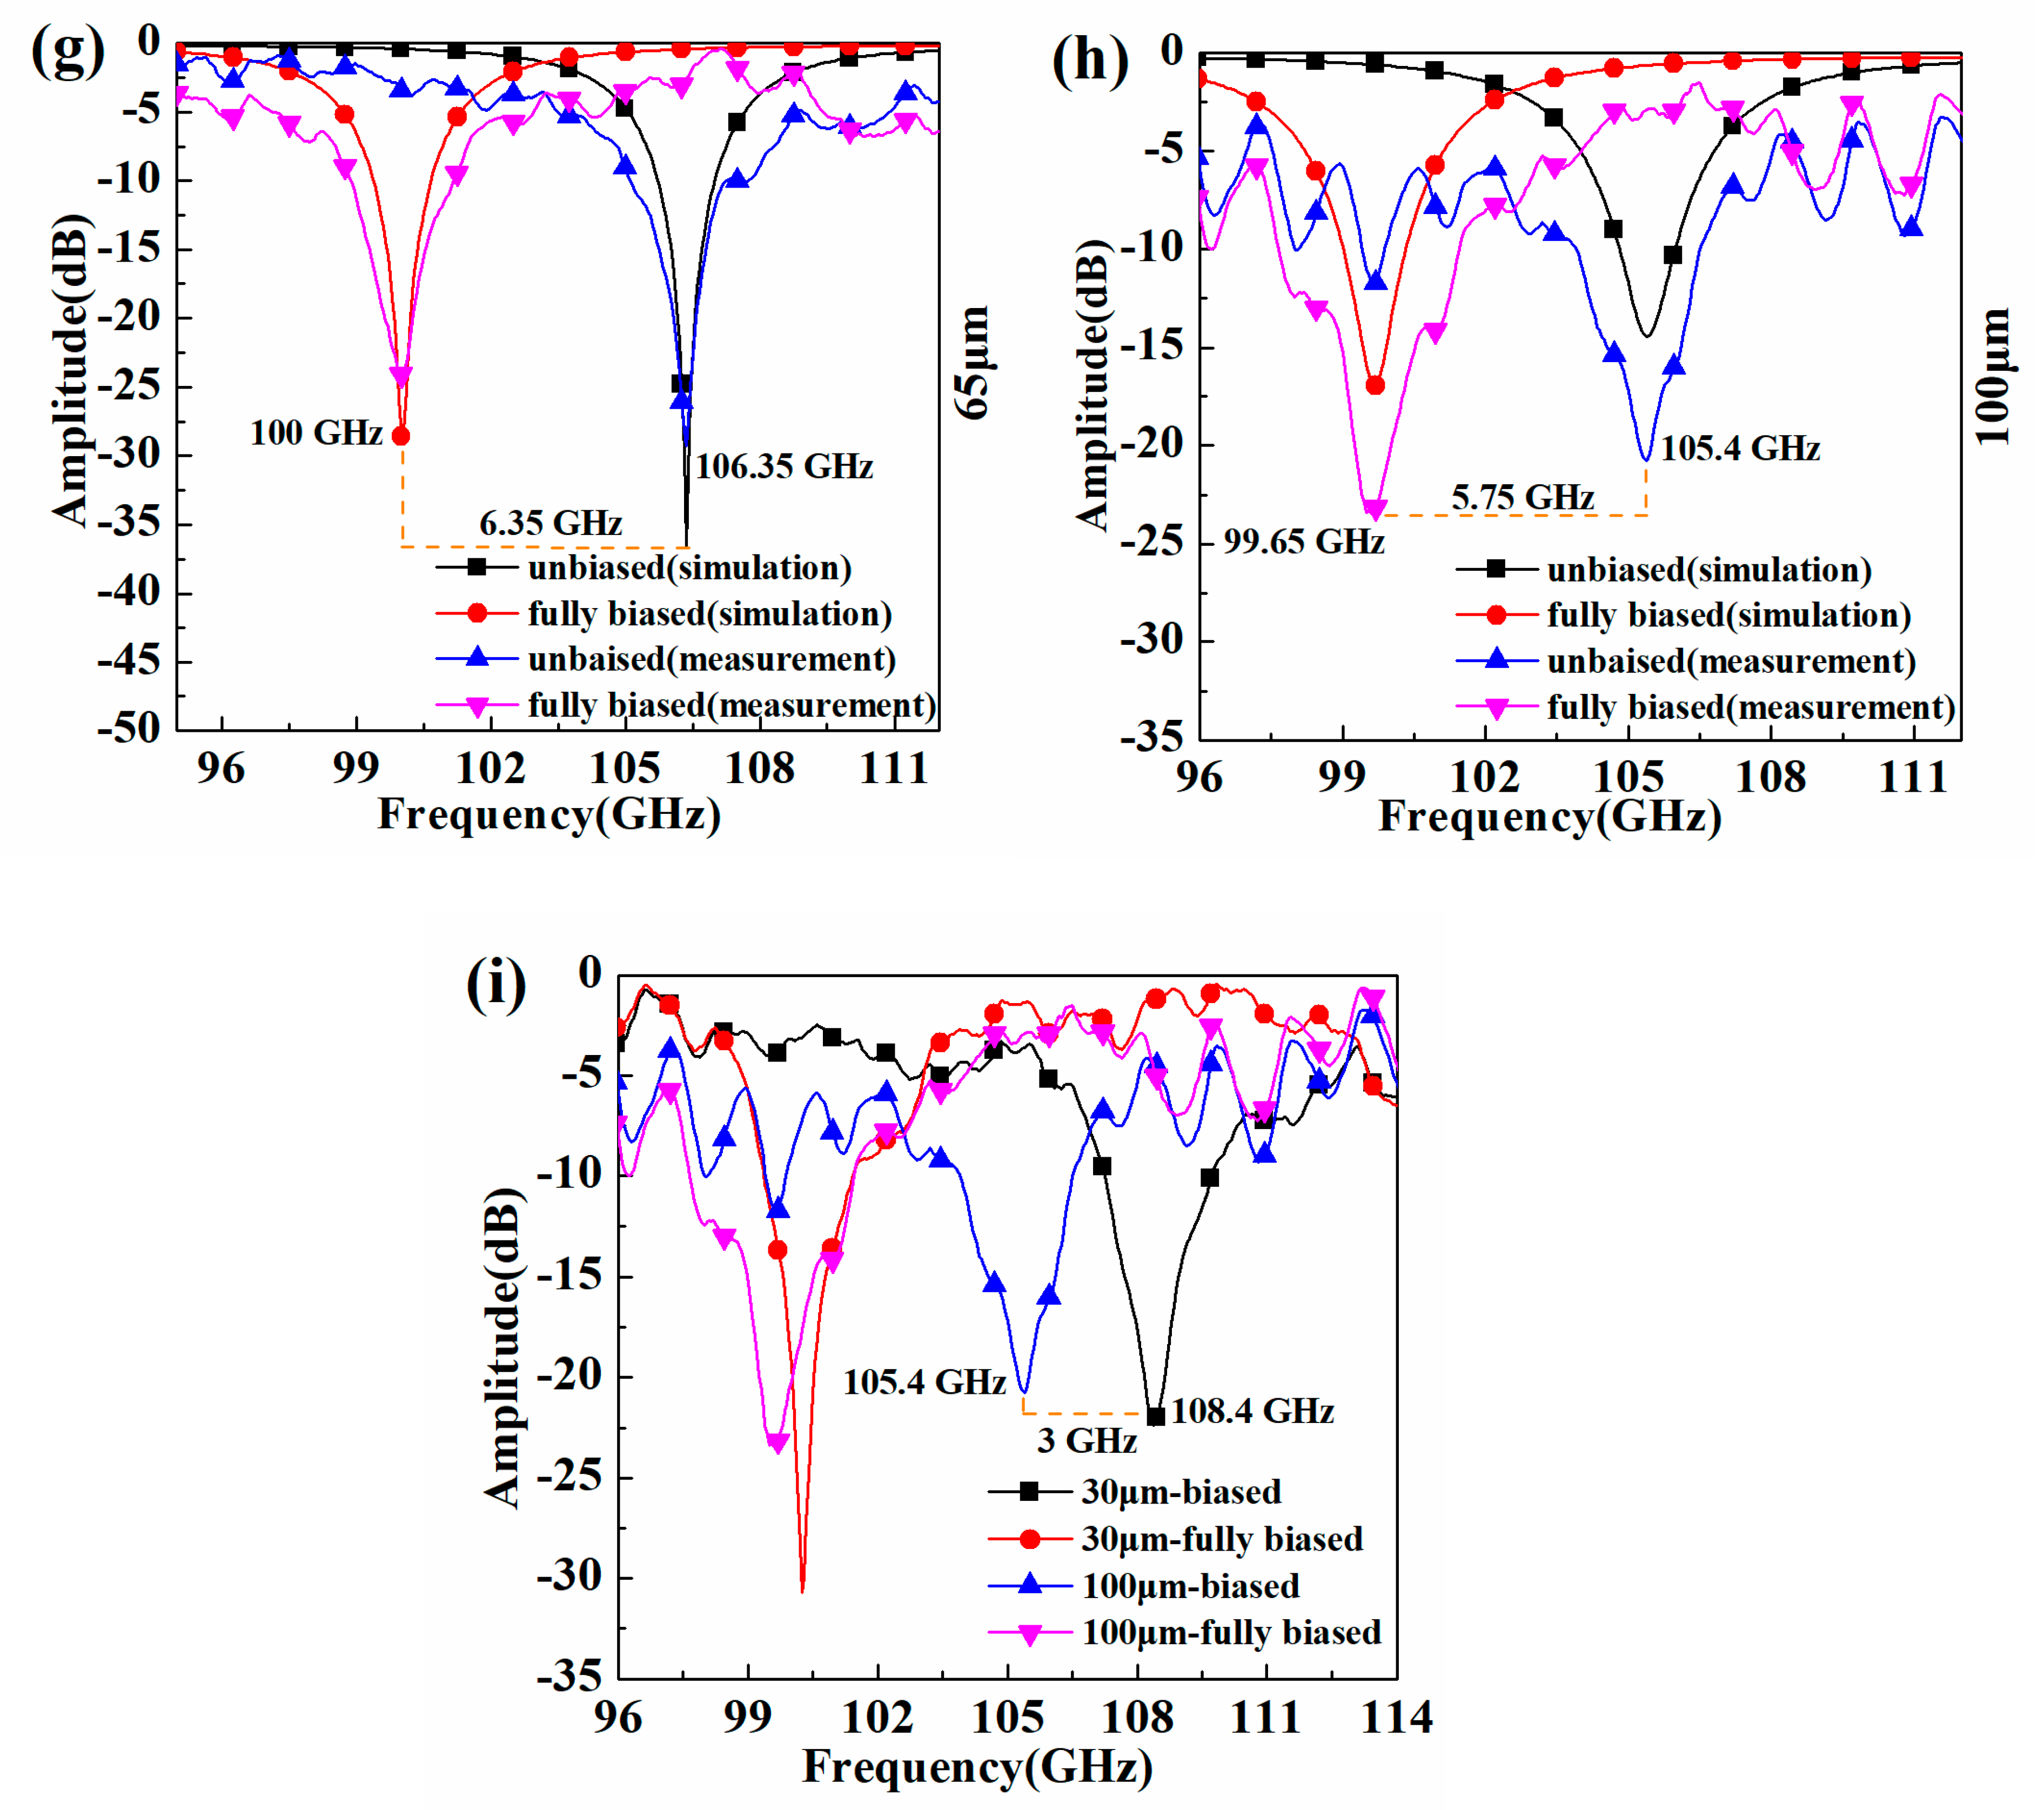
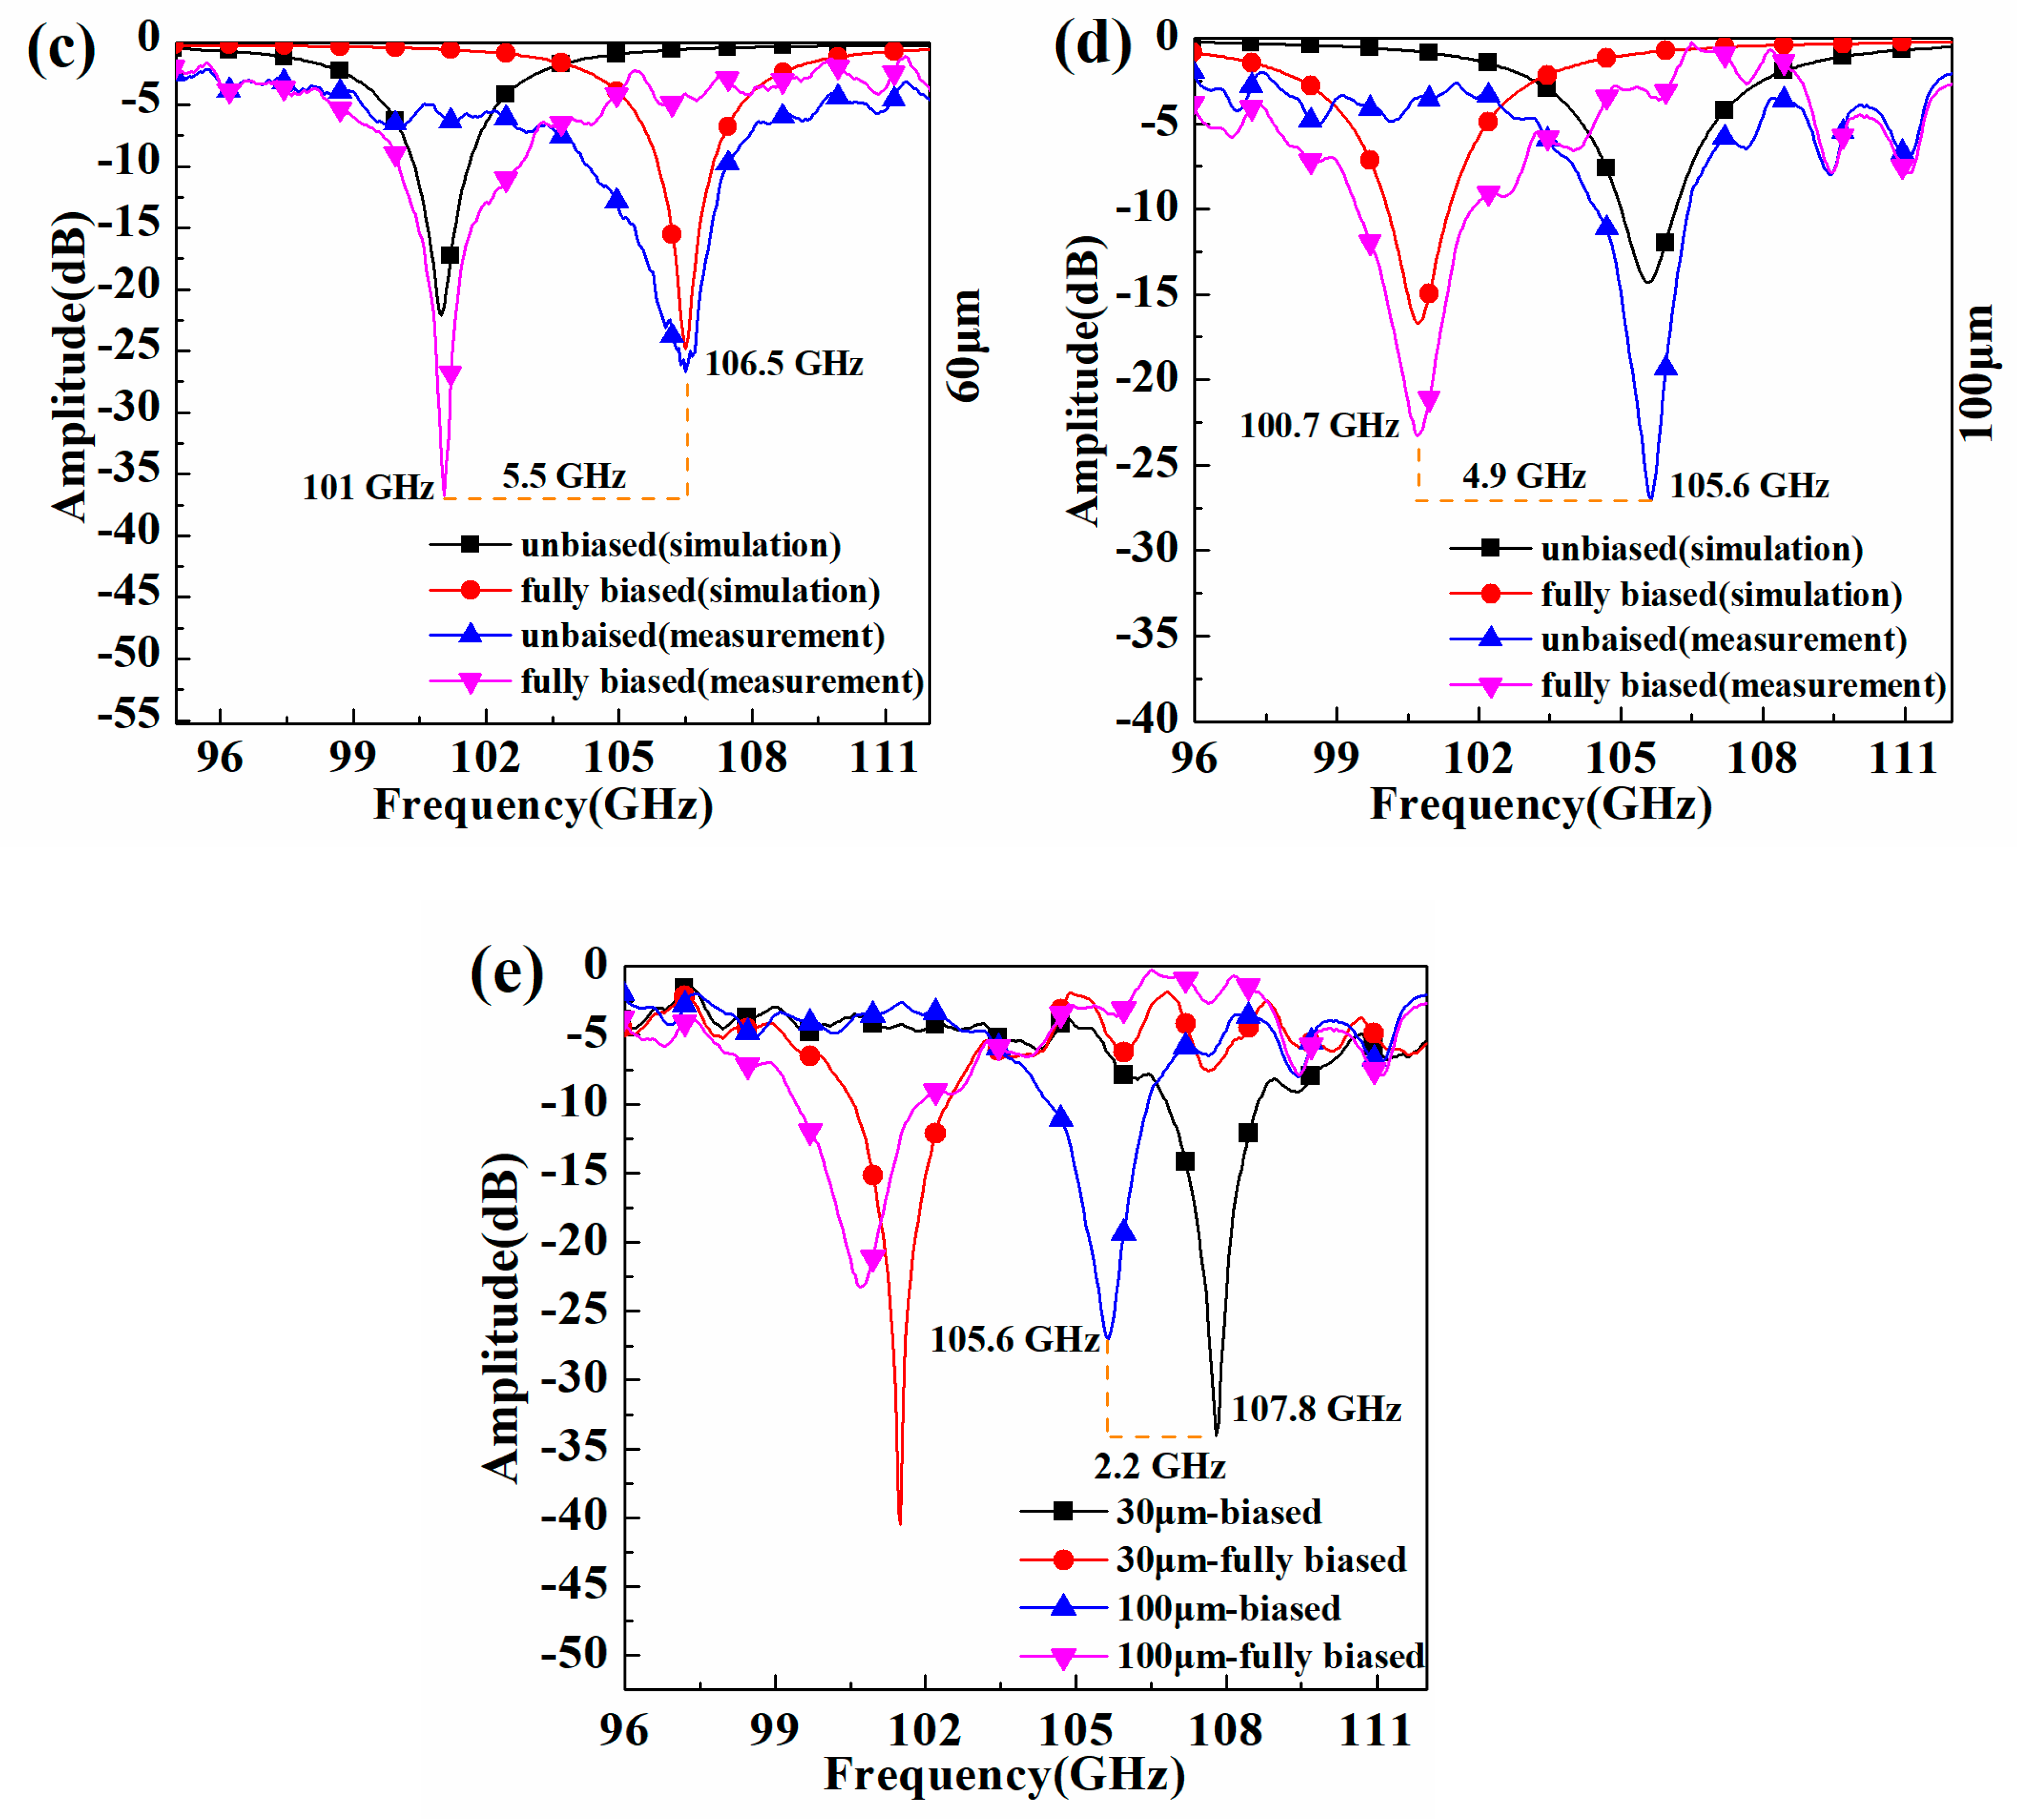
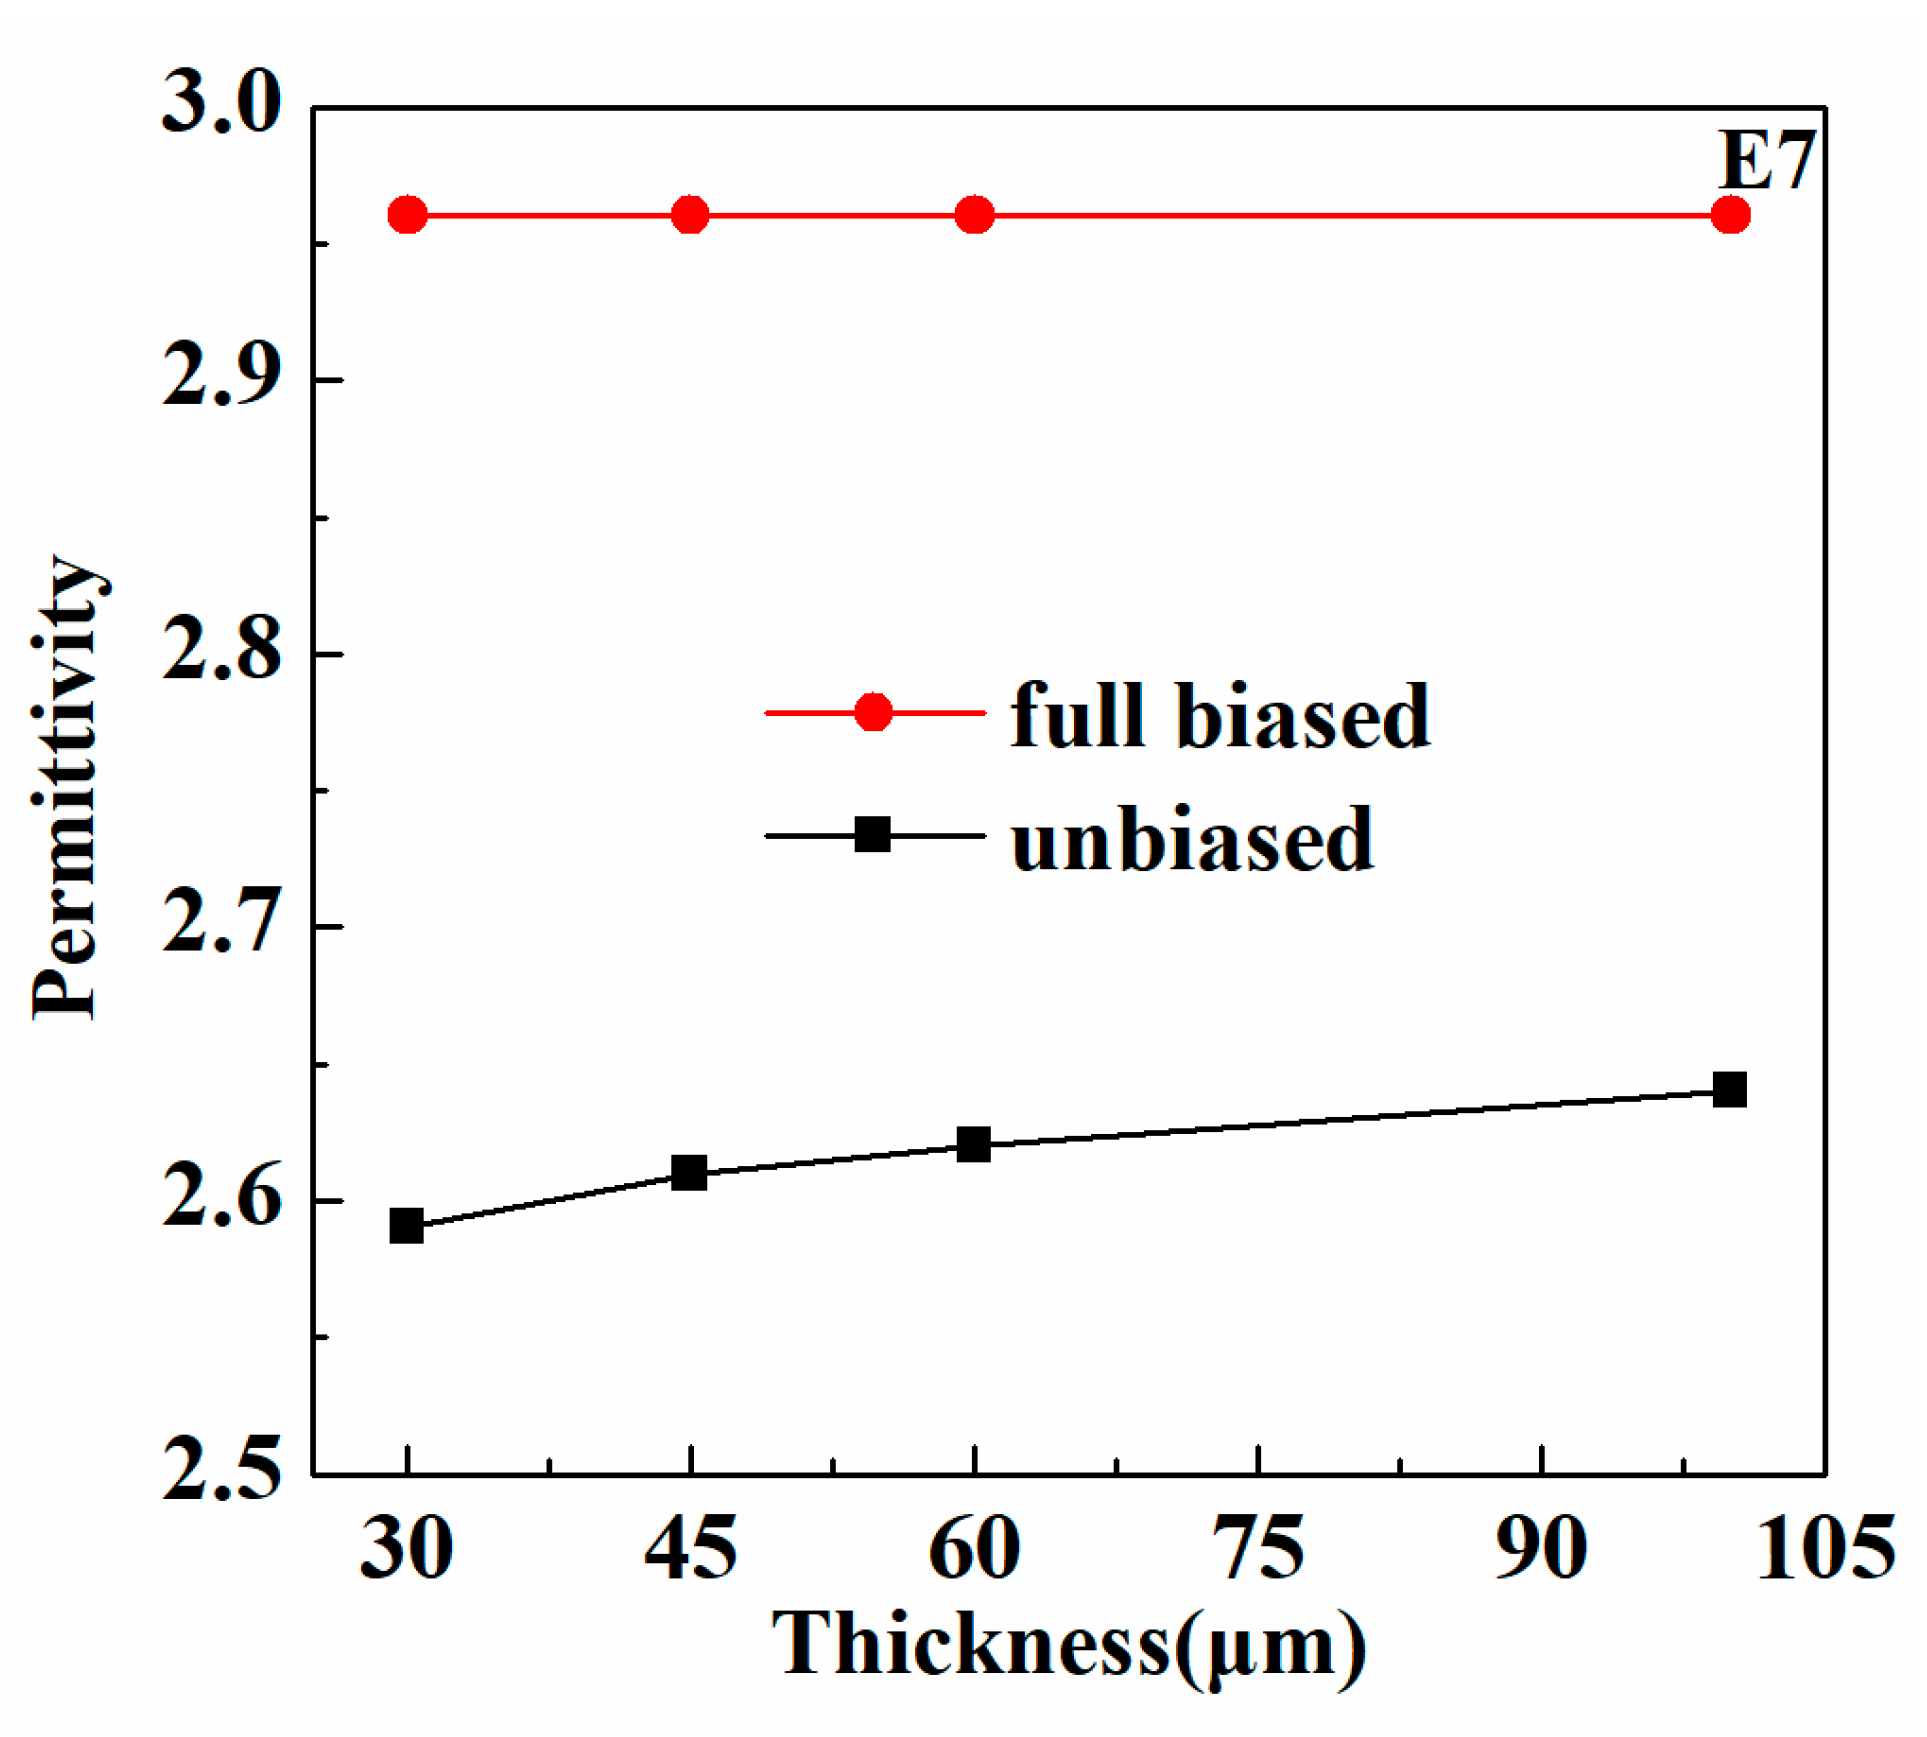
3. Experimental Measurements and Results
4. Conclusions
Author Contributions
Funding
Institutional Review Board Statement
Informed Consent Statement
Data Availability Statement
Conflicts of Interest
References
- Wang, L.; Xiao, R.-W.; Ge, S.-J.; Shen, Z.-X.; Lu, P.; Hu, W.; Lu, Y.-Q. Research progress of terahertz liquid crystal materials and devices. Acta Phys. Sin. 2019, 68, 084205. [Google Scholar] [CrossRef]
- Chen, Z.-Z.; Zhao, H.-Z.; Li, M.; Bu, J.; Ma, H. Application and research progress of liquid crystal materials in THz band. Electron. Compon. Mater. 2015, 34, 1–4. [Google Scholar]
- Parka, J.; Sielezin, K. 0.3–10.0 THz spectra for chosen liquid crystal molecules—Simulation and physical properties. Mol. Cryst. Liq. Cryst. 2017, 657, 66–71. [Google Scholar] [CrossRef]
- Wu, J.-B.; Shen, Z.; Ge, S.-J.; Chen, B.-W.; Shen, Z.-X.; Wang, T.-F.; Zhang, C.-H.; Hu, W.; Fan, K.-B.; Padilla, W.; et al. Liquid crystal programmable metasurface for terahertz beam steering. Appl. Phys. Lett. 2020, 116, 131104. [Google Scholar] [CrossRef]
- Wang, S.; Li, Q.; Gu, J.-Q.; Han, J.-G.; Zhang, W.-L. Dielectric properties of MgO-ZnO-TiO2-based ceramics at 1 MHz and THz frequencies. J. Mater. Sci. 2017, 52, 9335–9343. [Google Scholar] [CrossRef]
- Wang, J.; Tian, H.; Wang, Y.; Li, X.-Y.; Cao, Y.-J.; Li, L.; Liu, J.-L.; Zhou, Z.-X. Liquid crystal terahertz modulator with plasmon-induced transparency metamaterial. Opt. Express 2018, 26, 5769–5776. [Google Scholar] [CrossRef]
- Zhang, L.-H.; Li, J.-J.; Bao, Y.-H.; Wang, A.-X.; Zhang, W.-G. A broad stop-band filter based on multilayer metamaterials in the THz regime. J. Infrared Millim. Waves 2016, 35, 267–270. [Google Scholar]
- Zhou, S.-H.; Shen, Z.-X.; Kang, R.-Y.; Ge, S.-J.; Hu, W. Liquid Crystal Tunable Dielectric Metamaterial Absorber in the Terahertz Range. Appl. Sci. 2018, 8, 2211. [Google Scholar] [CrossRef] [Green Version]
- Kowerdziej, R.; Olifierczuk, M.; Salski, B.; Parka, J. Tunable negative index metamaterial employing in-plane switching mode at terahertz frequencies. Liq. Cryst. 2017, 39, 827–831. [Google Scholar] [CrossRef]
- Kowerdziej, R.; Stanczyk, T.; Parka, J. Electromagnetic simulations of tunable terahertz metamaterial infiltrated with highly birefringent nematic liquid crystal. Liq. Cryst. 2015, 42, 430–434. [Google Scholar] [CrossRef]
- Qiu, Q.-L.; Yu, X.-P.; Sui, W.-Q. A K-Band Low-Power Phase Shifter Based on Injection Locked Oscillator in 0.13 mu m CMOS Technology. J. Infrared Millim. Terahertz Waves 2017, 38, 1368–1386. [Google Scholar] [CrossRef]
- Ma, S.; Wang, P.-Y.; Meng, F.-Y.; Fu, J.-H.; Wu, Q. Electronically controlled beam steering leaky wave antenna in nematic liquid crystal technology. Int. J. RF Microw. Comput.-Aid. Eng. 2020, 30, e22188. [Google Scholar] [CrossRef]
- James, R.; Fernandez, F.A.; Day, S.E.; Bulja, S.; Mirshekar-Syahkal, D. Characterisation and Applications of Nematic Liquid Crystals in Microwave Devices. Mol. Cryst. Liq. Cryst. 2011, 542, 196–203. [Google Scholar] [CrossRef]
- Srivastava, A.K.; Misra, A.K.; Shukla, J.P.; Manohar, R. Dielectric and electro-optical properties of dye doped ferroelectric liquid crystal. Phys. Lett. A 2008, 372, 6254–6259. [Google Scholar] [CrossRef]
- Yang, F.-Z.; Sambles, J.R. Determination of the permittivity of nematic liquid crystals in the microwave region. Liq. Cryst. 2003, 30, 599–602. [Google Scholar] [CrossRef]
- Liu, Y.-R.; Shen, J.-R.; Shen, T.; Zheng, J.-H.; Zhuang, S.-L. Electro-optical properties and frequency response of polymer-dispersed liquid crystal gratings doped with multi-walled carbon nanotubes. J. Mater. Sci. 2021, 56, 12660–12670. [Google Scholar] [CrossRef]
- Aizen, A.; Abdulhalim, I. Dielectric permittivity imaging based on a liquid crystal capacitive sensor. Liq. Cryst. XXI 2017, 10361, 103610U. [Google Scholar]
- Yazdanpanahi, M.; Bulja, S.; Mirshekar-Syahkal, D.; James, R.; Day, S.E.; Fernandez, F.A. Measurement of Dielectric Constants of Nematic Liquid Crystals at mm-Wave Frequencies Using Patch Resonator. IEEE Trans. Instrum. Meas. 2010, 59, 3079–3085. [Google Scholar] [CrossRef]
- Dickie, R.; Baine, P.; Cahill, R.; Doumanis, E.; Goussetis, G.; Christie, S.; Mitchell, N.; Fusco, V.; Linton, D.; Encinar, J.; et al. Electrical characterisation of liquid crystals at millimetre wavelengths using frequency selective surfaces. Electron. Lett. 2012, 48, 611–612. [Google Scholar] [CrossRef]
- Deo, P.; Mirshekar-Syahkal, D.; Seddon, L.; Day, S.E.; Fernandez, F.A. Microstrip Device for Broadband (15–65 GHz) Measurement of Dielectric Properties of Nematic Liquid Crystals. IEEE Trans. Microw. Theory Tech. 2015, 63, 1388–1398. [Google Scholar] [CrossRef] [Green Version]
- Ji, Y.-Y.; Fan, F.; Zhang, X.; Cheng, J.-R.; Chang, S.-J. Terahertz birefringence anisotropy and relaxation effects in polymer-dispersed liquid crystal doped with gold nanoparticles. Opt. Express 2020, 28, 17253–17265. [Google Scholar] [CrossRef] [PubMed]
- Johri, M.; Tiwari, A.; Saxena, S.; Johri, S.; Kumar, D.; Singh, D.P. Study of the dielectric response and thermo-dynamical properties of PentylCyano Biphenyl (PCB) Liquid Crystal using microwave cavity spectrometer as a probe. Measurement 2020, 166, 108156. [Google Scholar] [CrossRef]
- Nova, V.; Bachiller, C.; Villacampa, B.; Kronberger, R.; Boria, V.E. Characterization of Nematic Liquid Crystals at Microwave Frequencies. Crystals 2020, 10, 1106. [Google Scholar] [CrossRef]
- Perez-Palomino, G.; Florencio, R.; Encinar, J.A.; Barba, M.; Dickie, R.; Cahill, R.; Baine, P.; Bain, M.; Boix, R.R. Accurate and Efficient Modeling to Calculate the Voltage Dependence of Liquid Crystal-Based Reflectarray Cells. IEEE Trans. Antennas Propag. 2014, 62, 2659–2668. [Google Scholar] [CrossRef] [Green Version]
- Gao, S.; Yang, J.; Wang, P.; Zheng, A.-D.; Lu, H.-B.; Deng, G.-S.; Lai, W.-E.; Yin, Z.-P. Tunable Liquid Crystal Based Phase Shifter with a Slot Unit Cell for Reconfigurable Reflectarrays in F-Band. Appl. Sci. 2018, 8, 2528. [Google Scholar] [CrossRef] [Green Version]
- Deshmukh, R.R.; Malik, M.K. Effect of temperature on the optical and electro-optical properties of poly(methyl methacrylate)/E7 polymer-dispersed liquid crystal composites. J. Appl. Polym. Sci. 2008, 109, 627–637. [Google Scholar] [CrossRef]
- Vieweg, N.; Shakfa, M.K.; Scherger, B.; Mikulics, M.; Koch, M. THz Properties of Nematic Liquid Crystals. J. Infrared Millim. Terahertz Waves 2010, 31, 1312–1320. [Google Scholar] [CrossRef]
- Park, H.; Parrott, E.P.J.; Fan, F.; Lim, M.; Han, H.; Chigrinov, V.G.; Pickwell-MacPherson, E. Evaluating liquid crystal properties for use in terahertz devices. Opt. Express 2012, 20, 11899–11905. [Google Scholar] [CrossRef]
- Lu, H.-B.; Jing, S.-C.; Xia, T.-Y.; Yang, J.; Yin, Z.-P.; Deng, G.-S. Measurement of LC dielectric constant at lower terahertz region based on metamaterial absorber. IEICE Electron Express 2017, 14, 2017046. [Google Scholar] [CrossRef] [Green Version]
- Tosaka, T.; Fujii, K.; Fukunaga, K.; Kasamatsu, A. Development of Complex Relative Permittivity Measurement System Based on Free-Space in 220–330-GHz Range. IEEE Trans. Terahertz Sci. Technol. 2015, 5, 102–109. [Google Scholar] [CrossRef]


| Parameters | hq | hlc | hc | P | D |
|---|---|---|---|---|---|
| Values (µm) | 480 | 45 | 0.5 | 1600 | 800 |
| Thickness (µm) | 30 | 35 | 40 | 45 | 50 | 60 | 65 | 100 |
|---|---|---|---|---|---|---|---|---|
| ε⊥ | 2.55 | 2.57 | 2.58 | 2.58 | 2.59 | 2.61 | 2.62 | 2.65 |
| ε// | 3.03 | 3.03 | 3.02 | 3.02 | 3.02 | 3.03 | 3.02 | 3.03 |
| Δε | 0.48 | 0.46 | 0.44 | 0.44 | 0.43 | 0.42 | 0.40 | 0.38 |
| Thickness (µm) | 30 | 45 | 60 | 100 |
|---|---|---|---|---|
| ε⊥ | 2.59 | 2.61 | 2.62 | 2.64 |
| ε// | 2.96 | 2.96 | 2.96 | 2.96 |
| Δε | 0.37 | 0.35 | 0.34 | 0.32 |
Publisher’s Note: MDPI stays neutral with regard to jurisdictional claims in published maps and institutional affiliations. |
© 2022 by the authors. Licensee MDPI, Basel, Switzerland. This article is an open access article distributed under the terms and conditions of the Creative Commons Attribution (CC BY) license (https://creativecommons.org/licenses/by/4.0/).
Share and Cite
Mao, R.; Zhang, G.; Xu, L.; Gao, H.; Yang, J.; Yin, Z.; Deng, G.; Lu, H. Dielectric Properties of Liquid Crystal Polymer Substrates in the Region from 90 to 140 GHz. Crystals 2022, 12, 170. https://doi.org/10.3390/cryst12020170
Mao R, Zhang G, Xu L, Gao H, Yang J, Yin Z, Deng G, Lu H. Dielectric Properties of Liquid Crystal Polymer Substrates in the Region from 90 to 140 GHz. Crystals. 2022; 12(2):170. https://doi.org/10.3390/cryst12020170
Chicago/Turabian StyleMao, Rongxin, Guozhen Zhang, Lu Xu, Haoyu Gao, Jun Yang, Zhiping Yin, Guangsheng Deng, and Hongbo Lu. 2022. "Dielectric Properties of Liquid Crystal Polymer Substrates in the Region from 90 to 140 GHz" Crystals 12, no. 2: 170. https://doi.org/10.3390/cryst12020170
APA StyleMao, R., Zhang, G., Xu, L., Gao, H., Yang, J., Yin, Z., Deng, G., & Lu, H. (2022). Dielectric Properties of Liquid Crystal Polymer Substrates in the Region from 90 to 140 GHz. Crystals, 12(2), 170. https://doi.org/10.3390/cryst12020170