Article

Influence of Culture Medium on Cementation of Coarse Grains Based on Microbially Induced Carbonate Precipitation

1
School of Engineering and Mechanics, Liaoning Technical University, Fuxin 123000, China
2
China Construction Fourth Engineering Division Co., Ltd., Guangzhou 510000, China
*
Author to whom correspondence should be addressed.
Crystals 2022, 12(2), 188; https://doi.org/10.3390/cryst12020188
Submission received: 17 November 2021 / Revised: 21 January 2022 / Accepted: 22 January 2022 / Published: 27 January 2022
(This article belongs to the Special Issue Advanced Piezoelectric Crystals of Langasite Family)

Abstract

:
A main challenge in the large-scale application of the microbially induced carbonate precipitation (MICP) technique includes the low efficiency of the cementation of coarse grains. Actually, in the MICP treatment process, the cementation effect of the bonding points was more important than pore filling due to the large porosity for coarse grains. To achieve a better cementation effect at bonding points between coarse particles, the quick formation and growth of a biofilm is necessary. In this study, an optimized medium was proposed to improve the cementation effects for coarse materials. The optimized medium and other different media were used for bio-cementation tests with MICP. The viable cell concentrations, strengths, microscopic characteristics, biofilm contents, and calcium carbonate (CaCO3) contents were used to evaluate the bio-cementation and its effects. In bio-cementation tests, the optimized medium led to increased CaCO3 precipitation at the bonding points and better cementation effects compared to other media. Indeed, the strength of the sample treated with the optimized medium was more than 1.2–4 times higher that of the values for other media. The advantages of the optimized medium were demonstrated via bio-cementation tests.

1. Introduction

In recent years, bio-cementation or microbially induced carbonate precipitation (MICP) has received the attention of many researchers in geotechnical engineering fields [1,2,3,4]. The principle of the MICP technique is that calcium carbonate (CaCO3) with a cementing function is obtained by calcium ions binding to carbonate ions [5,6,7,8]. The implementation potential of the MICP technique is widely recognized [9,10,11,12,13]. For instance, this technique can be applied to enhance soil strength and stiffness [2], reduce soil permeability [14], repair cracks [15,16,17], improve the mechanical properties of granular soils [16], and control erosion and dust [18,19,20,21,22,23]. CaCO3 precipitation can form bridges between granular soil particles, leading to the cementation of loose soil particles into a cohesive and enhanced structure. Although many researchers have studied soil improvement with MICP, limitations exist in the application of this method in the bonding of coarser materials. For coarse materials, MICP treatment is less cost-effective, since it requires a higher number of biochemical treatment cycles to gain acceptable strength [24]. However, coarse materials are common in practical engineering, which limits the extensive application of MICP. To decrease the high investments required for the application of MICP, cost-effective approaches are needed.
In fact, for coarse grains with a large porosity, if bonding points between the coarse particles are cemented well, the solidified sample will exhibit great strength [25]. Compared with the higher number of biochemical treatment cycles, the cementation effect of the bonding points is more important. In order to achieve a better cementation effect at the bonding points between coarse particles, the quick formation and growth of a biofilm is necessary [25]. Precipitated CaCO3 is attached to the biofilm, with an increasing amount of CaCO3 precipitation available at the bonding points as the biofilm quickly forms and grows, eventually leading to a better cementation effect [26,27]. Biofilms have been used in many applications, such as biobarriers and microbial-enhanced oil recovery [28]. However, there have been few studies focusing on the effect of biofilm growth on bio-cementation to improve the cementation effect. With the aim of promoting biofilm growth, using a suitable culture medium can be an effective method for large-scale applications. Therefore, the medium was optimized in this study for an effective cementation.
Previous researchers have used yeast extract [4,24,29,30], peptone [4], and ammonium sulfate [24,29] as the common nutritional sources for the cultivation of urease-producing bacteria. The same bacterial strain was used in the present work. In addition, several other nutritional sources are available, such as nutrient broth [3] and glucose [15]. In the present study, an optimized medium was obtained. The optimized medium and some other culture media were used, and bio-cementation tests for coarse materials were conducted using these media. The viable cell concentration in the effluent, unconfined compressive strength (UCS) test, scanning electron microscopy (SEM), biofilm growth, and CaCO3 quantification were used to evaluate the bio-cementation effects.

2. Materials and Methods

2.1. Bacteria

In the present study, a type of ureolytic bacteria was used, namely Sporosarcina pasteurii (S. pasteurii; ATCC 11859; obtained from the Guangdong Culture Collection Center of China). The changes in cell density can be obtained by monitoring the absorbance (optical density) of the suspension at a wavelength of 600 nm (OD600) [6,31]. Therefore, in the present paper, optical density (OD600) was used to represent the cell density.

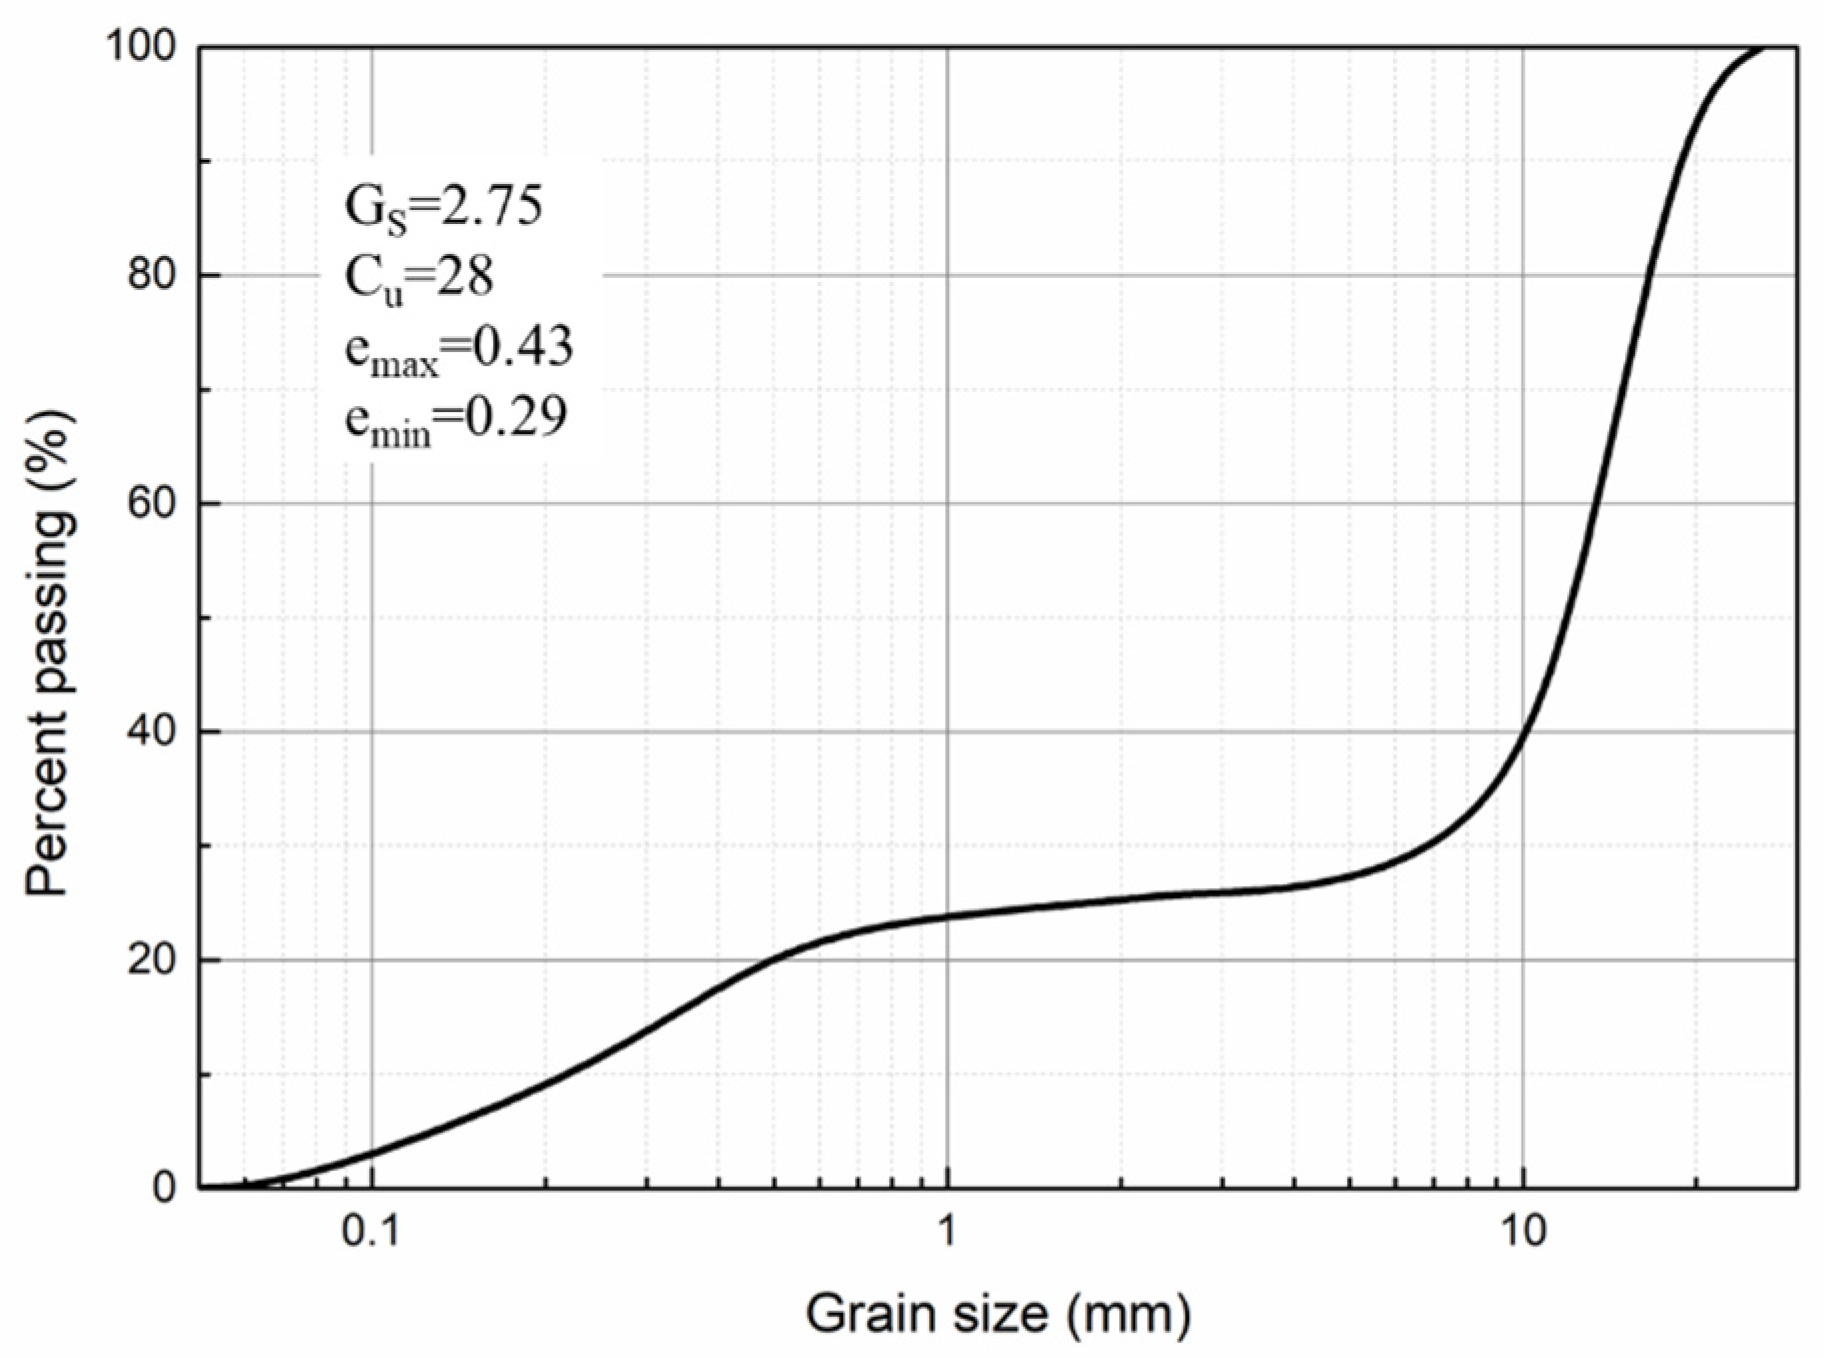
2.2. Granular Column Specimen

Coarse aggregates (2.5–25-mm sieves) and fine aggregates (0.075–2-mm sieves) from the Yangtze River were used to prepare samples for the MICP treatment. The mass percentage of 25% for fine aggregates was also used in the current study. The particle size distribution is presented in Figure 1. All mixtures were classified as poorly graded materials, according to the Unified Soil Classification System [32]. In total, five samples were cemented after reaction(s) catalyzed by the bacteria with five different culture media. Coarse and fine aggregates were sterilized at a high temperature (120 °C) and high pressure (250 kPa) before being placed in polyvinyl chloride (PVC) cylinders, which had an inner diameter of 10 cm and height of 20 cm. The experiments were performed under aseptic conditions, and there was no contamination with other microorganisms.

2.3. Culture Media

The culture medium was optimized for bio-cementation. In previous studies, yeast extract, polypeptone, and ammonium sulfate have often been used as nutritional sources for the cultivation of S. Pasteurii. [4,24,26]. Hence, yeast extract, polypeptone, and ammonium sulfate were added to the culture medium and their concentrations varied to obtain five distinct media in this study. In addition to these three components, 10.0 g/L of NaCl was also added into the media to provide an adequate salt content for bacterial growth, and the initial pH of the culture media was 7.0. The NaCl might increase the ionic strength, leading to increased CaCO3 precipitation.

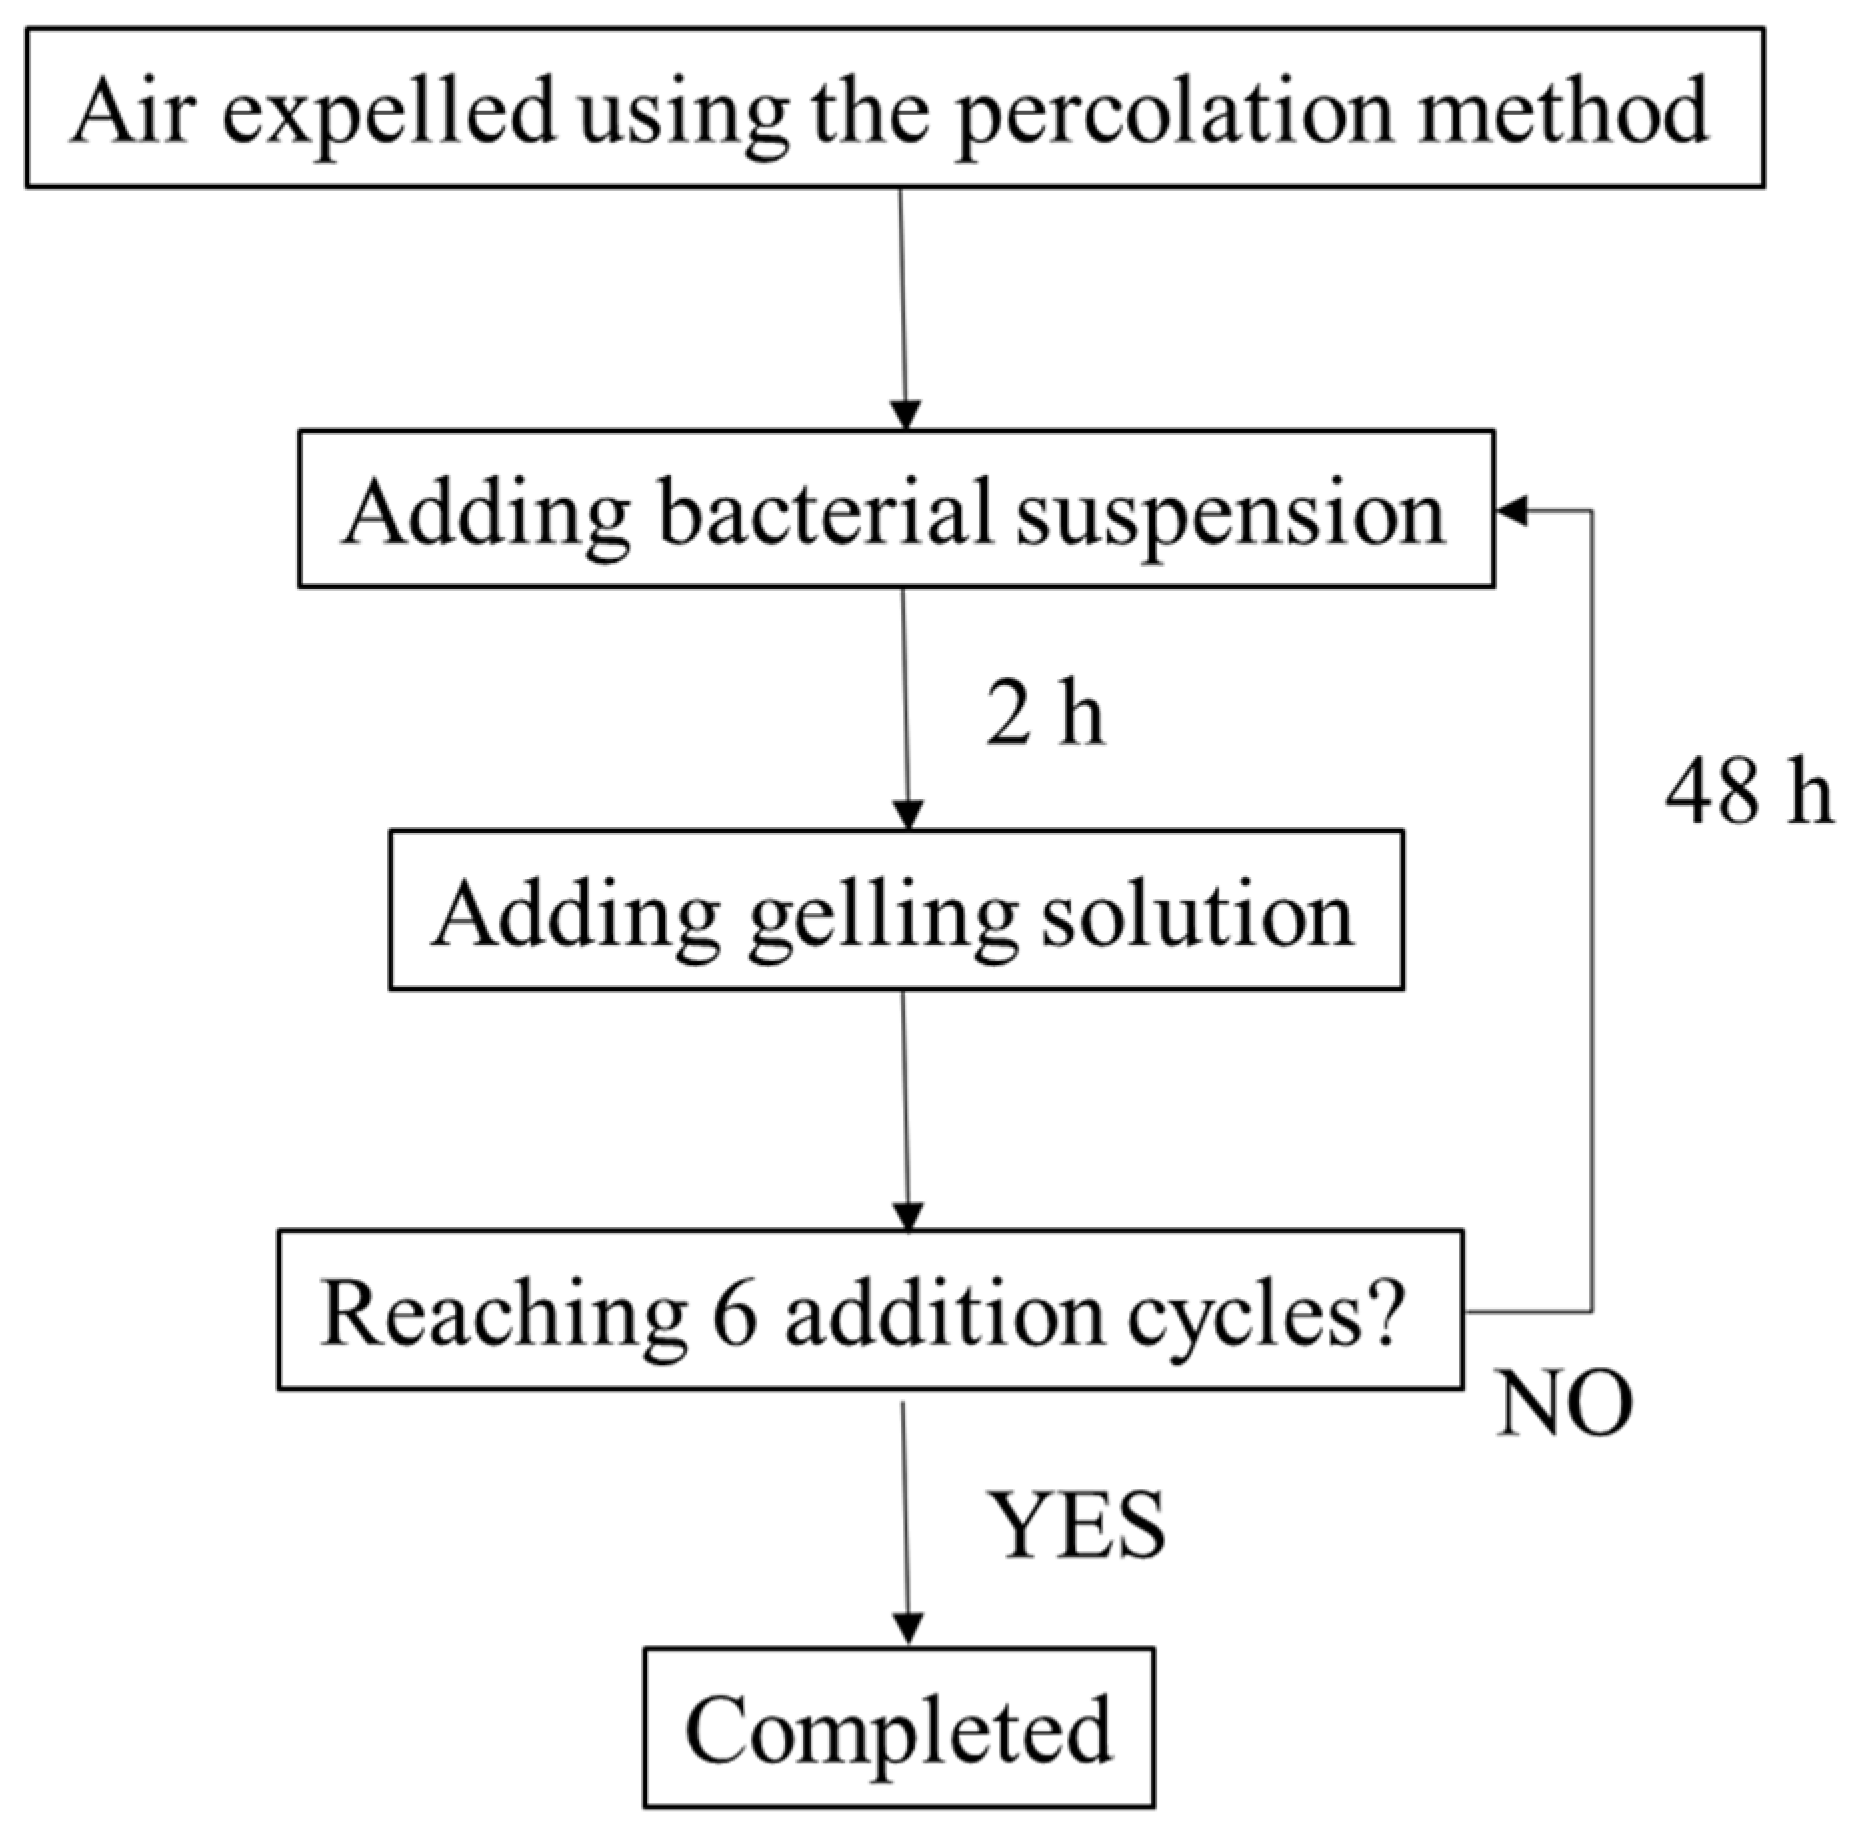
2.4. River Sediments Treatment Procedures

Firstly, air was expelled from the samples through the addition of tap water using the percolation method, until a volume of water equivalent to 150% pore volume was reached, as shown in Figure 2. Subsequently, the bacterial suspension cultured for 48 h was added using the same method, reaching a bacterial suspension volume of 100% of the pore volume. The samples were left to rest for 2 h, which was followed by the addition of 50% of the pore volume of a gelling solution (consisting of a mixture of 1.0-M urea and calcium chloride). The gelling solution was mixed with the remaining culture media. Eventually, the samples had 50% pore volume of bacterial suspension and 50% pore volume of gelling solution. The initial pH value of the gelling solution was 7.0. Incubation for 48 h at 20 ± 2 °C was performed to allow for the production of precipitation. In order to perform the experiments efficiently, the above-mentioned addition cycle was repeated every 48 h to reach a total of six addition cycles. Iqbal et al. [33] stated that calcite precipitates were concentrated at the contact points of the particles, which led to a better improvement of resistance under the saturated condition of 50%. However, the degree of saturation in the treatment procedures for all the samples was 100%; therefore, the results were comparative. The comparison of the results was quantitative.

2.5. Evaluation of Treatment Effects

Before the treatment cycle, the effluent was collected, and its viable cell concentration (cell/mL) was measured by the plate colony counting method. Studying the viable cell concentration in the effluent allowed the comparison of the microorganism viability of the strain in different samples.
After 12 days, UCS tests were conducted in accordance with ASTM C617 [34], and the UCS values of the samples were determined to evaluate the cementation effect. The loading speed was constant at 1 mm/min for the duration of the UCS tests.
Following the completion of the UCS tests, the sediments at the bonding points were sampled and subjected to the SEM, and the bonding effects were evaluated via microscopic observation. The sample was rinsed with ionized water and then dried in an oven at 60 °C for 24 h. After that, the sample was gold-sputtered. Several SEM photos were obtained using the apparatus (type: JSM-6300, JEOL company, Tokyo, Japan), which showed the sample treated with the optimized medium or C medium.
Similarly, to evaluate the biofilm growth at the bonding points between coarse particles, the biofilm between two coarse particles was scraped, and the plate colony counting method was used again to determine the colony-forming units (CFU). In addition, the bonding points between coarse particles were chosen after the UCS tests. The CaCO3 content at the bonding point was measured using the gravimetric acid washing (2-M HCl) technique [4]. Their dry mass was measured before and after the acid wash. The difference between the mass of the samples was considered to indicate the mass of precipitated CaCO3, and the CaCO3 content was obtained by dividing the mass of calcium carbonate by the mass of the sediments. Triplicate samples were prepared to obtain the average CaCO3 content levels.

3. Results and Discussion

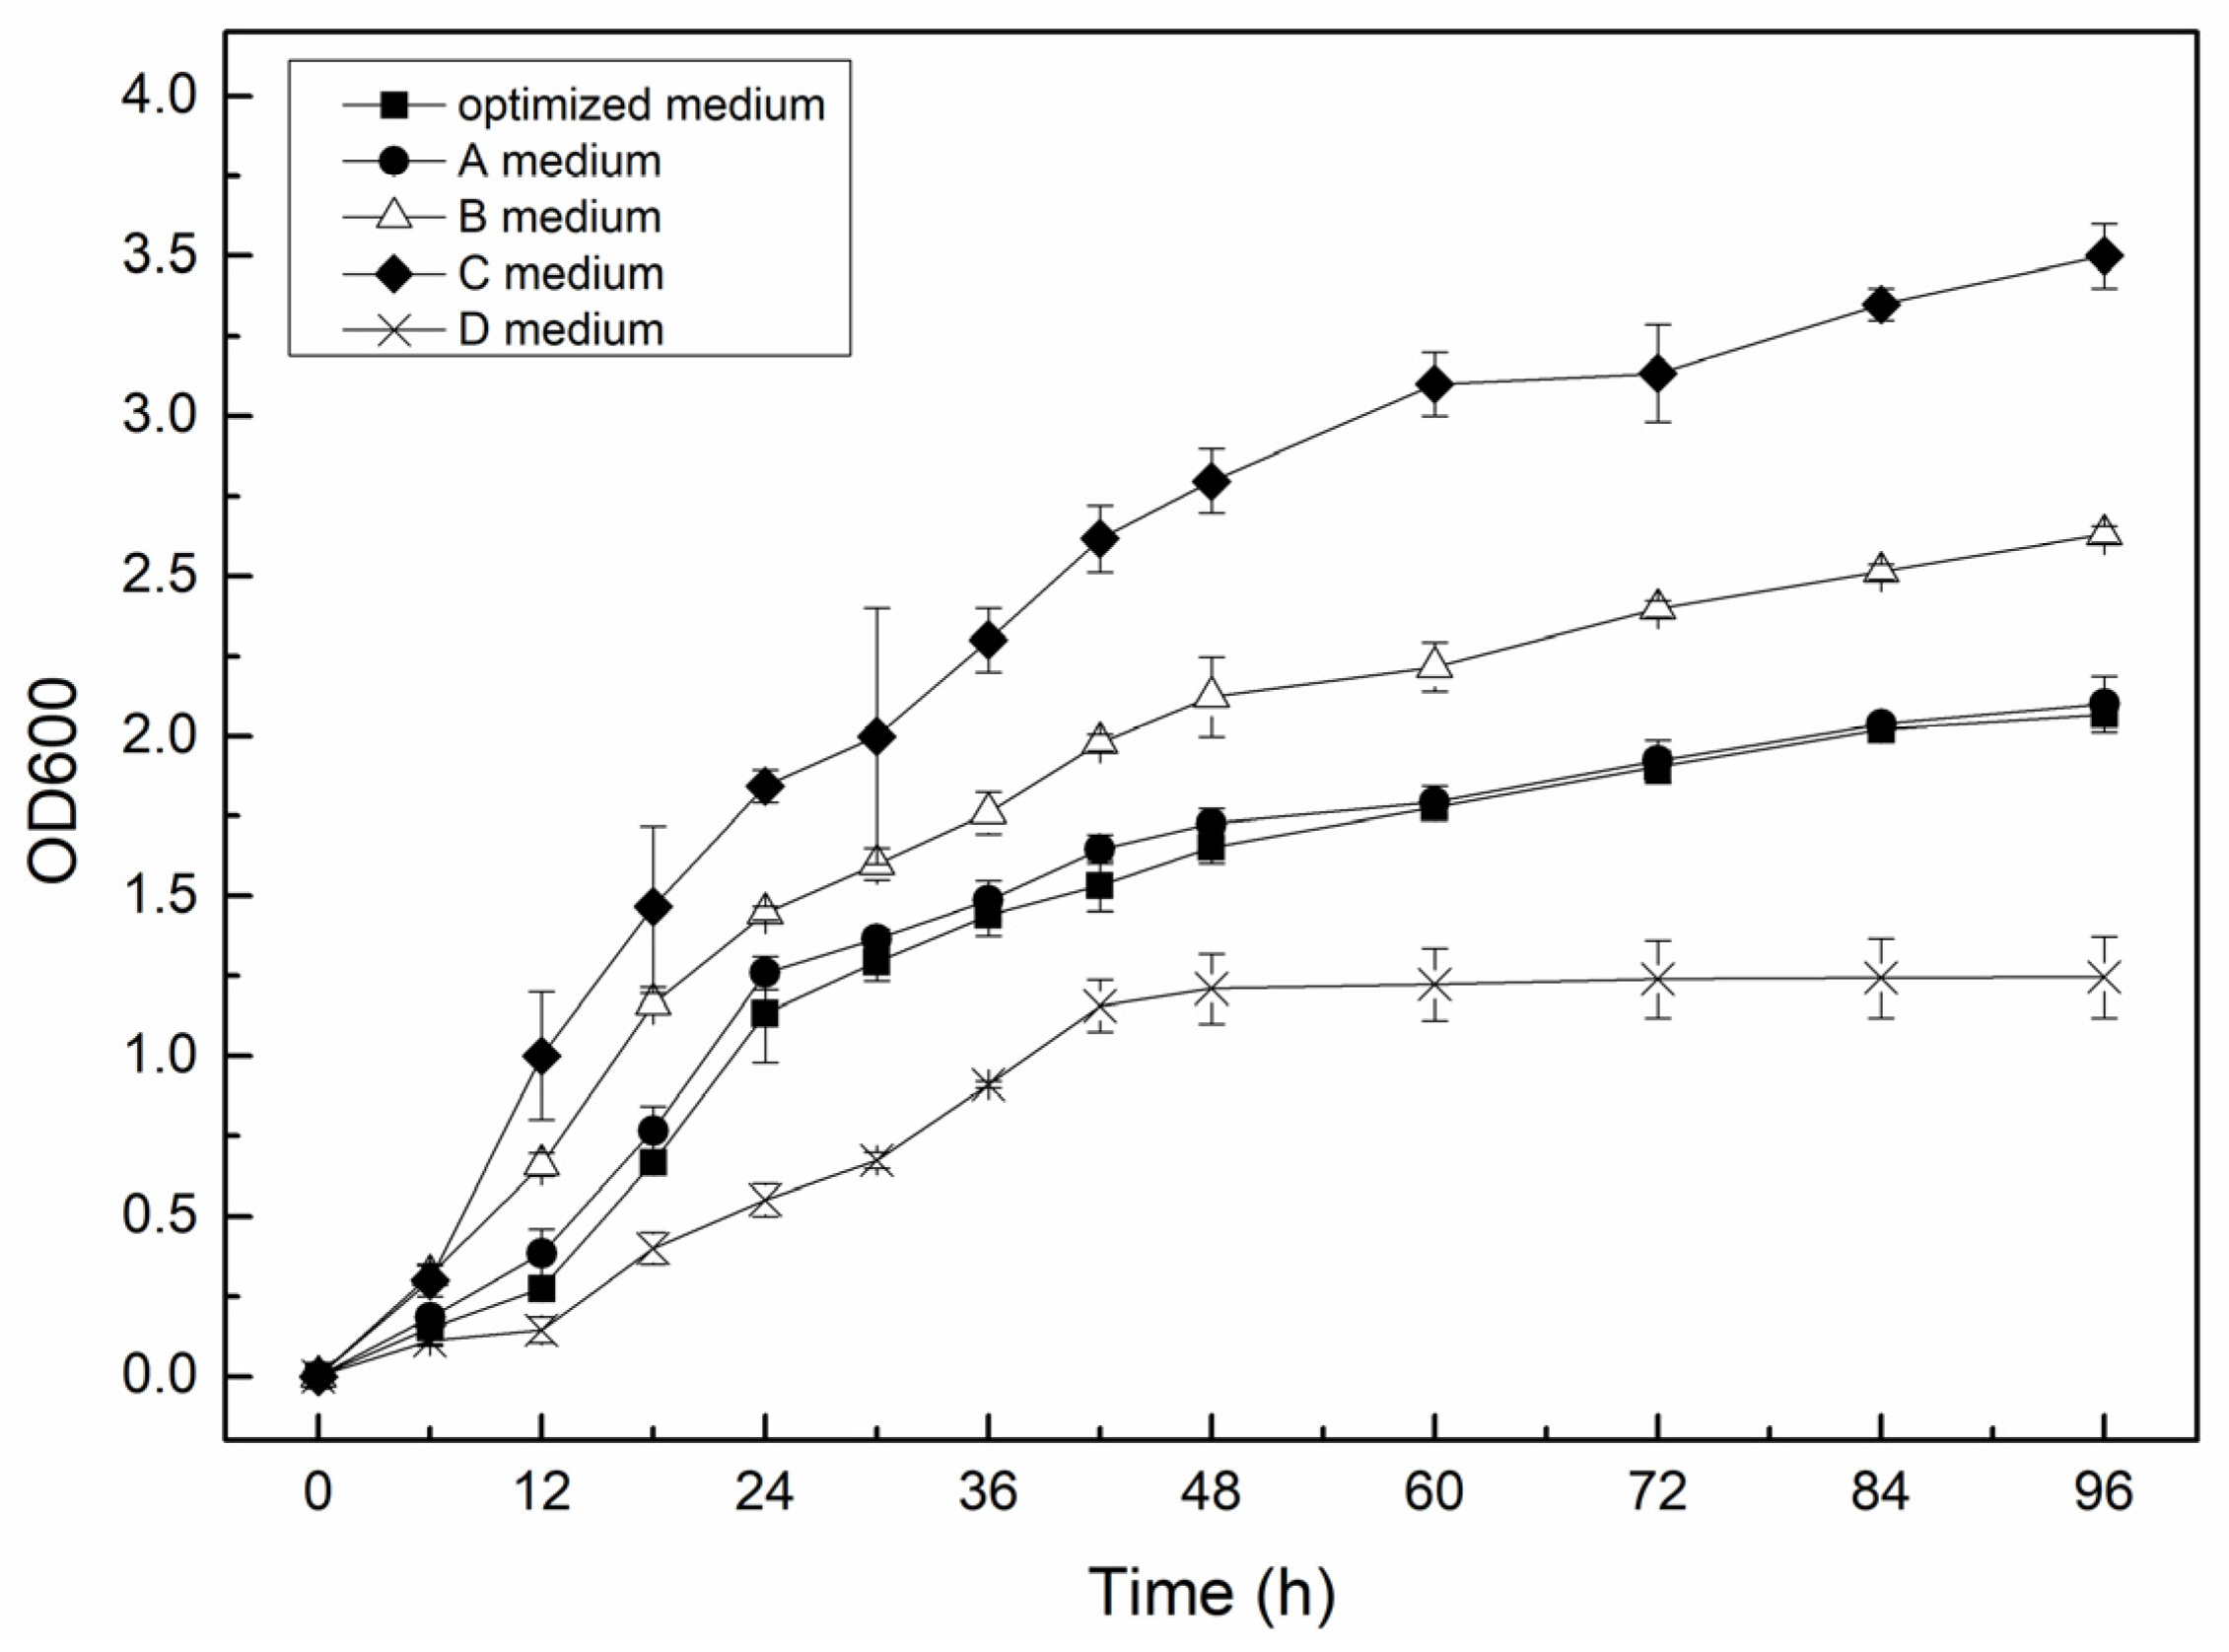
3.1. Preparing Different Culture Media

For various building materials with different particle sizes, the pore sizes for bacterial growth and calcium carbonate precipitation varied greatly. Biomass evolution with time in the pore network was primarily controlled by the growth, decay, and attachment of the biomass [35,36,37], as shown in Equation (1):
R b i o = μ ε w C b i o k d e c , 1 ( 1 + m H + 2 K p H ) ε w C b i o k a t t S b i o C b i o
where   μ is the growth rate coefficient of the biomass or biofilm, calculated as shown in Equation (2). ε w is the volume fraction of the water phase, and C b i o (kg/m3) is the concentration of the biomass. k d e c , 1 is the endogenous decay rate constant, m H + is the molality of proton, and K p H is an empirical constant.   k a t t refers to the attachment coefficient, and S b i o (m2) is the available specific area for biomass attachment in a pore element, which can be obtained based on the pore sizes and volume fraction of the water phase [38]. On the right-hand side of Equation (1), the terms denote the growth of the biomass, the decay of the biomass, and the first-order kinetics of the biomass attachment, respectively [38].
As shown in Equation (2), nutrient and oxygen are very important for biomass growth.
μ = k μ C n k n + C n C 0 k 0 + C 0
where k μ is the maximum substrate utilization rate constant, C n (kg/m3) and C 0 (kg/m3) are the mass concentrations of the nutrient and oxygen, respectively, and k n and k 0 are the half-saturation constants.
Once the biomass concentrations in the pore elements were obtained, the biofilm volume fractions were determined, according to Equation (3) [39]:
R f = μ ε f ρ f ( k d e c , 1 + k d e c , 2 max ( r p r e c ,   0 ) M c ρ c ( 1 ε c ) ) ε w ρ f + k a t t S b i o C b i o
where ρ f is the biofilm density, and ε f is the volume fraction of the biofilm. The growth rate coefficient ( μ ) and the endogenous decay coefficient ( k d e c , 1 ) are the same for both the biofilm and the suspended biomass [39], while k d e c , 2 is the second decay rate constant due to the calcite precipitation [37,40]. ρ c (kg/m3) is the calcite density. M c is the molecular weight of calcite, and r p r e c (mol · m−3 · s−1) is the calcite precipitation rate.
To take into account the effects of possible mass transfer limitations and complex nucleation mechanisms on the CaCO3 precipitation rate at the pore element scale [41,42,43,44], the equation for the CaCO3 precipitation rate was slightly revised based on the equation described in Reference [45], as shown in Equation (4), where β is a constant correction coefficient; k g is the growth rate constant, which is derived empirically and depends on the growth mechanism, mineral type, and temperature [46,47,48,49]; and n is the kinetic order. S is the supersaturation, which is based on the concentration of calcium and carbonate ions and biomass according to the study in Reference [47].
r p r e c = β ρ c M c · 4 π · [ k g · ( S 1 ) n ] 2
On the basis of Equation (4), bacteria can serve as the nucleation site, and CaCO3 will be produced around the bacteria. These parameters and empirical constants were derived from the study in Reference [9]. In the process of solidification, the relationship between the volume fractions of calcite ( ε c ), the water phrase ( ε w ), and the biofilm ( ε f ) is given in Equation (5). Moreover, with the increase in solidification time, the volume fraction of the water phase gradually decreased, and the sum of the volume fractions of calcite and the biofilm reached 1.
ε c + ε w + ε f = 1
Overall, the volumes of pores can be calculated in advance, as shown in Equation (6), where V is the volume of the samples, and e a v e is the average void ratio. On the basis of the volume of pores and Equations (1) and (3)–(5), the required initial biomass concentration and growth rate can be obtained.
The initial biomass concentration can be transformed into the optical density (OD600) via Equation (7) [50]. The parameters in these equations are defined in Table 1.
V p o r e = V e a v e 1 + e a v e
Concentration   of   cells / mL = 8.59 × 10 7 × OD 600 1.3627
The initial biomass growth rate was driven by the concentrations of the nutrients in the medium after the culture of the bacteria. Therefore, the optimized medium has a suitable initial biomass concentration and growth rate after the culture that could ensure the good cementation effects of the coarse materials. The medium can be optimized based on the calculations. According to the characteristics of the sample columns, the initial total volume of the pores could be calculated (4.158 × 10⁻⁴ m3), and then, based on Equations (1) and (3)–(5), the required initial biomass concentration was obtained (OD600 = 1.68). In the pre-experiment, the concentrations of the yeast extract, polypeptone, and ammonium sulfate varied greatly to prepare different media, which were used for the culture of S. pasteurii, and the biomass concentrations were measured after 48 h. According to the authors’ pre-experiment, a similar biomass concentration could be obtained at 30 °C for 48 h (Table 2) with the initial concentrations of the nutrients in the medium (20-g/L yeast extract, 10-g/L polypeptone, and 5-g/L ammonium sulfate). Therefore, the medium was defined as the optimized medium.
To compare the effect of nutrients on the bio-cementation effects, ammonium sulfate was not added as the A medium. The B medium had a larger concentration of polypeptone (20 g/L) to study the influence of polypeptone. The growth characteristics (growth rate) would be greatly affected by the amount of bacterial culture added to the liquid culture medium [16]; therefore, the bacteria in the present study were inoculated with identical OD600 values (OD600 = 1.0). The optical density (OD600) with different media after 48-h culture at 30 °C can be seen in Table 2.

3.2. Bio-Cementation of Coarse Materials

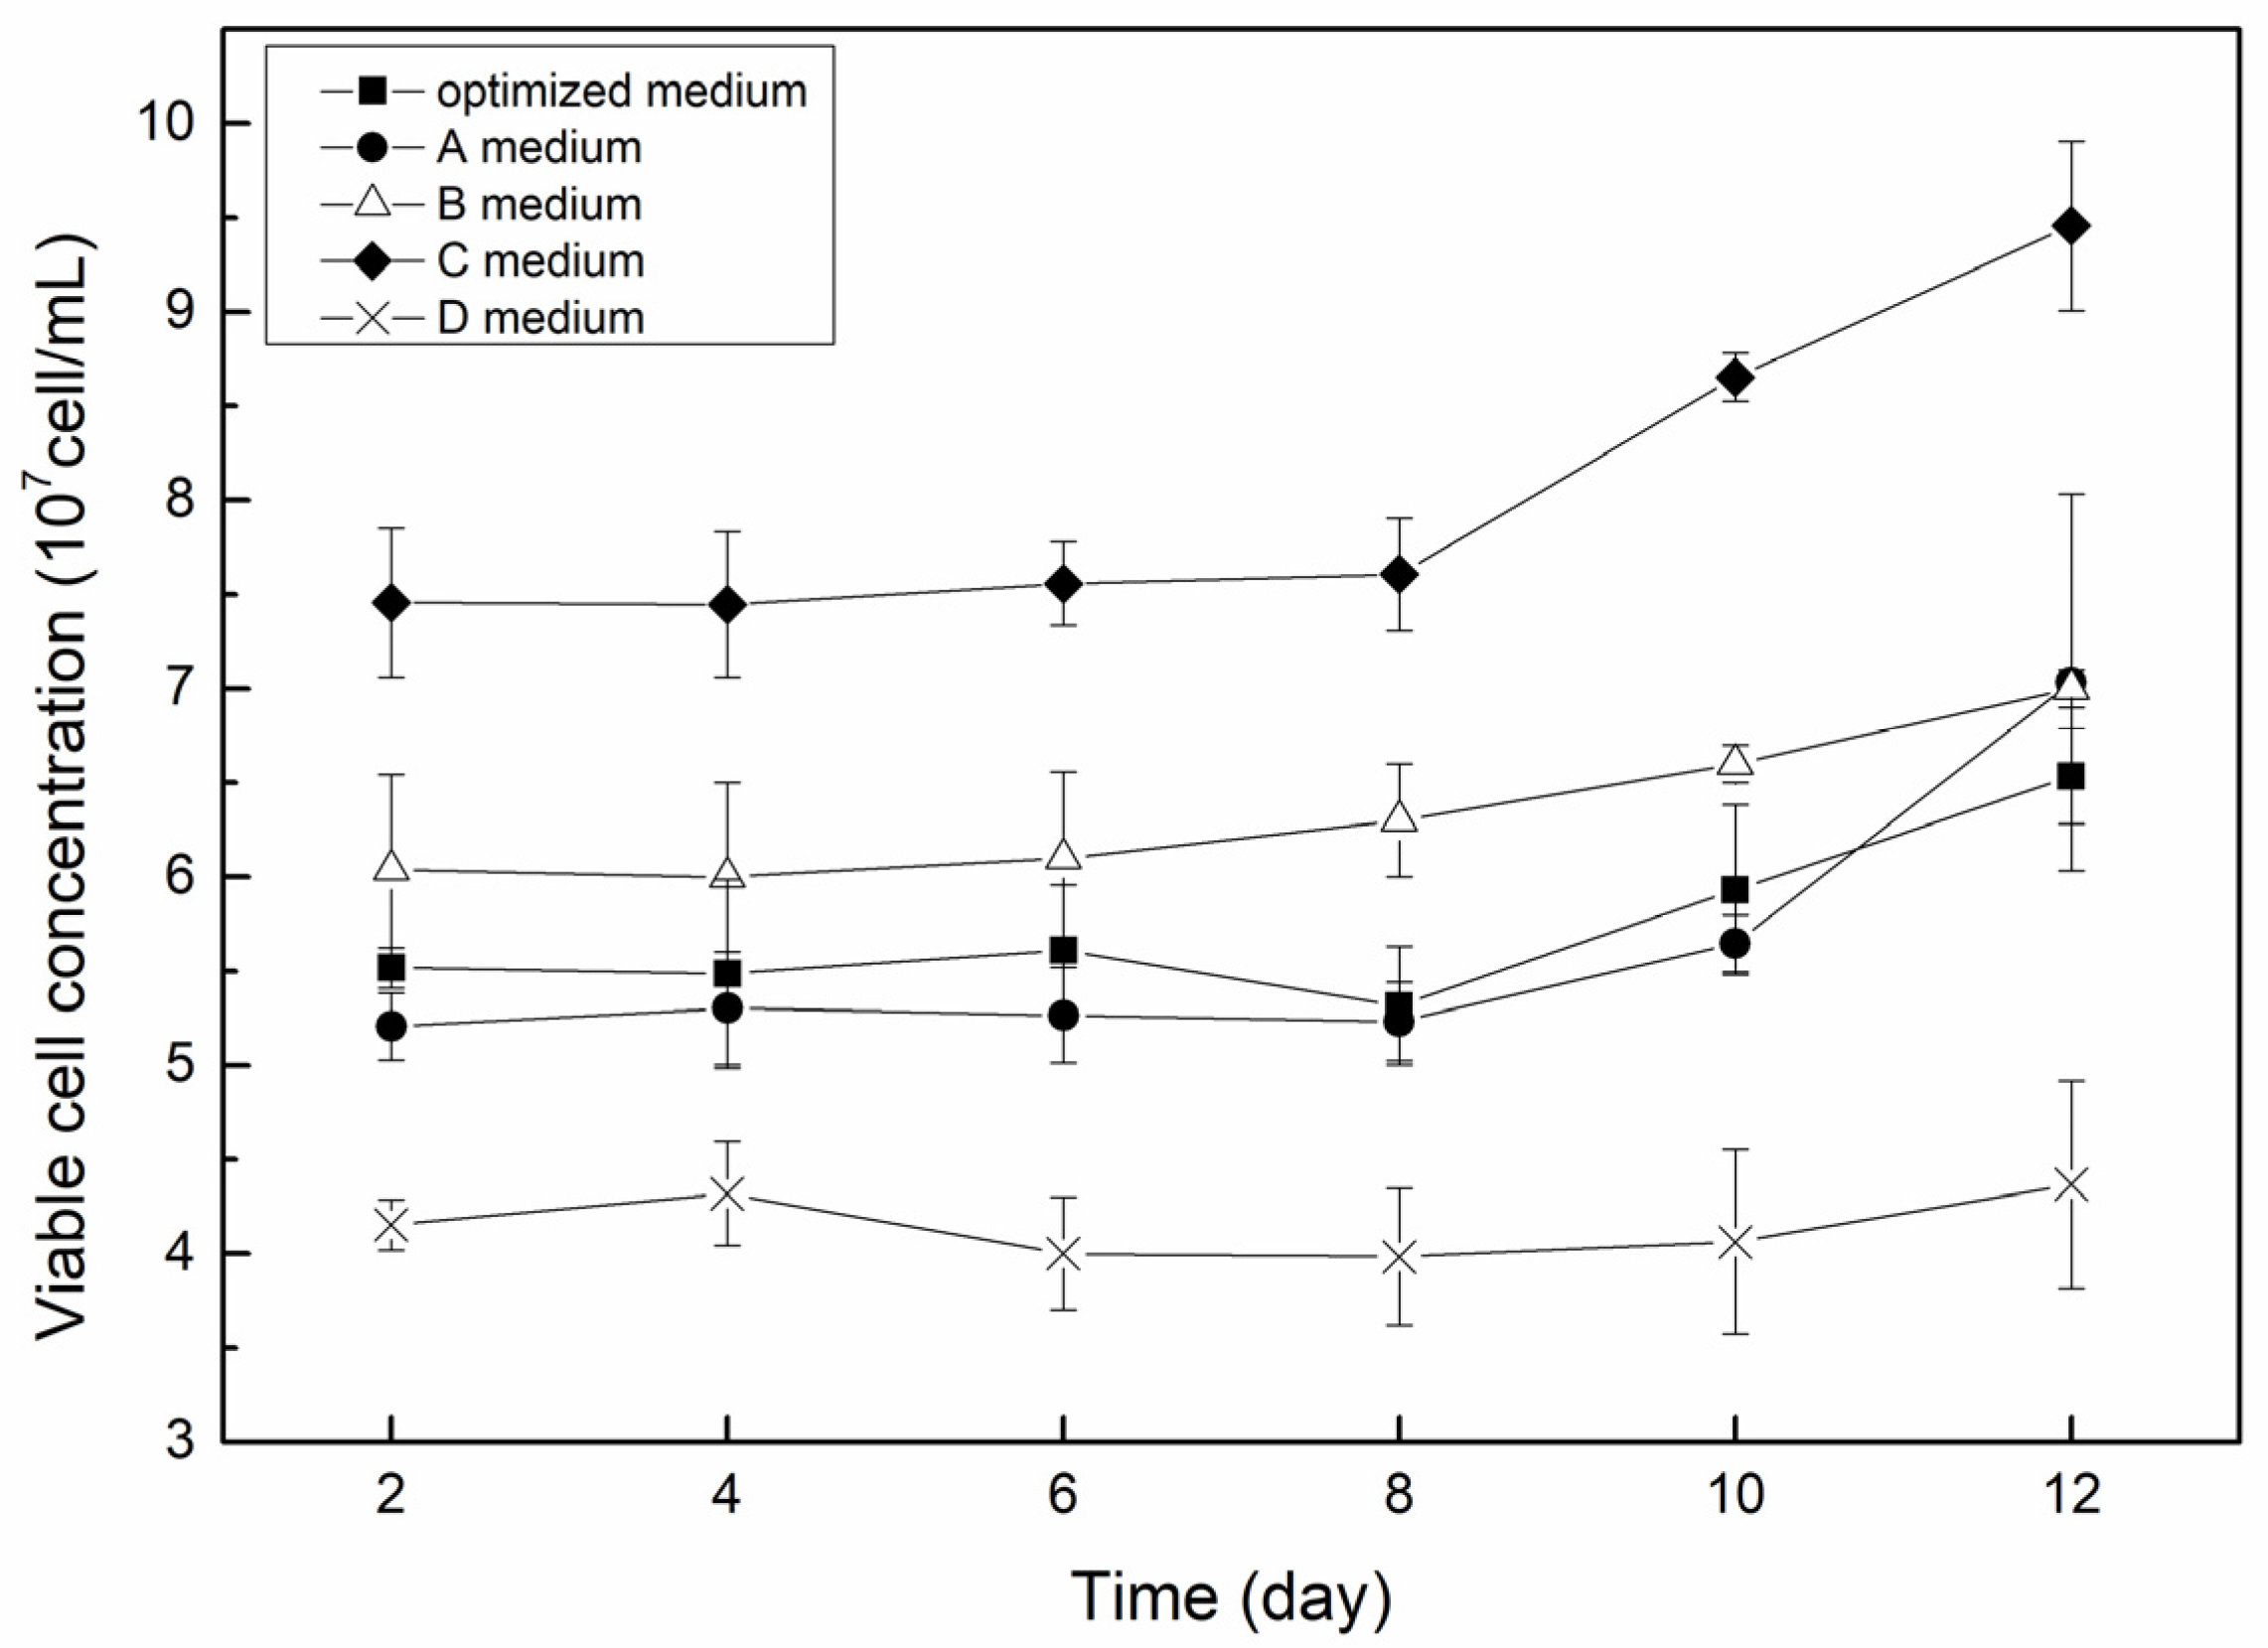
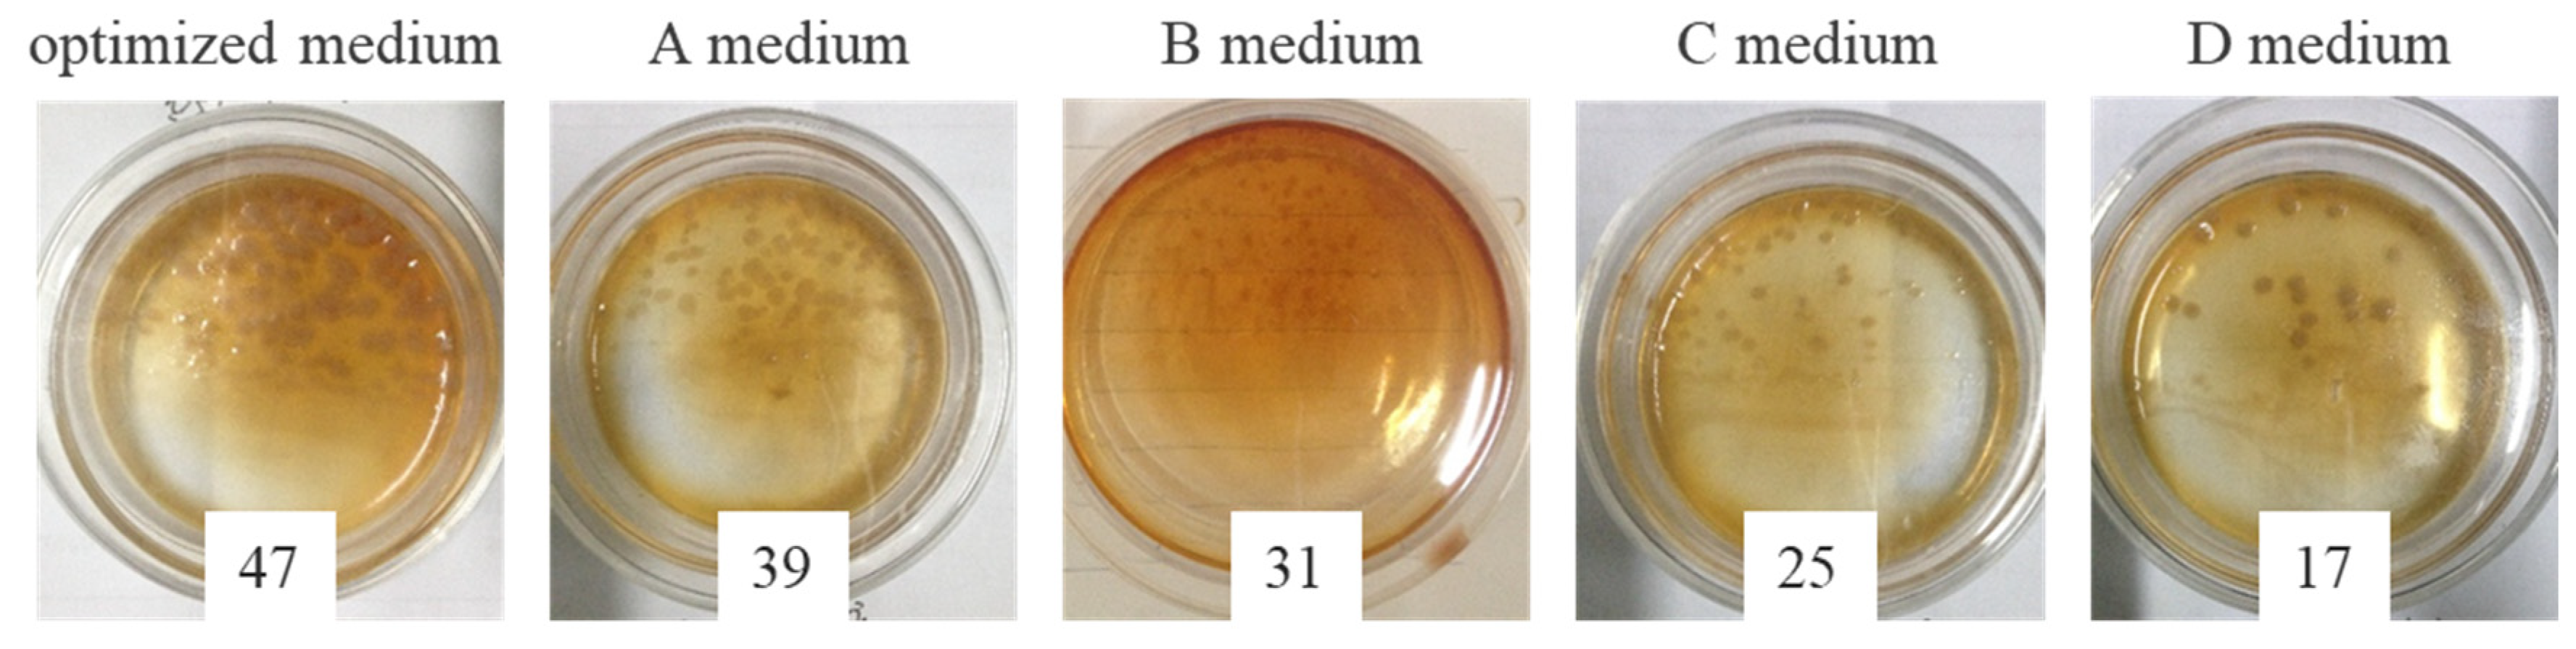
3.2.1. Viable Cell Concentration in Effluent
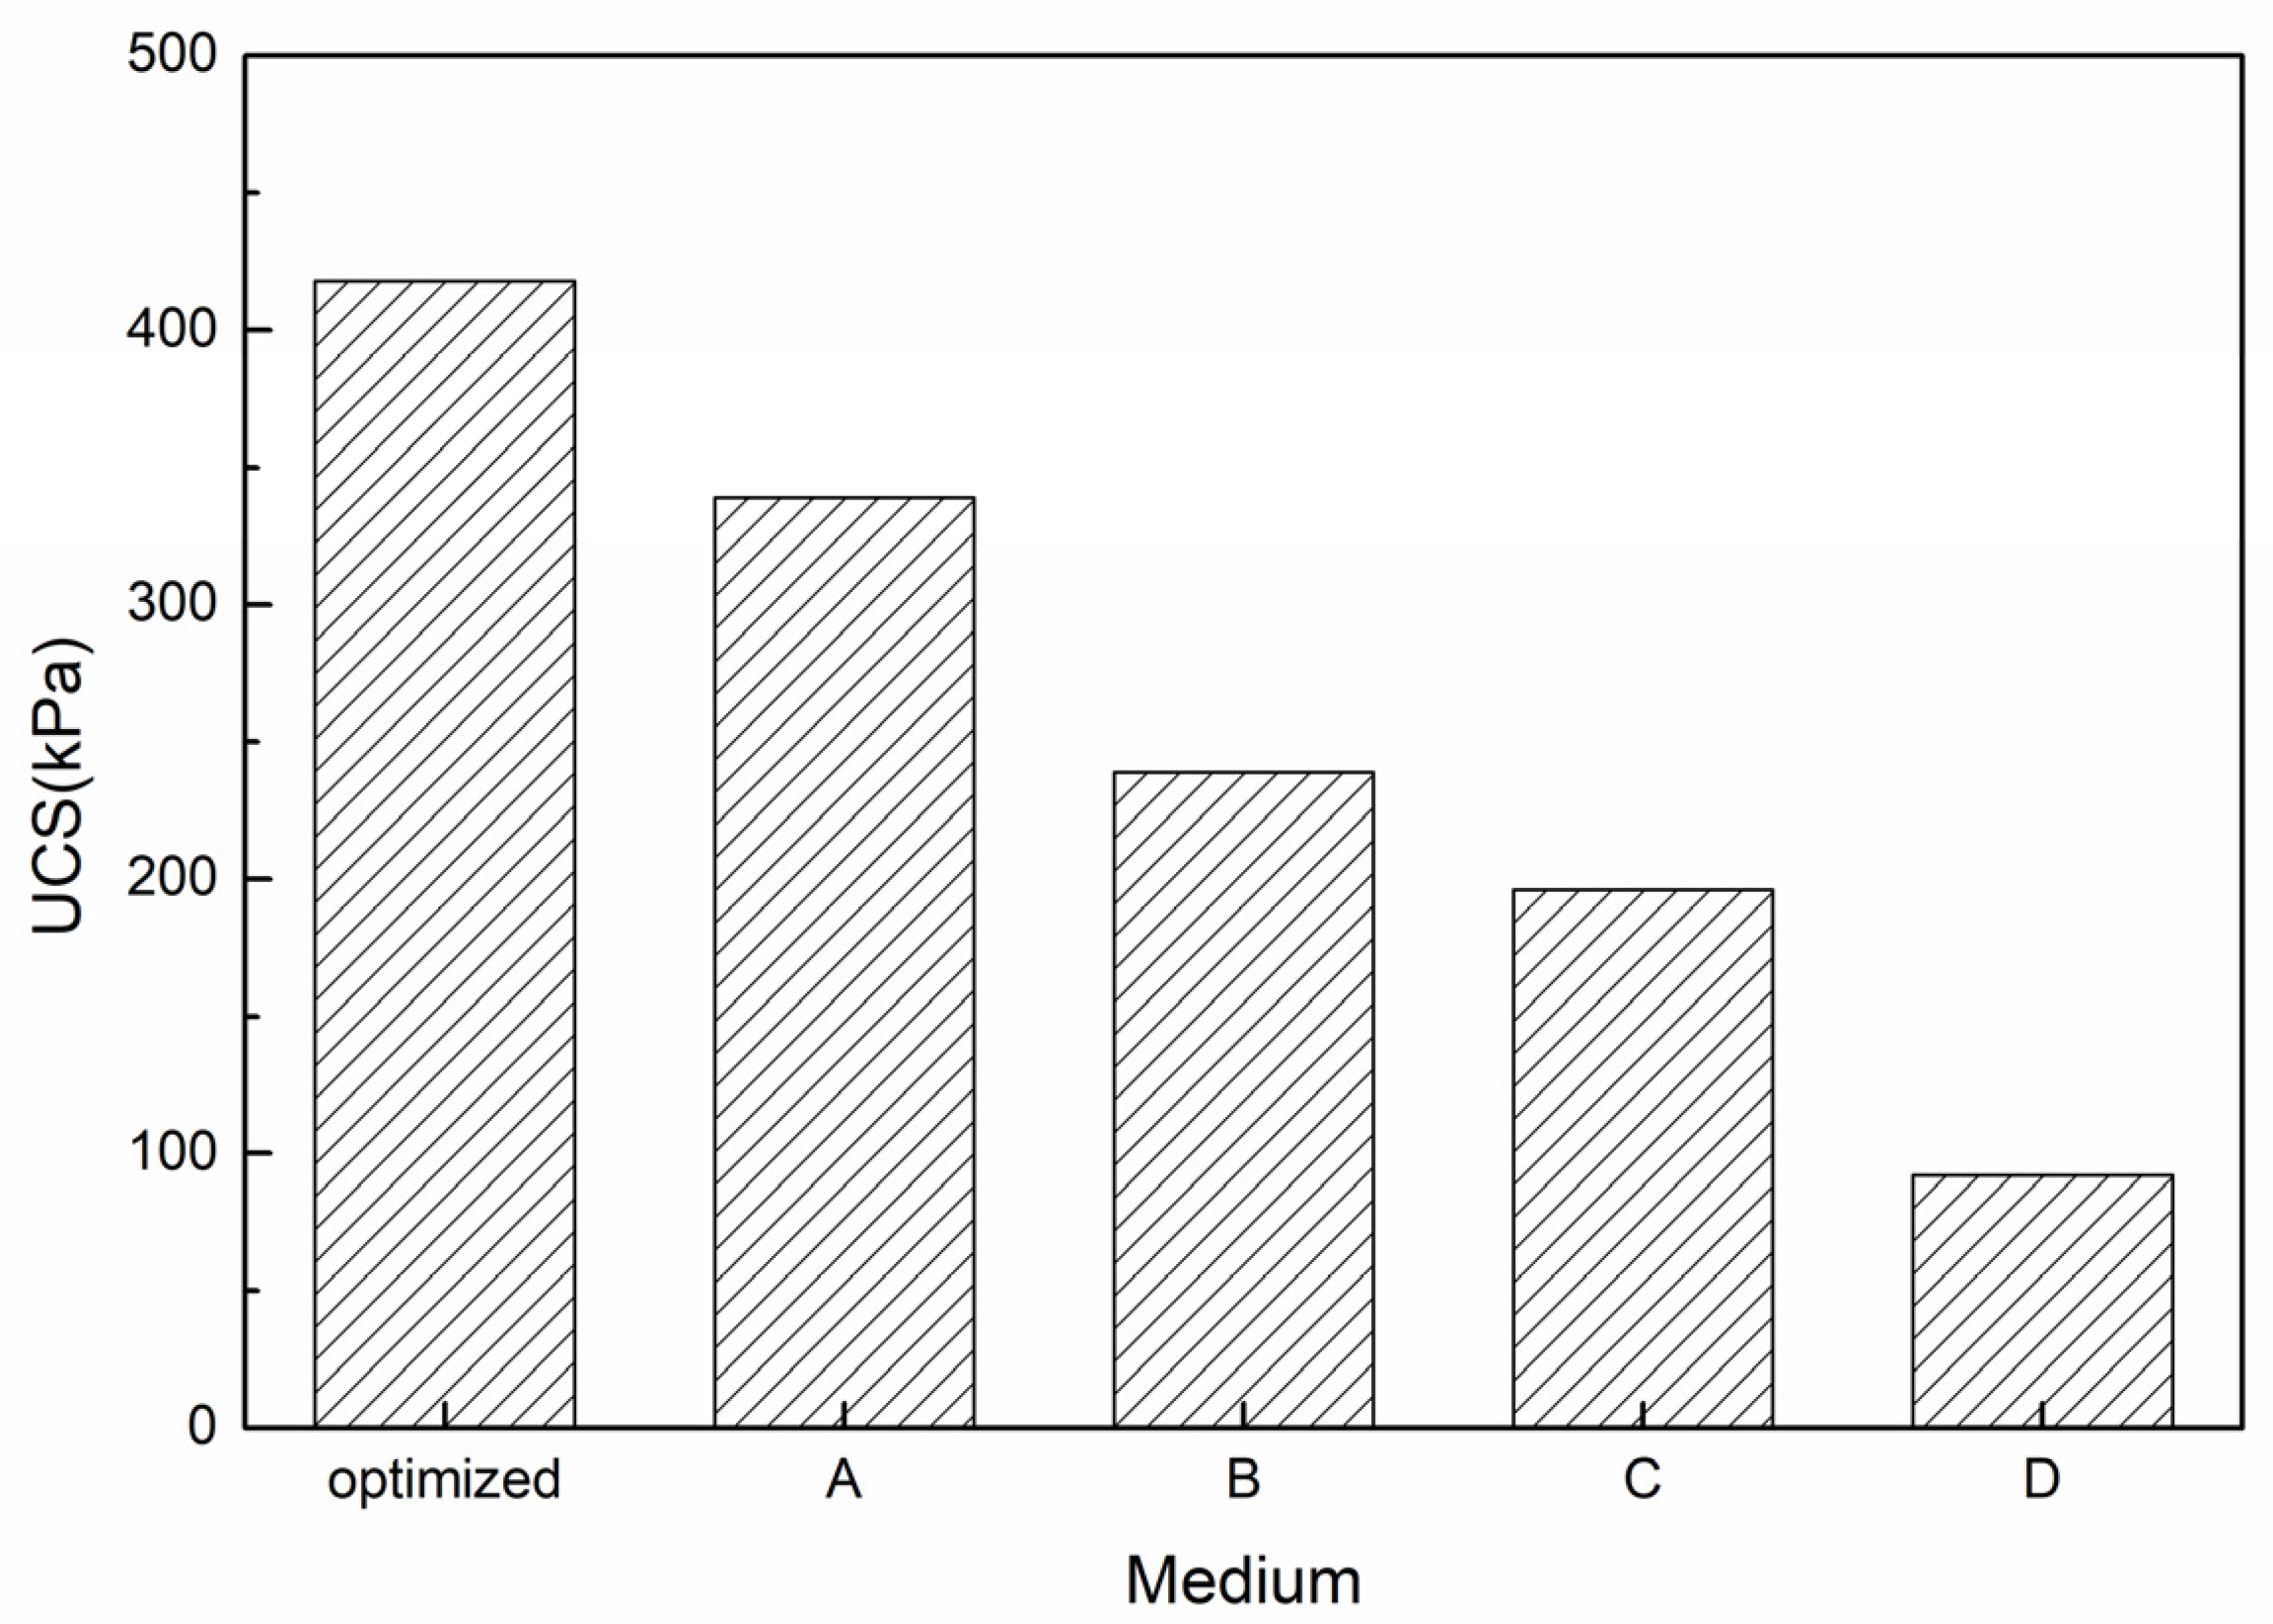
The MICP technology has the potential to be used extensively because of the cementing characteristics of CaCO3 precipitation [54]. In order to determine whether the optimized medium offers advantages for the bio-cementation of coarse materials, an analysis of the cementation effect is needed. Therefore, sand solidification tests with MICP were often conducted in previous studies [12,14,55]. Prior to each treatment cycle, the viable cell concentration (cell/mL) of the effluent was measured using the plate colony counting method, as shown in Figure 3. The viable cell concentrations in an effluent with the optimized medium and A medium were similar. After 8 days, the viable cell concentrations increased, which was due to less new bacterial cells being attached on the grain surface, resulting in more viable bacterial cell being left in the effluent. The phenomenon was also observed in Reference [56]. If the viable cell concentration (cell/mL) of the effluent was higher, there was two reasons. The first reason was that more nutrients left in the medium accelerated the biomass growth during the 48-h reaction period. This reason was demonstrated by measuring growth curves over time obtained from cultures, as shown in Figure 4. The second reason was due to decreased attached biomass in the river sediments matrix. This reason will be further analyzed in the “Calcium carbonate quantification” section. The growth of viable cells in the effluent of media A, C, and optimized increased more after 8 days, because more bacteria attached on the grain surface before 8 days, resulting in a smaller space left for later attachment.
For the B medium, the viable cell concentrations in effluent were always slightly larger compared with those observed for the optimized and A media, since polypeptone with a high concentration might provide more nutrients for biomass growth [4]. The viable cell concentration in the effluent with D medium was the smallest, only around 4 × 10⁷ cell/mL. For the D medium, most of the nutrients were consumed before 48 h, which indicated that there were not sufficient nutrients in the bacterial suspension for the bacterial growth and reproduction and biofilm growth between the two treatment cycles. Meanwhile, the viable cell concentration in the effluent did not fluctuate greatly, since the slow biofilm growth did not markedly affect the attachment of bacterial cells on the grain surface [38].
For the C medium, the viable cell concentrations in the effluent were larger than those observed for the other four media. The reason behind this might be that, after the cultivation of the bacteria, enough nutrients remained in the medium, which deserves further study. Furthermore, after 8 days, the increasing range of the viable cell concentration in the effluent for the C medium was also relatively larger, indicating that quick biofilm growth resulted in less new cells being attached on the grain surface.

3.2.2. UCS

The sample treated with optimized medium exhibited the largest strength (at about 420 kPa) (Figure 5), which was nearly two times higher than those exhibited by the samples treated with the C medium and 4.5 times greater than that of the sample treated with the D medium (only 92 kPa). The B medium and C medium had more nutrients in the medium than the optimized medium and A medium, but the samples treated with the B medium and C medium had worse cementation uniformity, eventually leading to smaller strengths than the sample with the optimized medium and A medium.
The strengths of the samples in this study were smaller than that reported in Reference [24]. According to the ASTM national standards, for soil samples, the largest particle size should be smaller than one-sixth of the specimen diameter, which should be 16.7 mm [57], but 25-mm aggregate in a 100-mm core would be acceptable for concrete testing [58]. When the coarse particles had smaller sizes, it is hard to say that the overall strength of the treated samples was attributed to the formation of bonding points between coarse particles rather than the filling of fines between those coarse particles. Therefore, coarse particles with larger sizes were used to conveniently study the cementation effects of the bonding points. It was because the pores could not be filled completely by bacteria and precipitation that the cementation effect of the bonding points contributed to the development of strength. The smaller strengths of the samples in this study were also because the coarse particles had larger sizes. In addition, aggregates up to 25 mm in a 100-mm-diameter column could potentially lead to nonuniform packing and, hence, smaller strength. A minimal unconfined compressive strength of 345 kPa is required to ensure the sufficiency in soil stabilization [59].

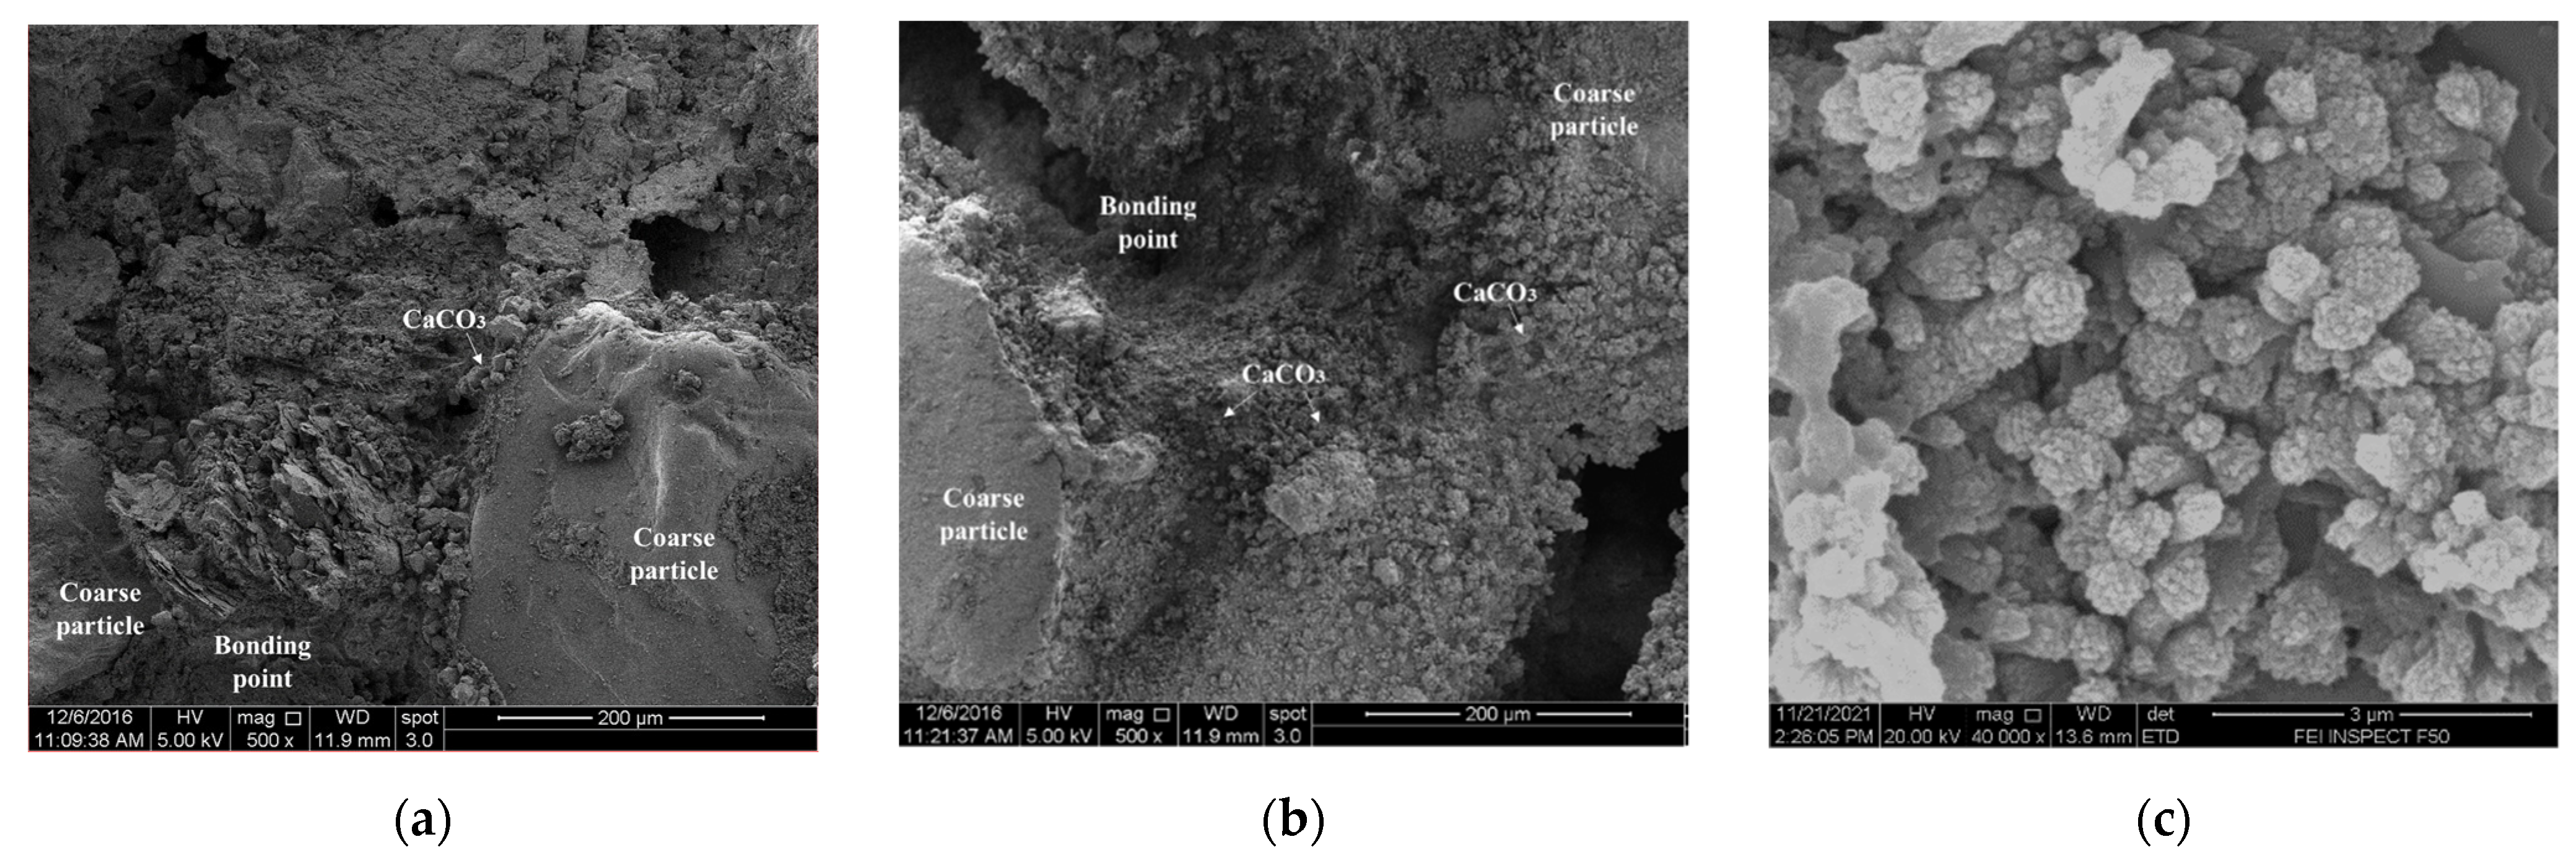
3.2.3. Scanning Electron Microscopy

Figure 6a shows that, in response to the optimized medium treatment, compared with on the coarse particle surface, a large number of CaCO3 crystals was produced between the coarse particles. Near the bottom corners, a sediment particle seemed to be broken, exposing a layered structure. This pattern was more likely to be a layered silicate mineral such as muscovite. Under flowing conditions, it may be more likely for bacteria to attach at contact points due to the physical straining of cells, and in partially saturated conditions, it may occur due to liquid hold-up at the contact points. However, in this experiment, the entire pore volume was saturated with a high concentration of bacterial suspension, and a 2-h static period (no flow) provided time for the bacterial cells to attach uniformly over the entire surface. Therefore, several minerals and bacterial biomass were deposited on the surfaces of the coarse particles.
Through observation, more CaCO3 crystals in the sample with the C medium treatment could be seen on the surfaces of the coarse particles, as shown in Figure 6b. In fact, the SEM images for the optimized media and the C media both showed CaCO3 almost everywhere. To study the effect of various media on biofilm growth and evaluate the cementation effect in the bonding points between coarse particles, the amounts of biofilm and contents of CaCO3 should be investigated. There are a large number of works demonstrating the production of calcium carbonate via XDS or any other X-ray diffraction techniques [14,24,60]. In this work, the existence of calcium carbonate was also demonstrated via XRD (Figure 7). The CaCO3 crystals was verified with the micrograph of Figure 1 in the study of Uenishi and Matsubara [61].

3.2.4. Biofilm Growth

Based on Equations (1) and (3), when sufficient nutrients and oxygen are available, the concentration of the suspended biomass increases; meanwhile, the biofilm grows gradually. Therefore, more nutrient resources in the medium resulted in a higher growth rate of the bacterial cell density, as well as the biofilm. The content of the biofilm is not easily quantified, and there is a lack of consensus among the diversity of techniques used to grow and study biofilms [62]. The plate colony counting method used in this present study to determine the CFU presents several limitations [63]; for example, a subpopulation of biofilm cells can be viable but nonculturable and will not be detected by the CFU approach. However, this method is the most widely used technique to estimate biofilm cell viability, and the requirements of the experiments can be fulfilled by most platforms. Moreover, the sample treated with the optimized medium had the largest strength, and the formation of bonding points between coarse particles was attributed to the optimized medium-formed biofilm. During the 48-h incubation period, bacterial growth and reproduction, biofilm growth, and biomineralization occurred [38]. The biofilm was sampled, and the viable cell concentration method was used to show the biomass concentrations in the bonding points, as shown in Figure 8. The measuring points were chosen around the bottom, which can be used to better show the cementation effect in the bonding points.
The contents of the biofilm in the samples treated with the optimized medium were the largest. For the A medium, the concentration of ammonium sulfate was smaller than that in the optimized medium, which might be the reason why the biofilm content of the samples treated with the A medium was smaller than with the optimized medium. The content of the biofilm in the sample treated with the A medium was a little larger than the samples treated with the B medium. It might be because the effect of polypeptone on biofilm growth was smaller than the effect of yeast extract on biofilm growth. High-concentration nutrients resulted in bacterial suspension with high concentrations of cells, which significantly impacted the cementation uniformity [4,16]. For the C medium, the content of the biofilm was much smaller, which indicated that less bacterial cells were attached on the grain surface. The biofilm content of the samples treated with the D medium was the smallest because of the much lower concentrations of nutrients.

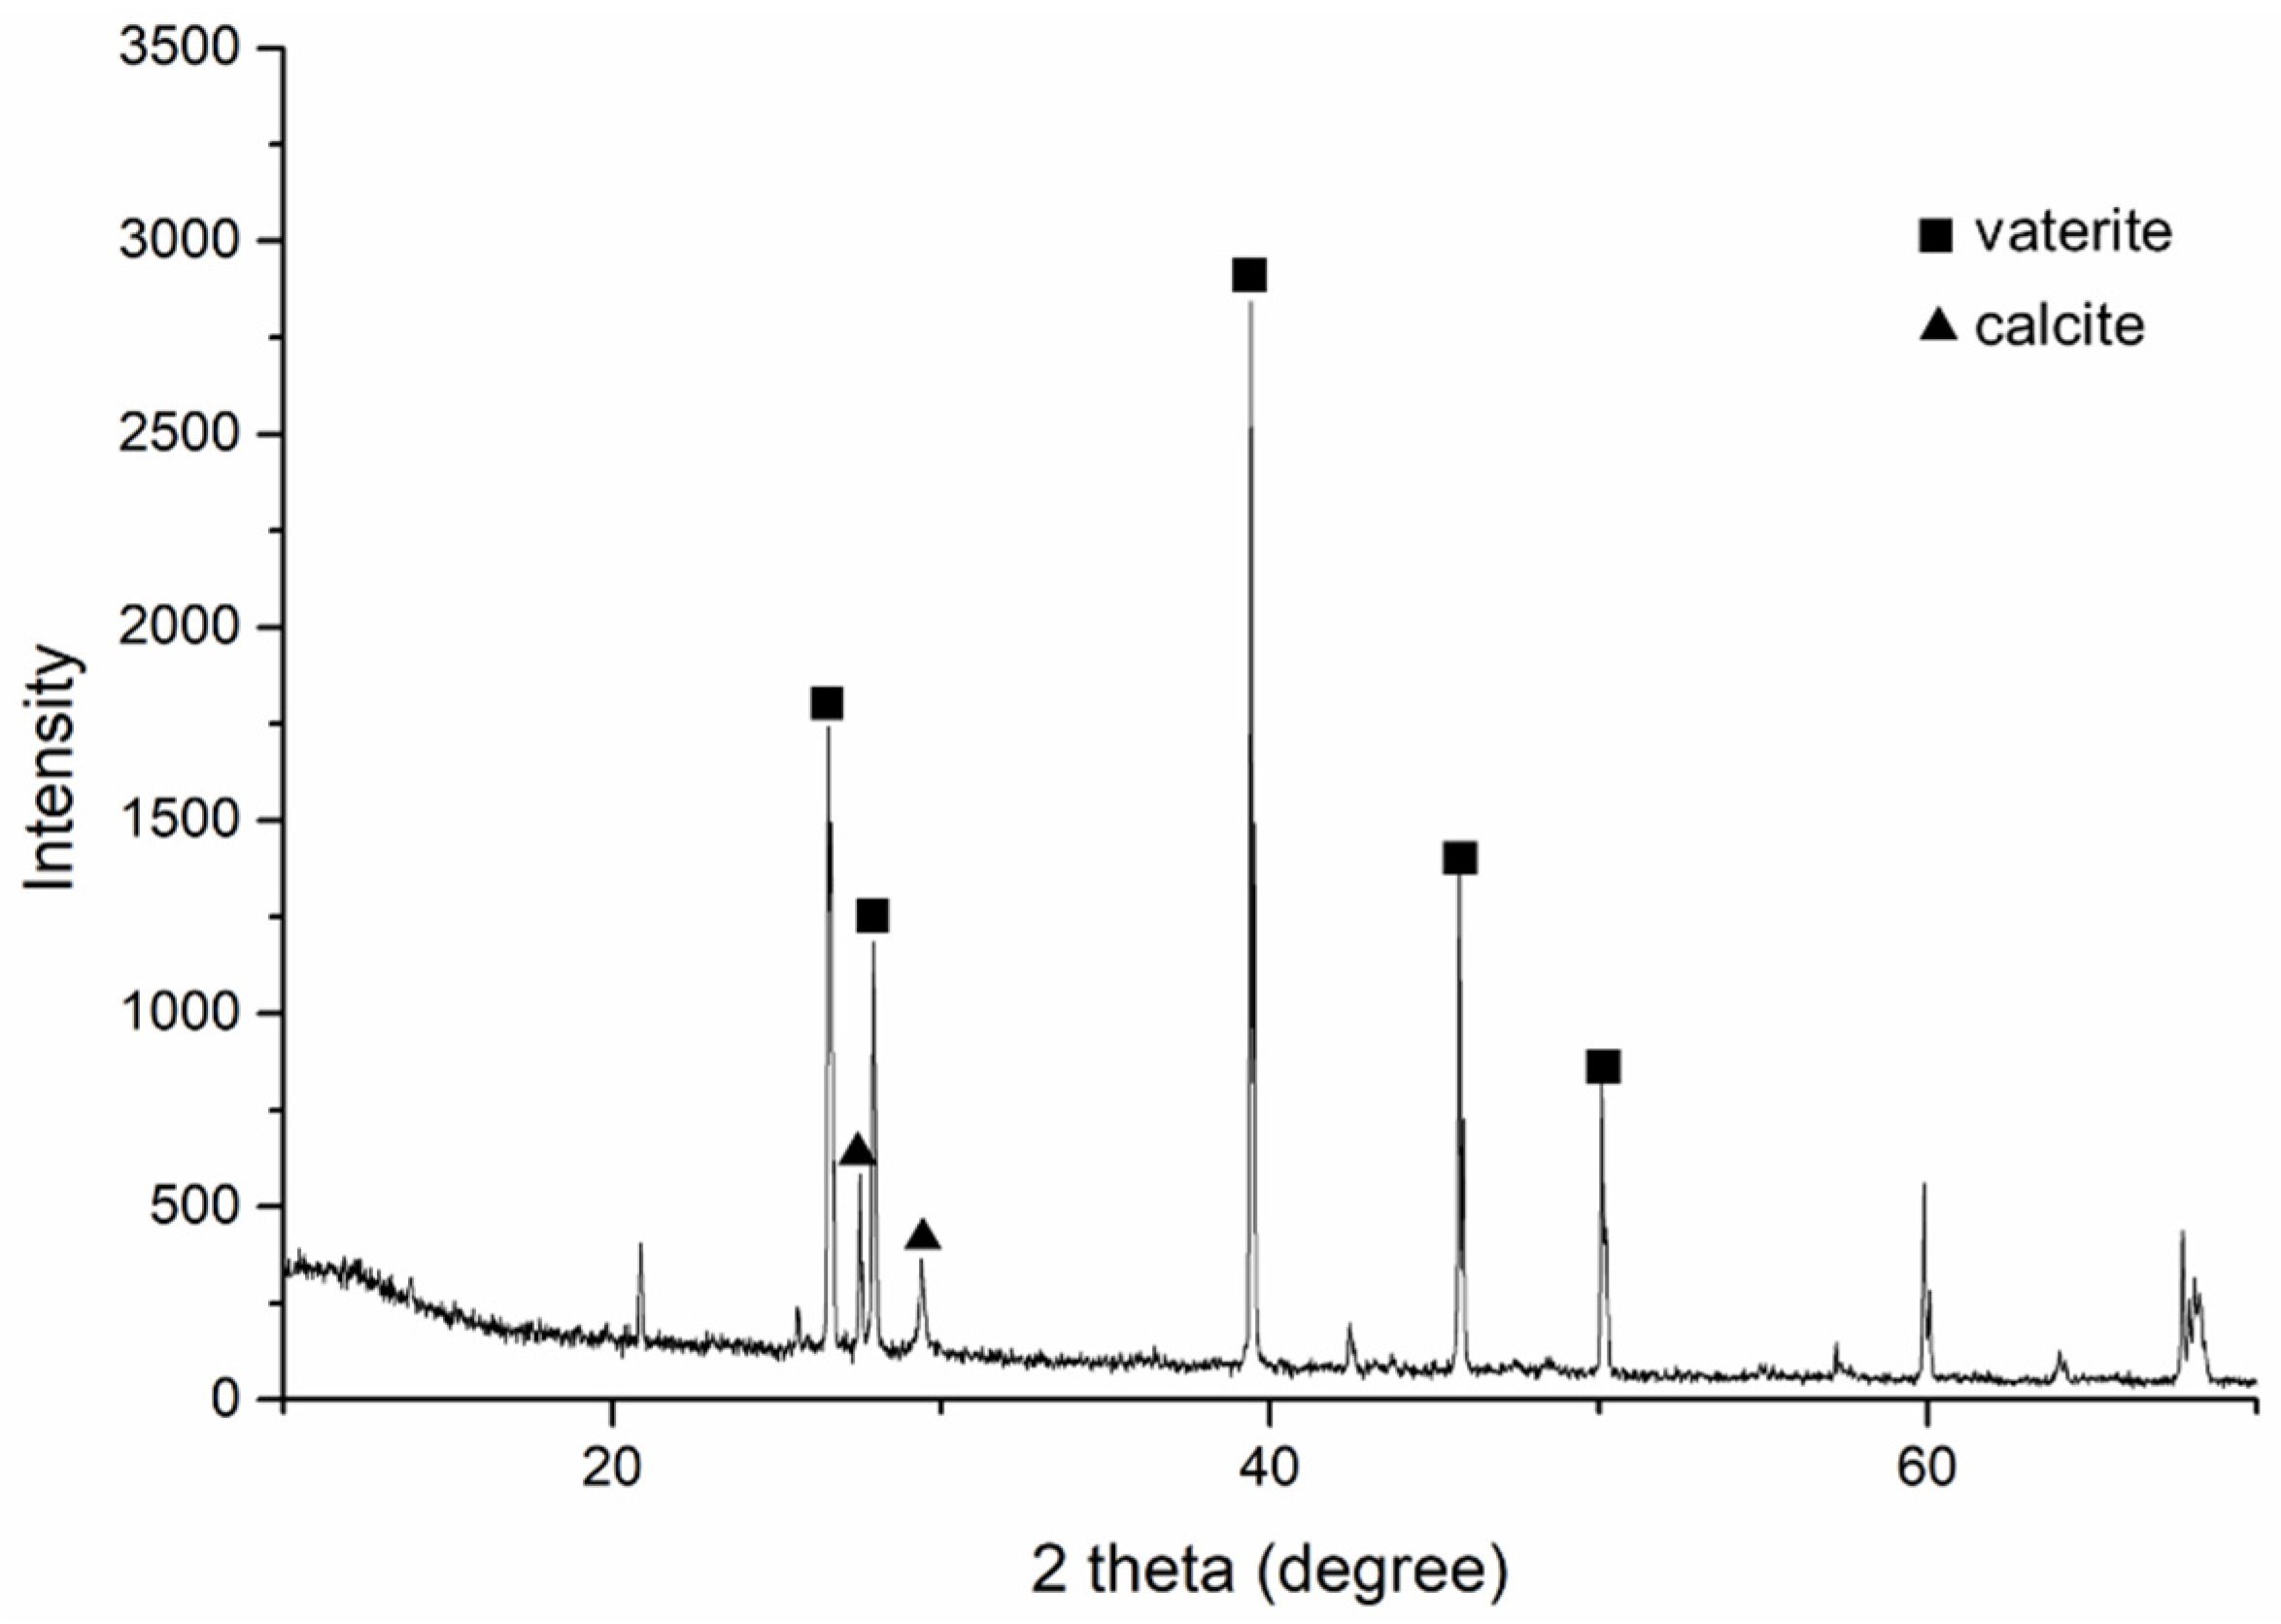
3.2.5. Calcium Carbonate Quantification

In the current study, a great number of coarse aggregates (75%) was used, and precipitated CaCO3 could not fill the pores; thus, the higher strength was attributed to the better cementation effect of the bonding points between the coarse particles. The better cementation effect was a result of the higher amount of precipitated CaCO3. According to Figure 8, the optimized medium resulted in greater biofilm growth and larger strength. A linear relationship was observed between the OD600 and ureolysis rate with S. pasteurii [64]. However, there was no linear relationship between the biofilm and ureolysis rate in previous studies; therefore, calcium carbonate quantification was then conducted to demonstrate that the optimized medium would lead to better cementation effects.
The distribution of the CaCO3 content along the bio-cemented granular columns is shown in Figure 9. Except for the C medium, the samples treated with the other four media exhibited good cementation uniformity. The CaCO3 content of the samples treated with the D medium was much smaller, since the D medium had less nutrients for biomass growth and biofilm growth and was not the optimum medium for S. pasteurii, which was consistent with the results of the biofilm contents. The CaCO3 content of the sample treated with the optimized medium reached almost 10%, indicating that there was much more CaCO3 as compared to the other four columns. Many factors can impact the type and amount of CaCO3 precipitation, such as the rate of urea hydrolysis, urea and calcium dosages, and amino acids [65,66,67,68,69]. In the present study, the nutrients in the medium affected the biofilm growth, which also affected the amount of CaCO3 precipitation. For the decrease in CaCO3 with the depth in the sample with medium C, the reason might be the decreased oxygen concentrations in the bottom or the larger inhibition effect on transport due to bacterial suspension with high-concentration cells.

4. Conclusions

The low efficiency of coarse aggregates for bio-cementation is one of the challenges in the large-scale application of MICP. For various building materials with different particle sizes, the initial biomass concentration and biomass growth rate can be controlled. As a consequence, the optimized medium (20.0-g/L yeast extract, 10.0-g/L polypeptone, 5.0-g/L ammonium sulfate, and 10.0-g/L NaCl) was used to increase the cementation effect of the coarse materials. Furthermore, the tests were conducted with the bacterium grown in different culture media. The samples treated with the optimized medium exhibited the highest UCS value. The optimized medium can promote biofilm growth and increase CaCO3 precipitation at the bonding points between the coarse particles, eventually leading to better cementation effects. The practicability of the optimized medium was demonstrated by the bio-cementation test, which provides a solid foundation for soil stabilization and can be applied in the civil and material engineering fields. The transfer to a natural environment is a major step before the final conclusion about the value of the used method; therefore, further field experiments and studies will be conducted.

Author Contributions

Conceptualization, H.G. and S.D.; methodology, H.G. and S.D.; investigation, H.G.; writing—original draft preparation, H.G.; writing—review and editing, H.G. and S.D.; supervision, H.G. and S.D.; funding acquisition, H.G. and S.D. All authors have read and agreed to the published version of the manuscript.

Funding

This research received no external funding.

Data Availability Statement

Some or all data, models, or code that support the findings of this study are available from the corresponding author upon reasonable request.

Acknowledgments

The authors thank the valuable comments from the reviewers.

Conflicts of Interest

The authors declare that they have no conflict of interest.

References

  1. Cuthbert, M.; Mcmillan, L.; Handley-Sidhu, S.; Riley, M.; Tobler, D.; Phoenix, V. A field and modeling study of fractured rock permeability reduction using microbially induced calcite precipitation. Environ. Sci. Technol. 2013, 47, 13637–13643. [Google Scholar] [CrossRef] [PubMed]
  2. Montoya, B.; DeJong, J.; Boulanger, R. Dynamic response of liquefiable sand improved by microbial-induced calcite precipitation. Géotechnique 2013, 63, 302–312. [Google Scholar] [CrossRef]
  3. Soon, N.; Lee, L.; Khun, T.; Ling, H. Factors affecting improvement in engineering properties of residual soil through microbial-induced calcite precipitation. J. Geotech. Geoenviron. Eng. 2014, 140, 04014006. [Google Scholar] [CrossRef]
  4. Sun, X.; Miao, L.; Tong, T.; Wang, C. Improvement of Microbial-Induced Calcium Carbonate Precipitation Technology for Sand Solidification. J. Mater. Civ. Eng. 2018, 30, 04018301. [Google Scholar] [CrossRef]
  5. DeJong, J.; Fritzges, M.; Nüsslein, K. Microbially induced cementation to control sand response to undrained shear. J. Geotech. Geoenviron. Eng. 2006, 132, 1381–1392. [Google Scholar] [CrossRef]
  6. Sun, X.; Miao, L.; Tong, T.; Wang, C. Study of the effect of temperature on microbially induced carbonate precipitation. Acta Geotech. 2018, 14, 627–638. [Google Scholar] [CrossRef]
  7. Pu, Q.; Jiang, L.; Xu, J.; Chu, H.; Xu, Y.; Zhang, Y. Evolution of pH and chemical composition of pore solution in carbonated concrete. Constr. Build. Mater. 2012, 28, 519–524. [Google Scholar] [CrossRef]
  8. Soon, N.; Lee, L.; Khun, T.; Ling, H. Improvements in engineering properties of soils through microbial-induced calcite precipitation. KSCE J. Civ. Eng. 2013, 17, 718–728. [Google Scholar] [CrossRef]
  9. Wijngaarden, W.; Vermolen, F.; Meurs, G.; Vuik, C. Modelling biogrout: A new ground improvement method based on microbial-induced carbonate precipitation. Transp. Porous Media. 2011, 87, 397–420. [Google Scholar] [CrossRef] [Green Version]
  10. Wu, Y.; Ajo-Franklin, J.B.; Spycher, N.; Hubbard, S.S.; Smith, R. Geophysical monitoring and reactive transport modeling of ureolytically-driven calcium carbonate precipitation. Geochem. Trans. 2011, 12, 7. [Google Scholar] [CrossRef] [Green Version]
  11. Martin, D.; Elphick, S.; Ngwenya, B.; Dodds, K.; Butler, I. Inhibition of sporosarcina pasteurii under anoxic conditions:implications for subsurface carbonate precipitation and. Environ. Sci. Technol. 2012, 46, 8351–8355. [Google Scholar] [CrossRef] [PubMed]
  12. Martinez, B.; DeJong, J.; Ginn, T.; Montoya, B.; Barkouki, T.; Hunt, C.; Tanyu, B.; Major, D. Experimental optimization of microbial-induced carbonate precipitation for soil improvement. J. Geotech. Geoenviron. Eng. 2013, 139, 587–598. [Google Scholar] [CrossRef]
  13. Zhang, Y.; Guo, H.; Cheng, X. Role of calcium sources in the strength and microstructure of microbial mortar. Constr. Build. Mater. 2015, 77, 160–167. [Google Scholar] [CrossRef]
  14. Whiffin, V.; Paassen, L.; Harkes, M. Microbial carbonate precipitation as a soil improvement technique. Geomicrobiol. J. 2007, 24, 417–423. [Google Scholar] [CrossRef]
  15. Sun, X.; Miao, L.; Wang, C. Glucose addition improves the bio-remediation efficiency for crack repair. Mater. Struct. 2019, 52, 111. [Google Scholar] [CrossRef]
  16. Khan, M.; Amarakoon, G.; Shimazaki, S.; Kawasaki, S. Coral sand solidification test based on microbially induced carbonate precipitation using ureolytic bacteria. Mater. Trans. 2015, 56, 1725–1732. [Google Scholar] [CrossRef] [Green Version]
  17. Sun, X.; Miao, L.; Wu, L.; Wang, H. Theoretical quantification for cracks repair based on microbially induced carbonate precipitation (MICP) method. Cem. Concr. Compos. 2021, 118, 103950. [Google Scholar] [CrossRef]
  18. Shahrokhi-Shahraki, R.; Zomorodian, S.; Niazi, A.; O’Kelly, B. Improving sand with microbial-induced carbonate precipitation. Proc. Inst. Civ. Eng.-Ground Improv. 2015, 168, 217–230. [Google Scholar] [CrossRef]
  19. Salifu, E.; MacLachlan, E.; Iyer, K.; Knapp, C.; Tarantino, A. Application of microbially induced calcite precipitation in erosion mitigation and stabilisation of sandy soil foreshore slopes: A preliminary investigation. Eng. Geol. 2016, 201, 96–105. [Google Scholar] [CrossRef] [Green Version]
  20. Hamdan, N.; Kavazanjian, E.; Rittmann, B.; Karatas, I. Carbonate mineral precipitation for soil improvement through microbial denitrification. Geomicrobiol. J. 2017, 34, 139–146. [Google Scholar] [CrossRef] [Green Version]
  21. Sun, X.; Miao, L.; Yuan, J.; Wang, H.; Wu, L. Application of Enzymatic Calcification for dust control and rainfall erosion resistance improvement. Sci. Total Environ. 2020, 759, 143468. [Google Scholar] [CrossRef] [PubMed]
  22. Sun, X.; Miao, L.; Wang, H.; Yuan, J.; Fan, G. Enhanced rainfall erosion durability of enzymatically induced carbonate precipitation for dust control. Sci. Total Environ. 2021, 791, 148369. [Google Scholar] [CrossRef] [PubMed]
  23. Sun, X.; Miao, L.; Wang, H.; Yin, W.; Wu, L. Mineralization crust field experiment for desert sand solidification based on enzymatic calcification. J. Environ. Manag. 2021, 287, 112315. [Google Scholar] [CrossRef] [PubMed]
  24. Mahawish, A.; Bouazza, A.; Gates, W. Effect of particle size distribution on the bio-cementation of coarse aggregates. Acta Geotechnica. 2018, 13, 1019–1025. [Google Scholar] [CrossRef]
  25. Khoubani, A.; Nafisi, A.; Evans, T.; Montoya, B. The effect of grain size and shape on mechanical behavior of MICP treated sand ii: Numerical study. In Bio-Mediated and Bio-Inspired Geotechnics; Springer: Berlin/Heidelberg, Germany, 2018. [Google Scholar]
  26. Cunningham, A.; Gerlach, R.; Spangler, L.; Mitchell, A.; Parks, S.; Phillips, A. Reducing the risk of wellbore leakage of CO2 using engineered biomineralization barriers. Energy Procedia 2011, 4, 5178–5185. [Google Scholar] [CrossRef]
  27. Mitchell, A.; Phillips, A.; Schultz, L.; Parks, S.; Spangler, L.; Cunningham, A.; Microbial, R. Microbial CaCO3 mineral formation and stability in an experimentally simulated high pressure saline aquifer with supercritical CO2. Int. J. Greenh. Gas Control. 2013, 15, 86–96. [Google Scholar] [CrossRef] [Green Version]
  28. Afrapoli, M.S.; Alipour, S.; Torsaeter, O. Fundamental study of pore scale mechanisms in microbial improved oil recovery processes. Transp. Porous Media 2011, 90, 949–964. [Google Scholar] [CrossRef]
  29. Li, M.; Guo, H.; Cheng, X. Application of response surface methodology for carbonate precipitation production induced by a mutant strain of Sporosarcina pasteurii. GeoFrontiers Adv. Geotech. Eng. 2011, 4079–4088. [Google Scholar]
  30. De Muynck, W.; Verbeken, K.; De Belie, N.; Verstraete, W. Influence of urea and calcium dosage on the effectiveness of bacterially induced carbonate precipitation on limestone. ECOL ENG 2010, 36, 99–111. [Google Scholar] [CrossRef]
  31. Fredrickson, J.; Fletcher, M.; Frederickson, J.; Fletcher, M. Subsurface Microbiology and Biogeochemistry; John Wiley & Sons: Hoboken, NJ, USA, 2001. [Google Scholar]
  32. ASTM. Standard practice for classification of soils for engineering purposes (Unified Soil Classification System). In ASTM Standard D2487; American Society for Testing and Materials: West Conshohocken, PA, USA, 2006. [Google Scholar]
  33. Iqbal, D.; Wong, L.; Kong, S. Bio-cementation in construction materials: A review. Materals 2021, 14, 2175. [Google Scholar] [CrossRef]
  34. ASTM. Standard Practice for Capping Cylindrical Concrete Specimens. In ASTM Standard C617; American Society for Testing and Materials: West Conshohocken, PA, USA, 2015. [Google Scholar]
  35. Monod, J. The growth of bacterial cultures. Annu. Rev. Microbiol. 1949, 3, 371–394. [Google Scholar] [CrossRef] [Green Version]
  36. Vandevivere, P.; Baveye, P.; Sanchez de Lozada, D.; DeLeo, P. Microbial clogging of saturated soils and aquifer materials: Evaluation of mathematical models. Water Resour. Res. 1995, 31, 2173–2180. [Google Scholar] [CrossRef]
  37. Ebigbo, A.; Phillips, R.; Gerlach, R.; Helmig, A.; Cunningham, H.; Class, L. Darcy-scale modeling of microbiallyinduced carbonate mineral precipitation in sand columns. Water Resour. Res. 2012, 48, W07519. [Google Scholar] [CrossRef]
  38. Qin, C.; Hassanizadeh, S. Pore-network modeling of solute transport and biofilm growth in porous media. Transp. Porous Media 2015, 110, 345–367. [Google Scholar] [CrossRef] [Green Version]
  39. Qin, C.; Hassanizadeh, S.; Ebigbo, A. Pore-scale network modeling of microbially induced calcium carbonate precipitation: Insight into scale dependence of biogeochemical reaction rates. Water Resour. Res. 2016, 52, 8794–8810. [Google Scholar] [CrossRef]
  40. Fan, S. Preliminary Research on a Novel Soil Improvement Technique by Microbial Denitrification; Huazhong University of Science and Technology: Wuhan, China, 2012. (In Chinese) [Google Scholar]
  41. Lioliou, M.; Paraskeva, C.; Koutsoukos, P.; Payatakes, A. Heterogeneous nucleation and growth of calcium carbonate on calcite and quartz. J. Colloid Interface Sci. 2007, 308, 421–428. [Google Scholar] [CrossRef]
  42. Noiriel, C.; Steefel, L.; Yang, J.; Ajo-Franklin, J. Upscaling calcium carbonate precipitation rates from pore to continuum scale. Chem. Geol. 2012, 318–319, 60–74. [Google Scholar] [CrossRef] [Green Version]
  43. Kim, D.; Mahabadi, N.; Jang, J.; Paassen, L.A. Assessing the Kinetics and Pore Scale Characteristics of Biological Calcium Carbonate Precipitation in Porous Media using a Microfluidic Chip Experiment. Water Resour. Res. 2020, 56, e2019WR025420. [Google Scholar] [CrossRef]
  44. Mitchell, A.; Grant Ferris, F. The influence of bacillus pasteurii on the nucleation and growth of calcium carbonate. Geomicrobiol. J. 2006, 23, 213–226. [Google Scholar] [CrossRef]
  45. Chou, L.; Garrels, R.M.; Wollast, R. Comparative study of the kinetics and mechanisms of dissolution of carbonate minerals. Chem. Geol. 1989, 78, 269–282. [Google Scholar] [CrossRef]
  46. Castanier, S.; Metayer-Levrel, G.; Perthuisot, J. Bacterial roles in the precipitation of carbonate minerals. In Microbial Sediments; Springer: Berlin/Heidelberg, Germany, 2000; pp. 32–39. [Google Scholar]
  47. Van Paassen, L. Biogrout Ground Improvement by Microbially Induced Carbonate Precipitation. Ph.D. Thesis, Delft University of Technology, Delft, The Netherlands, 2009. [Google Scholar]
  48. Zavarzin, G. Microbial geochemical calcium cycle. Microbiology 2002, 71, 1–17. [Google Scholar] [CrossRef]
  49. Rebata-landa, V.; Santamarina, J. Mechanical effects of biogenic nitrogen gas bubbles in soils. J. Geotech. Geoenviron. Eng. 2012, 138, 128–137. [Google Scholar] [CrossRef]
  50. Fukue, M.; Ono, S.; Sato, Y. Cementation of sands due to microbiologically-induced carbonate precipitation. Soils Found. 2011, 51, 83–93. [Google Scholar] [CrossRef] [Green Version]
  51. Connolly, J.; Kaufman, M.; Rothman, A.; Gupta, R.; Redden, G.; Schuster, M.; Colwell, F.; Gerlach, R. Construction of two ureolytic model organisms for the study of microbially induced calcium carbonate precipitation. J. Microbiol. Methods 2013, 94, 290–299. [Google Scholar] [CrossRef] [Green Version]
  52. Taylor, S.; Jaffé, P. Substrate and biomass transport in a porous medium. Water Resour. Res. 1990, 26, 2181–2194. [Google Scholar] [CrossRef]
  53. Hommel, J.; Lauchnor, A.; Phillips, R.; Gerlach, A.; Cunningham, R.; Helmig, A.; Ebigbo, H. A revised model for microbially induced calcite precipitation: Improvements and new insights based on recent experiments. Water Resour. Res. 2015, 51, 3695–3715. [Google Scholar] [CrossRef]
  54. Ivanov, V.; Chu, J. Applications of microorganisms to geotechnical engineering for bioclogging and biocementation of soil in situ. Rev. Environ. Sci. Biotechnol. 2008, 7, 139–153. [Google Scholar] [CrossRef]
  55. Sarmast, M.; Farpoor, M.H.; Sarcheshmehpoor, M.; Eghbal, M. Micromorphological and biocalcification effects of sporosarcina pasteurii and sporosarcina ureae in sandy soil columns. J. Agric. Sci. Technol. 2014, 16, 681–693. [Google Scholar]
  56. Sun, X.; Miao, L.; Chen, R. Adding Aluminum Oxide to Improve the Repairing Effect of Cracks Based on Bio-Remediation. J. Adv. Concr. Technol. 2019, 17, 177–187. [Google Scholar] [CrossRef] [Green Version]
  57. ASTM. Standard Test Method for Unconfined Compressive Strength of Cohesive Soil. In ASTM Standard D2166; American Society for Testing and Materials: West Conshohocken, PA, USA, 2006. [Google Scholar]
  58. ASTM. Standard Test Method for Obtaining and Testing Drilled Cores and Sawed Beams of Concrete. In ASTM Standard D2166; American Society for Testing and Materials: West Conshohocken, PA, USA, 2010. [Google Scholar]
  59. Wong, L.S. Formulation of an optimal mix design of stabilized peat columns with fly ash as a pozzolan. Arab. J. Sci. Eng. 2015, 40, 1015–1025. [Google Scholar] [CrossRef]
  60. Uenishi, R.; Matsubara, H. Calcium carbonate growth with the ring structure of stalactite-type minerals in a tuff breccia. Crystals. 2021, 11, 1117. [Google Scholar] [CrossRef]
  61. Whiffin, V. Microbial CaCO3 Precipitation for the Production of Biocement; Murdoch University: Perth, Australia, 2004. [Google Scholar]
  62. Joana, A.; Nuno, F.; Romain, B.; Nuno, C.; Tom, C.; Ana, R.; Mickaël, D.; Giovanni, D.; Michel, H.; Zoran, J.; et al. Critical review on biofilm methods. Crit. Rev. Microbiol. 2017, 43, 313–351. [Google Scholar]
  63. Li, L.; Mendis, N.; Trigui, H.; Oliver, J.; Faucher, S. The importance of the viable but non-culturable state in human bacterial pathogens. Front. Microbiol. 2014, 5, 258. [Google Scholar] [CrossRef] [Green Version]
  64. Lauchnor, E.; Topp, D.; Parker, A.; Gerlach, R. Whole cell kinetics of ureolysis by Sporosarcina pasteurii. J. Appl. Microbiol. 2015, 118, 1321–1332. [Google Scholar] [CrossRef] [PubMed] [Green Version]
  65. DeJong, J.; Martinez, B.; Mortensen, B.; Nelson, D.; Waller, J.; Weil, M.; Ginn, T.; Weathers, T.; Barkouki, T.; Fujita, Y. Upscaling of bio-mediated soil improvement. In Proceedings of the 17th International Conference on Soil Mechanics and Geotechnical Engineering, Alexandria, Egypt, 5–9 October 2009; pp. 2300–2303. [Google Scholar]
  66. Rodriguez-Navarro, C.; Rodriguez-Gallego, M.; Ben Chekroun, K.; Gonzalez-Munoz, M. Conservation of ornamental stone by myxococcus xanthus-induced carbonate biomineralization. Appl. Environ. Microbiol. 2003, 69, 2182–2193. [Google Scholar] [CrossRef] [Green Version]
  67. Braissant, O.; Cailleau, G.; Dupraz, C.; Verrecchia, E. Bacterially induced mineralization of calcium carbonate in terrestrial environments: The role of exopolysaccharides and amino acids. J. Sediment. Res. 2003, 73, 485–490. [Google Scholar] [CrossRef]
  68. Li, W.; Liu, L.; Chen, W.; Yu, L.; Li, W.; Yu, H. Calcium carbonate precipitation and crystal morphology induced by microbial carbonic anhydrase and other biological factors. Process Biochem. 2010, 45, 1017–1021. [Google Scholar] [CrossRef]
  69. De Muynck, W.; Verbeken, K.; De Belie, N.; Verstraete, W. Influence of temperature on the effectiveness of a biogenic carbonate surface treatment for limestone conservation. Appl. Microbiol. Biotechnol. 2013, 97, 1335–1347. [Google Scholar] [CrossRef]
Figure 1. Particle size distribution of granular materials.
Crystals 12 00188 g001
Figure 2. Flow chart of the treatment procedures.
Crystals 12 00188 g002
Figure 3. Viable cell concentrations in the effluent for various media.
Crystals 12 00188 g003
Figure 4. Growth curves over time for various media.
Crystals 12 00188 g004
Figure 5. UCS values for solidified columns.
Crystals 12 00188 g005
Figure 6. SEM images of samples treated with (a) the optimized medium (magnification = 500×), (b) C medium (magnification = 500×), and (c) optimized medium (magnification = 40,000×).
Crystals 12 00188 g006
Figure 7. XRD figure of the sample treated with the optimized medium.
Crystals 12 00188 g007
Figure 8. Images of the viable cell concentration method showing the biofilm growth (106 times dilution).
Crystals 12 00188 g008
Figure 9. Calcium carbonate content distribution.
Crystals 12 00188 g009
Table 1. Parameters in the model.
ParameterValueReference
Maximum   substrate   utilization   rate   k μ 4.1667 × 10⁻⁵ l/s[51]
Half   saturation   constant   of   oxygen   k o 2.0 × 10⁻⁵ g/L[37]
Half   saturation   constant   of   nutrient   K N 7.99 × 10⁻⁴ g/L[52]
Endogenous   decay   rate   k d e c , 1 3.18 × 10⁻⁷ g/L[52]
Empirical   parameter   K p H 6.15 × 10⁻¹⁰[39]
Biomass   attachment   rate   k a t t 6.15 × 10⁻⁷ mm/s[39]
Decay   rate   due   to   calcite   precipitation   k d e c , 2 1.0[53]
Biofilm   density   ρ f 2.0 g/L[53]
Calcite   density   ρ c 2710 g/L[37]
Constant   coefficient   β 0.1[39]
Molecular   weight   of   calcite   M c 100.09 g/mol[39]
Kinetic order n2[47]
Table 2. Media and OD600 used for the bio-cementation of coarse materials.
NameConcentration of Yeast Extract Concentration of PolypeptoneConcentration of Ammonium SulfateOptical Density (OD600)
Optimized medium20 g/L10 g/L5 g/L1.68
A medium20 g/L10 g/L0 g/L1.72
B medium20 g/L20 g/L5 g/L2.12
C medium33.63 g/L33.63 g/L0 g/L2.79
D medium5 g/L5 g/L5 g/L1.21
Publisher’s Note: MDPI stays neutral with regard to jurisdictional claims in published maps and institutional affiliations.

