Abstract
In this contribution, crystallization was performed to assess the kinetics of nucleation and crystal growth of L-lactide. In most common solvents, this compound shows very high solubility even at low temperatures, which could be challenging for crystallization process design. In the first part of this paper, the anti-solvent effects of n-hexane on solutions of L-lactide in tetrahydrofuran (THF) were investigated through studying the influence of solvent compositions on the solubility. Thanks to these effects, the solubility of the interested compound can be adjusted to desired degrees of supersaturation by adding suitable amounts of the anti-solvent. In the second part, a solvent composition at a mass ratio of 45/55 (n-hexane/THF) was chosen, and an isothermal seeded crystallization process was implemented. The evolution of the particle sizes and changes in the solute concentration profile of this process were monitored. Based on the obtained data, a widely used model, i.e., the population balance equation (PBE), was then utilized to model the crystal size distribution (CSD). Reasonable assumptions were made to reduce the mathematical complexity of the PBE. In the simplified model, only crystal growth and secondary nucleation were considered for model formulation, with assumptions of the size-independent growth rate and negligible size of nuclei. The kinetic parameters were estimated by using the seed and final-time crystal density functions in combination with variations in the concentration of the mother liquor. Indeed, the numerical solution for the one-dimensional problem of the L-lactide crystallization based on the estimated parameters gained a relatively good agreement with the determined CSD. Furthermore, the obtained model also correlated well with the variations in the solute concentration of the mother liquor. In short, this simple approach can be used for predicting the productivity and CSD of the L-lactide crystallization.
1. Introduction
Crystallization plays a crucial role in numerous applications, such as pharmaceuticals, the food industry, agriculture, etc. [1,2,3,4]. In many cases, monitoring and controlling crystallization trajectories are the major tasks that decide the process yield and optimize the quality of products, such as purity, morphology, and crystal size distribution (CSD). While trial-and-error experimentation is an inefficient approach, particularly for industrial scales, applying mathematical models for crystallization processes is of great interest. In fact, modeling and simulation can enhance understanding regarding complex processes, such as nucleation, crystal growth, aggregation, attrition, crystal breakage, etc. [4,5,6,7,8]. Among the well-known mathematical models, the population balance equations (PBE) are frequently exploited to describe particulate systems [4,7,8]. A comprehensive description of the PBE for crystallization should comprise all the mentioned processes. To reduce the complexity of the PBE, assumptions have been made for certain systems. For instance, Hu et al. [9] and Czapla et al. [10] successfully described crystallization processes for ammonium sulfate and threonine, respectively, in consideration of only nucleation and crystal growth while other phenomena were neglected. To solve the PBE, several numerical methods have been reported, including the finite element method [11,12], Monte Carlo method [13,14], moment method [10,15,16,17], method of characteristics (MOC) [18,19,20], etc. According to the MOC, a system of ordinary differential equations (ODEs) will be transformed from the given PBE. Thereby, the obtained ODEs will be solved along the characteristic curves. Compared to other methods, the MOC is of great benefit to calculate CSDs of particulate processes because this method can avoid problems of numerical instability and dispersion even on coarse meshes [20]. Additionally, the computational cost of this method is also lower than most of others. For these advantages, the MOC is applied in this research to describe the variation in the CSD of L-lactide over time.
Under suitable conditions of temperature, pressure, and catalysts, L-lactide can be synthesized from L-lactic acid, which is usually produced by fermentation of glucose or sucrose. These substances can be manufactured from agricultural waste or by-products, such as corn, barley, etc. [21]. L-lactide has been used as a precursor for developing biodegradable polylactide acid-based polymers [21,22,23]. Enhancing the purity and controlling the CSD of this compound are essential for polymerization. Therefore, study on the crystallization behavior of this compound is necessary. In order to perform a crystallization process, solubility data are needed as a basic input. Unfortunately, solubilities of L-lactide in different solvents are relatively limited in the literature. Thanks to Buchholz et. al, D-lactide was reported to be highly dissolvable in some solvents even at room temperature. For instance, its solubilities at 25 °C in 2-propanol, ethanol, and ethyl acetate were found at values of wt = 0.262, 0.404, and 0.753 (gsolute/gsolution), respectively [24]. The same conclusions can be derived for L-lactide in such achiral solvents. In another study, Chen et al. also demonstrated the highly soluble property of L-lactide in some solvents, especially in acetone, e.g., wt = 0.524 and 0.704 (gsolute/gsolution) at 26 and 55 °C, respectively [25]. Hence, seeking suitable anti-solvents that can be used to adjust the solubility of L-lactide is an important task to avoid extreme cooling and/or evaporating conditions for the crystallization process design.
In this paper, the anti-solvent effects of n-hexane on the L-lactide/tetrahydrofuran (THF) system were studied. Afterwards, the isothermal seeded crystallization processes of this compound were carried out in a selected mixed solvent of n-hexane/THF to evaluate the kinetic parameters of the secondary nucleation and crystal growth. Finally, the obtained model was used to predict the outcomes (such as productivity and CSD) of the investigated system at an arbitrary time.
2. Modeling
In general, a crystallization process consists of complex events, such as nucleation, crystal growth, aggregation, attrition, crystal breakage, etc. [4,5,6,7,8]. These events can occur consecutively and/or simultaneously; thus, solving a full PBE model is often challenging. Once secondary nucleation and crystal growth are considered as two dominant phenomena, the simplified 1D-PBE can be written as Equation (1). Herein, L is the crystal length that is chosen as the characteristic dimension for L-lactide crystals and is the population density function.
A hypothesis of size-independent crystal growth was taken into account; thus, G(t,L) was considered as a function of time G(t). The seed population was used as the initial condition (Equation (2)). In Equation (3), another hypothesis of negligible size of nuclei was applied [7,8], where B(t) and G(t) represent birth and growth terms.
The ith moment is defined as Equation (4).
Secondary nucleation and crystal growth models were assigned to Equations (5) and (6), where w and wsat are the solute concentration and saturated concentration, respectively. Kinetic parameters kb and kg stand for birth and growth coefficients, while b and g refer to “orders” of the birth and growth processes.
Actually, kb and kg in Equations (5) and (6) are temperature-dependent parameters. In this work, the crystallization processes were performed under isothermal conditions; thus, these parameters were treated as constants. Hereby, the volumetric shape factor kv was introduced. Indeed, kv is an appropriate shape factor that describes the geometric shape of the crystals. In fact, the empirical parameter kv was also herein assumed to remain unchanged and was calculated from Equation (7). To obtain this equation, the needle-shaped crystals were approximated to “two-dimensional cylinders” (Lwidth × Llength) [10,26], as demonstrated in Figure 1.
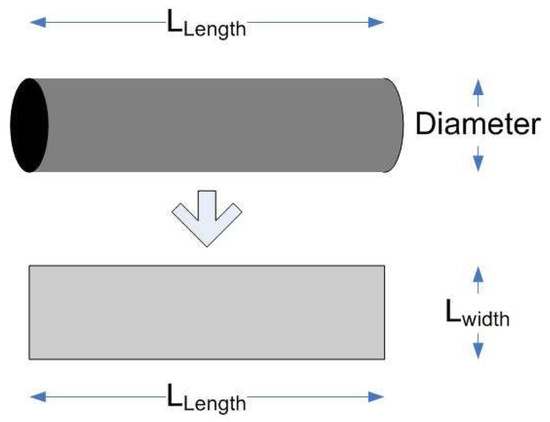
Figure 1.
Projection of a cylinder onto the 2D-plane.
According to Miller et al. [27], a mass balance allows calculating concentration of the mother liquor using Equation (8). Furthermore, Equations (9) and (10) were also utilized to determine CSD of the population. Indeed, a space from 0 to 5000 µm was discretized into n (e.g., n = 500) equal-width intervals (δL). The number of newly formed particles from nucleation term (Equation (9)) accounted for the first element (i.e., with zero size) of the population. The growth velocity of the other elements was computed from Equation (10). At the end of each time step, the grid was updated with new states in which the element ith became (i + 1)th, the 1st element was reset to zero, and the last element was removed from the grid to retain the same number of elements. The cutting step has no influence on the calculation since crystal lengths were found always smaller than the grid’s end-size.
The Matlab ode23 suit was applied to solve the above ODE system. Parameters were estimated using lsqnonlin (Levenberg-Marquardt) with multi-start algorithm. Four parameters, kb, kg, b, and g, were obtained by minimizing the objective function OF, which was defined as Equation (11). This equation computes the differences (at the final state) between the simulated and experimental results of the solute concentration of the mother liquor and the characteristic dimension of the solid product. The equation was weighted using the initial concentration ( and the maximal length () of the discretized space. Herein, the calculated values were denoted by “sim.” and a variable subscripted by “exp.” assigned to the experimental data. The confidence intervals of the estimated parameters were calculated using a function named nlparci, which is available in Matlab environment.
3. Materials and Methods
3.1. Materials and Equipments
L-lactide (Acros Organics, 98% purity, ρs = 1.2 [g·cm−3]) was used without further purification. THF and n-hexane were purchased from Sigma-Aldrich, Saint Louis, MS, USA (HPLC grade). Equipment was used in the experimental section: an electronic balance with the precision of 0.0001-g (Precision balance ME203, Mettler Toledo, Greifensee, Switzerland), a microscope (Meiji EMZ5), an oven (Memmert UN110), a magnetic stirrer (IKA CMAG HS7), a jacketed one-liter crystallizer (customized equipment), a thermostat (Stuart SRC5), XRD analysis (Empyrean), a laser source (LD-P5L Hangzhou, 5 mW, 680 nm), a GY-30 BH1750 digital light intensity module, a microcontroller board (Arduino Uno R3—Atmega328).
3.2. Solubility Measurement
The gravimetric solubility determination procedure, which was similarly described elsewhere [28,29], was herein applied and summarized as follows. Saturated solutions of L-lactide at different temperatures and/or solvent compositions were magnetically agitated for 30 min at 5 °C above desired temperatures. Then, the systems were kept at the desired temperatures for 48 h to ensure equilibrium state. Phase separation was quickly done using a syringe (mounted with a NY 0.22 µm filter) after settling of undissolved species for about 60 min under unstirred and isothermal conditions. Hereafter, about 2 mL of the saturated solutions were quickly placed in small glass vessels. The empty vessels were weighted before and denoted as m0. After that, the total weights (m1) were measured, including the solvents, solutes, and vessels. Then, solvents were totally evaporated and samples were dried under vacuum at 80 °C for 8 h until their weights remained unchanged. Lastly, the final sample weights were recorded (m2). Hereby, the solute concentrations as mass fractions (wt, [-]) of L-lactide were calculated as Equation (12). Each of the measurements was repeated at least 3 times to calculate the mean values.
The Van ’t Hoff approach was applied for each of the solvent compositions using Equation (13) [30]. Enthalpies of dissolution were calculated from slopes of linear regressions of which logarithm of mole fraction ln(x) versus reciprocal of absolute temperature (1/T) was plotted, where R is the universal gas constant.
3.3. Preparation of Seed Crystals
At 45 °C, a glass vessel was used to completely dissolve 1.4 g of L-lactide into 5.0 g of the solvent mixture containing 45% of n-hexane (m/m). The clear solution remained at this temperature for 30 min. Afterwards, the vessel was rapidly immersed in ice-cold water under well-agitated conditions to perform nucleation and it remained there for 1 min to recrystallize L-lactide. The recrystallization process occurred rapidly to form “fresh” seeds. Representative amounts of these crystals were randomly collected at three different positions for microscopic analysis (see Section 3.5), while the rest was wet transferred into the crystallizer as a seed load.
3.4. Crystallization Experimental Setup
Three experiments were carried out under the same conditions and experimental setup. First, the 1st run was intended to serve for investigation of the obtained CSD and its corresponding mother liquor. In this experiment, both the liquid and solid phases were analyzed just at the beginning and the end of the process in order to avoid possible process noise caused by sampling procedures. Second, the 2nd run replicated the first experiment but mainly focused on the liquid phase trajectory. Indeed, the mother liquor was drawn up over time to study the variation of the solute concentration during the crystallization, while its solid phase was analyzed just once at the end of the process. To test reproducibility, both the liquid and solid phases at the final states of the 1st and 2nd experiments were compared. Finally, the 3rd experiment was repeated from the previous runs, but this process was aimed to stop at an arbitrary time (e.g., at 8 min) to validate the obtained model.
These crystallization processes were carried out in a jacketed crystallizer equipped with a temperature control system. The suspensions placed inside the crystallizer were prepared from 94.4 ± 0.2 g of L-lactide and 305.6 ± 0.5 g of the solvent mixture at room temperature. For each experiment, the system was magnetically agitated with a speed of 350 rpm. A Pt-100 thermocouple was immersed inside the crystallizer to measure the current temperatures. The suspensions were completely dissolved at 45 °C (i.e., 5 °C above the saturated temperature) and remained there for 60 min. After dissolution, they were cooled down from 45 to 30 °C in 30 min. During the cooling process, primary nucleation was not observed. In this observation, laser transmittance was measured using a laser beam (5 mW, 680 nm) and a photosensitive sensor module (BH1750) coupled with an Arduino Uno R3 board. To drive the crystallization, the isothermal seeded technique was then applied using the seed suspension, as described previously in Section 3.3. An amount of 0.35% (gseed/gsolution) of L-lactide seeds was quickly transferred into the crystallizer. In these crystallization processes, the solute concentration change of the mother liquor was detected using the same procedure as the above gravimetric solubility determination. The solids were harvested to measure their CSDs using the microscopic analysis. The process yield Y and productivity Pr achieved in the batch crystallization were calculated as Equations (14) and (15), where is mass of the feed solution, mobtained and minitial are masses of L-lactide in the dried products obtained at the process time (t, [h]) and in the initial solutions, respectively.
3.5. Microscopic Analysis
An offline microscopic analysis was exploited to measure crystal sizes of L-lactide samples. First, residual solvents in representative amounts of these samples were removed after pouring them on filter papers. Then, these crystals were washed with 5 mL of the saturated mother liquor. The wet crystals on the filter paper were collected and immediately used for the dimensional analysis. The characteristic dimensions of about 400 crystals were measured and the experimental histogram of the distribution was recorded. This analysis must be quickly conducted since L-lactide is relatively unstable in the presence of moisture. Afterwards, this histogram was used to calculate CSD of the populations using piecewise cubic Hermite interpolation (pchip—Matlab).
4. Results and Discussion
4.1. Anti-Solvent Effects of n-Hexane on L-Lactide/THF Solutions
As mentioned in the introduction part, L-lactide dissolves very well in many solvents, which could be an issue for crystallization process design. In this part, solubility screening was carried out to examine the anti-solvent effects of n-hexane on L-lactide/THF systems. Relating to the possibility of polymorphism and/or solvate formation, the residual solids harvested from these solubility measurements were compared to the reference sample (purchased from Sigma-Aldrich). Figure 2 shows that the XRD patterns of the reference and the recrystallized L-lactide species (for all samples in pure n-hexane and tetrahydrofuran as well as the mixed solvent) crystallize with the same structure. Identical 2θ positions of these samples were found at 8.3, 12.8, 13.9, 16.7, 22.6, and 28.2°, etc. Thus, the effects of different polymorphs or solvates are not involved in the solubility determination of L-lactide under the studied conditions.
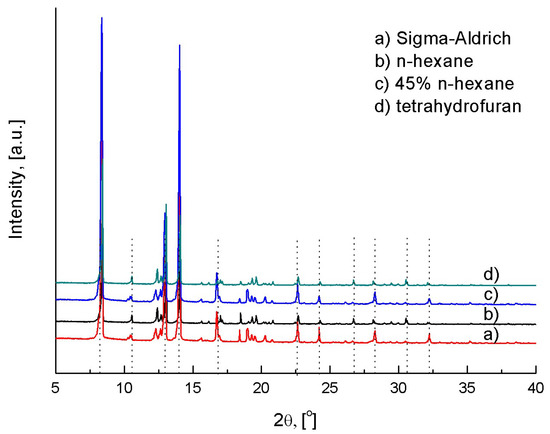
Figure 2.
XRD patterns of L-lactide species recrystallized in n-hexane, tetrahydrofuran, and the mixed solvent.
Figure 3 presents solid–liquid equilibria (SLE) of L-lactide in various mixtures of n-hexane and tetrahydrofuran. Herein, two trends are guided for the eye by arrows (1) and (2), which indicate the influence of temperature and anti-solvent content (mHex./mmixed_solvent) on the solubility, respectively.
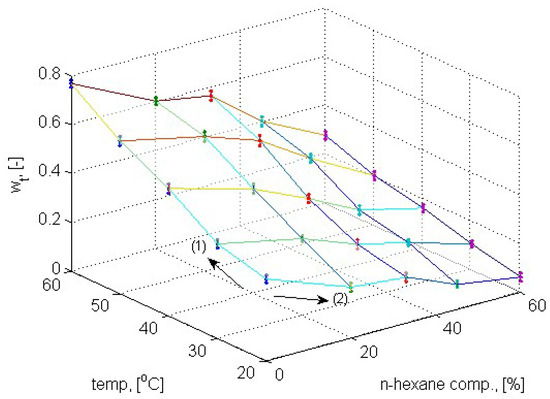
Figure 3.
Solubility of L-lactide as a function of temperature and solvent composition. Maximal error in solubility determination is less than 3.7%.
In Figure 3, arrow (1) points out the effects of temperature on the solubility. In fact, the solubility of L-lactide increases with increasing temperature in all the mixed solvents. Indeed, the temperature-dependent trend occurs differently according to the added amounts of n-hexane. In pure THF as the solvent, L-lactide does not only dissolve well but its solubility is also significantly sensitive versus temperature. Conversely, increasing the n-hexane content gradually decreases the temperature sensitivity of the solubility. For instance, the solubility of L-lactide in pure THF (i.e., 0% of n-hexane) increases by (gsolute/gsolution) for a temperature increment from 20 to 60 °C. With the same scenario, rising n-hexane up to 60% leads to a solubility increment just by (gsolute/gsolution). Similar conclusions can also be derived for other solvent compositions. From the measured solubility data, linear regressions based on the Van ’t Hoff analysis were applied and the slopes of these regressions were obtained (Figure 4a). Consequently, the calculated enthalpies of dissolution based on the obtained slopes are presented in Figure 4b as a function of solvent compositions. Herein, the enthalpies of dissolution are found at positive values, which mean that the dissolution of this compound in all the studied solvent mixtures is endothermic. This calculation matches well with the above observation in Figure 3 since solubility increases with temperature in endothermic dissolution. Furthermore, the enthalpy increases with increasing n-hexane content in the measured temperature range, which explains the decrease in the solubility with respect to the added amounts of n-hexane. Briefly, the observation guided by arrow (2) in Figure 3 evidently proves that n-hexane is an anti-solvent for L-lactide/THF solutions. In the next cooling crystallization experiments, we will fix a solvent mixture with the mass composition of n-hexane at 45% (m/m) to study the kinetic behavior of this system. Nevertheless, the anti-solvent effects can be utilized to perform an anti-solvent crystallization, which is also very attractive, as reported in the literature [31,32,33].
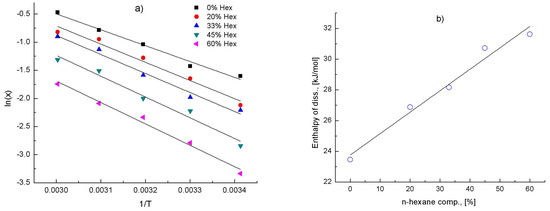
Figure 4.
(a) Van ’t Hoff plots; (b) enthalpy of dissolution of L-lactide vs. solvent composition.
4.2. Crystal Shape of L-Lactide and the Shape Factor kv
L-lactide crystallizes in needle-shaped crystals from the studied solvent mixture. As seen in Figure 5, these crystals preferentially develop along the length axis rather than the other dimensions. Therefore, 1D-PBE should be suitable to describe this system in which the crystal length (Llength) was chosen as the characteristic dimension.
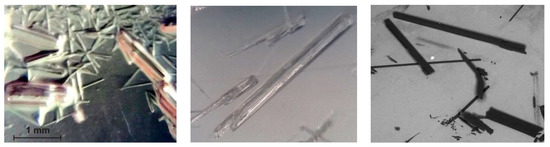
Figure 5.
Crystal habits of L-lactide.
The CSD of the seed crystals according to the characteristic dimension is plotted in Figure 6a in which the sizes of seeds range from about 10 to 2000 µm (a mean value of 871.2 µm). The relatively wide range of this distribution is explained based on the directly harvesting step from the recrystallization without any further preparation, such as milling or sieving.
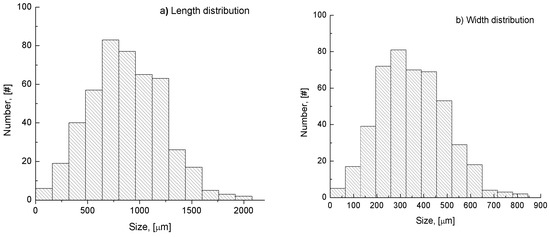
Figure 6.
CSDs of seeds according to the crystal length (a) and width (b).
From the crystal habits, as seen in Figure 5, L-lactide crystals were approximated to cylinders. Besides the distribution of the crystal length ( as presented in Figure 6a, the crystal width () distribution of the same population was also detected and shown in Figure 6b. Consequently, the system dependent crystal shape factor kv was obtained by substituting these data into Equation (7), which resulted in kv at an average value of 0.12. In order to simplify PBE, we assumed that kv remained constant under operating conditions for the whole crystallization processes.
4.3. Solving the PBE for L-Lactide System
The first crystallization experiment was performed under the conditions described in the part of the crystallization experimental setup. Briefly, the solute concentration of the initial solution was set at wt = 0.236 (gsolute/gsolution), corresponding to the saturated solution at 40 °C. The batch isothermal seeded crystallization was conducted at 30 °C with an amount of seeds as prepared in part 3.3. After 20 min, the process was stopped to collect relevant solid and liquid products. On the one hand, liquid phase analysis showed that the solute concentration was obtained at wt = 0.173 (gsolute/gsolution), which corresponds to the saturated solution at 30 °C. In other words, the process already reached the equilibrium state. On the other hand, the harvested solid product showed a CSD as seen in Figure 7a in which the CSD of the initial seeds was also plotted for comparison purposes. Hereafter, four kinetics parameters in Equations (5) and (6), including kb, kg, b, and g, were estimated based on the obtained data. The results of the estimation were summarized in Table 1. Obviously, the percentage confidence intervals of the obtained parameters are less than 6.5% of the parameter magnitudes, which proved the acceptable estimation procedure has been applied for the parameterization.

Figure 7.
(a) Experimental CSDs of the final-time solid product and seed crystals; (b) experimental vs. modeling CSDs of the final-time product from the 1st crystallization.

Table 1.
Estimated kinetic parameters with 95% confidence intervals.
In Figure 7a, regarding the experimental data, the obtained CSD of the final-time product (open dots) is positively skewed. That means most values are clustered around the left tail of the distribution. Furthermore, the mean values of the seed and final-time product distributions are detected at values of 871.2 and 625.9 µm, respectively. In other words, the mean size of the solid product shifts to the left side compared to that of the initial seeds. Thus, the major part of the final-time product is predominated by crystals that are mainly related to newborn nuclei. This observation reveals a strong rate of the secondary nucleation. In fact, the newly formed crystals are not only continuously growing but also playing an important role as new seeds that stimulate further nucleation under operating conditions. The proliferation of the relatively “small” crystals evidently proves the high order of the secondary nucleation for the investigated system. Regarding the power law, the experimental data fit well to an approximate second-order of the secondary nucleation, as listed in Table 1. Besides, the product also comprises “bigger” crystals, which appear in the right tail of the CSD. These crystals are resulted from the growth phase based on the added seeds and the newly formed crystals. However, the relatively small number of these crystals discloses a low order of the crystal growth rate. From the experiment, the approximate first-order kinetics is proven for the growth term (Table 1).
Comparing the CSDs in Figure 7b, a good agreement between the experimental data (open dots) and modeling results (continuous line) of the final product is observed for the size ranges below 1500 µm and above 2000 µm. Obviously, the CSD from the simulation indicates that the product involves crystals from the growth phase and newly formed crystals. This trend shares similarity to the experimental CSD; therefore, the model is relatively well identified. However, a discrepancy between the two approaches is noticeable, as indicated in zone A (Figure 7b). That could be related to insufficient descriptions of the implemented model, which results in two separate populations in the simulated CSD. To improve the numerical solution, the modified PBE model is recommended, which should consider the effects of attrition, crystal breakage, and aggregation, etc. [4,7,8]. Theoretically, these events can create an intermediate population, which compensates for the absence of medium-sized crystals (zone A). Another reason could be originated from insufficient experimental information, which also leads to the above difference.
4.4. Variation of Solute Concentration during Crystallization and Model Validation
The second experiment under the same conditions to the previous one was carried out, and the variation of the solute concentration of the mother liquor during this crystallization is shown in Figure 8a (open dots). At first, in the early period up to about 8 min after seeding, there is a strong drop in the solute concentration, which is clearly showing up as desupersaturation relating to the secondary nucleation and crystal growth. After this period, the concentration continuously decreases but not so drastically because of the loss of the driving forces relating to the consumption of supersaturation in the previous time. From 10 min to the end, the concentration is almost unchanged, and the system appears to reach equilibrium. Afterwards, the experimental variation of the solute concentration was compared with that of the simulation (continuous line, Figure 8a). The trajectory of the mother liquor, which was derived from the mass balance (Equation (8)), fits well to the experimental desupersaturation tendency. To quantify the crystallization process, on the one hand, the solid product was harvested after 20 min and dried for 8 h. Consequently, an amount of 28.5 g dried solid was obtained. Thus, at the end of the process, the experimental yield was determined at a value of 30.2%. On the other hand, the theoretical yield was also predicted at a value of 32.3%, which was comparable to that of the experiment. The small difference can be explained due to the mass loss during the product collecting and drying steps. Hence, the simplified 1D-PBE model described relatively well the crystallization of the investigated system.
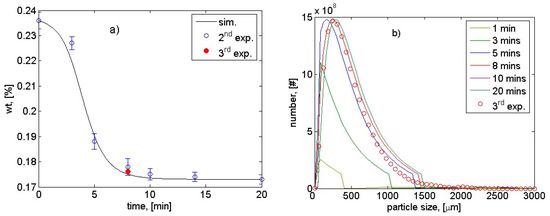
Figure 8.
(a) Solute concentration change during crystallization; (b) CSD evolution versus time. The 3rd experiment as a validation was stopped at 8 min (see “●” and “ο” symbols in Figure 8a,b, respectively).
Figure 8b shows the CSD evolution as a function of time in a period from 1 to 20 min. Obviously, there is an enormous increase in the number of crystals in the early period up to 8 min. Afterwards, the CSDs at 10 and 20 min are found to be identical, which means the process already achieved equilibrium after about 10 min. This conclusion is in good agreement with the liquid concentration variation presented in Figure 8a.
To assess the reproducibility, the solute concentrations of the mother liquors and their corresponding solids at the end of the first and second experiments were compared. First, the collected liquid sample at 20 min from the second run has a concentration at wt = 0.173 (gsolute/gsolution), which is comparable to that of the mother liquor at the end of the 1st experiment. In fact, both are identical to the equilibrium concentration at 30 °C (see Figure 3). Second, the final solid in the second run has a mean size at 593.8 µm, which is slightly different from the first one at 625.9 µm. Thus, these pieces of evidence exhibit good reproducibility of the implemented crystallization processes.
For model validation, the third experiment as a cross-check was conducted. While the other operating conditions were similar to the above first and second experiments, the third process was intended to stop at an arbitrary time, e.g., at 8 min. The outcomes of the third experiment were comparable with the modeling results in Figure 8a,b. In fact, at the end of the third crystallization, the productivity and mean size of CSD determined from the simulation were found at values of 0.56 and 520.1 µm, which slightly differ from those of the experimental values of 0.51 and 488.1 µm, respectively. The agreements in both the solid and liquid phases proved that the applied estimation is reliable and the obtained model can be used for predicting the outcomes of the crystallization of L-lactide.
5. Conclusions
The anti-solvent effects of n-hexane were experimentally demonstrated due to the fact that there is significantly reduced solubility of L-lactide in THF. According to the Van ’t Hoff equation, the dissolution of L-lactide was found as an endothermic process and increased with increasing amounts of n-hexane in the mixed solvents. From the solvent composition screening, a solvent mixture containing 45% n-hexane (m/m) was selected to perform isothermal seeded batch cooling crystallization. The saturated solutions at 40 °C were cooled down to 30 °C, and the crystallization processes were driven with an amount of 0.35% (gseed/gsolution) of seed crystals. The processes were analyzed by offline microscopic and gravimetric methods for solid and liquid phases, respectively. In comparison to other advanced process monitoring techniques, these methods are relatively simple but quite efficient processes that can be considered as alternatives in cases of limited modern on/inline analytical tools being available, such as FBRM, FTIR, Raman, etc. Regarding the solid product obtained at the end of the crystallization, its CSD was predominated by the population relating to newly formed crystals since it was found as a positively skewed distribution. This observation approved the strong nucleation rate of the investigated system. Furthermore, the process quickly reached the equilibrium state after about 10 min. Consequently, the process yield achieved a percentage of 30.2%, and the product mean size was found at 625.9 µm. Concerning the simulation, on the one hand, the model results achieved relatively good agreement with the experiments, which was confirmed by similar trends for both the CSD evolution and solute concentration profile. The applied 1D-PBE was quite sufficient to quantify the crystallization of L-lactide in the selected anti-solvent/solvent system. The kinetic parameter estimation resulted in the second-order secondary nucleation and the first-order crystal growth for the L-lactide system under the studied conditions. On the other hand, although the outcomes of the simulation matched relatively well with those of the experiments, there was a small discrepancy on the CSDs between the two approaches in a range from 1500 to 2000 µm. This deviation could be affected by the model formulation, which considered only secondary nucleation and crystal growth. Therefore, combining additional events, such as attrition, crystal breakage, and aggregation, etc., into the PBE model [16,34,35] was supposed to be the solution to enhance the understanding of the crystallization process. Additionally, a limitation of the experimental data could be another reason for the above deviation. Thus, implementing a comprehensive PBE and/or expanding the experimental data herein are suggested for future works.
Author Contributions
T.L.M.: conceptualization, methodology, writing—original draft preparation, writing—review and editing; T.P.T.: project administration; N.N.T.H.: data curation; V.P.M.: visualization. All authors have read and agreed to the published version of the manuscript.
Funding
This research is funded by Graduate University of Science and Technology under grant number GUST.STS.ĐT2018-HH06.
Data Availability Statement
Please contact the corresponding author for data supporting reported results. Email: tam80lm@gmail.com.
Acknowledgments
The authors would like to give thanks for financial support from Graduate University of Science and Technology. We also would like to thank Institute of Chemical Technology for their technical support.
Conflicts of Interest
The authors declare no conflict of interest.
Nomenclature
| Latin | ||
| B | birth rate | [#·s−1] |
| b | the exponent in birth term | [-] |
| G | growth rate | [m·s−1] |
| g | the exponent in growth term | [-] |
| i | index | [-] |
| kg | crystal growth constant | [m·s−1] |
| kb | secondary nucleation constant | [#·m−3·s−1] |
| kv | shape factor | [-] |
| L | characteristic dimension | [m] |
| m0 | mass of empty vessel | [g] |
| m1 | mass of saturated solution and empty vessel | [g] |
| m2 | mass of solute and empty vessel | [g] |
| m | mass of solute in mother liquid | [g] |
| mobtained | obtained solid after crystallization | [g] |
| minitial | total solute in initial solution | [g] |
| n | number of particles/elements | [#] |
| R | the universal gas constant | [J·mol−1·K−1] |
| Pr | process productivity | [] |
| t | time variable | [s] |
| T | absolute temperature | [K] |
| w, wsat | solution and saturated concentrations | [] |
| Y | process yield | [%] |
| enthalpy of dissolution | [kJ·mol−1] | |
| Greek | ||
| µi | the moment ith | [-] |
| solid density | [g·cm−3] | |
| Ψ | number density function | [#·m−1] |
References
- El-Zhry El-Yafi, A.K.; El-Zein, H. Technical crystallization for application in pharmaceutical material engineering: Review article. Asian J. Pharm. Sci. 2015, 10, 283–291. [Google Scholar] [CrossRef]
- Sato, K. Crystallization of Lipids Fundamentals and Applications in Food, Cosmetics, and Pharmaceuticals; John Wiley & Sons: Hoboken, NJ, USA, 2018. [Google Scholar]
- Rahman, M.M.; Salleh, M.A.M.; Rashid, U.; Ahsan, A.; Hossain, M.M.; Ra, C.S. Production of slow release crystal fertilizer from wastewaters through struvite crystallization—A review. Arab. J. Chem. 2014, 7, 139–155. [Google Scholar] [CrossRef]
- Lewis, A.E.; Seckler, M.; Kramer, H.; van Rosmalen, G. Industrial Crystallization: Fundamentals and Applications; Cambridge University Press: Cambridge, UK, 2015. [Google Scholar]
- Leubner, I.H. Precision Crystallization: Theory and Practice of Controlling Crystal Size, 1st ed.; CRC Press: Boca Raton, FL, USA, 2009. [Google Scholar]
- Mullin, J.W. Crystallization, 4th ed.; Butterworth-Heinemann: Woburn, MA, USA, 2001. [Google Scholar]
- Myerson, A.S.; Erdemir, D.; Lee, A.Y. Handbook of Industrial Crystallization, 3rd ed.; Cambridge University Press: Cambridge, UK, 2019. [Google Scholar]
- Randolph, A.D. Theory of Particulate Processes, 2nd ed.; Academic Press: San Diego, CA, USA, 1988. [Google Scholar]
- Hu, Q.; Rohani, S.; Wang, D.X.; Jutan, A. Nonlinear Kinetic Parameter Estimation for Batch Cooling Seeded Crystallization. AIChE J. 2004, 50, 1786–1794. [Google Scholar] [CrossRef]
- Czapla, F.; Haida, H.; Elsner, M.P.; Lorenz, H.; Seidel-Morgenstern, A. Parameterization of population balance models for polythermal auto seeded preferential crystallization of enantiomers. Chem. Eng. Sci. 2009, 64, 753–763. [Google Scholar] [CrossRef]
- Rigopoulos, S.; Jones, A.G. Finite-Element Scheme for Solution of the Dynamic Population Balance Equation. AIChE J. 2003, 49, 1127–1139. [Google Scholar] [CrossRef]
- Costa, L.I.; Storti, G.; Lazzari, S. Solution of population balance equations by logarithmic shape preserving interpolation on finite elements. Comput. Chem. Eng. 2018, 119, 13–24. [Google Scholar] [CrossRef]
- Dey, A.; Banerrjee, S.; Sengupt, B. A Stratified Monte Carlo Simulation of CSD in a Continuous Crystallizer for Size-dependent Growth. Cryst. Res. Technol. 1994, 29, 505–508. [Google Scholar] [CrossRef]
- Lina, Y.; Leeb, K.; Matsoukasa, T. Solution of the population balance equation using constant-number Monte Carlo. Chem. Eng. Sci. 2002, 57, 2241–2252. [Google Scholar] [CrossRef]
- Barrett, C.; Jheeta, J.S. Improving the accuracy of the moments method for solving the aerosol general dynamic equation. J. Aerosol Sci. 1996, 27, 1135–1142. [Google Scholar] [CrossRef]
- Madras, G.; McCoy, B.J. Reversible crystal growth–dissolution and aggregation–breakage: Numerical and moment solutions for population balance equations. Powder Technol. 2004, 143–144, 297–307. [Google Scholar] [CrossRef]
- Marchisio, D.L.; Fox, R.O. Solution of population balance equations using the direct quadrature method of moments. J. Aerosol Sci. 2005, 36, 43–73. [Google Scholar] [CrossRef]
- Févotte, F.; Févotte, G. A method of characteristics for solving Population Balance Equations (PBE) describing the adsorption of impurities during crystallization processes. Chem. Eng. Sci. 2010, 65, 3191–3198. [Google Scholar] [CrossRef]
- Pilon, L.; Viskanta, R. Modified method of characteristics for solving population balance equations. Int. J. Numer. Meth. Fluids 2003, 42, 1211–1236. [Google Scholar] [CrossRef]
- Rehman, M.S.; Qamar, S. Application of the Method of Characteristics to Population Balance Models Considering Growth and Nucleation Phenomena. Appl. Math. 2014, 5, 1853–1862. [Google Scholar] [CrossRef][Green Version]
- Gao, C.; Ma, C.; Xu, P. Biotechnological routes based on lactic acid production from biomass. Biotechnol. Adv. 2011, 29, 930–939. [Google Scholar] [CrossRef]
- DeStefano, V.; Khan, S.; Tabada, A. Applications of PLA in modern medicine. Eng. Regen. 2020, 1, 76–87. [Google Scholar] [CrossRef]
- Casalini, T.; Rossi, F.; Castrovinci, A.; Perale, G. A Perspective on Polylactic Acid-Based Polymers Use for Nanoparticles Synthesis and Applications. Front. Bioeng. Biotechnol. 2019, 7, 259. [Google Scholar] [CrossRef]
- Buchholz, H.; Le Minh, T.; Lorenz, H.; Seidel-Morgenstern, A. Solubility determination and prediction of the lactide species in different solvent systems. In Proceedings of the 20th International Workshop on Industrial Crystallization, Odense, Denmark, 18–20 September 2013; pp. 319–324, ISBN 978-87-92646-73-6. [Google Scholar]
- Chen, Z.; Xie, C.; Xu, Z.; Wang, Y.; Zhao, H.; Hao, H. Determination and Correlation of Solubility Data and Dissolution Thermodynamic Data of L-Lactide in Different Pure Solvents. J. Chem. Eng. Data 2013, 58, 143–150. [Google Scholar] [CrossRef]
- Elsner, M.P.; Menéndez, D.F.; Muslera, E.A.; Seidel-Morgenstern, A. Experimental study and simplified mathematical description of preferential crystallization. Chirality 2005, 17, S183–S195. [Google Scholar] [CrossRef]
- Miller, S.M. Modelling and Quality Control Strategies for Batch Cooling Crystallizers. Ph.D Thesis, The University of Texas at Austin, Austin, TX, USA, 1993. [Google Scholar]
- Heryanto, R.; Hasan, M.; Abdullah, E.C.; Kumoro, A.C. Solubility of Stearic Acid in Various Organic Solvents and Its Prediction using Non-ideal Solution Models. Sci. Asia 2007, 33, 469–472. [Google Scholar] [CrossRef]
- Le Minh, T.; von Langermann, J.; Lorenz, H.; Seidel-Morgenstern, A. Enantiomeric 3-chloromandelic acid system: Binary melting point phase diagram, ternary solubility phase diagrams and polymorphism. J. Pharm. Sci. 2010, 9, 4084–4095. [Google Scholar] [CrossRef] [PubMed]
- Lu, J.; Li, Z.; Jiang, X.; Rohani, S. Solubility of L-phenylalanine in aqueous solutions. Chem. Eng. 2021, 43, 810–813. [Google Scholar] [CrossRef]
- Nowee, S.M.; Abbas, A.; Romagnoli, J.A. Antisolvent crystallization: Model identification, experimental validation and dynamic simulation. Chem. Eng. Sci. 2008, 63, 5457–5467. [Google Scholar] [CrossRef]
- Schall, J.M.; Capellades, G.; Myerson, A.S. Methods for Estimating Supersaturation in Antisolvent Crystallization Systems. CrystEngComm 2019, 21, 5811–5817. [Google Scholar] [CrossRef]
- Kurup, M.; Raj, R.A. Antisolvent crystallization: A novel approach to bioavailability enhancement. Eur. J. Biomed. Pharm. Sci. 2016, 3, 230–234. [Google Scholar]
- Saleeby, E.G.; Lee, H.W. On the solution of the PBE with agglomeration and random growth rate dispersion. Chem. Eng. Sci. 1995, 50, 1971–1981. [Google Scholar] [CrossRef]
- Ouchiyama, N.; Rough, S.L.; Bridgwater, J. A population balance approach to describing bulk attrition. Chem. Eng. Sci. 2005, 60, 1429–1440. [Google Scholar] [CrossRef]


Publisher’s Note: MDPI stays neutral with regard to jurisdictional claims in published maps and institutional affiliations. |
© 2022 by the authors. Licensee MDPI, Basel, Switzerland. This article is an open access article distributed under the terms and conditions of the Creative Commons Attribution (CC BY) license (https://creativecommons.org/licenses/by/4.0/).