Article

Temperature-Resolved Anisotropic Displacement Parameters from Theory and Experiment: A Case Study

1
Institute of Physical Chemistry, RWTH Aachen University, Landoltweg 2, 52056 Aachen, Germany
2
Institute of Molecular Science, Shanxi University, Taiyuan 030006, China
3
Mineralogisch-Petrographisches Institut, Hamburg University, 20146 Hamburg, Germany
4
Institute of Inorganic Chemistry, RWTH Aachen University, Landoltweg 1, 52056 Aachen, Germany
5
Hoffmann Institute of Advanced Materials, Shenzhen Polytechnic, 7098 Liuxian Blvd, Shenzhen 518055, China
*
Authors to whom correspondence should be addressed.
Crystals 2022, 12(2), 283; https://doi.org/10.3390/cryst12020283
Submission received: 31 January 2022 / Revised: 13 February 2022 / Accepted: 15 February 2022 / Published: 18 February 2022

Abstract

:
Anisotropic displacement parameters (ADPs) for an organopalladium complex were obtained from synchrotron diffraction data between 100 and 250 K and compared to the results from first-principles calculations at the harmonic approximation. Calculations and experiments agree with respect to the orientation of displacement ellipsoids and hence the directionality of atomic movement, but the harmonic approximation underestimates the amplitudes of motion by about 20%. This systematic but modest underestimation can only be reliably detected with a high-quality experimental benchmark at hand. Our experiments comprised diffraction data at 20 K intervals from 130–250 K on the same crystal. An additional high-resolution data set was collected at 100 K on a second crystal and underlined the robustness of our approach with respect to the individual sample, resolution, and instrumentation. In the temperature range relevant for our study and for many diffraction experiments, the discrepancy between experimentally determined and calculated displacement appears as an almost constant temperature offset. The systematic underestimation of harmonic theory can be accounted for by calculating the ADPs for a temperature 20 K higher than that of the actual diffraction. This entirely empirical “+20 K rule” lacks physical relevance but may pave the way for application in larger systems where a more reliable quasi-harmonic approximation remains computationally demanding or even entirely unaffordable.

1. Introduction

Anisotropic displacement parameters (ADPs) based on first-principles calculations have been successfully benchmarked for several test cases [1,2,3]. When experiments can only provide limited information, e.g., as the result of contrast problems, low resolution, or extensive disorder, theoretical ADPs may prevent over-refinement and provide an alternative answer to describe motion in a target solid. However, the standard approach of the harmonic approximation, while being quite successful overall, has been consistently shown to produce ADPs that are systematically smaller than their experimental counterparts due to anharmonic effects being neglected. The next step, the so-called quasi-harmonic approximation, generally improves the results of the harmonic approximation by including a temperature-induced volume increase but is extremely time-consuming and demands high computational resources that may prove unaffordable. Can the harmonic approximation with its a priori known underestimation of ADPs be empirically corrected to give results close to the quasi-harmonic approximation at a lower computational cost? Here, we discuss to what extent a possible offset in “temperature” between theory and experiment may lead to more realistic results.
ADPs ideally reflect thermal motion. Even in the absence of disorder, they are in reality more affected by systematic errors than geometry parameters [4,5], and therefore, an experimental benchmark has to be chosen with care. We decided on the square-planar palladium(II) complex (1) as our test system, as it represents a typical molecular crystal with unexceptional N–H···O hydrogen bonds. A chemical diagram and a view of the unit cell of 1 are shown in Figure 1.
Compound 1 crystallizes in a space group of rather high symmetry and forms rods of suitable size for single crystal diffraction. In order to minimize experimental bias, a series of temperature-dependent intensity data were collected in direct sequence on the same crystal and on the same instrument at beamline P24 at the DESY synchrotron. High-resolution data were collected on a crystal from an alternative batch to 1 under slightly different experimental conditions to test the robustness of our approach. High flux and short wave-lengths could significantly reduce absorption as the most detrimental systematic error for ADPs. Based on synchrotron data, we could show that the ADPs from theory may out-perform apparently flawless in-house experiments when absorption becomes decisive [6].

2. Materials and Methods

2.1. Diffraction Experiments

The synthesis, crystallization, and basic structural features of the S enantiomer for 1, (R)-(acetyl¬acetonato-κ2O,O’)[2-(1-aminoethyl)¬phenyl-κ2C1,N]-palladium(II) have been described earlier [7]. Our test compound represents a typical molecular crystal: the shortest specific intermolecular contacts are N-H···O hydrogen bonds with donor···acceptor distances of ca. 3 Å and H···O contacts of ca. 2 Å. Compound 1 also represents a well-suited benchmark system: it adopts the tetragonal space group P41 and forms small regular rods suitable for synchrotron data collections; only minor systematic errors due to absorption are to be expected.
Temperature-dependent data collections between 130 and 250 K were performed at 20 K intervals on the same light-yellow crystal with approximate dimensions 0.12 × 0.04 × 0.04 mm3. Measurements were performed on the Kappa-diffractometer at beamline P24, DESY, Hamburg [8] using a MarCCD165 detector and energy of 20.0 keV (λ = 0.61992 Å, Si(111)-DCM). At this wavelength, the small product of the linear absorption coefficient and crystal dimensions leads to a ratio between a maximum and minimum transmission close to unity. The data were collected with ɸ- and ω-scans at different detector degrees (0°, 55°) and χ-positions (0°, 60°) with a stepwidth of 1.0°, a sample-to-detector distance of 75.0 mm, and exposure times of 1.0 and 10.0 s. To avoid the overloading of low-order data, additional scans with an attenuated beam were performed (1.0 s). Ca. 40,000 reflections were measured at each temperature and merged to ca. 6000 observations, thus ensuring acceptable redundancy. Data completeness was better than 0.99 at sinθ/λ = 0.6 Å−1 and better than 0.97 at sinθ/λ = 0.83 Å−1. As an example, a plot with experimental ADPs at the 90% probability level is shown in Figure S1 (Supplementary Material).
The high-resolution experiment was conducted at 100 K on a slightly larger crystal with approximate dimensions of 0.22 × 0.07 × 0.04 mm3 on the same diffractometer at beamline P24, but a DECTRIS 1M CdTe detector (DECTRIS AG, Baden-Daettwil, Switzerland) and energy of 25.0 keV (λ = 0.49594 Å) were used. At this wavelength, absorption was more pronounced, and a correction based on multiple scans of equivalent reflections was applied [9]. The collection of intensity data involved ω-scans at different detector settings and φ orientations with a step width of 0.25°, a sample-to-detector distance of 110.0 mm, and exposure times between 0. 25 and 2 s. Ca. 175,000 reflections were measured and merged to ca. 15,300 observations. Data completeness was better than 0.999 at all resolutions; a maximum resolution of 0.45 Å or sinθ/λ = 1.11 Å−1 was achieved.
The primary diffraction data were processed with XDS [10]. Refinements on F2 were conducted with SHELXL-2018/3 [11]. In the final refinement cycles, ADPs were assigned to all non-hydrogen atoms, and H atoms were treated as riding. Final agreement factors amounted to R < 0.018 and wR2 < 0.047 for the temperature-dependent data sets. For the high-resolution experiment, agreement factors of R = 0.027 and wR2 = 0.059 were achieved. Additional information is available in Table S3 (Supplementary Material) and in CIF format; these data have been deposited with the CCDC (see Data Availability Statement).

2.2. Theoretical Calculations

Electronic structure calculations based on density functional theory (DFT) were performed using the Vienna ab initio simulation package (Georg Kresse, Jürgen Furthmüller, Vienna, Austria) (5.4.4) [12,13,14,15]. The PBE functional [16] together with the projector-augmented wave method [17] were employed. Furthermore, the D3 dispersion correction of Grimme and co-workers in combination with Becke–Johnson damping was utilized to account for van der Waals interactions [18]. The kinetic energy cutoff of the plane wave expansion was set to 500 eV.
Initial structures were optimized with respect to energy using a convergence criterion of 10−6 eV with regard to structural relaxation and 10−8 eV for electronic steps. After proving k-point convergence in all calculations, supercells were created based on relaxed structures with Phonopy [19,20]. All supercells had a length of at least 20 Å in each direction. Phonon calculations were performed with 49 × 49 × 42 q-points for determining DPS (density of phonon states) and thermal displacements, as implemented in Phonopy [21], while employing a frequency cutoff of 0.1 THz. A finite displacement [22] of 0.01 Å was used for the aforementioned calculations. However, supercell calculations were only performed at the Γ point. The conversion of crystallographic coordinates to Cartesian coordinates [23] was performed by a custom-made program, the molecular Toolbox [24], written in MATLAB [25]. Additionally, this program was used to calculate the root mean square of Cartesian deviations (RMS) [26].
The quasi-harmonic approximation [27,28] was used by relaxing the initial structure for various compression and expansion factors of unit cell volume. This procedure was completed in steps of 0.01 in the range from 0.96 to 1.04. Subsequent phonon calculations were performed as described above. After calculating thermal properties and energies, the Vinet equation of state [29], as implemented in Phonopy, was used to estimate the thermal expansion of the system at 170 K. The following steps were performed as described above but with a unit cell relaxed under the estimated thermal expansion. The deviation angles of the largest main axes components of sufficiently large thermal ellipsoids are calculated in analogy to our earlier study [30].

3. Results

According to commonly accepted criteria, our temperature-dependent experimental data qualify for benchmarking theoretical results. They extend to a resolution of sinθ/λ = 0.83 Å−1, well above the minimum required by the International Union of Crystallography (IUCr). We recall these standards: The IUCr adopts a limit of sinθ/λ = 0.60 Å−1 for “small molecules”; lower resolutions are flagged with an alert in the popular checkCIF routine. Refinements based on the temperature-dependent data sets converged favorably for low residuals, with a high ratio between independent observations and refined variables. The high-resolution diffraction experiment will be discussed below.
The good match between theoretical and experimental lattice parameters at 130 K (10.45679 vs. 10.56720(18) and 11.7696 vs. 11.9841(2) Å) with a Cartesian deviation (RMS) [26] of only 0.1492 Å represents a first indication that the first-principles approach provides a competent description of intermolecular interactions. A second quality criterion may be applied independently to experimentally derived as well as to theoretically calculated ADPs: atoms connected by covalent and coordinative bonds showed very similar displacement components in bond direction; neither the experimental nor the theoretical ADPs gave rise to violations of this so-called rigid bond test [31]. We have applied this criterion to validate ADPs refined in the context of experimental charge densities [32,33], and we use it here for the first time as an internal check for calculated displacements.
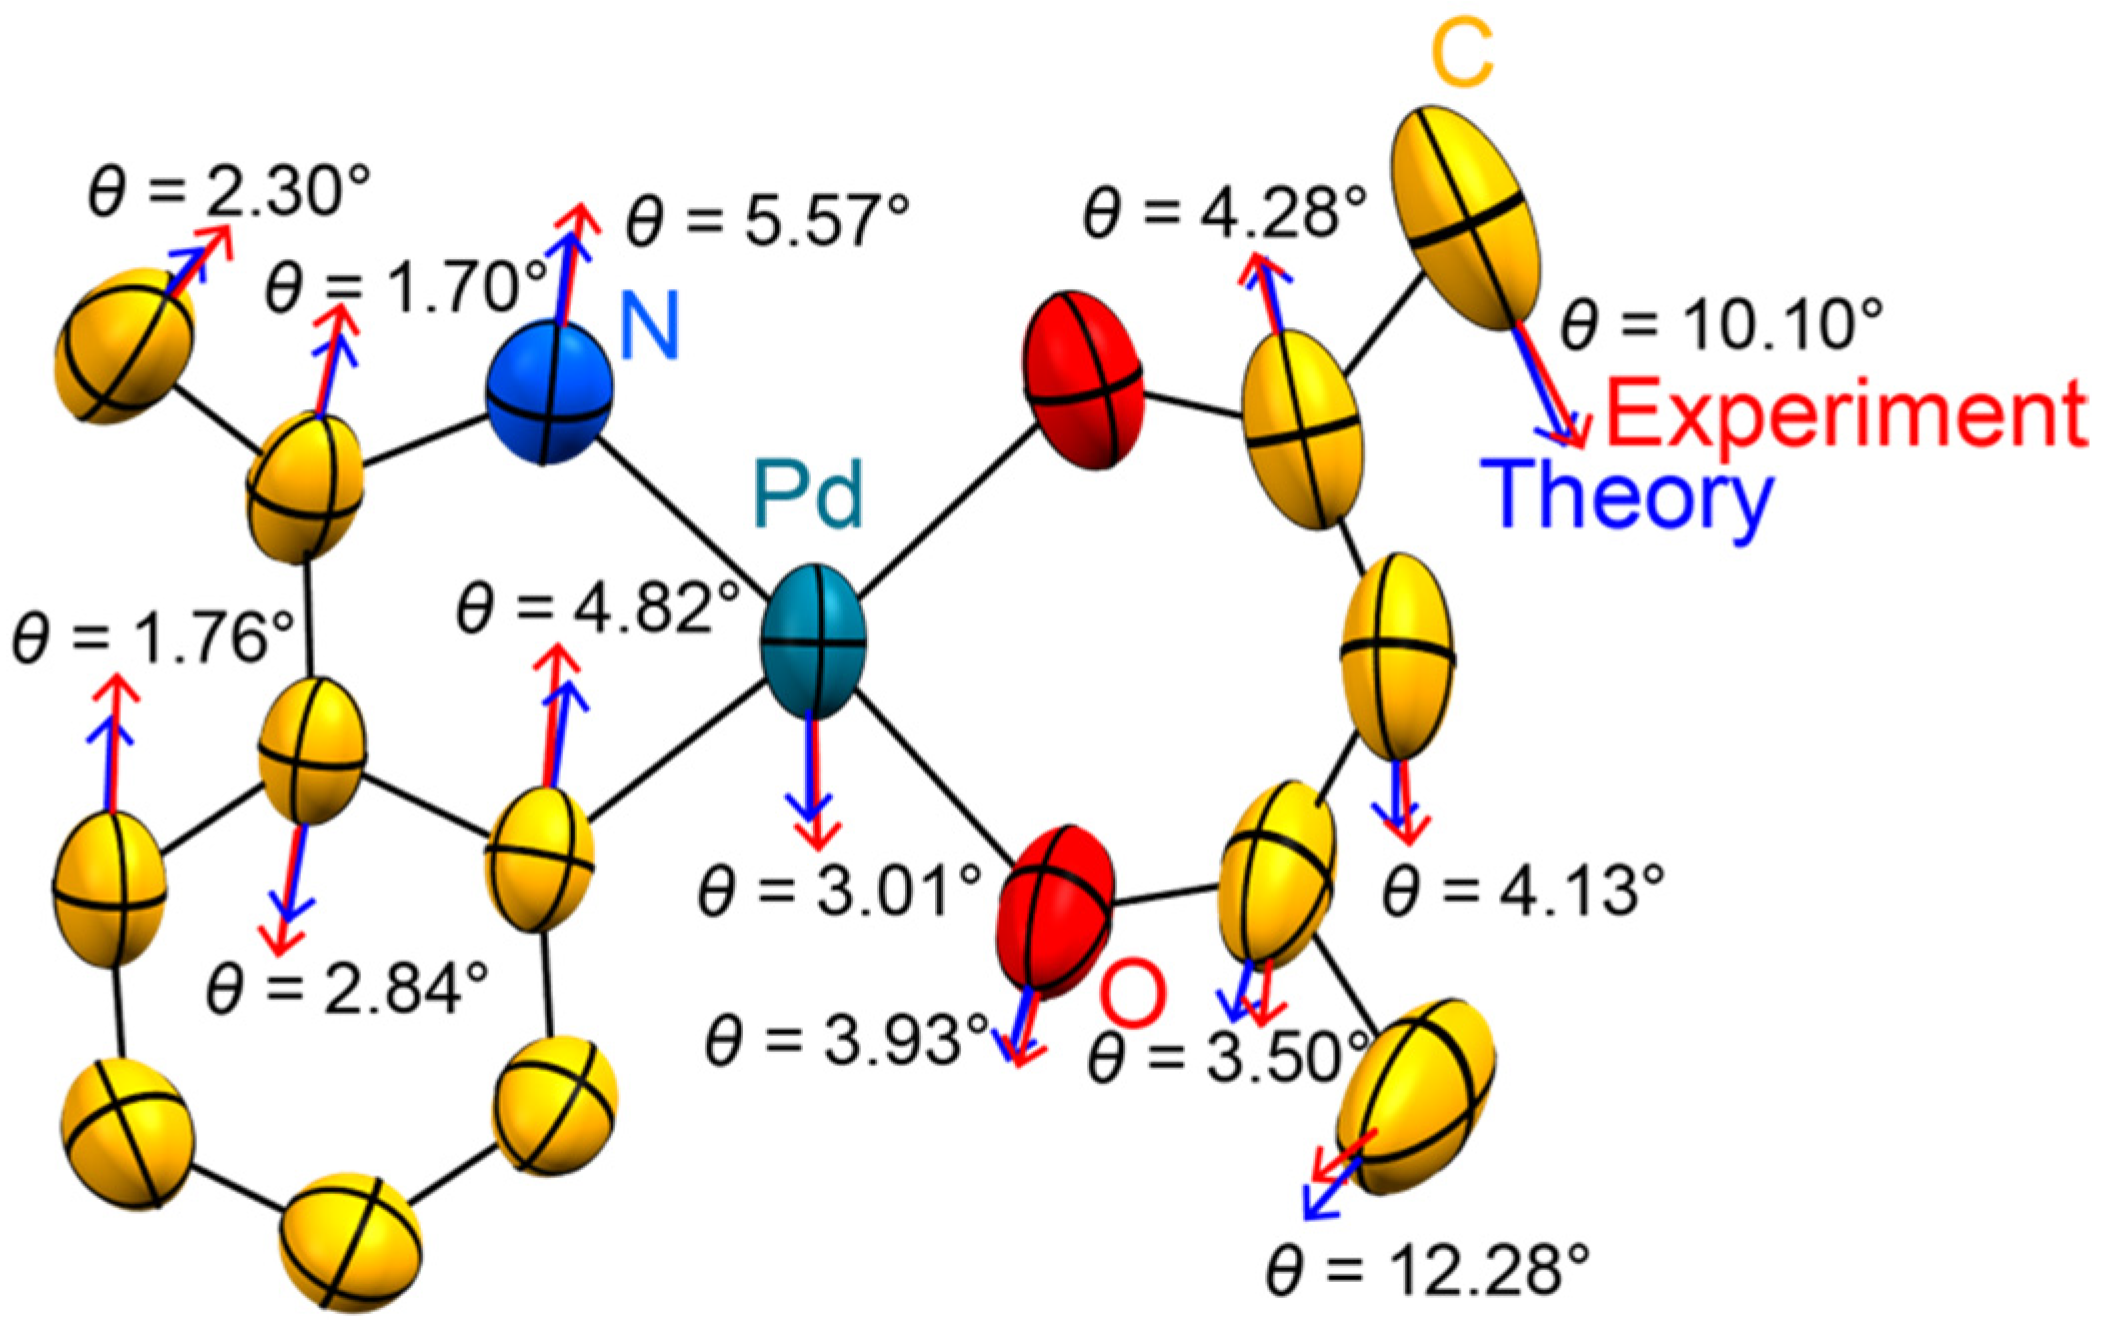
We have previously shown [30] that ADPs derived via the harmonic approximation often agree well with experimentally established displacement parameters with respect to their directionality. This is also true for our benchmark compound 1: the angles between the theoretical and experimental main axes of the ADPs are small and remain nearly constant throughout the entire temperature range under investigation, with deviations of only a few degrees. As an example, this good match is shown in Figure 2 for T = 130 K.
The good numerical agreement between the spatial orientation of the ellipsoids for all temperatures under investigation is shown in Table S1 in the Supplementary Material. In our earlier study [30], two out of three test compounds exhibited a similar agreement with regard to the thermal motion and the corresponding deviation angles.
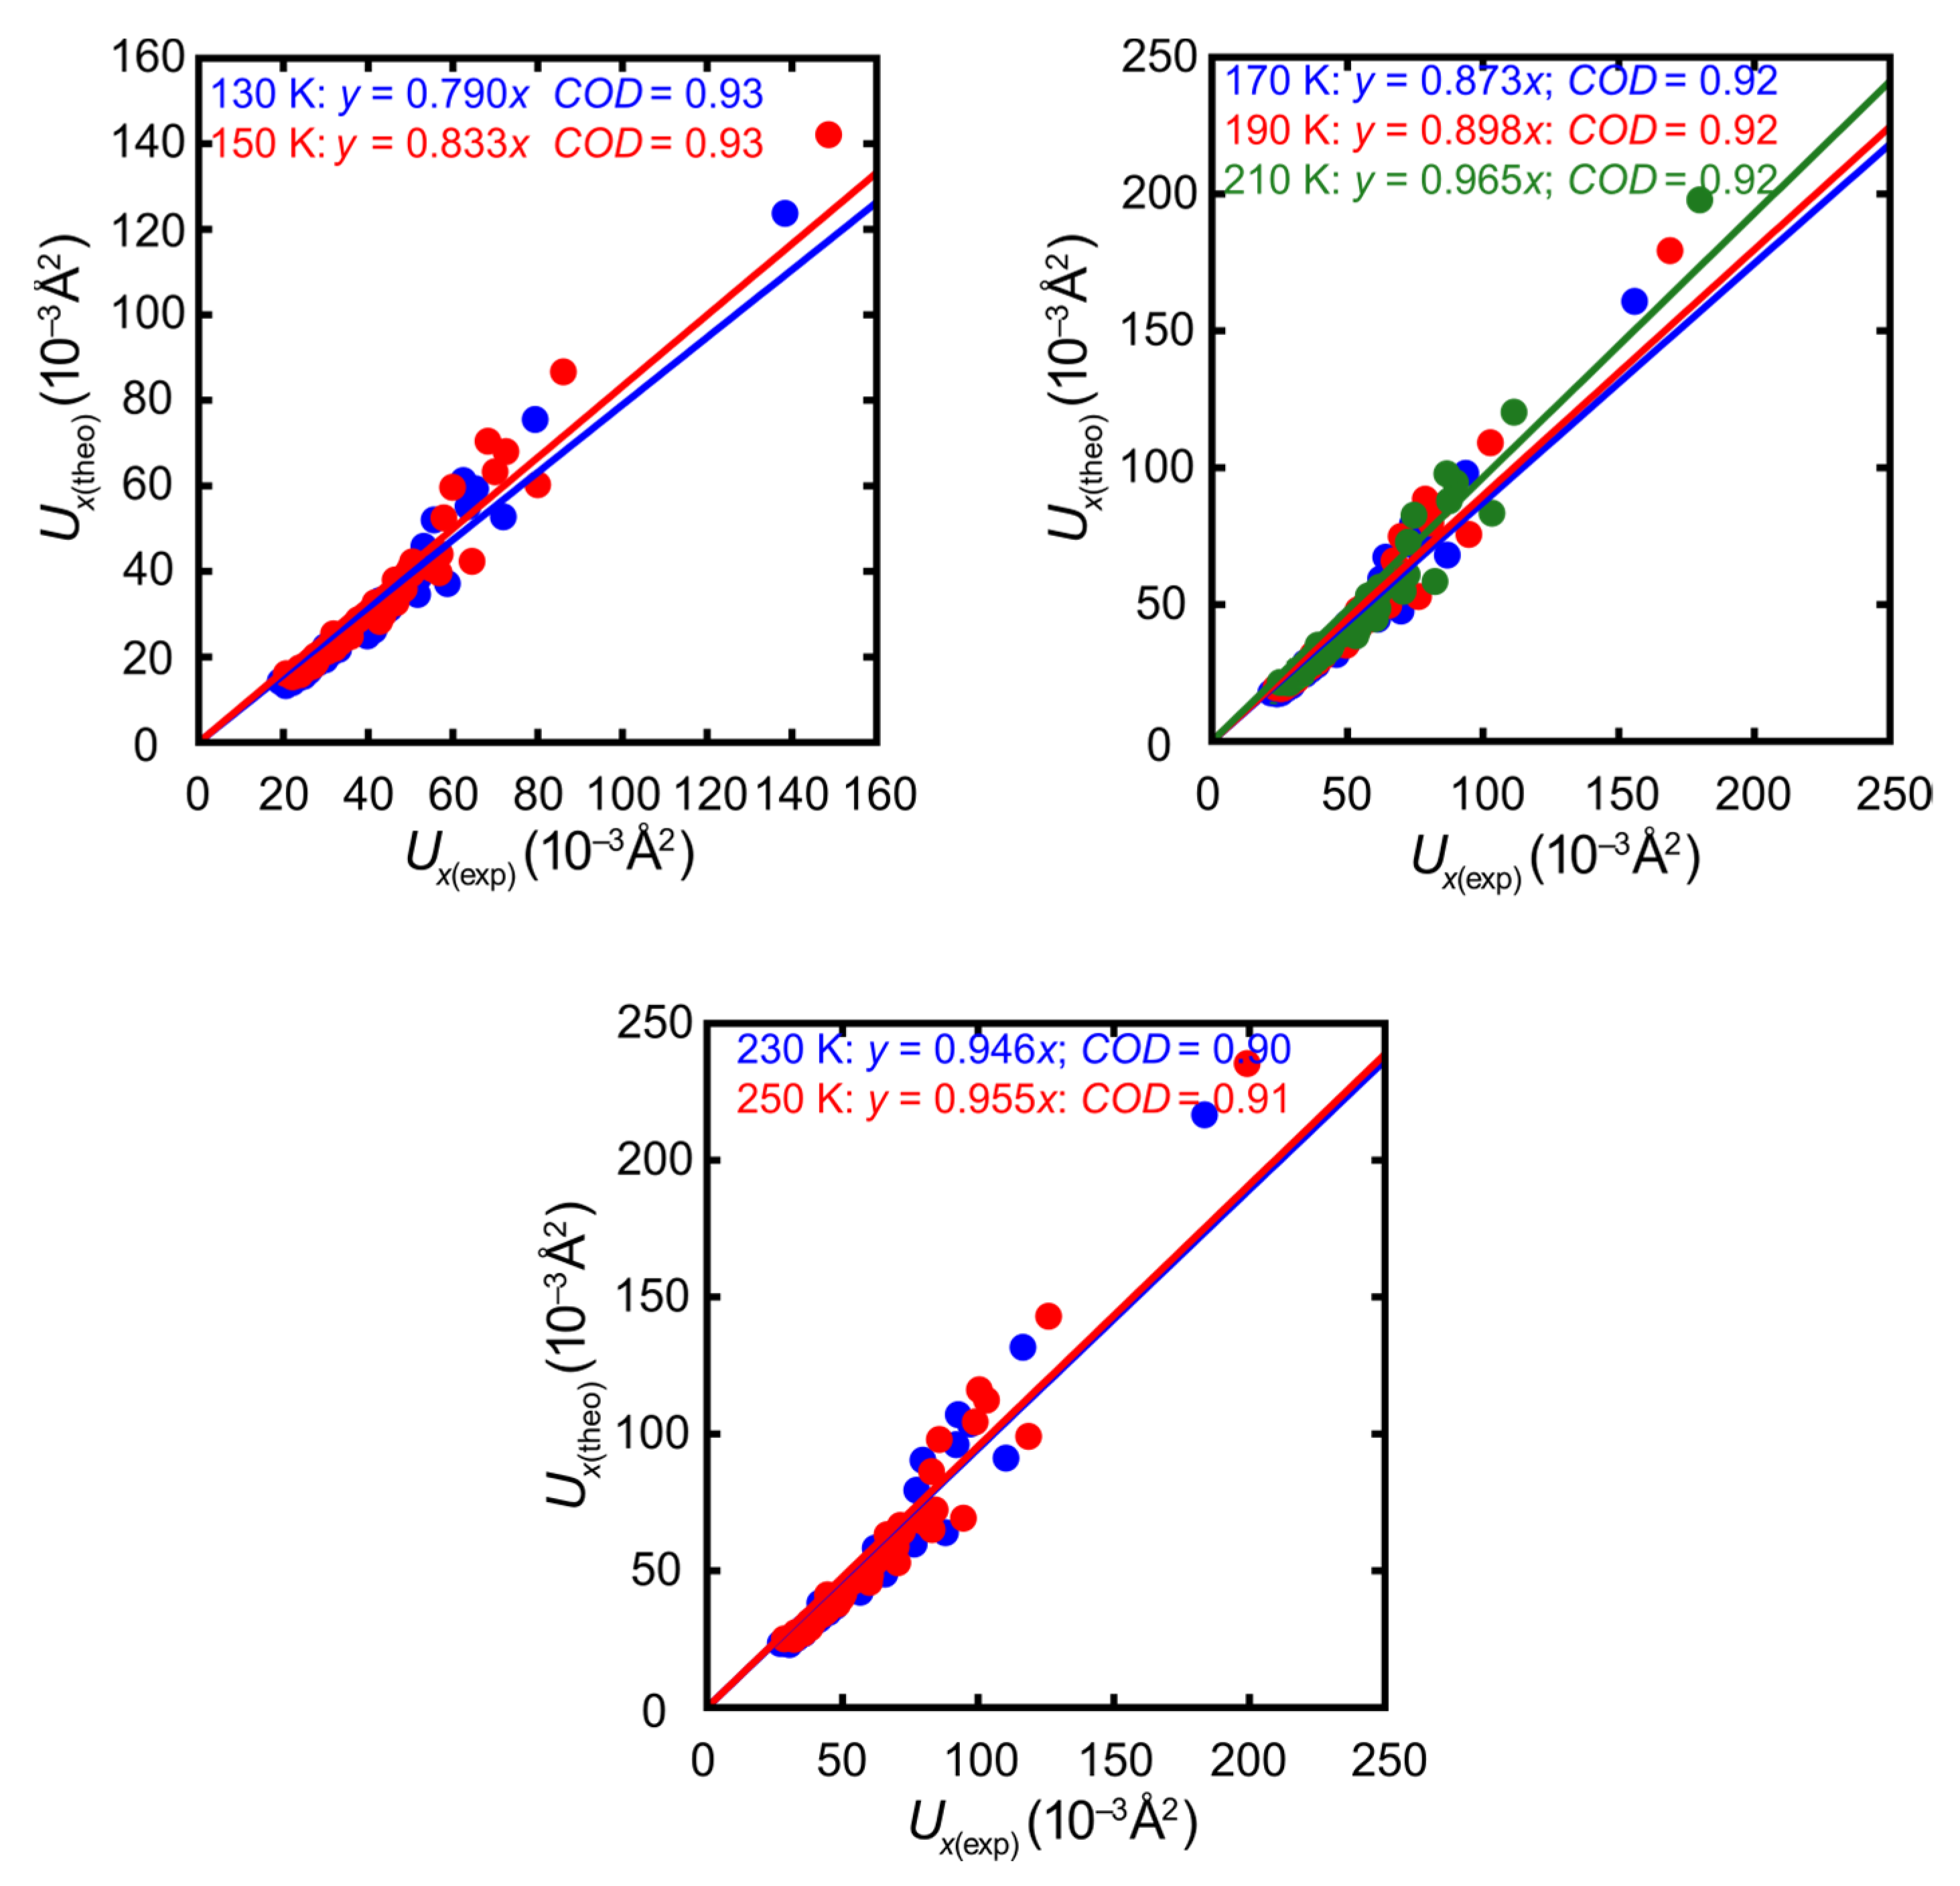
After confirming the correspondence between the theoretical and experimental description of the direction of the thermal motions, the second criterion for the quality of theoretically predicted ADPs needs to be considered. The amplitude of motion is compared in Figure 3 for all investigated temperatures.
Overall, Figure 3 reveals that the coefficient of determination (COD) and amplitude are acceptable for the entire temperature range under investigation, with a slightly lower slope for the lowest temperatures. It should be noted that in this case and the following scatter plots, with the exception of Figure 4, the least-squares-derived standard uncertainties of the experimental values are too small to be visualized. Obviously, such standard uncertainties can only represent the lower limit, and systematic errors in ADPs are usually much larger.
However, a common phenomenon concerning the harmonic approximation is obvious in this temperature-resolved study. Overall, the amplitude of motion is too small in the harmonic approximation, with all slopes in Figure 3 smaller than unity. Similar observations in other studies [2,34,35] confirm that the harmonic approximation generally underestimates the ADPs for at least two reasons: higher temperature leads to thermal expansion, and anharmonic contributions to the ADPs are neglected.
The quasi-harmonic approximation addresses the first aspect and provides a closer match with the experiment but requires a substantially higher computational effort, as various compressions and expansions of the unit cell have to be taken into account. In the context of this study, the more realistic quasi-harmonic approach resulted in an approximately ten-fold increase in computation time.
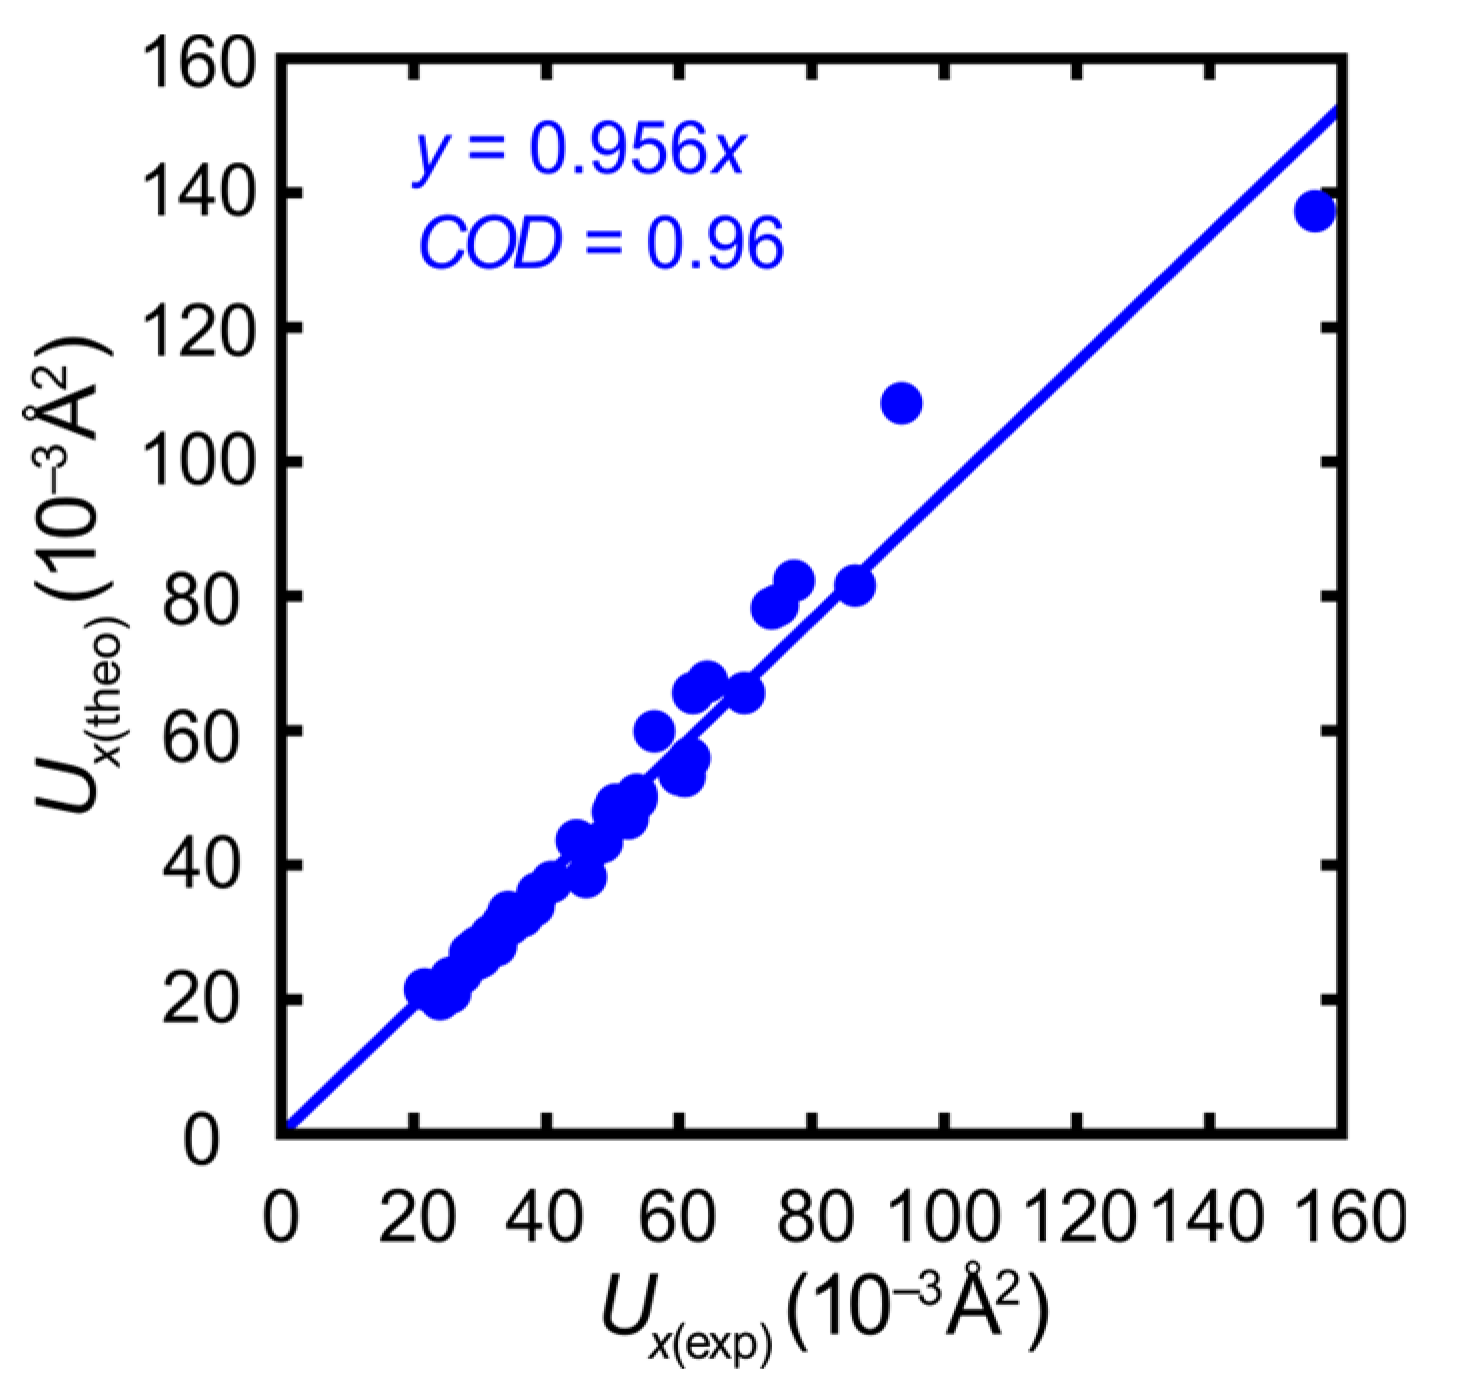
How rewarding is this higher investment in computation time? As an example, ADPs based on the quasi-harmonic approximation have been calculated for a temperature of 170 K. The agreement of the energy-minimized structure with the experiment, expressed as an RMS value, amounts to 0.1555 Å and is thus similar to the fit of the harmonic approximation at 130 K. The comparison between calculated and experimental ADPs is displayed in Figure 4. Table S2 in the Supplementary Material compiles information concerning the orientational agreement.
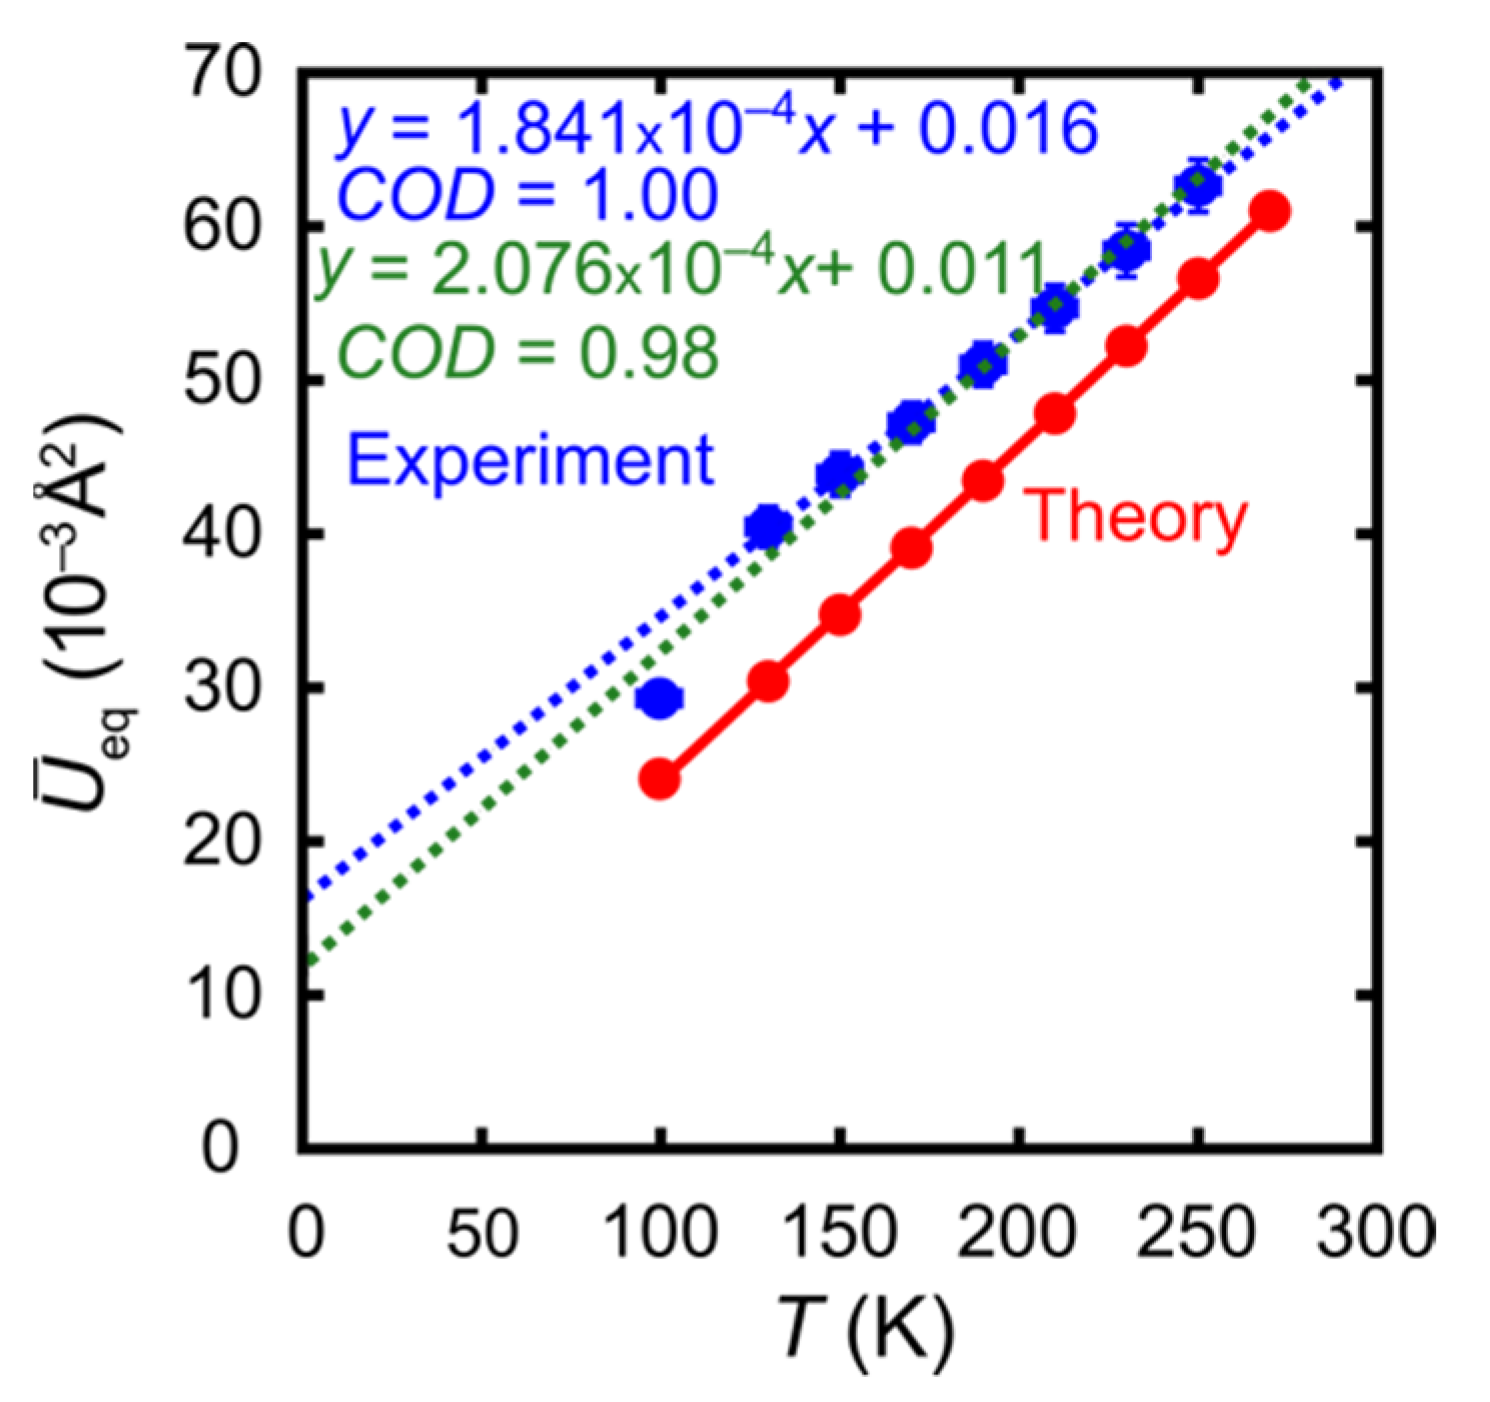
With this benchmark at hand, we set out to investigate whether the systematic error of the computationally economic harmonic approximation shows a simple relationship to the experiment and might be empirically corrected. Constant or temperature-dependent offsets between theory and experiment represent simple potential relationships. Possible relations may be discussed with the help of Figure 5. The figure correlates the calculated and experimentally established mean equivalent isotropic displacement parameter U ¯ e q with temperature. Quite arbitrarily, a linear fit is applied to experimental values, whereas data points from theory are simply connected by straight lines to guide the eye; temperature dependence in the case of theory follows Bose–Einstein statistics [36].
What can we learn from this synoptic figure? Visual inspection indicates that both the experimental and the theoretical ADPs increase with temperature in a roughly linear fashion. This statement is of course limited to the temperature range under study and by experimental uncertainties. The resulting lines are not strictly parallel; rather, a constant difference in temperature of 20 K should bring the ADPs from the harmonic approximation closer to the experimental values.
In this sense, we tested the correlations between theory and experiment assuming such a simple constant offset, e.g., ADPs from harmonic theory at 170 K versus ADPs derived from a diffraction experiment at 150 K. The results are depicted in Figure 6.
The correlations summarized in Figure 6 suggest that the parameter “temperature” in the computationally economic harmonic approximation underestimates the experimental temperature by about 20 K in the temperature range under study. Therefore, instead of replacing the oversimplified harmonic approximation with the more realistic but computationally demanding quasi-harmonic approximation, one might simply perform harmonic calculations at a temperature 20 K higher than the experiment. To avoid any possible misunderstanding, we do not claim any physical reason behind this simple recipe but only suggest an empirical correction backed by experimental data.
The fit thus obtained can be compared to the results shown in Figure 6: the suggested empirical correction is almost as efficient as the physically more meaningful but demanding quasi-harmonic approximation. The correlation between experiment and theory is slightly superior for the latter (COD of 0.96 vs. 0.90–0.93), whereas the slope, i.e., the match of the average amplitude, is better reflected by the empirical correction (0.96 vs. close to 1.0).

4. Discussion

Let us first comment on the slightly different slopes in Figure 5: One might envisage more sophisticated, e.g., temperature-dependent empirical corrections and more elaborate fits, but in view of the limitations of our approach, we did not pursue such alternatives.
The limitations of the present approach are obvious: The application of an empirical shift lacks any physical interpretation, and to date, our recipe is supported by a single set of temperature-resolved data. The latter drawback is somewhat alleviated by the fact that the tendency of the harmonic approximation to underestimate the amplitudes of motion is in principle well-known [1,37], albeit usually without quantitative estimates. For the small system investigated in this contribution, we might even avoid the entire discussion about empirical corrections by simply applying a better quasi-harmonic approximation. Our motivation behind the temperature-resolved data collection and a possible empirical correction stems from practical experience with displacement parameters. The diffraction data presented here have been collected under quite favorable conditions, on a crystal of good quality without major disorder or absorption problems, using superior instrumentation—in short, a benchmark system. Many diffraction experiments are performed under more difficult conditions on samples with limited resolution and less suitable hardware. ADPs suffer most from these shortcomings. It is therefore not surprising that restraints concerning ADPs are often used in an inappropriate way and in marked contrast to the recommendations of the program authors. In these cases, their scope is just to avoid physically meaningless refinement results rather than providing reliable statements concerning displacement. We suggest replacing dubious “refined” parameters with ADPs based on the harmonic approximation, which will become affordable even for medium-sized structures in the near future. We firmly believe that this approach may provide helpful external information for less straightforward diffraction experiments, with or without the empirical correction suggested here.
Figure 5 also includes the results of a control experiment. In addition to our series of temperature-resolved diffraction experiments on the same crystal, we collected data up to very high resolution on a second crystal at a different wavelength and with an alternative detector at 100 K. On the one hand, U ¯ e q derived from this experiment does not perfectly fit into the series of data collected on the first crystal (blue line in Figure 5). The overall coefficient of determination including all experimental diffraction data (green line in Figure 5) drops from 1.00 to 0.98. On the other hand, the results of this high-resolution data set are encouraging and informative:
  • Neither the individual sample nor the details of the instrumentation are reflected in drastically different ADPs. The directionality of the most prolate ADPs matches that from the temperature-dependent series (Figure S2 in the Supplementary Material). The ADP amplitudes derived from the control experiment are reasonably close to those expected by extrapolating the data collections on the first crystal to 100 K.
  • The high resolution of the control is comforting for a benchmark experiment but not mandatory. The truncation of this highly redundant data set to the IUCr standard resolution of 0.6 Å−1 only leads to an insignificant change of less than 1%.
  • The synopsis of both experiments—temperature-dependent diffraction on the first crystal and high-resolution diffraction on the second crystal—provides a more realistic picture of experimental errors than the numerical standard uncertainties of the refined ADP components. The discrepancy between the alternative correlations represented by the blue and green dashed lines in Figure 5 is modest but clearly visible. In other words, even the ADPs from carefully conducted experiments differ more than their numerical standard uncertainties suggest, and theory matches almost as well as an alternative experiment.
Quite obviously, the harmonic approximation can only give acceptable results within a certain temperature range. No general statements concerning a reasonable upper limit can be given, but this limitation should at least be addressed. As a very crude approximation, one might recur to the Lindemann criterion [38]. According to this idea, a solid will melt when mean atomic displacement reaches ca. 15–30% of inter-residue distances [39]. Anharmonicity will surely become relevant before this ratio is reached. If we consider 2 Å (the moderately strong N–H···O hydrogen bond) as the lower limit for intermolecular distances and a mean displacement of 0.25 Å at 250 K, we are close to the lower Lindemann limit, and our series of temperature-dependent diffraction data does not require extrapolation to higher temperatures. Compound 1 decomposes at 160 °C—at this temperature, a crystalline sample turns dark—and the residual solid becomes liquid at 175 °C. In this aspect, too, 1 represents a good test candidate since many organic and coordination compounds will melt or decompose at similar temperatures.

5. Conclusions and Future Work

The superior instrumentation available nowadays for diffraction experiments clearly facilitates systematic temperature-dependent studies [40], e.g., dedicated to molecular motion [41] or phase transitions [42,43] in molecular crystals. As a result of enormous progress in computer hard- and software, mobility in such molecular solids may also be assessed by theoretical methods [44,45]. These parallel developments have been mutually beneficial and indispensable for the approach presented here. It remains to be seen to what extent our empirical result can improve the fit between calculated and experimentally observed ADPs for molecular crystals in general; in view of our previous results on quite a variety of chemical systems, we are optimistic. Melting point considerations, as outlined in the previous section, may help to identify intervals of confidence for such empirically corrected ADPs. With respect to future work, it is tempting to extrapolate today’s possibilities: once limits concerning the subject of empirical corrections and an applicable temperature range have been established, fast computers may allow us to set up an ADP server for the chemical crystallography community, alongside the well-known SHADE server [46]. ADPs on demand via the World Wide Web seem feasible, at least at the level of the harmonic approximation.

Supplementary Materials

The following supporting information can be downloaded at: https://www.mdpi.com/article/10.3390/cryst12020283/s1, Figure S1: Displacement ellipsoids in the harmonic approximation for 1 at 130 K, drawn at the 90% probability level; Figure S2: Comparison of the orientation of theoretical (blue) and experimental (red) main-axis components for sufficiently anisotropic (Umax/Umin > 2) thermal ellipsoids, given for the high-resolution control experiment at 100 K (90% probability); Table S1: Deviation angles between experiment and theory (harmonic approximation) in the temperature range 150–250 K for the atoms shown in Figure S1; Table S2: As in Table S1, but for the quasi-harmonic approximation at 170 K; Table S3: Summary of crystal data, data collection parameters and convergence results for all diffraction data on 1.

Author Contributions

Conceptualization, U.E. and R.D.; methodology, D.M., R.W. and C.P.; software, D.M. and C.P.; validation, D.M. and R.W.; investigation, D.M and R.W.; data curation, D.M. and R.W.; writing—original draft preparation, D.M.; writing—review and editing, all authors; visualization, D.M.; supervision, U.E. and R.D.; project administration, C.P., U.E. and R.D.; funding acquisition, U.E. and R.D. All authors have read and agreed to the published version of the manuscript.

Funding

This research was funded by Deutsche Forschungsgemeinschaft, grant numbers EN 309/10-1 and DR 342/35-1, “Density-functional Calculation of Anisotropic Displacement Parameters and its Use for Improving Experimental X-ray and Neutron Diffraction”. JARA-HPC provided computing time with the JARA project (jara0069).

Institutional Review Board Statement

Not applicable.

Informed Consent Statement

Not applicable.

Data Availability Statement

Crystallographic data for this paper are openly available. They have been deposited as CCDC 2143154 (high resolution at 100 K) and CCDC 1997131-1997137 (130, 150, 170, 190, 210, 230, 250 K) in CIF format. These data can be obtained free of charge via http://www.ccdc.cam.ac.uk/conts/retrieving.html (accessed on 27 January 2022) (or from the CCDC, 12 Union Road, Cambridge CB2 1EZ, UK; Fax: +44-1223-336-033; E-Mail: [email protected]).

Acknowledgments

We thank Irmgard Kalf for help with sample preparation and crystallization, and we acknowledge support from the One Hundred-Talent Program of Shanxi Province and from DESY for providing access to the experimental facilities and travel support.

Conflicts of Interest

The authors declare no conflict of interest.

References

  1. George, J.; Deringer, V.L.; Wang, A.; Müller, P.; Englert, U.; Dronskowski, R. Lattice thermal expansion and anisotropic displacements in α-sulfur from diffraction experiments and first-principles theory. J. Chem. Phys. 2016, 145, 234512. [Google Scholar] [CrossRef] [PubMed] [Green Version]
  2. George, J.; Wang, R.; Englert, U.; Dronskowski, R. Lattice thermal expansion and anisotropic displacements in urea, bromomalonic aldehyde, pentachloropyridine, and naphthalene. J. Chem. Phys. 2017, 147, 074112. [Google Scholar] [CrossRef] [PubMed] [Green Version]
  3. George, J.; Wang, A.; Deringer, V.L.; Wang, R.; Dronskowski, R.; Englert, U. Anisotropic displacement parameters from dispersion-corrected DFT methods and their experimental validation by temperature-dependent X-ray diffraction. CrystEngComm 2015, 17, 7414–7422. [Google Scholar] [CrossRef] [Green Version]
  4. Schwarzenbach, D. The success story of crystallography. Z. Kristallogr. Cryst. Mater. 2012, 227, 52–62. [Google Scholar] [CrossRef]
  5. Glusker, J.P.; Lewis, M.; Rossi, M. Crystal Structure Analysis for Chemists and Biologists, 1st ed.; VCH Publishers: New York, NY, USA, 1994. [Google Scholar]
  6. Mroz, D.; Wang, R.; Englert, U.; Dronskowski, R. Can we trust the experiment? Anisotropic displacement parameters in 1-(halogenmethyl)-3-nitrobenzene (halogen = Cl, Br). Acta Crystallogr. Sect. C 2020, 76, 591–597. [Google Scholar] [CrossRef] [PubMed]
  7. Calmuschi, B.; Englert, U. (S)-(Acetylacetonato-κ2O,O)[2-(1-aminoethyl)phenyl-κ2C1,N]palladium(II). Acta Crystallogr. Sect. E 2005, 61, m164–m165. [Google Scholar] [CrossRef]
  8. P24 Chemical Crystallography. Available online: https://photon-science.desy.de/facilities/petra_iii/beamlines/p24_chemical_crystallography/index_eng.html (accessed on 16 January 2022).
  9. Bruker. SADABS; Bruker: Madison, WI, USA, 2014. [Google Scholar]
  10. Kabsch, W. XDS. Acta Crystallogr. Sect. D 2010, 66, 125–132. [Google Scholar] [CrossRef] [Green Version]
  11. Sheldrick, G.M. Crystal structure refinement with SHELXL. Acta Crystallogr. Sect. C 2015, 71, 3–8. [Google Scholar] [CrossRef]
  12. Kresse, G.; Hafner, J. Ab initio molecular dynamics for liquid metals. Phys. Rev. B 1993, 47, 558–561. [Google Scholar] [CrossRef]
  13. Kresse, G.; Hafner, J. Ab initio molecular-dynamics simulation of the liquid-metal-amorphous-semiconductor transition in germanium. Phys. Rev. B 1994, 49, 14251–14269. [Google Scholar] [CrossRef]
  14. Kresse, G.; Furthmüller, J. Efficient iterative schemes for ab initio total-energy calculations using a plane-wave basis set. Phys. Rev. B 1996, 54, 11169–11186. [Google Scholar] [CrossRef] [PubMed]
  15. Kresse, G.; Furthmüller, J. Efficiency of ab-initio total energy calculations for metals and semiconductors using a plane-wave basis set. Comput. Mater. Sci. 1996, 6, 15–50. [Google Scholar] [CrossRef]
  16. Kresse, G.; Joubert, D. From ultrasoft pseudopotentials to the projector augmented-wave method. Phys. Rev. B 1999, 59, 1758–1775. [Google Scholar] [CrossRef]
  17. Blöchl, P.E. Projector augmented-wave method. Phys. Rev. B 1994, 50, 17953–17979. [Google Scholar] [CrossRef] [Green Version]
  18. Grimme, S.; Antony, J.; Ehrlich, S.; Krieg, H. A consistent and accurate ab initio parametrization of density functional dispersion correction (DFT-D) for the 94 elements H-Pu. J. Chem. Phys. 2010, 132, 154104. [Google Scholar] [CrossRef] [Green Version]
  19. Togo, A.; Oba, F.; Tanaka, I. First-principles calculations of the ferroelastic transition between rutile-type and CaCl2-type SiO2 at high pressures. Phys. Rev. B 2008, 78, 134106. [Google Scholar] [CrossRef] [Green Version]
  20. Togo, A.; Tanaka, I. First principles phonon calculations in materials science. Scr. Mater. 2015, 108, 1–5. [Google Scholar] [CrossRef] [Green Version]
  21. Deringer, V.L.; Stoffel, R.P.; Togo, A.; Eck, B.; Meven, M.; Dronskowski, R. Ab initio ORTEP drawings: A case study of N-based molecular crystals with different chemical nature. CrystEngComm 2014, 16, 10907–10915. [Google Scholar] [CrossRef]
  22. Parlinski, K.; Li, Z.Q.; Kawazoe, Y. First-Principles Determination of the Soft Mode in Cubic ZrO2. Phys. Rev. Lett. 1997, 78, 4063–4066. [Google Scholar] [CrossRef]
  23. Grosse-Kunstleve, R.W.; Adams, P.D. On the handling of atomic anisotropic displacement parameters. J. Appl. Crystallogr. 2002, 35, 477–480. [Google Scholar] [CrossRef] [Green Version]
  24. George, J. Molecular Toolbox and Additional Information Regarding ADP Computation; Ellipsoids; Available online: http://www.ellipsoids.de (accessed on 16 January 2022).
  25. MATLAB. R 2016b; The MathWorks Inc.: Natick, MA, USA, 2016. [Google Scholar]
  26. George, J.; Deringer, V.L.; Dronskowski, R. Dimensionality of Intermolecular Interactions in Layered Crystals by Electronic-Structure Theory and Geometric Analysis. Inorg. Chem. 2015, 54, 956–962. [Google Scholar] [CrossRef] [PubMed]
  27. Stoffel, R.P.; Wessel, C.; Lumey, M.W.; Dronskowski, R. Ab initio thermochemistry of solid-state materials. Angew. Chem. Int. Ed. 2010, 49, 5242–5266. [Google Scholar] [CrossRef] [PubMed]
  28. Erba, A.; Maul, J.; Itou, M.; Dovesi, R.; Sakurai, Y. Anharmonic Thermal Oscillations of the Electron Momentum Distribution in Lithium Fluoride. Phys. Rev. Lett. 2015, 115, 117402. [Google Scholar] [CrossRef] [PubMed] [Green Version]
  29. Vinet, P.; Smith, J.R.; Ferrante, J.; Rose, J.H. Temperature effects on the universal equation of state of solids. Phys. Rev. B 1987, 35, 1945–1953. [Google Scholar] [CrossRef] [Green Version]
  30. Mroz, D.; George, J.; Kremer, M.; Wang, R.; Englert, U.; Dronskowski, R. A new tool for validating theoretically derived anisotropic displacement parameters with experiment: Directionality of prolate displacement ellipsoids. CrystEngComm 2019, 21, 6396–6404. [Google Scholar] [CrossRef]
  31. Hirshfeld, F.L. Can X-ray data distinguish bonding effects from vibrational smearing? Acta Crystallogr. Sect. A 1976, 32, 239–244. [Google Scholar] [CrossRef]
  32. Wang, R.; Hartnick, D.; Englert, U. Short is strong: Experimental electron density in a very short N···I halogen bond. Z. Krist.-Cryst. Mater. 2018, 233, 733–744. [Google Scholar] [CrossRef]
  33. Wang, R.; George, J.; Potts, S.K.; Kremer, M.; Dronskowski, R.; Englert, U. The many flavours of halogen bonds–message from experimental electron density and Raman spectroscopy. Acta Crystallogr. Sect. C 2019, 75, 1190–1201. [Google Scholar] [CrossRef] [Green Version]
  34. Madsen, A.Ø.; Civalleri, B.; Ferrabone, M.; Pascale, F.; Erba, A. Anisotropic displacement parameters for molecular crystals from periodic Hartree–Fock and density functional theory calculations. Acta Crystallogr. Sect. A 2013, 69, 309–321. [Google Scholar] [CrossRef]
  35. Deringer, V.L.; Wang, A.; George, J.; Dronskowski, R.; Englert, U. Anisotropic thermal motion in transition-metal carbonyls from experiments and ab initio theory. Dalton Trans. 2016, 45, 13680–13685. [Google Scholar] [CrossRef] [Green Version]
  36. Willis, B.T.M.; Pryor, A.W. Thermal Vibrations in Crystallography, 1st ed.; Cambridge University Press: Cambridge, UK, 1975. [Google Scholar]
  37. Bürgi, H.B.; Capelli, S.C.; Birkedal, H. Anharmonicity in anisotropic displacement parameters. Acta Crystallogr. Sect. A 2000, 56, 425–435. [Google Scholar] [CrossRef]
  38. Lindemann, F.A. The Calculcation of Molecular Vibration Frequencies. Phys. Z. 1910, 11, 609–615. [Google Scholar]
  39. Löwen, H. Melting, freezing and colloidal suspensions. Phys. Rep. 1994, 237, 249–324. [Google Scholar] [CrossRef]
  40. Bürgi, H.B.; Förtsch, M. Dynamic processes and disorder in crystal structures as seen by temperature-dependent diffraction experiments. J. Mol. Struct. 1999, 485–486, 457–463. [Google Scholar] [CrossRef]
  41. Capelli, S.C.; Albinati, A.; Mason, S.A.; Willis, B.T.M. Molecular motion in crystalline naphthalene: Analysis of multi-temperature X-ray and neutron diffraction data. J. Phys. Chem. A 2006, 110, 11695–11703. [Google Scholar] [CrossRef] [PubMed]
  42. Guo, Q.; Merkens, C.; Si, R.; Englert, U. Crosslinking of the Pd(acacCN)2 building unit with Ag(I) salts: Dynamic 1D polymers and an extended 3D network. CrystEngComm 2015, 17, 4383–4393. [Google Scholar] [CrossRef] [Green Version]
  43. Strothmann, R.; van Terwingen, S.; Kalf, I.; Englert, U. Systematic screening for k type phase transitions–general approach and positive example for a binuclear Cu(II) paddlewheel structure. CrystEngComm 2021, 23, 841–849. [Google Scholar] [CrossRef]
  44. Albino, A.; Benci, S.; Atzori, M.; Chelazzi, L.; Ciattini, S.; Taschin, A.; Bartolini, P.; Lunghi, A.; Righini, R.; Torre, R.; et al. Temperature Dependence of Spin-Phonon Coupling in [VO(acac)2]: A Computational and Spectroscopic Study. J. Phys. Chem. C 2021, 125, 22100–22110. [Google Scholar] [CrossRef]
  45. Moseley, D.H.; Stavretis, S.E.; Thirunavukkuarasu, K.; Ozerov, M.; Cheng, Y.; Daemen, L.L.; Ludwig, J.; Lu, Z.; Smirnov, D.; Brown, C.M.; et al. Spin–phonon couplings in transition metal complexes with slow magnetic relaxation. Nat. Commun. 2018, 9, 2572. [Google Scholar] [CrossRef]
  46. Madsen, A.Ø. SHADE web server for estimation of hydrogen anisotropic displacement parameters. J. Appl. Crystallogr. 2006, 39, 757–758. [Google Scholar] [CrossRef] [Green Version]
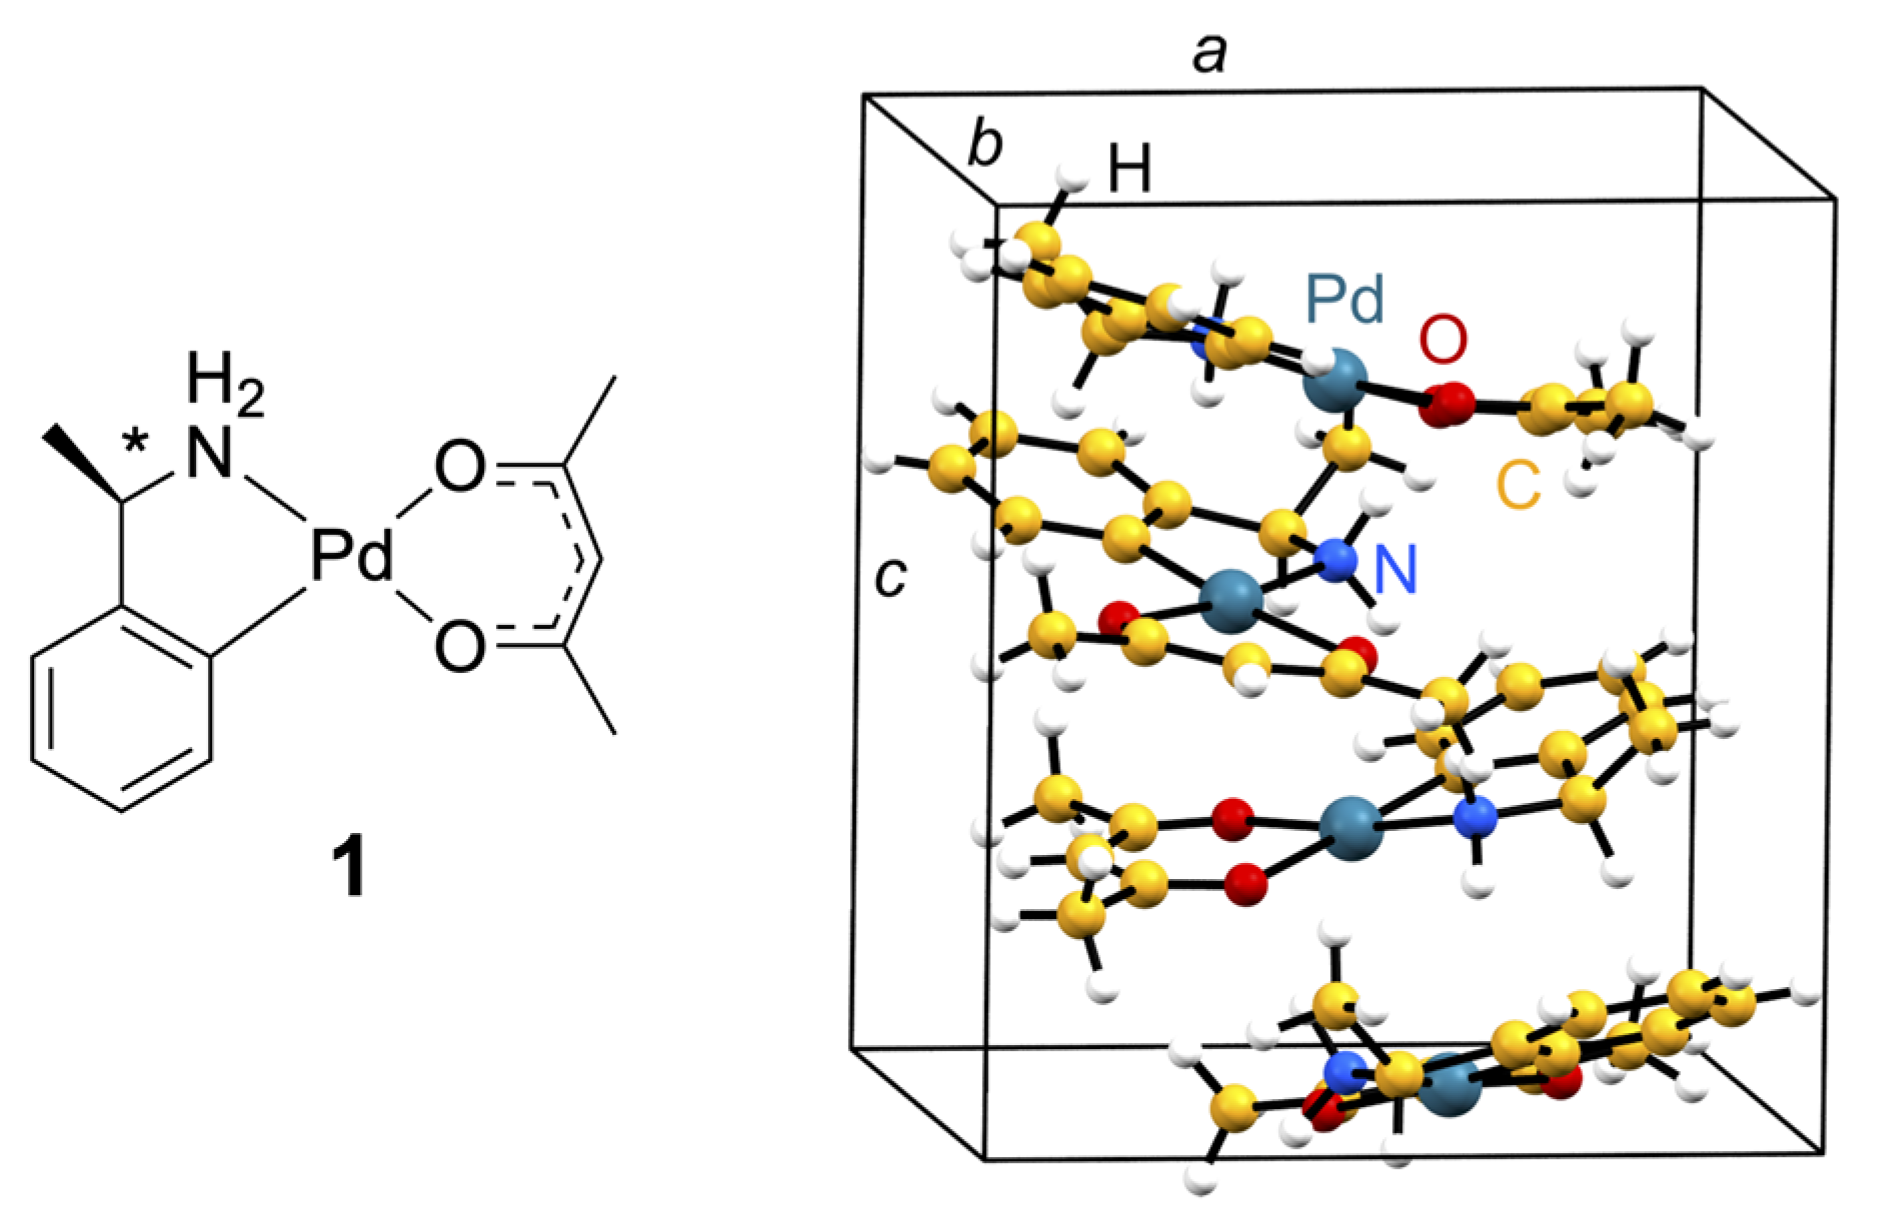
Figure 1. (Left) Chemical diagram for 1. (Right) Unit cell for 1.
Crystals 12 00283 g001
Figure 2. Comparison of the orientation of theoretical (blue) and experimental (red) main axis components for sufficiently anisotropic (Umax/Umin > 2) thermal ellipsoids, given for the 130 K structure and drawn at the 90% probability level. The structure is drawn in the theoretically predicted crystallographic coordinate system, and deviation angles are given next to the corresponding atoms.
Crystals 12 00283 g002
Figure 3. Scatter plots of theoretical and experimental main-axis components with linear fits and coefficients of determination (CODs) for 130 K and 150 K (top left), 170 K, 190 K, and 210 K (top right), and 230 K and 250 K (bottom), together with linear fits and the CODs.
Crystals 12 00283 g003
Figure 4. Scatter plot of theoretical and experimental main-axis components and linear fit with the corresponding COD for 170 K in the quasi-harmonic approximation.
Crystals 12 00283 g004
Figure 5. Scatter plot of the mean equivalent displacement parameter ( U ¯ e q ) of experiment (blue) and theory (red) against temperature. The green dashed line comprises all experimental diffraction data on both crystals. A linear fit together with the COD is given for the experimental data, whereas a guide for the eye is depicted in the case of theoretical values. Vertical and horizontal error bars indicate threefold standard uncertainties.
Crystals 12 00283 g005
Figure 6. Temperature-shifted correlation between theoretical and experimental main-axis components for (top left) 1 (theory 150 K, experiment 130 K), 2 (theory 170 K, experiment 150 K), (top right) 3 (theory 190 K, experiment 170 K), 4 (theory 210 K, experiment 190 K), 5 (theory 230 K, experiment 210 K), (bottom) 6 (theory 250 K, experiment 230 K), and 7 (theory 270 K, experiment 250 K).
Crystals 12 00283 g006
Publisher’s Note: MDPI stays neutral with regard to jurisdictional claims in published maps and institutional affiliations.