Article

Research on EDM Performance of Renewable Dielectrics under Different Electrodes for Machining SKD11

1
Henan Key Lab of Intelligent Manufacturing of Mechanical Equipment, Mechanical and Electrical Engineering Institute, Zhengzhou University of Light Industry, Zhengzhou 450002, China
2
School of AutoMation, Guangdong University of Petrochemical Technology, Maoming 525000, China
3
School of Mechanical Engineering, Dongguan University of Technology, Dongguan 523000, China
4
Bone and Joint Research Team of Degeneration and Injury, Guangdong Provincial Academy of Chinese Medical Sciences, Guangzhou 510120, China
5
Guangdong HUST Industrial Technology Research Institute, Guangdong Provincial Key Laboratory of Digital Manufacturing Equipment, Dongguan 523808, China
*
Authors to whom correspondence should be addressed.
Crystals 2022, 12(2), 291; https://doi.org/10.3390/cryst12020291
Submission received: 21 January 2022 / Revised: 12 February 2022 / Accepted: 16 February 2022 / Published: 18 February 2022
(This article belongs to the Special Issue Non-traditional Machining of Crystal Materials)

Abstract

:
Electrical discharge machining (EDM) is a non-traditional process, which can cut materials with a high melting point, high hardness, high strength, and low brittleness. However, the kerosene (dielectric of EDM) produces aerosols and toxic gases at high temperatures, which seriously affect the health of operators and air quality. This means that it is not conducive to the green manufacturing and sustainable development of EDM. In this study, thereafter, sunflower seed oil (SSO) and kerosene were used as dielectrics of EDM for machine SKD11, and the machining performance of the two dielectrics under different current, duty ratio, pulse duration and electrodes were comparatively analyzed, such as material remove rate (MRR), surface roughness (Ra), energy efficiency per volume (EEV) and exhaust emissions characteristics (EEC). This investigation found that the minimum value of EEV in SSO was 0.3879 kJ/mm3, which was about 25% lower than the minimum value of 0.4849 kJ/mm3 in kerosene. The emission rate of Cu electrode in SSO was 62.017 µg/min, which was lower than that in 78.857 µg/min, decreasing by about 21.36%, in kerosene. In addition, a super depth of field optical micro-scope was subsequently used in the experiments to observe the diameter of the debris. The results indicated that SSO has a larger proportion of debris of more than 35 µm in diameter. Therefore, SSO can be adopted as a substitute for kerosene dielectric to improve the sustainability of electrical discharge machining and realize green manufacturing.

1. Introduction

In the 1940s, the former Soviet Union physicist Lazarenko [1] found that electrical contact corrosion (electric corrosion) is inevitable. Therefore, he applied the principle of electric corrosion to the manufacturing field and developed the electric discharge machining technology (EDM) [2]. EDM is a non-traditional processing method that can process materials with a high melting point, high hardness, high strength and low brittleness, and is commonly used in molds, aerospace and auto-motive parts manufacturing [3,4]. In the fluid dielectric, the tool electrode and the workpiece generate an electric spark in a narrow gap, and the electric spark lasts only a few microseconds. However, the instantaneous high temperature exceeding 6000 K can be generated in the discharge area, which can melt or even vaporize the material on the tool electrode and the surface of the workpiece [5,6,7]. Melted or even vaporized metal is thrown into the fluid under the action of explosive force, and solidifies into metal debris after cooling [8,9]. However, in the process of material melting and gasification, a number of reactants, such as aerosols and toxic gas, are generated in the mineral oil dielectric. The aromatics, alkanes, and alkanes contained in the hydrocarbon-based dielectric, have a serious impact on the health of operators and air quality, which does not contribute to the green manufacturing and sustainable development of EDM [10]. In the EDM process, the generation of hazardous substances depends on the dielectric, tool electrode material and workpiece material, and the number of hazardous substances depends on factors such as current, voltage, and pulse duration [11]. The sustainability of the manufacturing process can be assessed through an important criterion such as personnel health, operational safety, environmental impact, manufacturing costs and energy consumption, and waste management.
One important function of the dielectric is to cool the material melted and vaporized in the discharge gap, and to flush out the material debris from the discharge gap to prevent the debris from affecting the subsequent machining process [12]. The dielectric used in EDM must meet the physical performance requirements of insulation, a high ignition point, high flash point, low viscosity, and sufficient wettability. At the same time, it must also comply with the requirements of being non-toxic, non-corrosive, chemically inert, and other chemical properties. The most commonly used dielectric is kerosene [13,14,15]. Due to the intense temperature and pressure rising and falling sharply, the EDM dielectric becomes partially ionized to produce gas and smoke, which will have a negative effect on the natural environment and the health of the operators. Bommeli et al. [16] observed that hydrocarbon oil can emit benzene, polycyclic aromatic hydrocarbons (PAH), mineral oil vapors, aerosols, and by-products that have a serious impact on the health of operators. Tönshoff et al. [17] found that hydrocarbon oil emitted harmful substances such as aliphatic hydrocarbons, aerosols, non-specific aliphatic hydrocarbons, benzene and fine dust. Liu et al. [18] observed that aerosols and toxic gas generated during EDM cause serious occupational and environmental problems. In the search to address the emission problem of EDM and improve sustainability, the influence of factors such as dielectric, tool electrode material, peak current, voltage, and pulse duration on the environment, machining quality, and machining cost has attracted more and more attention.
In order to decrease the impact of toxic gases produced by mineral dielectrics on the environment and operators, the method of replacing mineral oils such as kerosene with water-based dielectrics has proved feasible [19,20,21]. König [22] found that water-based dielectrics with a glycerol concentration of 50% to 60% were suitable for roughing and finishing. In addition, in large-area finishing, the removal rate can be enhanced by up to 100%. Chen et al. [23] adopted kerosene and distilled water as the dielectric. Through experiments, they found that when using copper as the electrode to process Ti-6A1-4V materials, the removal rate of materials with distilled water as the dielectric was greater than that of kerosene. However, there are many cracks on the surface under distilled water. The discharge impulse of EDM in kerosene is greater than that in distilled water, but the discharge impulse in distilled water is more stable and continuous. Tang et al. [24] used tap water as the dielectric to process Ti-6Al-4V materials and found that the processing performance was best when the current was 11 A, the gap voltage was 30 V, and the pulse duration was 30 μs, while the MRR and surface quality were improved through parameter optimization. Kunieda et al. [25] proposed a green electric spark method. During the processing of an electric spark using water-based dielectric, high-pressure air was passed through the hollow tool electrode to accelerate the removal of material debris in the discharge gap. This could not only solve the problem of polluting gas emitted by the dielectric but also improve the processing performance. Due to poor insulation and the corrosion resistance of water-based dielectrics, it can result in poor machining accuracy. Therefore, mineral oil has continued to be widely used as the dielectric of EDM.
In order to make EDM processing more environmentally friendly, and to ensure the insulation and corrosion resistance of the dielectric, researchers conducted studies on the use of renewable bio-oil instead of mineral oil. Valaki et al. [26] used M238 HH-grade cold worked plastic mould steel workpieces and a copper rod with a diameter of 20 mm as an electrode to compare the processing performance of waste vegetable oil and kerosene. They found that the MRR and electrode wear rate of the two had similar changing trends, and waste vegetable oil could be used as a substitute for hydrocarbon-based kerosene. In addition, through the evaluation of the applicability of waste vegetable oil processing, it was found that waste vegetable oil was a cleaner and more environmentally friendly dielectric. EDM based on waste vegetable oil dielectric can reduce the environmentally negative effect of the EDM process, improve operating safety and resolve health issues.
Ng et al. [27] explored the effects of sunflower seed oil (SSO) and rapeseed oil on the processing performance of EDM. The experimental results showed that SSO and rapeseed oil emitted less harmful gases than kerosene. When processing bulk metallic glass, the MRR of SSO and rapeseed oil was greater than twice that of kerosene. Valaki et al. [28] compared the machining performance of palm oil and kerosene in EDM and found that the MRR of the former was higher than that of the latter, and the surface roughness was almost the same. They concluded that palm oil can replace kerosene as the EDM dielectric. Valaki et al. [29] found that jatropha oil, when used as dielectric, had higher MRR, better surface finish and surface hardness than kerosene, and the reaction mode was the same as that of kerosene. They concluded that jatropha oil could be used as EDM dielectric. Khan et al. [30] compared the physical properties of jatropha oil and kerosene in detail. For example, they found the former had a higher flash point, which was conducive to improving the machining performance of EDM with jatropha oil as the dielectric. The kinematic viscosity of jatropha oil at a standard temperature was 2.6 times that of kerosene, which indicated that jatropha oil was more suitable for MRR and acted as a higher current EDM than kerosene. In addition, Jatropha oil had a higher thermal conductivity, which indicated that more heat was passed in the spark zone during processing, which was conducive to achieving higher MRR. Therefore, they came to the conclusion that jatropha oil could replace kerosene as the EDM dielectric. Das et al. [31] compared the processing performance of neem oil and kerosene as the dielectric and found that when the current was greater than 7 A, the MRR of the former was 22% higher than the latter on average. Since neem oil has a higher flash point, higher oxygen content and shorter hydrocarbon chain than kerosene, fewer pollutants are be emitted during processing. In addition, due to the high magnetic susceptibility of neem oil, when processed to a certain depth, it can save more time than kerosene. Therefore, they concluded that neem oil can replace kerosene as an alternative medium for sustainable EDM to reduce the environmental impact of EDM.
In the existing literature, it can be seen that it is inappropriate to use non-renewable mineral oil as the dielectric of EDM. This is because mineral oil is not only non-biodegradable, but also will seriously affect soil and water sources, resulting in great harm to the environment [32]. Moreover, harmful substances generated during the processing of the EDM with mineral oil as the dielectric are non-degradable, which seriously affects the health of the operators and the environment [33]. As a renewable resource, vegetable oil is biodegradable, has a high ignition point, high insulation, and high corrosion resistance, opening up a new direction in the application of biological media. This study investigates the feasibility of using sunflower seed oil (SSO) as the dielectric, and compares the processing performance, such as the material remove rate (MRR), surface roughness (Ra), energy efficiency per volume (EEV) and exhaust emissions characteristics (EEC), in SSO and kerosene dielectric under different currents, pulse duration (Ton), duty ratio and tool electrodes. Following this, we analyzed the machining performance of a tool electrode with W, Cu, Cu30-W70 (Cu-W) and graphite (G) in SSO and kerosene (K), respectively, and analyzed the processing performance of SSO and kerosene under the same processing parameters. Finally, the sustainability and feasibility of SSO as a dielectric are discussed.

2. Experimental Equipment and Materials

2.1. Experimental Equipment

In this investigation, the experimental equipment adopted includes the EDM 350 machine tool, produced by Changfeng CNC Co., Ltd. (Suzhou, China). This machine is mainly used to machine complex the cavities and curved surfaces of various molds and precision parts. The best roughness of the machined surface is less than 0.6 µm, and the minimum electrode loss is less than 0.2%. The maximum strokes in the X, Y, and Z directions are: 300, 200, and 200 mm, respectively. The maximum load of the spindle is 50 kg and the maximum processing efficiency can reach up to 400 mm3/min. The schematic diagram of the experimental equipment is shown in Figure 1. In order to ensure the authenticity and reliability of the experimental data, the PM2.5 air quality measuring instrument used to detect emission indicators in the experiment is the Bosch cube air quality detector, which uses a laser particle sensor with a measurement accuracy of 0.1 µm. The equipment used for detecting the Ra after processing is the portable surface roughness meter (TR200 of China Times Instrument, Beijing, China).

2.2. Workpiece Material and Tool Electrode

This experiment uses SKD11 with a size of 60 mm × 60 mm × 20 mm. Importantly, SKD11 is a high-strength, high-toughness and abrasion-resistant die steel with good machining performance. The chemical composition of SKD11 steel includes C 1.4–1.6%, Si 0.4%, Mn 0.5%, Cr 11–13%, Mo 0.8–1.2% and V 0.3%. The quenching temperature is 1010 °C, and the hardness is 58–60 HRC. It is suitable for hot work, aluminum, magnesium, zinc, various tools, etc. In recent years, with the development of isotropic products, SKD11 has increasingly developed high toughness. It can make the die life longer, the performance more stable, easy to process and reduce heat-treatment deformation [34].
A cylindrical tool electrode with a diameter of 8 mm and a length of 150 mm was used. Tool electrode materials were divided into four types, namely W, Cu, Cu-W (Cu30-W70) and graphite, and the negative electrode was adopted in this study. The melting point and boiling point of W are relatively high, and the electrode wear during processing is small. However, the mechanical properties of W are not good and it is expensive. Although Cu has a relatively low melting point, it has good thermal conductivity, so there is less electrode wear. When used as a tool electrode, Cu has good processing stability, good plastic properties, and can be made into various precise and complex shapes. It is often used as a tool electrode for processing medium and small cavities. Due to its extreme tungsten content, Cu-W has low electrode loss during processing and good mechanical-processing performance. It is widely used for processing steel and cemented carbide molds and for special-shaped holes and grooves. Graphite is a material with a high melting point (greater than 3700 °C). It has excellent thermal-shock resistance, corrosion resistance, good mechanical properties at high temperatures, a low thermal expansion coefficient, low cost, and easy manufacturing. The physical properties of Cu, W, Cu-W and graphite materials are given in Table 1.

2.3. Dielectric

In this experiment, SSO and kerosene are selected as dielectrics. Kerosene is a commonly used dielectric in EDM. It is colorless and odorless and is not prone to drawing. Furthermore, SSO is extracted from sunflower seeds. At present, sunflowers are widely planted in Asia, America and Europe. They provide a rich source of raw materials and can be processed on a large-scale in the industrial field. If SSO is able to replace kerosene as a dielectric for electricity in EDM, it greatly improves the sustainability of EDM. The viscosity and ignition point of SSO are greater than those of kerosene. After leakage, it cannot be spread easily in a short period of time to form a large-scale fire, and it can biodegrade. It is an environmentally friendly dielectric. The physical properties of SSO and kerosene are provided in Table 2.

2.4. Experimental Design

This experiment adopted an orthogonal experimental design, which means investigating the influence of processing parameters through a small number of experiments and obtaining the characteristics of high efficiency, uniformity, and reliability [35]. In the process of EDM, the influence of parameters on machining performance is significant [36]. The five factors selected in this experiment are dielectric (D), current (I), pulse duration (Ton), duty ratio and tool electrodes (TE). Using the Taguchi method, the orthogonal experimental function of Minitab, a L32 (21 × 44) mixed orthogonal experiment with one factor under 2 levels and four factors under 4 levels was designed, which is given in Table 3.
The processing method used was the soaking method. That is, an appropriate amount of dielectric was added to the container and immersed in the workpiece in the dielectric. In order to guarantee the accuracy of the experimental results, the dielectric was replaced every time it was processed. We put the used dielectrics into a closed container to facilitate subsequent observations of the metal debris in the dielectric. In order to decrease the interference of air flow on the detection of emission indicators, white paper towels were used to cover the EDM box in each experiment. In each experiment, the time t1 required for the processing depth h of 0.2 mm and the time t2 for the air quality detector to reach the maximum value were recorded.
Indicators for evaluating the machining performance are MRR, Ra, EEV and EEC. Among them, Ra can be directly measured using the instrument. In order to guarantee the accuracy of the data, each processed surface was measured six times and the average value was obtained. MRR can be calculated by Equation (1):
MRR = V t 1 = π h d 2 4 t 1 ( mm 3 / min )
where V is the volume of material removed when the processing depth h is 0.2 mm, t1 is the time used for the processing depth of 0.2 mm in mind, and d is the diameter of the electrode rod. The calculation of EEV is shown in Equation (2):
EEV = P ( kJ / min ) MRR ( mm 3 / min ) = U I η 60 1 1000 π h d 2 4 t 1 = 6 U I η t 1 25 π h d 2 ( kJ / mm 3 )  
where P is the processing power (kJ/min), U is the voltage during processing, I is the current during processing (A), η is the efficiency of processing, t1 is the time taken for the machining depth of 0.2 mm, h is the machining depth of 0.2 mm, and d is the diameter of the electrode rod. EEC can be expressed by Equation (3):
Q = m t = 999 ( µ g m 3 ) × 0.16 ( m 3 ) t 2 ( min ) = 159.84 t 2 ( µ g min )
where m is the mass of the emitted particulate matter and t2 is the time t2 from the start of processing to the explosion of the air quality detector.

3. Experimental Results and Analysis

3.1. Influence of Processing Parameters on Machining Performance

In this experiment, the diameter of the tool electrode was 8 mm, and the dielectrics used were sunflower oil and kerosene. The experimental parameters are current, duty ratio, pulse duration and electrode, and the processing performance of EDM in different dielectrics was observed. The evaluation indicators of processing performance are MRR, Ra, EEV and EEC, and the experimental results for machine SKD11 are shown in Table 4.

3.1.1. MRR

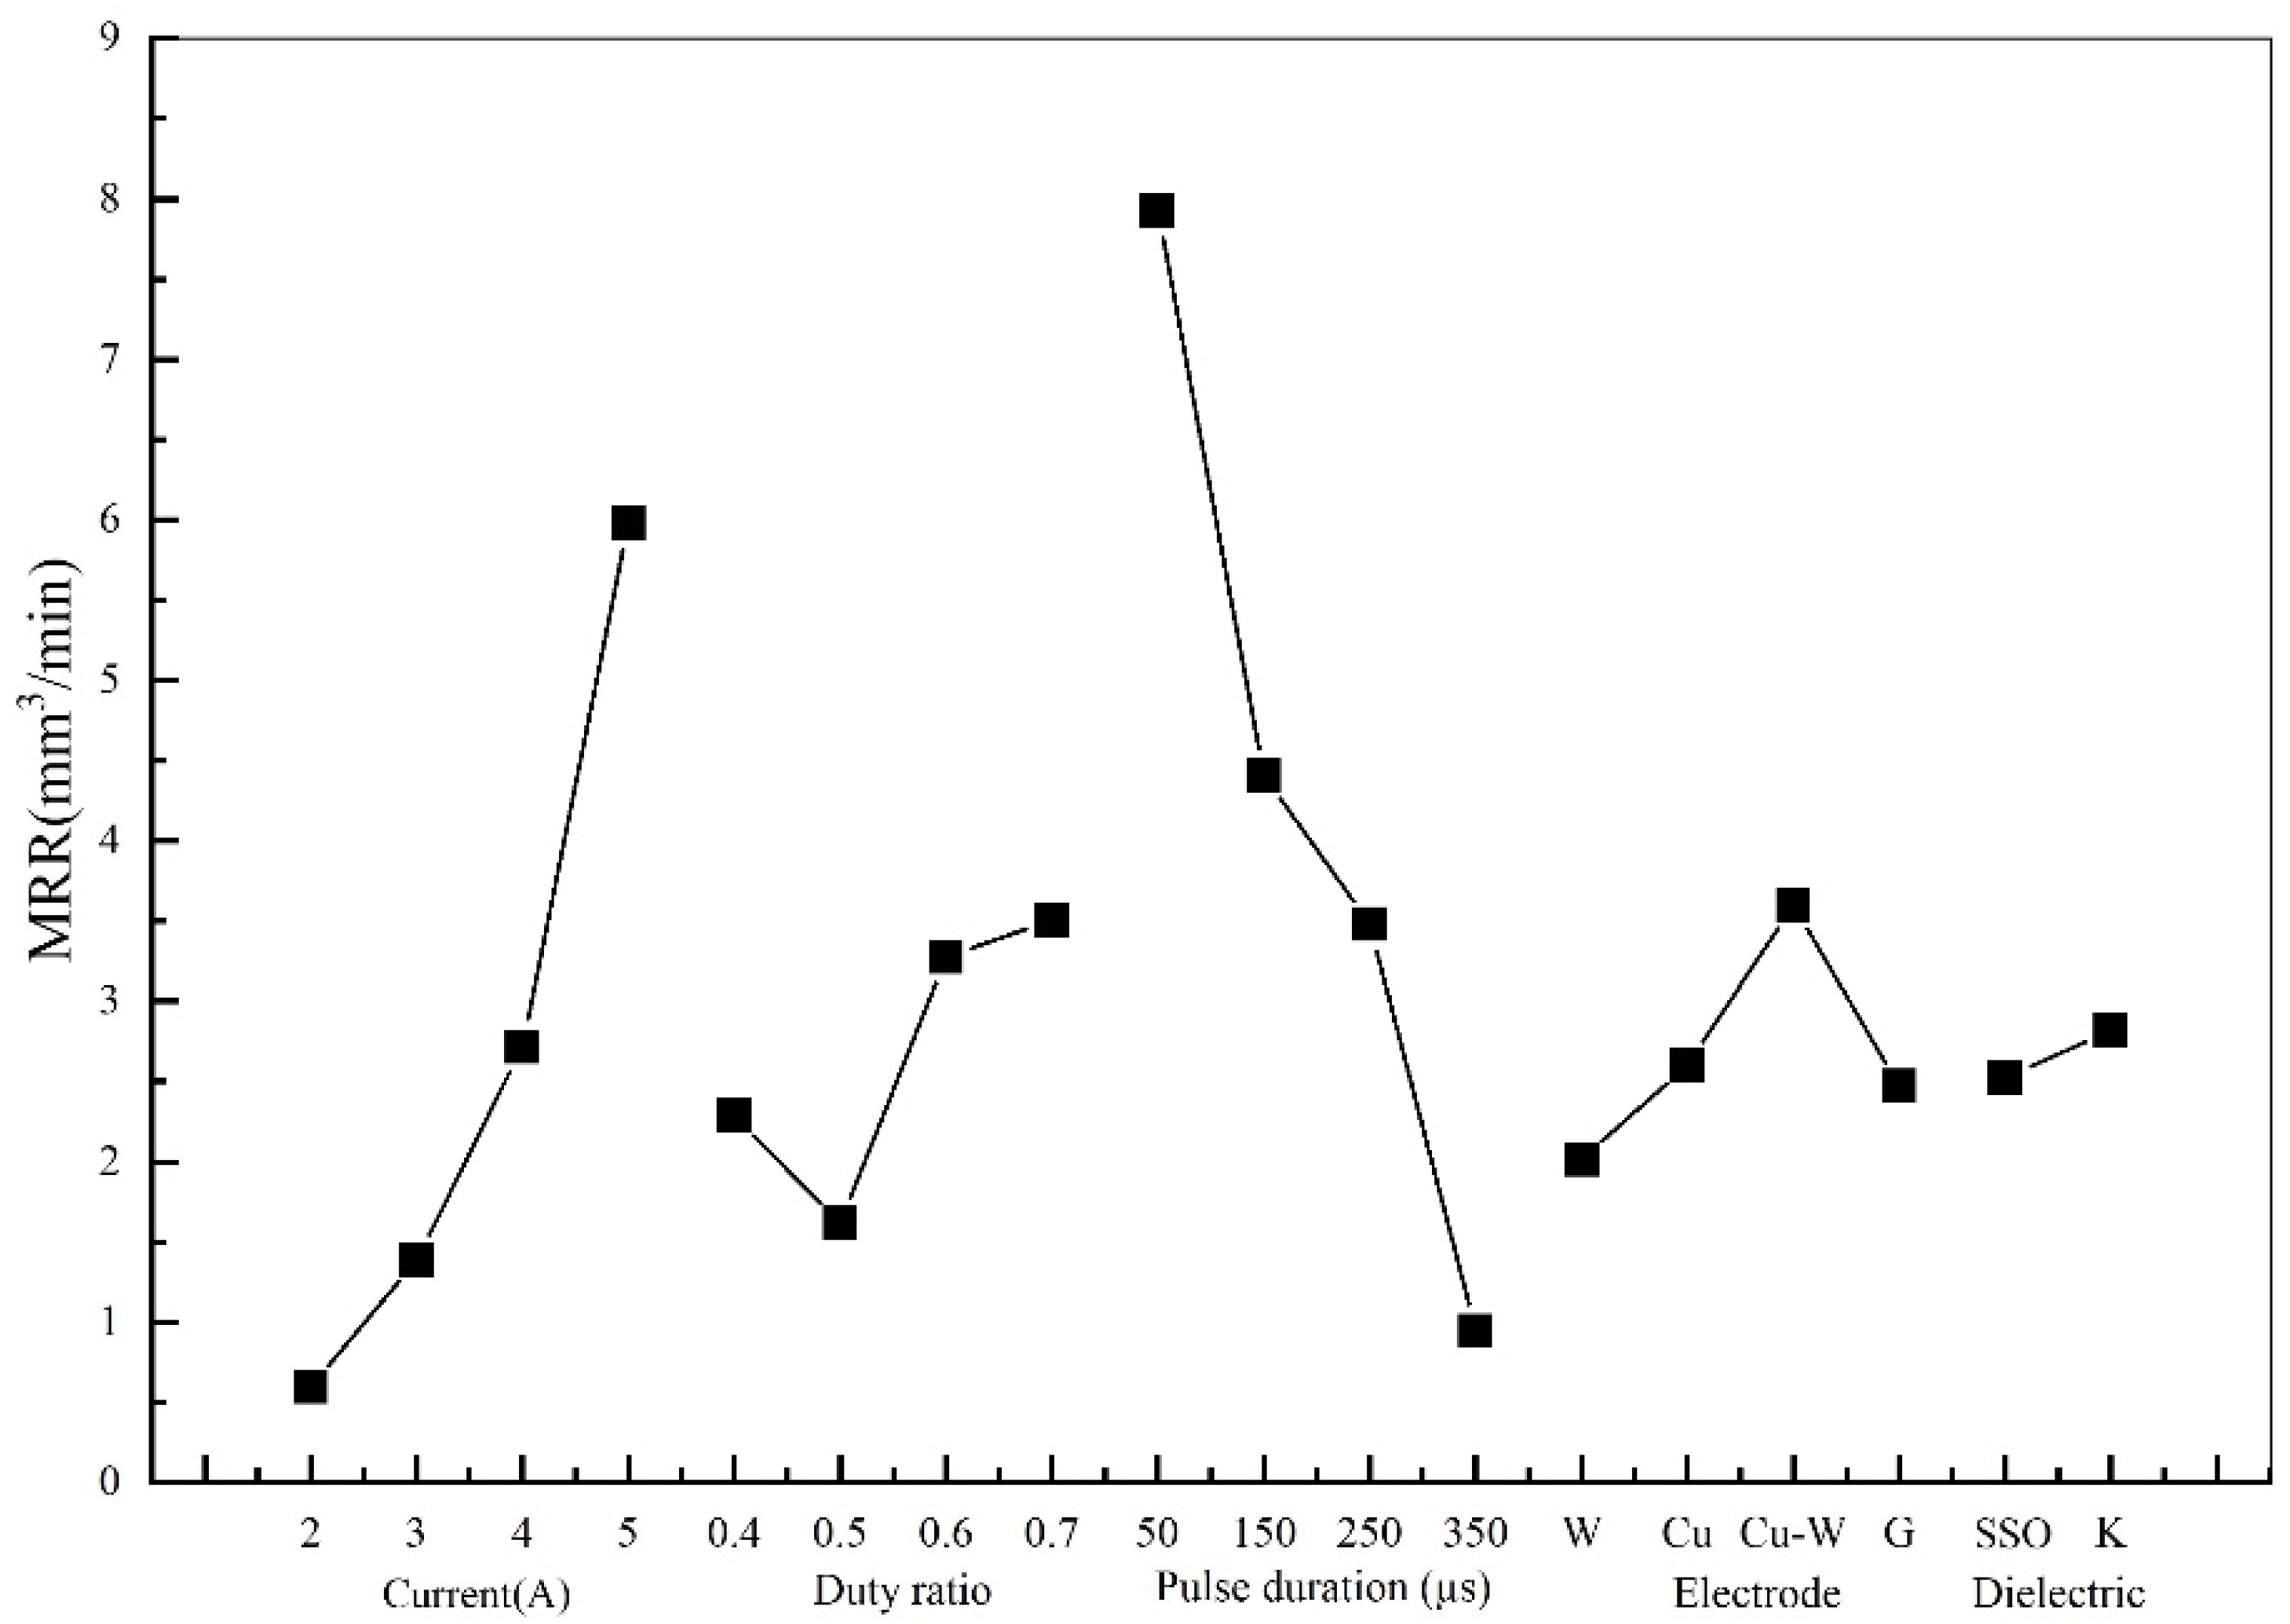
MRR is the volume of material removed per unit of time. A higher MRR represents a higher production efficiency. Therefore, MRR is an extremely important technical indicator in the process of product manufacturing. Figure 2 demonstrates that the influence of current, duty ratio, pulse duration, electrode and dielectric on MRR, increases with the increase in the current. When the current increases from 2 A to 5 A, the MRR increases from 0.5958 mm3/min to 5.9816 mm3/min, which is an increase of nearly 10 times. When the duty ratio increases from 0.4 to 0.7, the MRR first decreases and then increases. As the duty ratio is set to 0.5, the MRR attains the minimum value of 1.6156 mm3/min and the MRR reaches its maximum value of 3.5056 mm3/min. The MRR decreases as the pulse duration increases when the duty ratio is 0.7. When the pulse duration increases from 50 µs to 350 µs, the MRR reduces from 3.6669 mm3/min to 1.5788 mm3/min. Using Cu-W alloy as the electrode, it can obtain a maximum MRR value of 3.5986 mm3/min, which is 78.7%, 38.3% and 45.7% higher than that of W, Cu and graphite electrodes, respectively. The MRR of SSO is 2.5221 mm3/min, and the MRR of kerosene is 2.8198 mm3/min. The MRR of kerosene is about 13% larger than that of SSO.
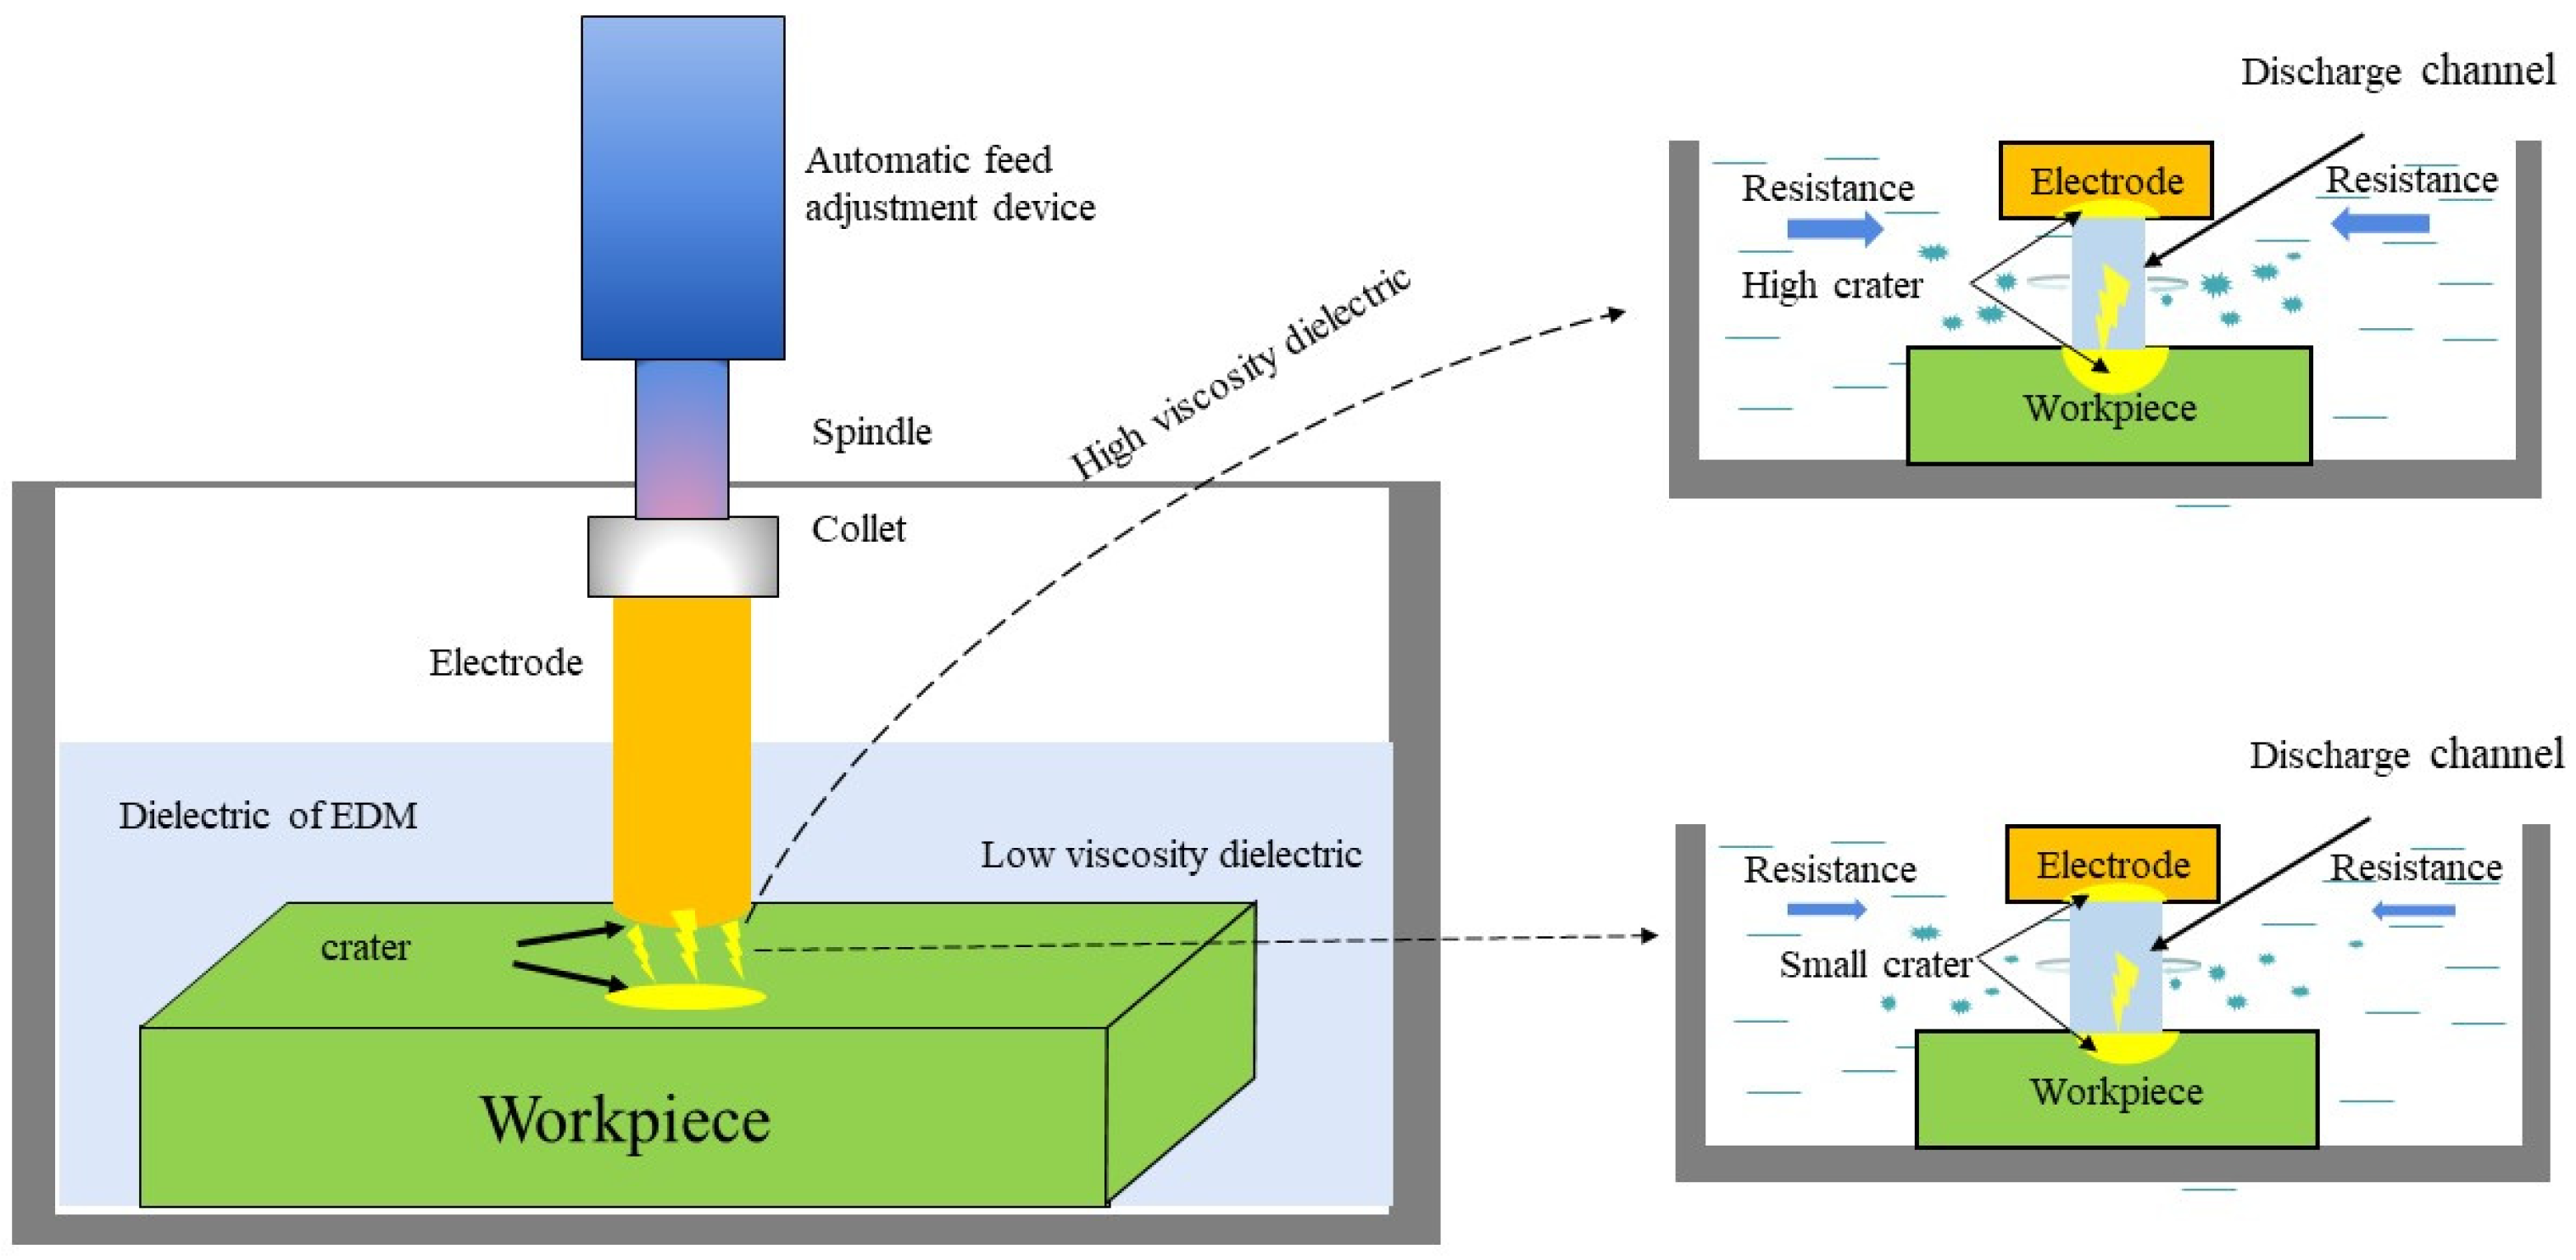
The experimental results show that the MRR increases with an increase in the current. This happens because when the current increases, the energy released by the increase on the pulse discharge, and the instantaneous heat generated melts or even vaporizes the material on the Ra. The rapid gasification and expansion of the dielectric in the discharge channel have an impact on the molten material on the surface of the workpiece, which accelerates the erosion rate of the surface material. When the duty ratio is greater than 0.5, as the duty ratio increases, the pulse discharge time in a single discharge cycle increases, causing the pulse discharge to generate greater heat for the erosion of the molten material on the surface of the workpiece, which improves the MRR. As the pulse duration increases, the number of pulse discharges per unit time decreases, resulting in a decrease in the heat generated by a pulse discharge per unit time, which reduces the erosion rate of the workpiece material and leads to a decrease in MRR. Compared with kerosene, the viscosity and density of SSO are larger, which is conducive to compressing the discharge channel. As shown in Figure 3, this leads to the discharge producing a stronger impact force, and strengthens the throwing effect of the erosion products from the gap. However, a dielectric with a high viscosity hinders the ejection of fragments, affects the normal discharge, and reduces the stability of the spark discharge.

3.1.2. Ra

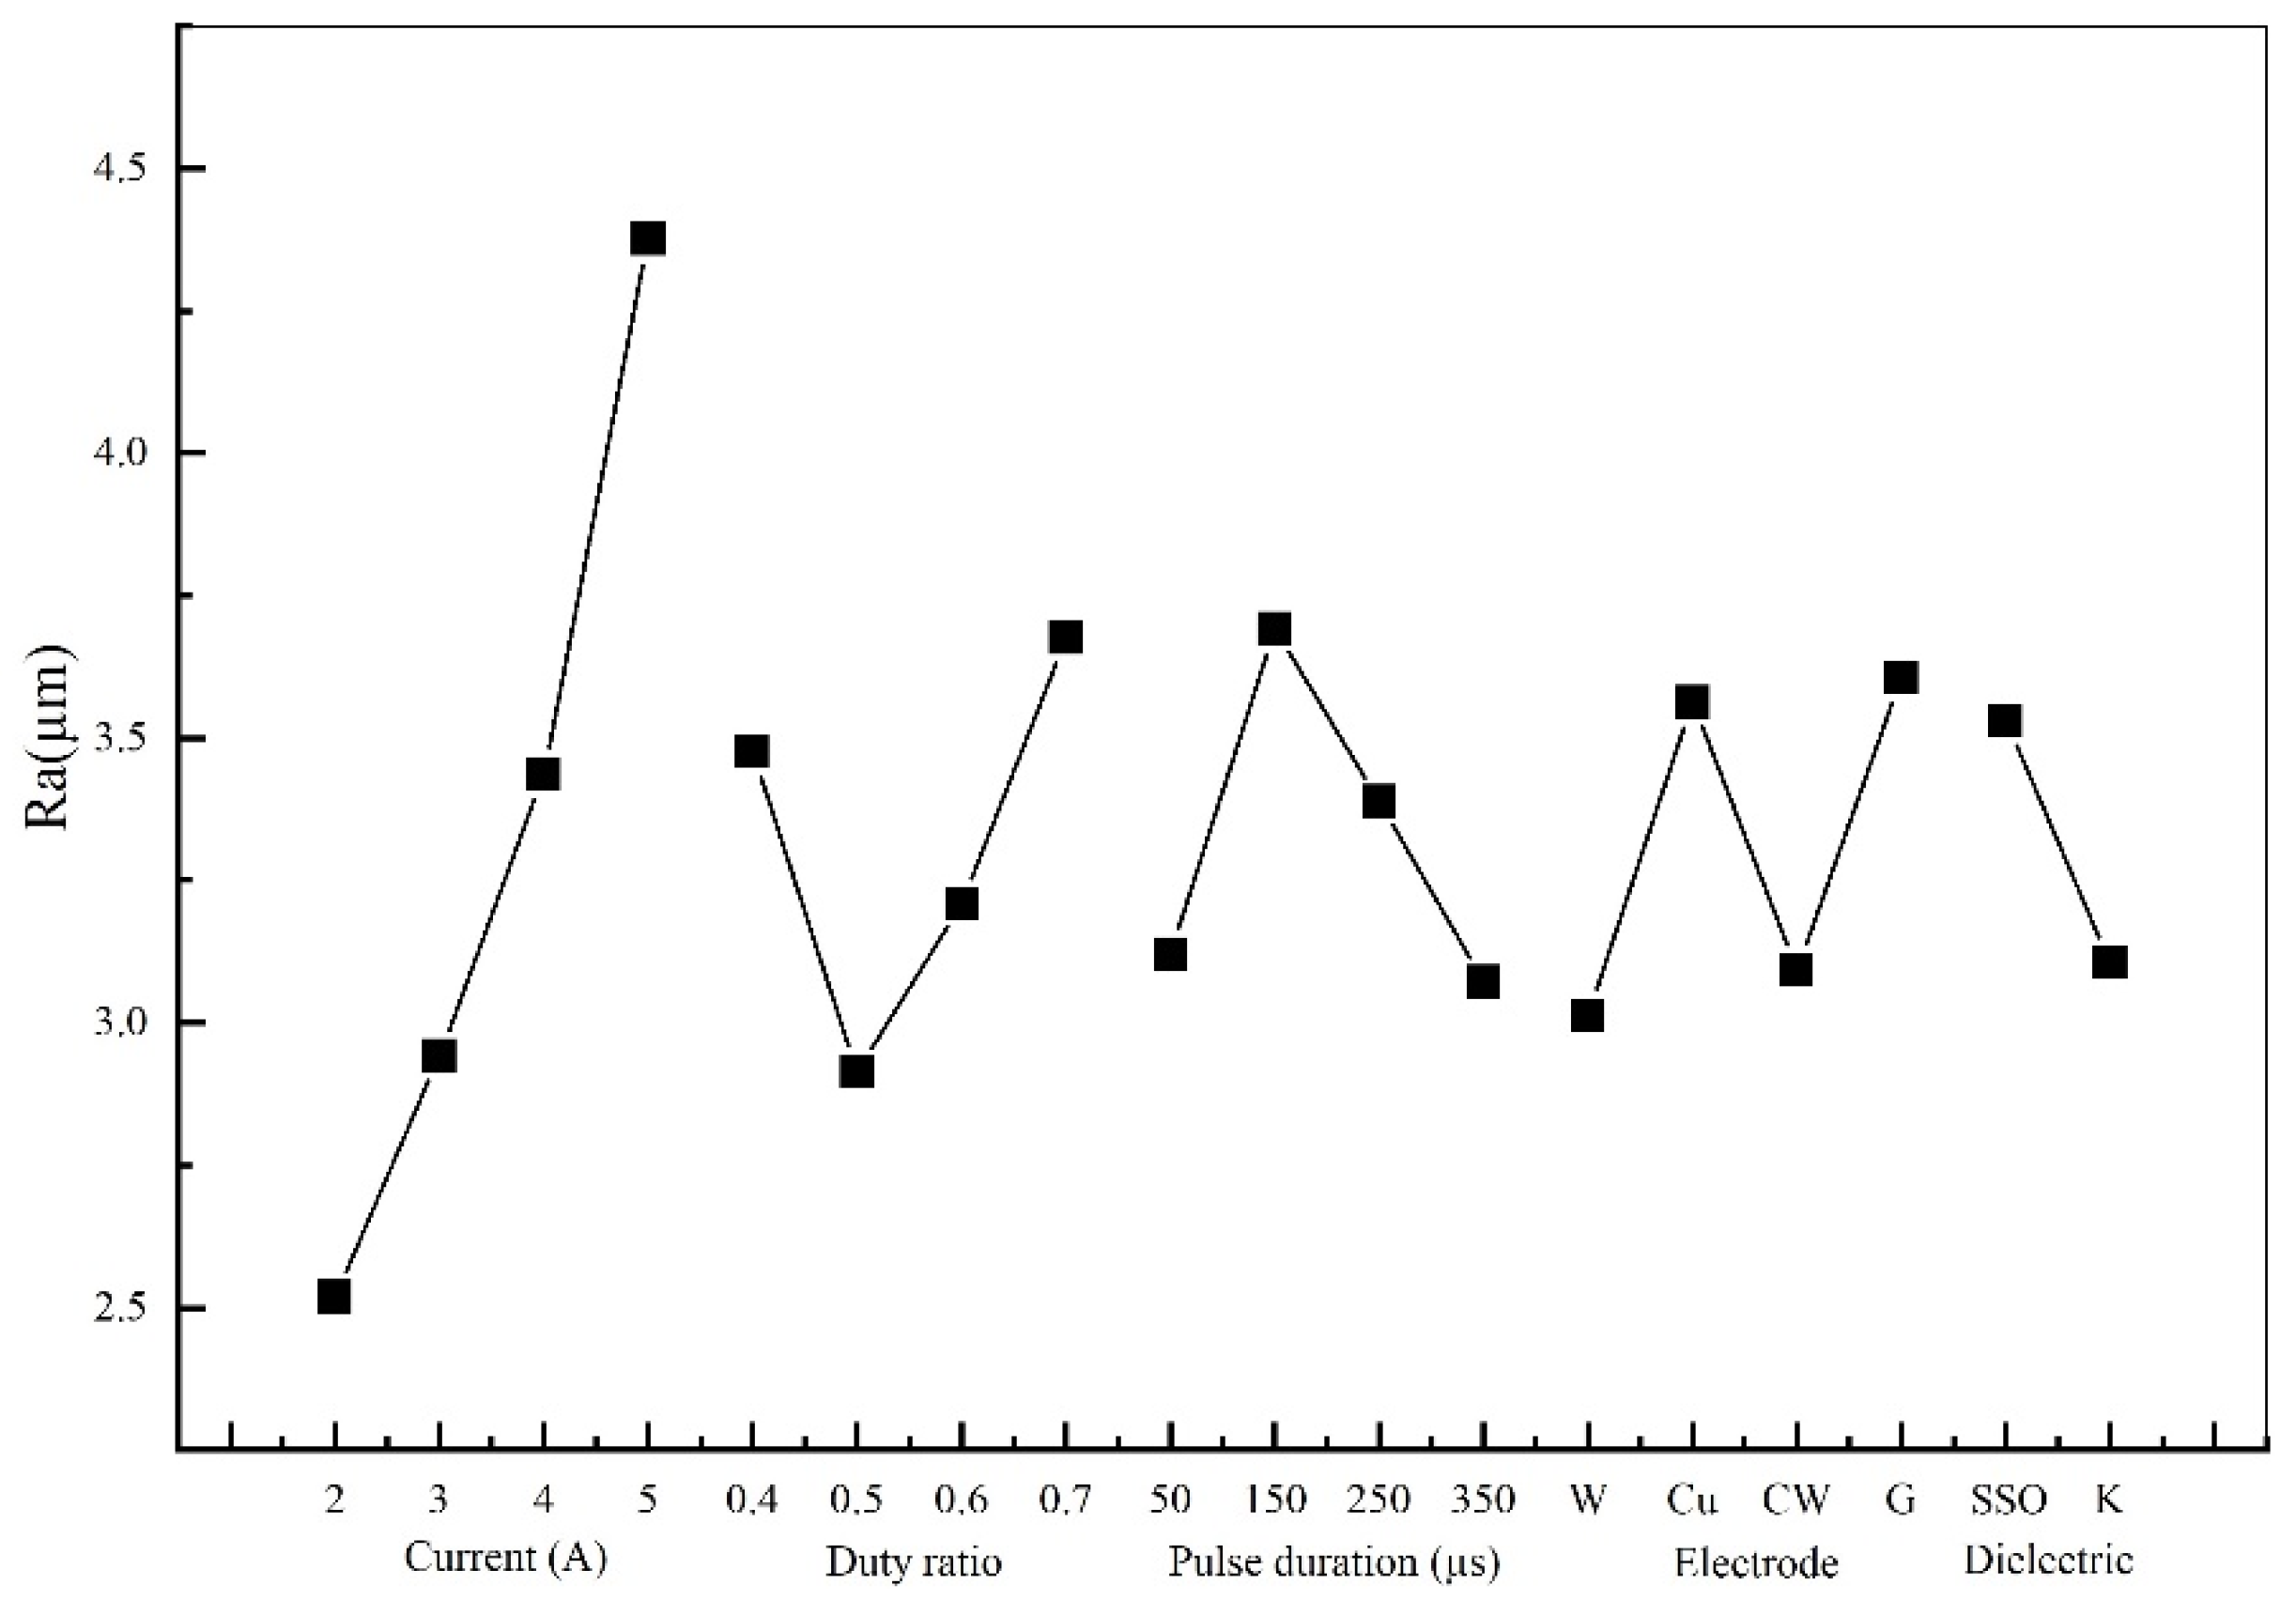
Ra is the small pitch and the unevenness of the microscopic valleys on the surface of the workpiece. The larger the Ra, the rougher the surface of the workpiece, and the greater the friction of the workpiece when in contact. Therefore, a lower Ra is beneficial to the performance of the workpiece. Figure 4 shows the effects of current, duty ratio, pulse duration, electrode and dielectric on Ra. It demonstrates that Ra increases with the current. When the current increases from 2 A to 5 A, Ra increases from 2.519 μm to 4.377 μm, with an increase of about 73.76%. Ra shows a trend of first decreasing and then increasing as the proportion of the duty ratio increases. When the duty ratio is 0.4, Ra is 3.477 µm. Ra reaches the minimum value of 2.914 µm when the duty ratio is 0.5. When the duty ratio continues to rise, Ra also increases. Ra reaches 3.676 µm when the duty ratio increased to 0.7. When the pulse duration increases from 50 µs to 350 µs, Ra shows a tendency of rising first and then falling. When the pulse duration is 50 µs, Ra is 3.121 µm and when the pulse duration is 100 µs, Ra reaches a maximum value of 3.692 µm. When the pulse duration continues to increase, Ra gradually decreases. When the pulse duration is 350 µs, Ra reaches the minimum value of 3.073 µm. The Ra of the W electrode is the smallest at 3.013 µm, the Ra of the Cu-W electrode and the Cu copper electrode are close to 3.093 µm, and the Ra of the Cu and graphite electrodes are close to 3.564 µm and 3.606 µm, respectively. The Ra of SSO and kerosene are 3.531 µm and 3.107 µm, respectively, and SSO is about 12% higher than kerosene.
At low currents, processing generates a small amount of heat, of which a large part takes up the surrounding environment, so the available heat energy is not high. However, as the current increases, the instantaneous heat energy generated increases, and the impact of the discharge on the surface of the workpiece is stronger, so that more molten material is ejected out of the crater, resulting in an increase in Ra. From the experimental data, it can be seen that when the duty ratio is 0.5 and the pulse duration is the same, a larger duty ratio will cause the discharge time to become prolonged, resulting in more heat released and the erosion of a single pulse discharge. In addition to the increase in the current, resulting in an increase in Ra, Ra is the largest when the pulse duration is 150 µs. The longer the pulse duration, the longer the pulse interval and the longer the cooling time after pulse discharge. The dielectric cools the molten material and avoids the erosion of the surface material of the workpiece, and the surface of the workpiece produces a smaller amount of craters that cause Ra to decrease. The Ra processed by a tool electrode with a high melting point is better than a tool electrode with a low melting point, so the Ra processed by a W electrode with a high melting point is smaller, and the Ra processed by a Cu electrode with a low melting point is larger. The surface roughness of the workpiece is also associated with the surface roughness of the electrode. The surface of the graphite electrode is not smooth due to the carbon deposit in the processing process, which will cause the surface Ra of the workpiece processed by the graphite electrode to become larger.

3.1.3. EEV

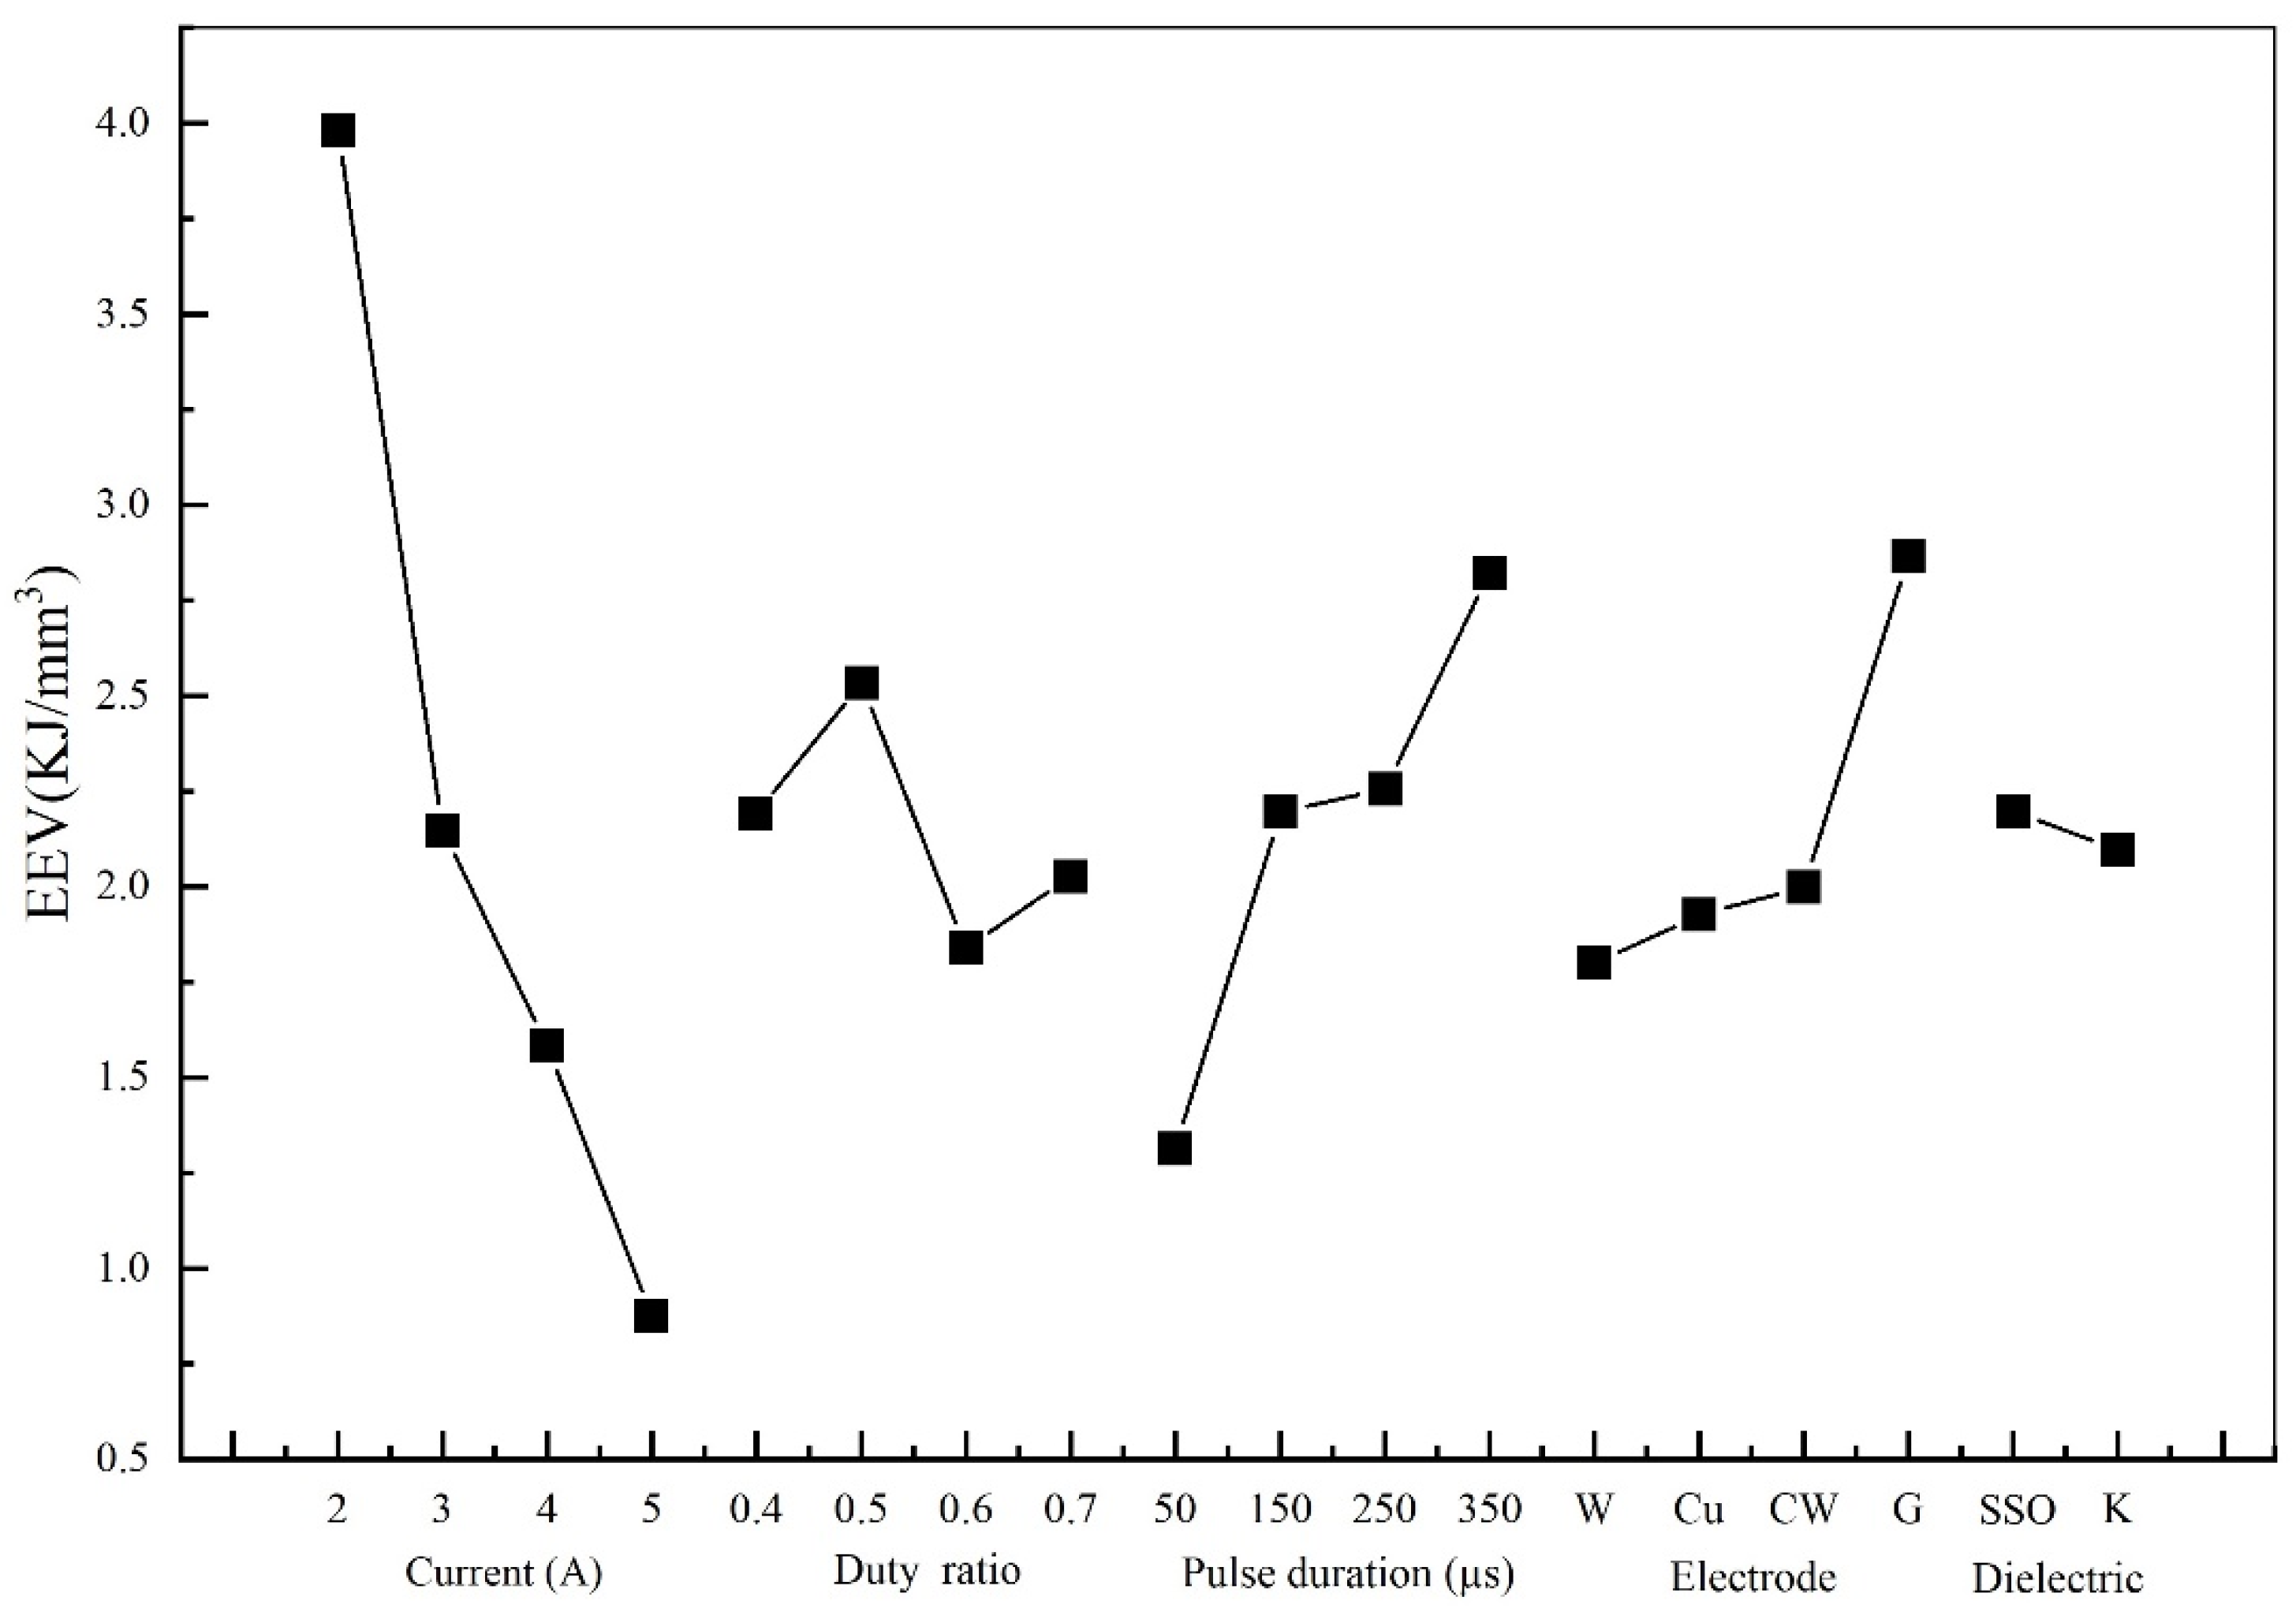
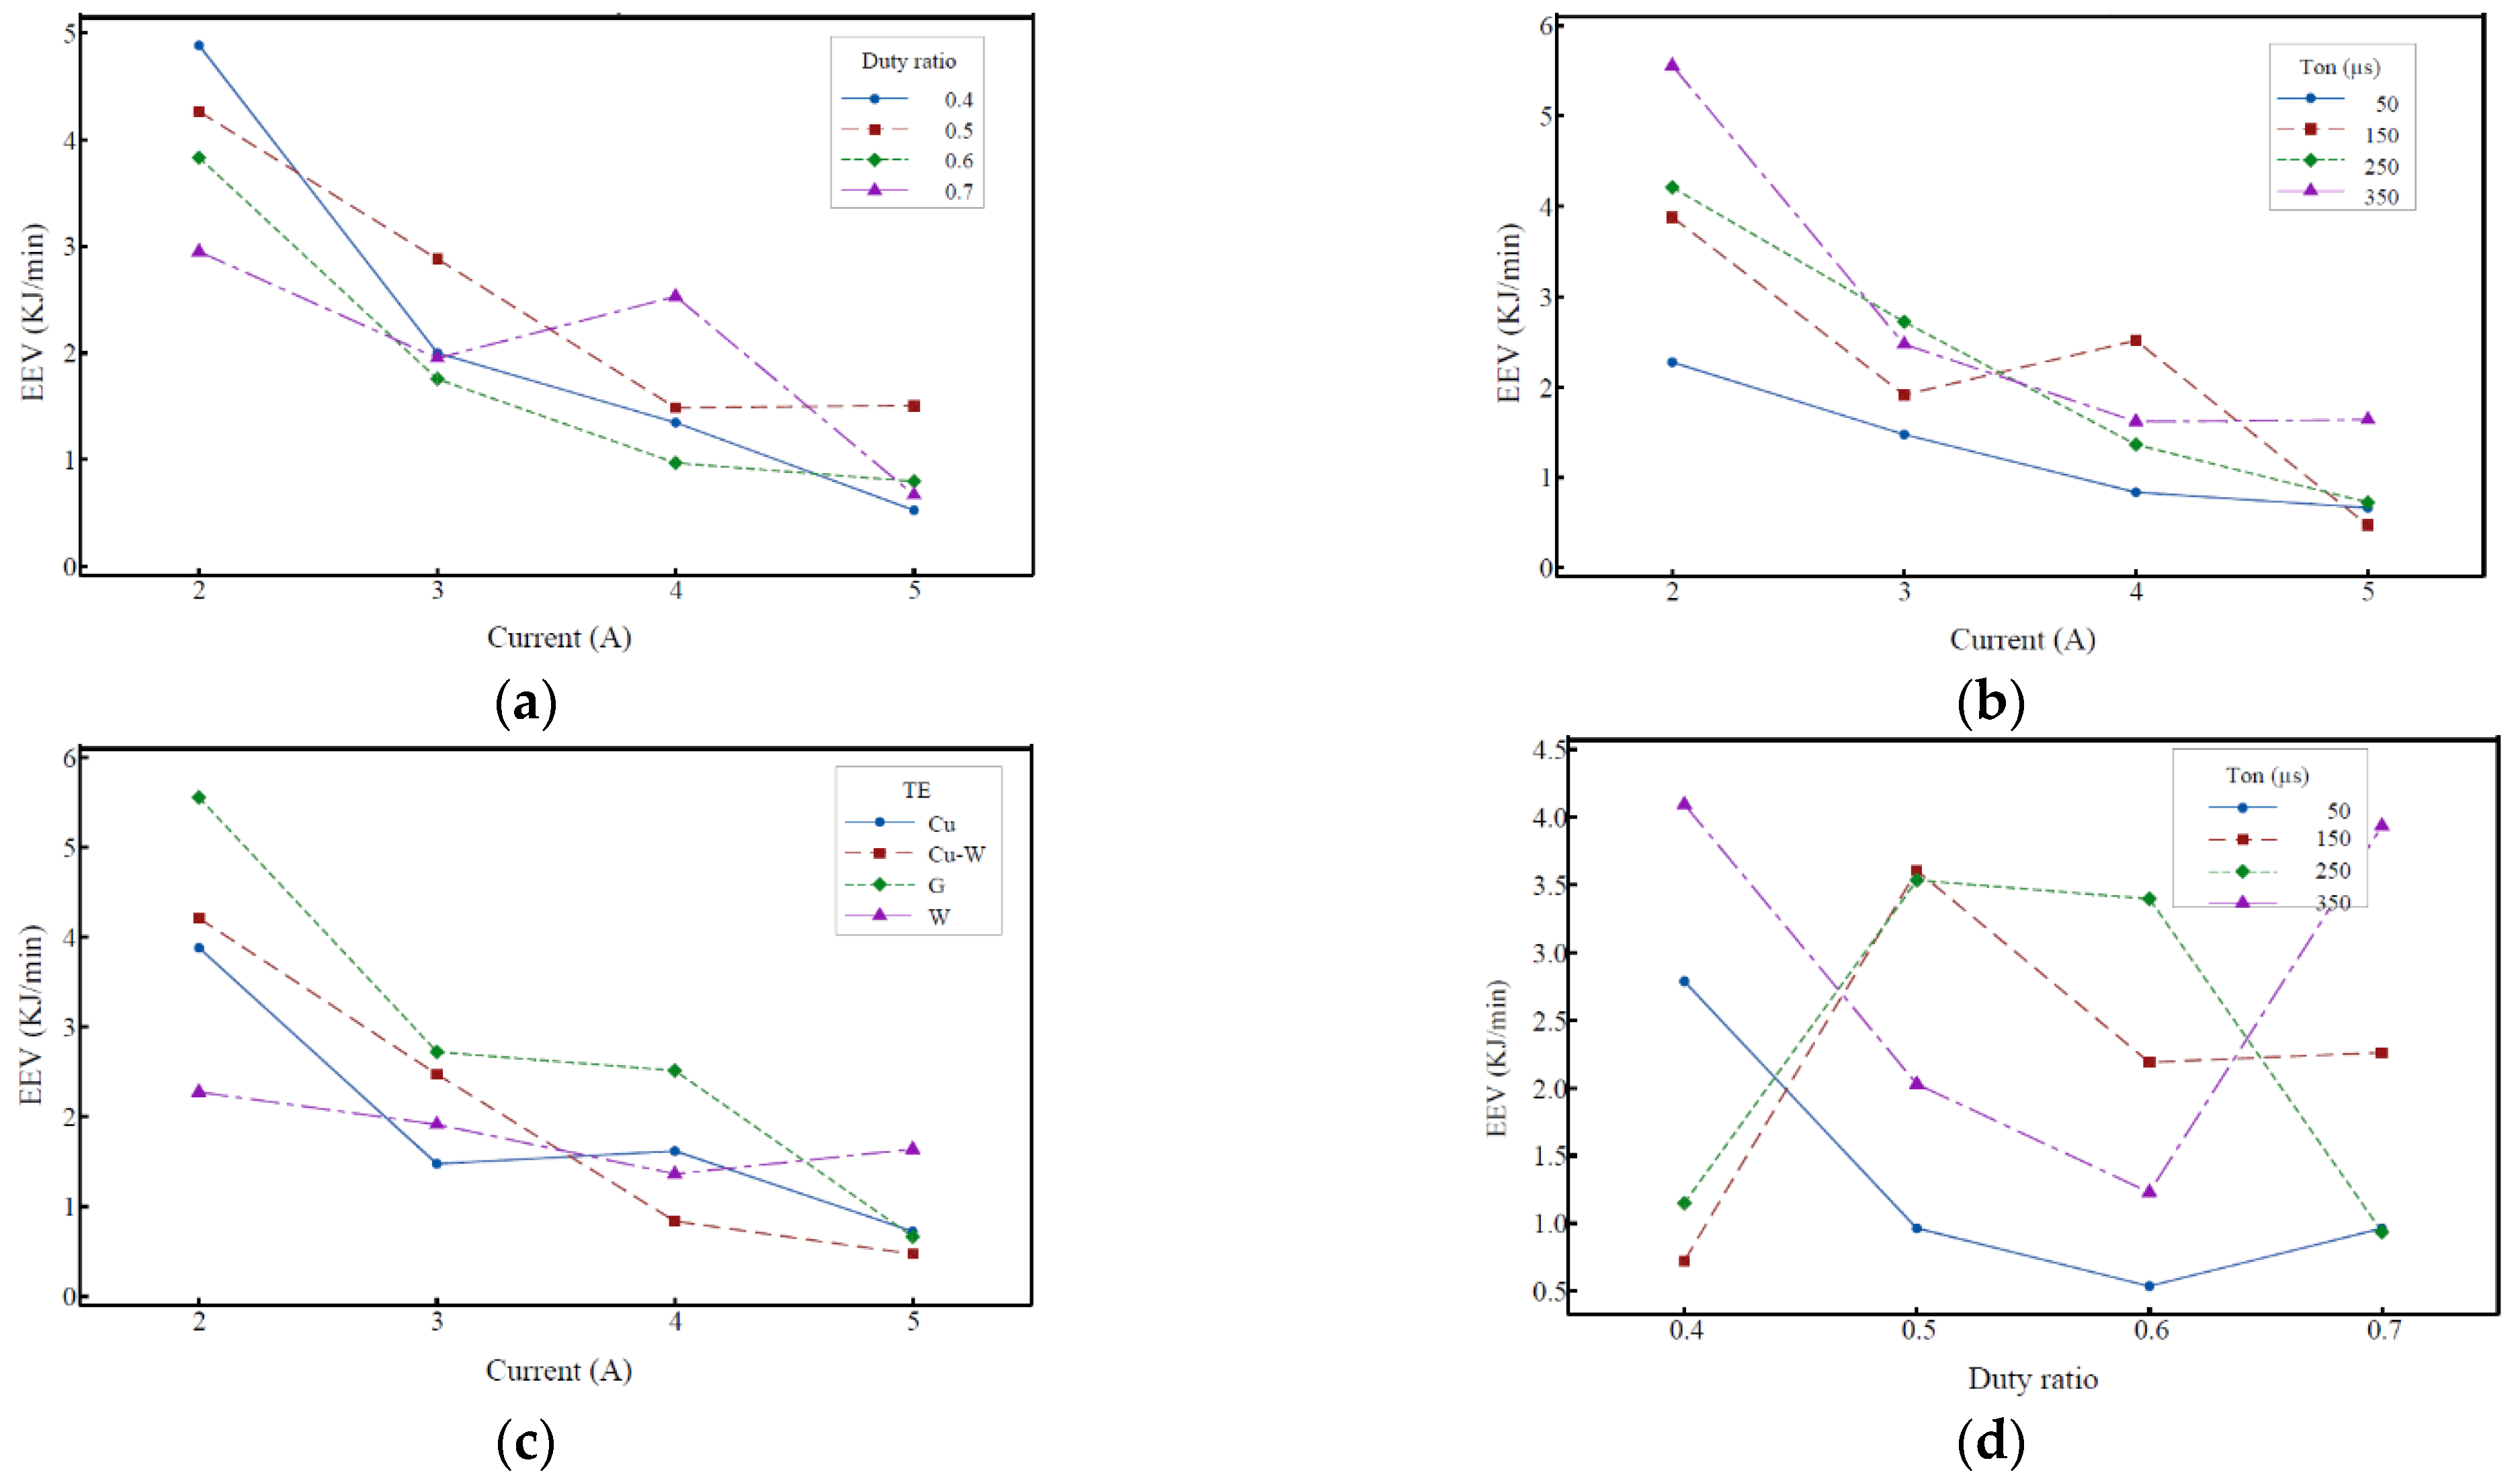
EEV refers to the energy consumed by EDM to remove the unit volume of material. The lower the energy consumption, the lower the EEV, which is more in line with the concept of green manufacturing. Figure 5 showed the effect of current, duty ratio, pulse duration, electrode and dielectric on EEV. The EEV decreases as the current increases. When the current increases from 2 A to 5 A, the EEV decreases from 3.9816 kJ/mm3 to 0.8758 kJ/mm3. The latter is about 26% of the former, which significantly reduces the EEV. When the duty ratio is 0.6, the EEV reaches a minimum value of 1.8392 kJ/mm3, which shows that in the EDM process, the duty ratio is too large or too small will make the EEV too large and reduce the electrical spark processing performance. EEV increases with the increase in the pulse duration. When the pulse duration increases from 50 µs to 350 µs, the EEV increases from 1.314 kJ/mm3 to 2.823 kJ/mm3, which is about 2.15 times the former. The EEV of the Cu electrode is the smallest at 1.7991 kJ/mm3, and the EEV of the graphite electrode is the largest at 2.8654 kJ/mm3, which is about 1.59 times the former. The EEV of SSO and kerosene are similar. The EEV of the former is 2.1986 kJ/mm3, which is about 4.6% higher than the latter.
The process of pulse discharge generates a high temperature in the machining area. When the current is low, one portion of the temperature will act on the workpiece surface to melt or vaporize the material, and another portion of the heat will fall on the dielectric. With the increase in the current, more heat is generated by the pulse discharge, the greater the impact on the Ra during discharge, and the molten material on the Ra is instantly eroded away. Most of the heat is utilized to erode the material on the surface of the workpiece. Therefore, EEV decreases as the current increases. When the pulse duration is consistent, the longer the pulse duration, the longer the pulse interval. An excessive pulse interval will dissipate the heat generated by the pulse discharge into the medium and cause energy loss, so the EEV increases with an increase in the pulse duration. Although the EEV of SSO is about 4.6% higher than that of kerosene, it can be observed in the experimental data that SSO and kerosene have similar processing properties in EEV. The experimental results in Table 4 show that the EEV in SSO reaches a minimum value of 0.3879 kJ/mm3, which is about 25% lower than the minimum value in kerosene. This shows that SSO will outperform the processability of kerosene under suitable parameters.

3.1.4. EEC

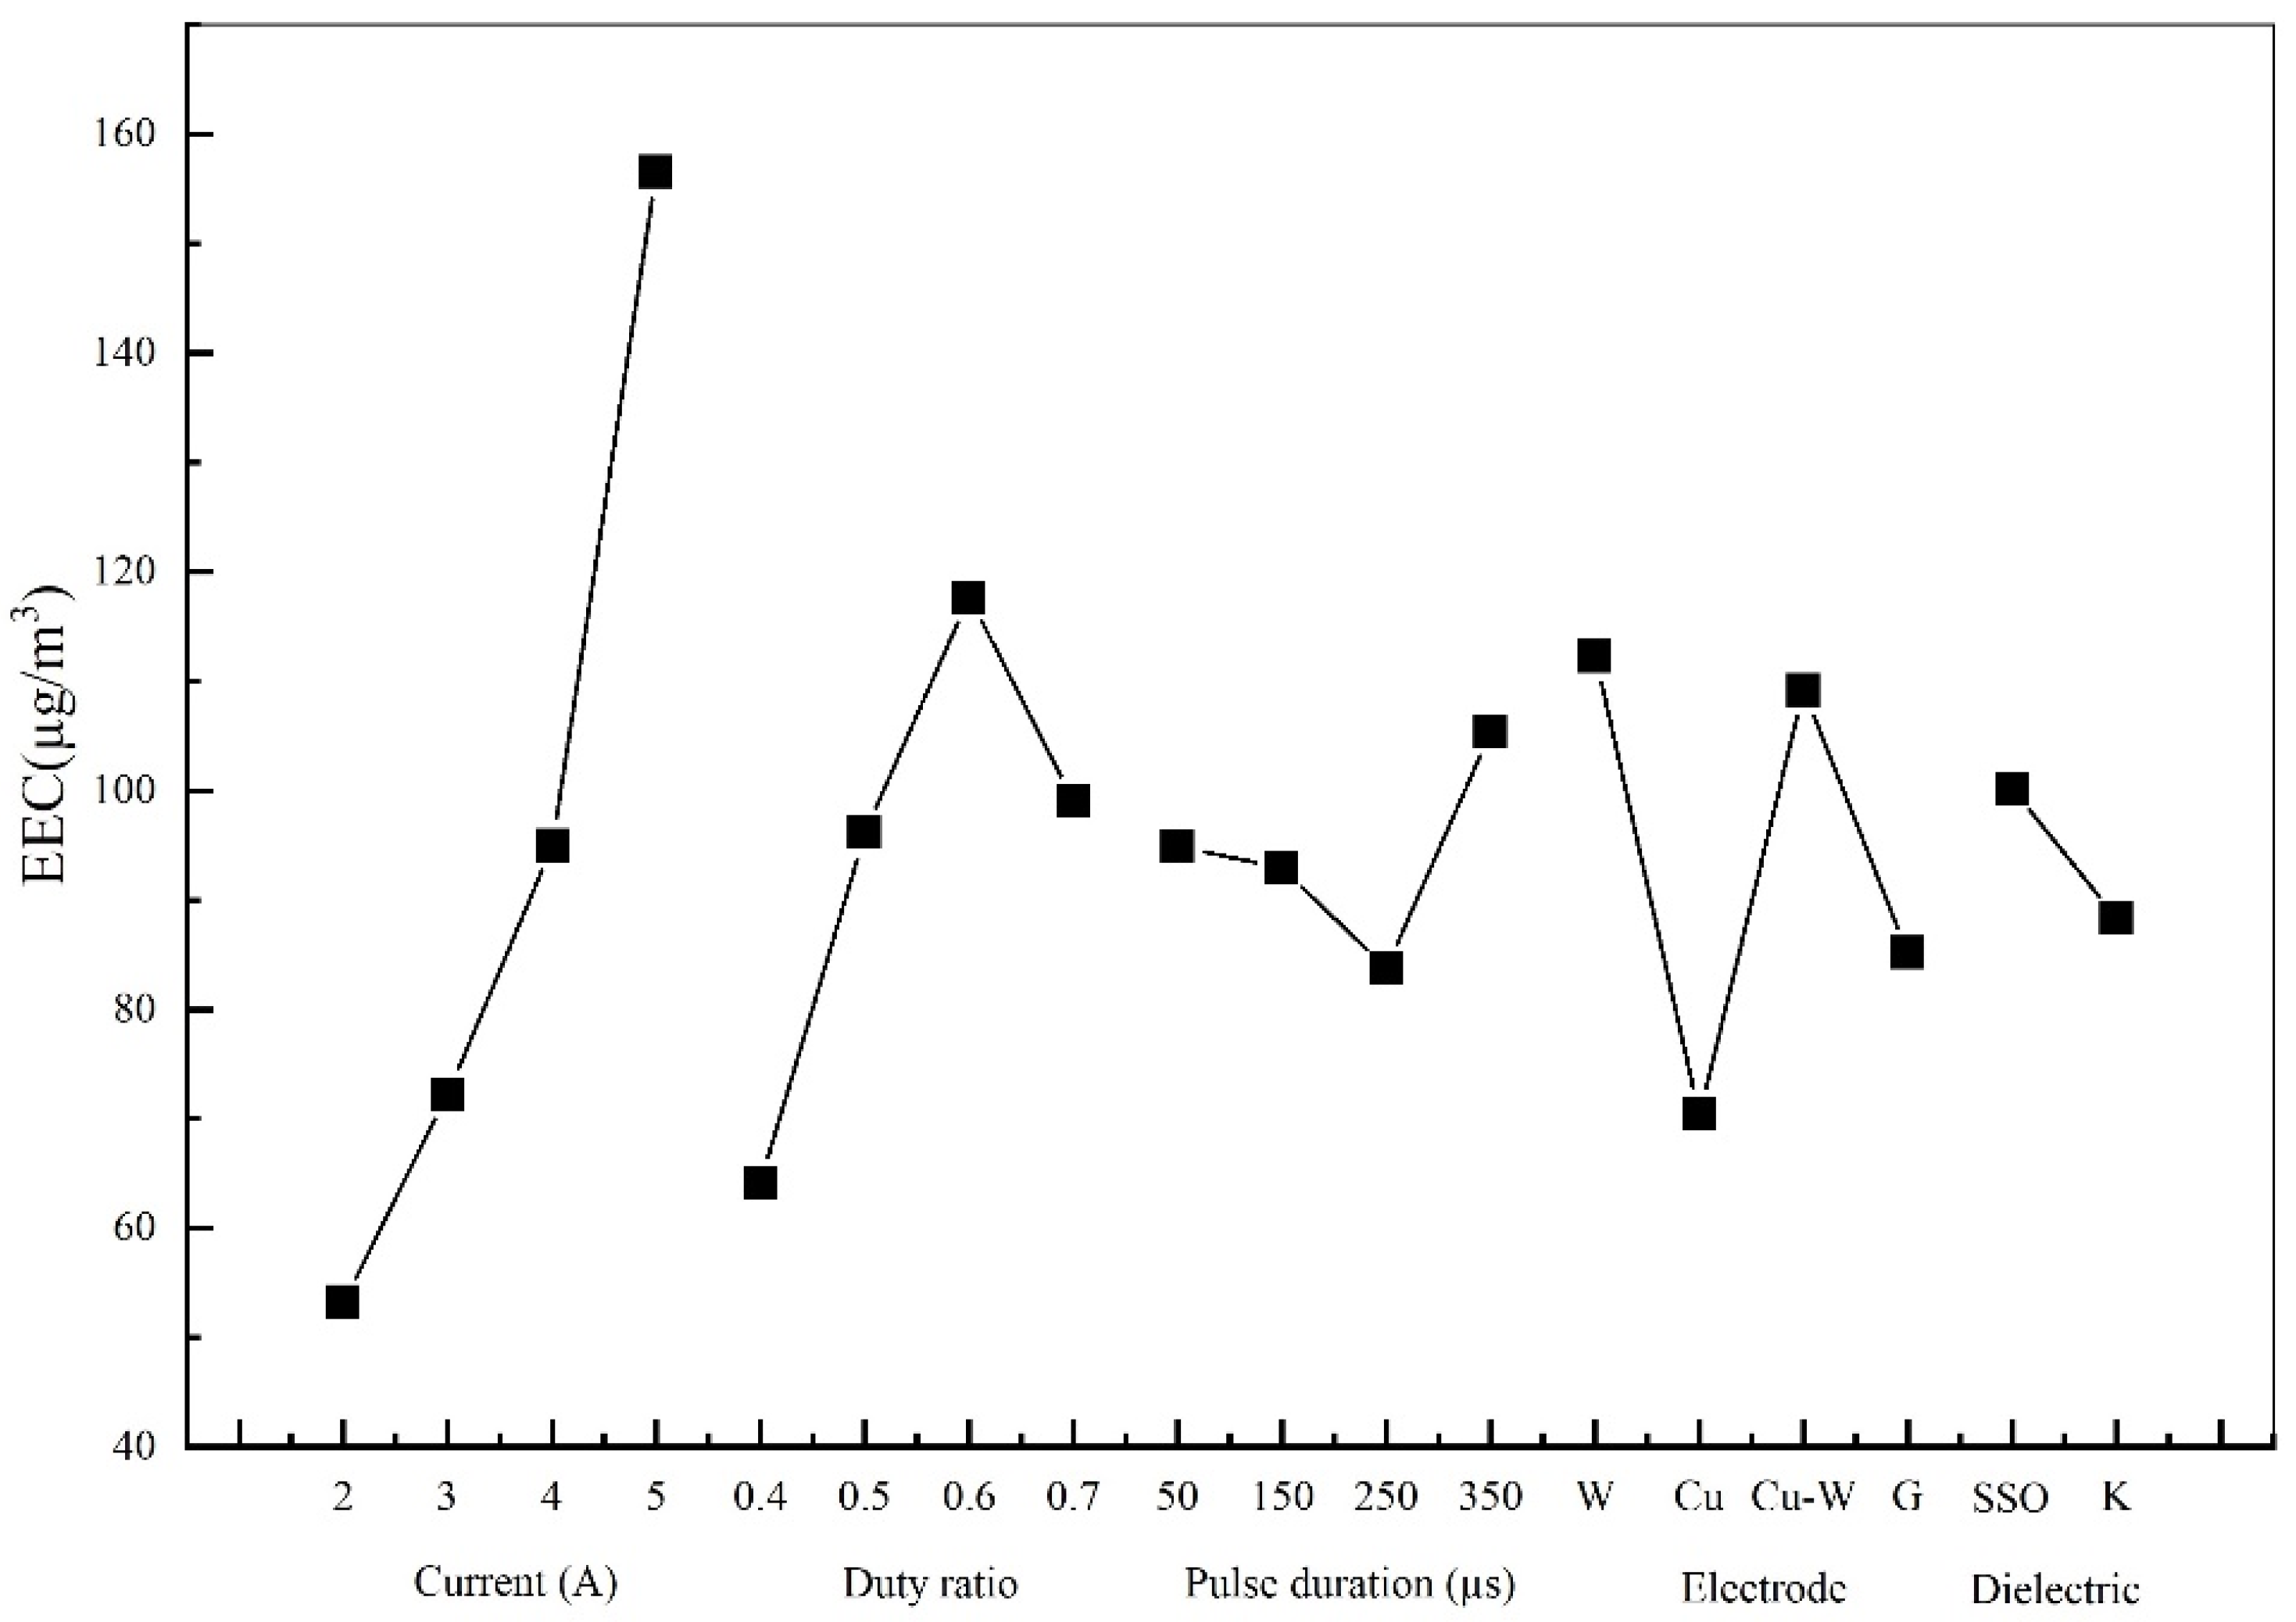
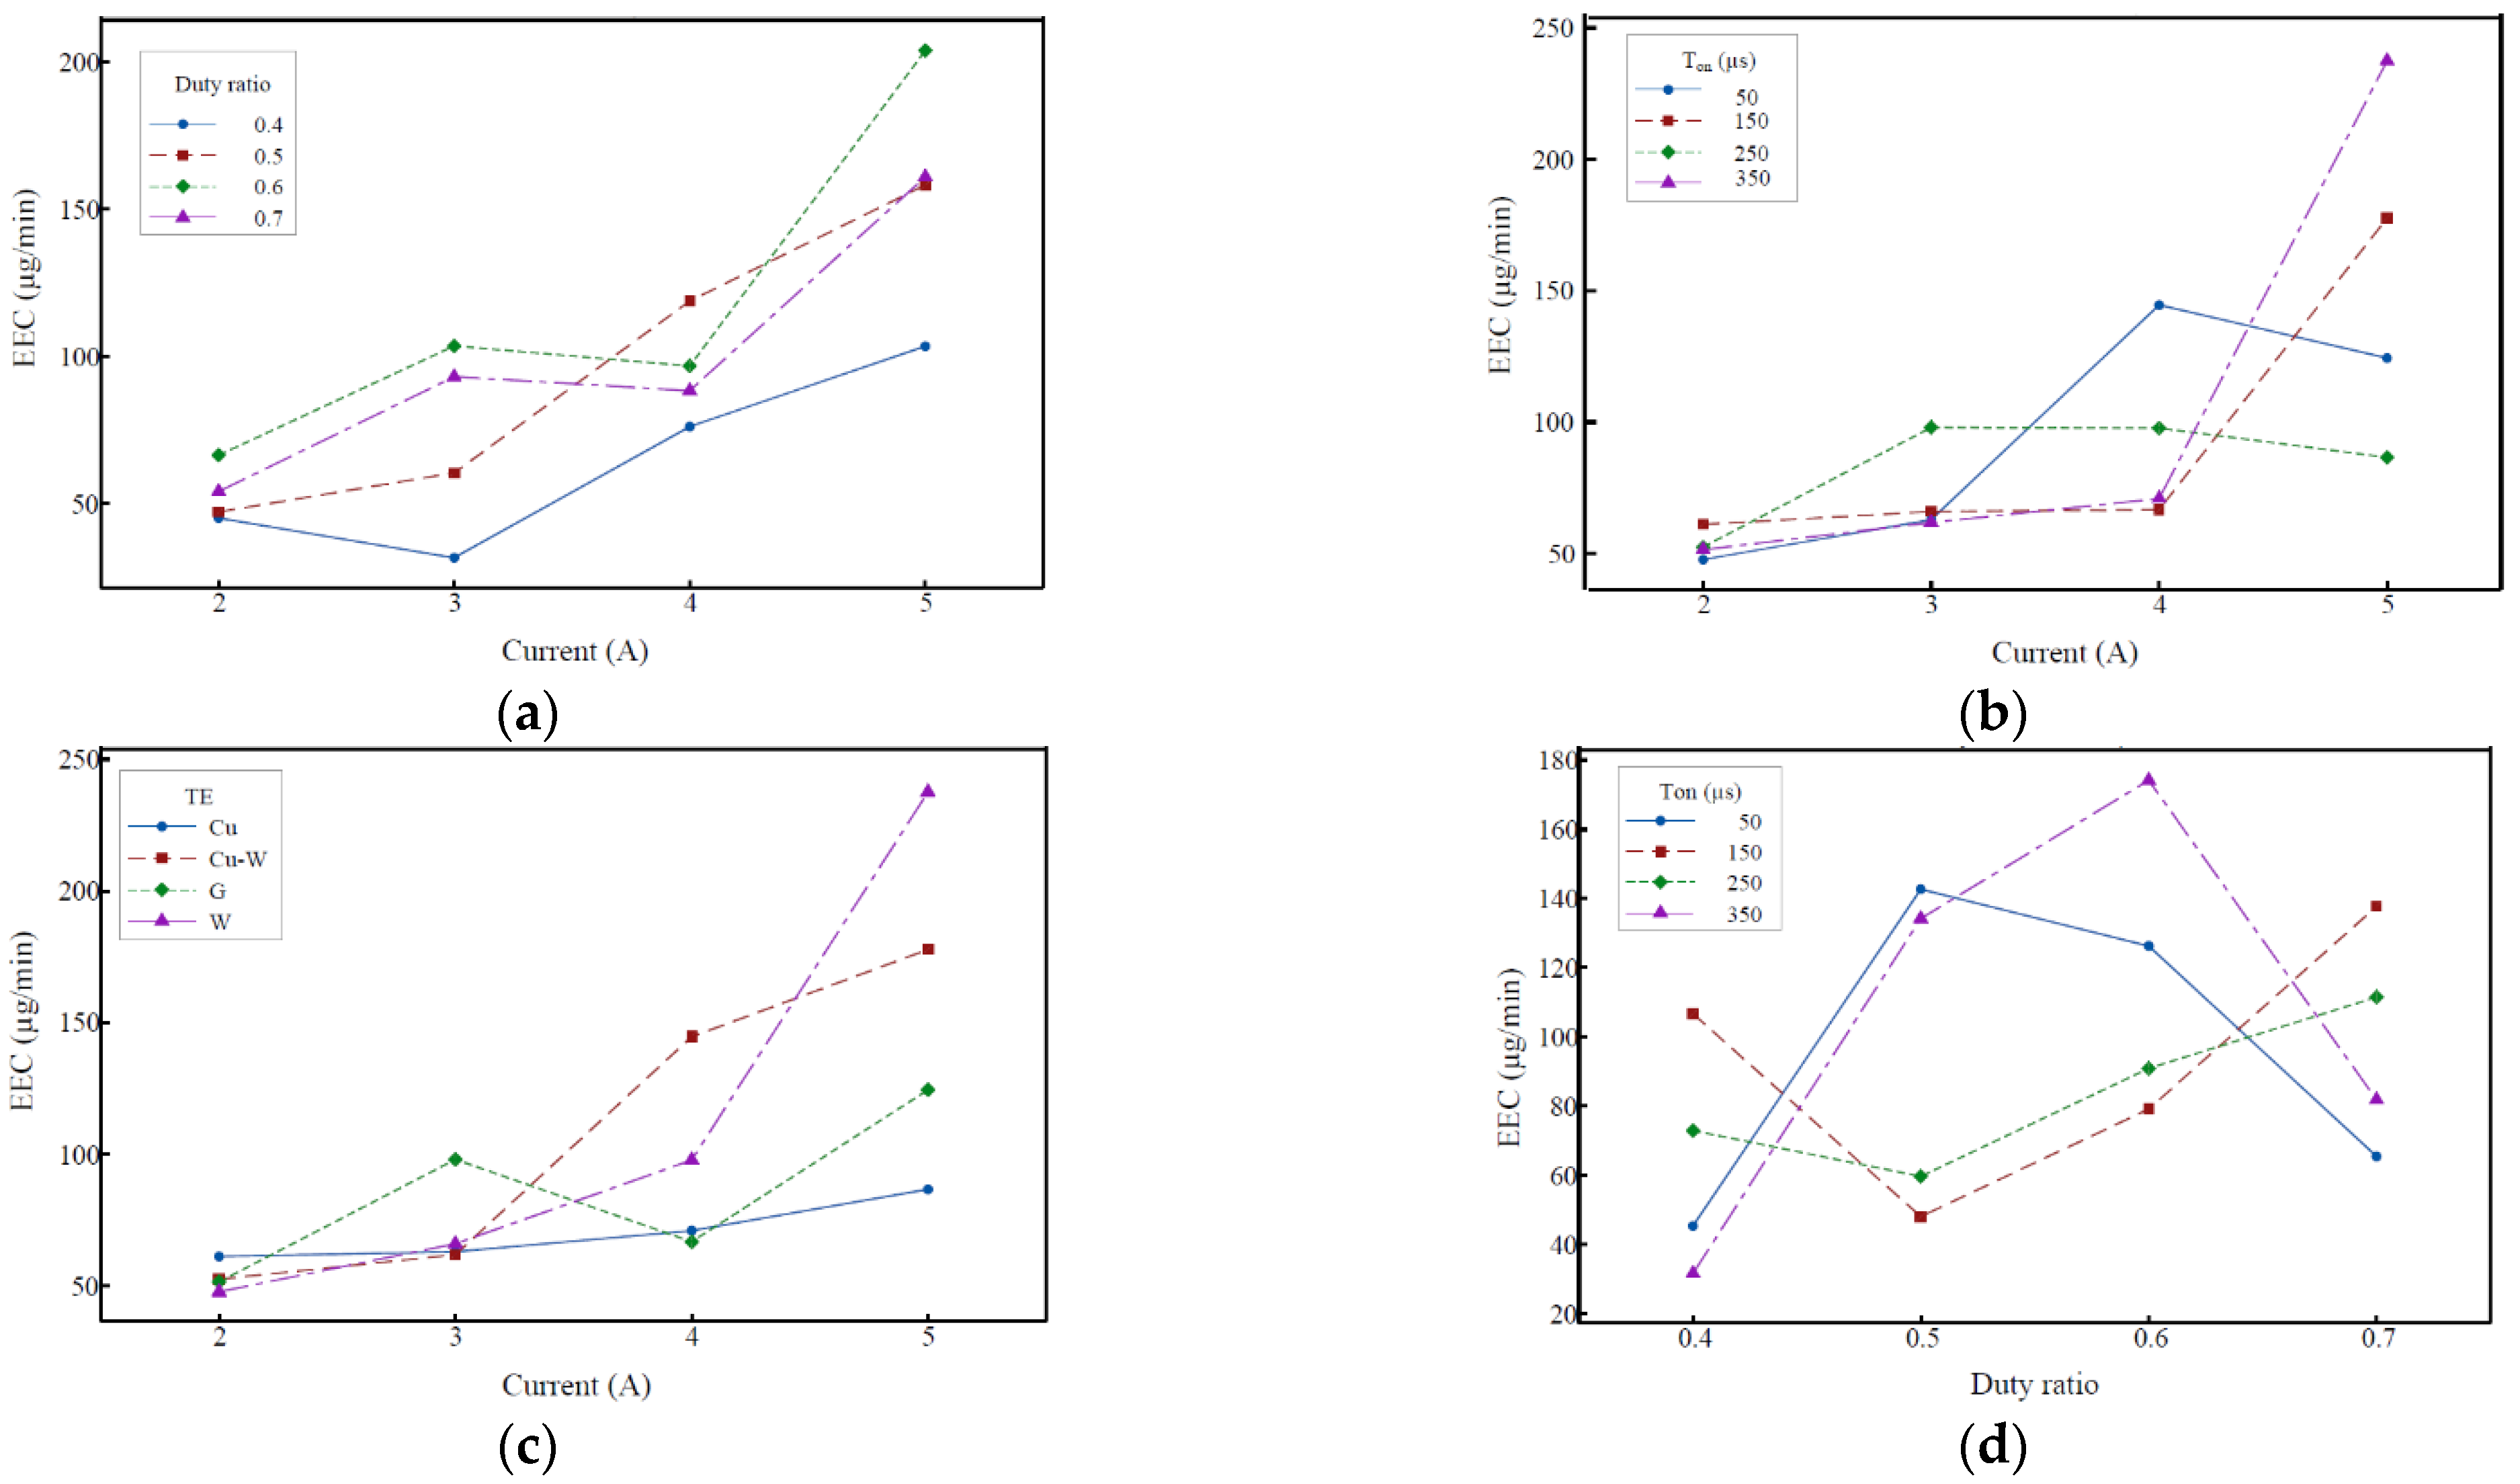
The gas and particulate matter emitted into the air during the EDM process are harmful to the human body. Figure 6 demonstrated that the mean main effect of the influence of current, duty ratio, pulse duration, electrode and dielectric on EEC. When the current is reduced from 2 A to 5 A, the EEC increases from 53.24 µg/min to 156.54 µg/min, which is an increase of about 3 times. With the increase in the duty ratio, the EEC shows a trend of first standing and then decreasing. When the duty ratio was 0.4, the emission was 64.11 µg/min, and when the duty ratio was 0.6, it reached a maximum value of 117.61 µg/min. With an increase in the pulse duration, the EEC shows a tendency to first decrease and then increase. When the pulse duration is 250 µs, the EEC reaches a minimum value of 83.74 µg/min. Among the four electrodes used, the Cu electrode has the smallest emission value of 70.44 µg/min, and the W electrode has the highest emission value of 112.24 µg/min, which is about 59.3% higher than the Cu electrode. The EEC of SSO is 100.14 µg/min, and the EEC of kerosene was 88.35 µg/min. The EEC of SSO is about 11.8% higher than that of kerosene.
The EEC increases with an increasing current, because of the increased discharge energy of the current. This increases the temperature of the machining area and improves the material removal rate, resulting in more dielectric and material gasification. Additionally, it results in a large number of gas particles diffusing into the air, increasing the discharge rate of gas particles, and similar results were found in the study by Mathew et al. [11]. When the duty ratio is set to 0.6, the EEC reaches its maximum value, which indicates that the use of such parameters should be prevented as much as possible in order to reduce emissions during the EDM process. The experimental results showed that too large or too small a pulse duration will lead to an increase in emission, and the EEC reaches a minimum value when the pulse duration is 250 µs. Valaki et al. [29] established a regression model and found that the response pattern of vegetable oil was similar to that of kerosene, which indicated that the melting and evaporation mechanism of vegetable oil was similar to that of kerosene. The results show that vegetable oil piezoelectric can replace hydrocarbon-based dielectrics and improve the sustainability of electrical discharge machining.

3.2. Machining Performance of Different Electrodes under SSO/Kerosene Dielectric

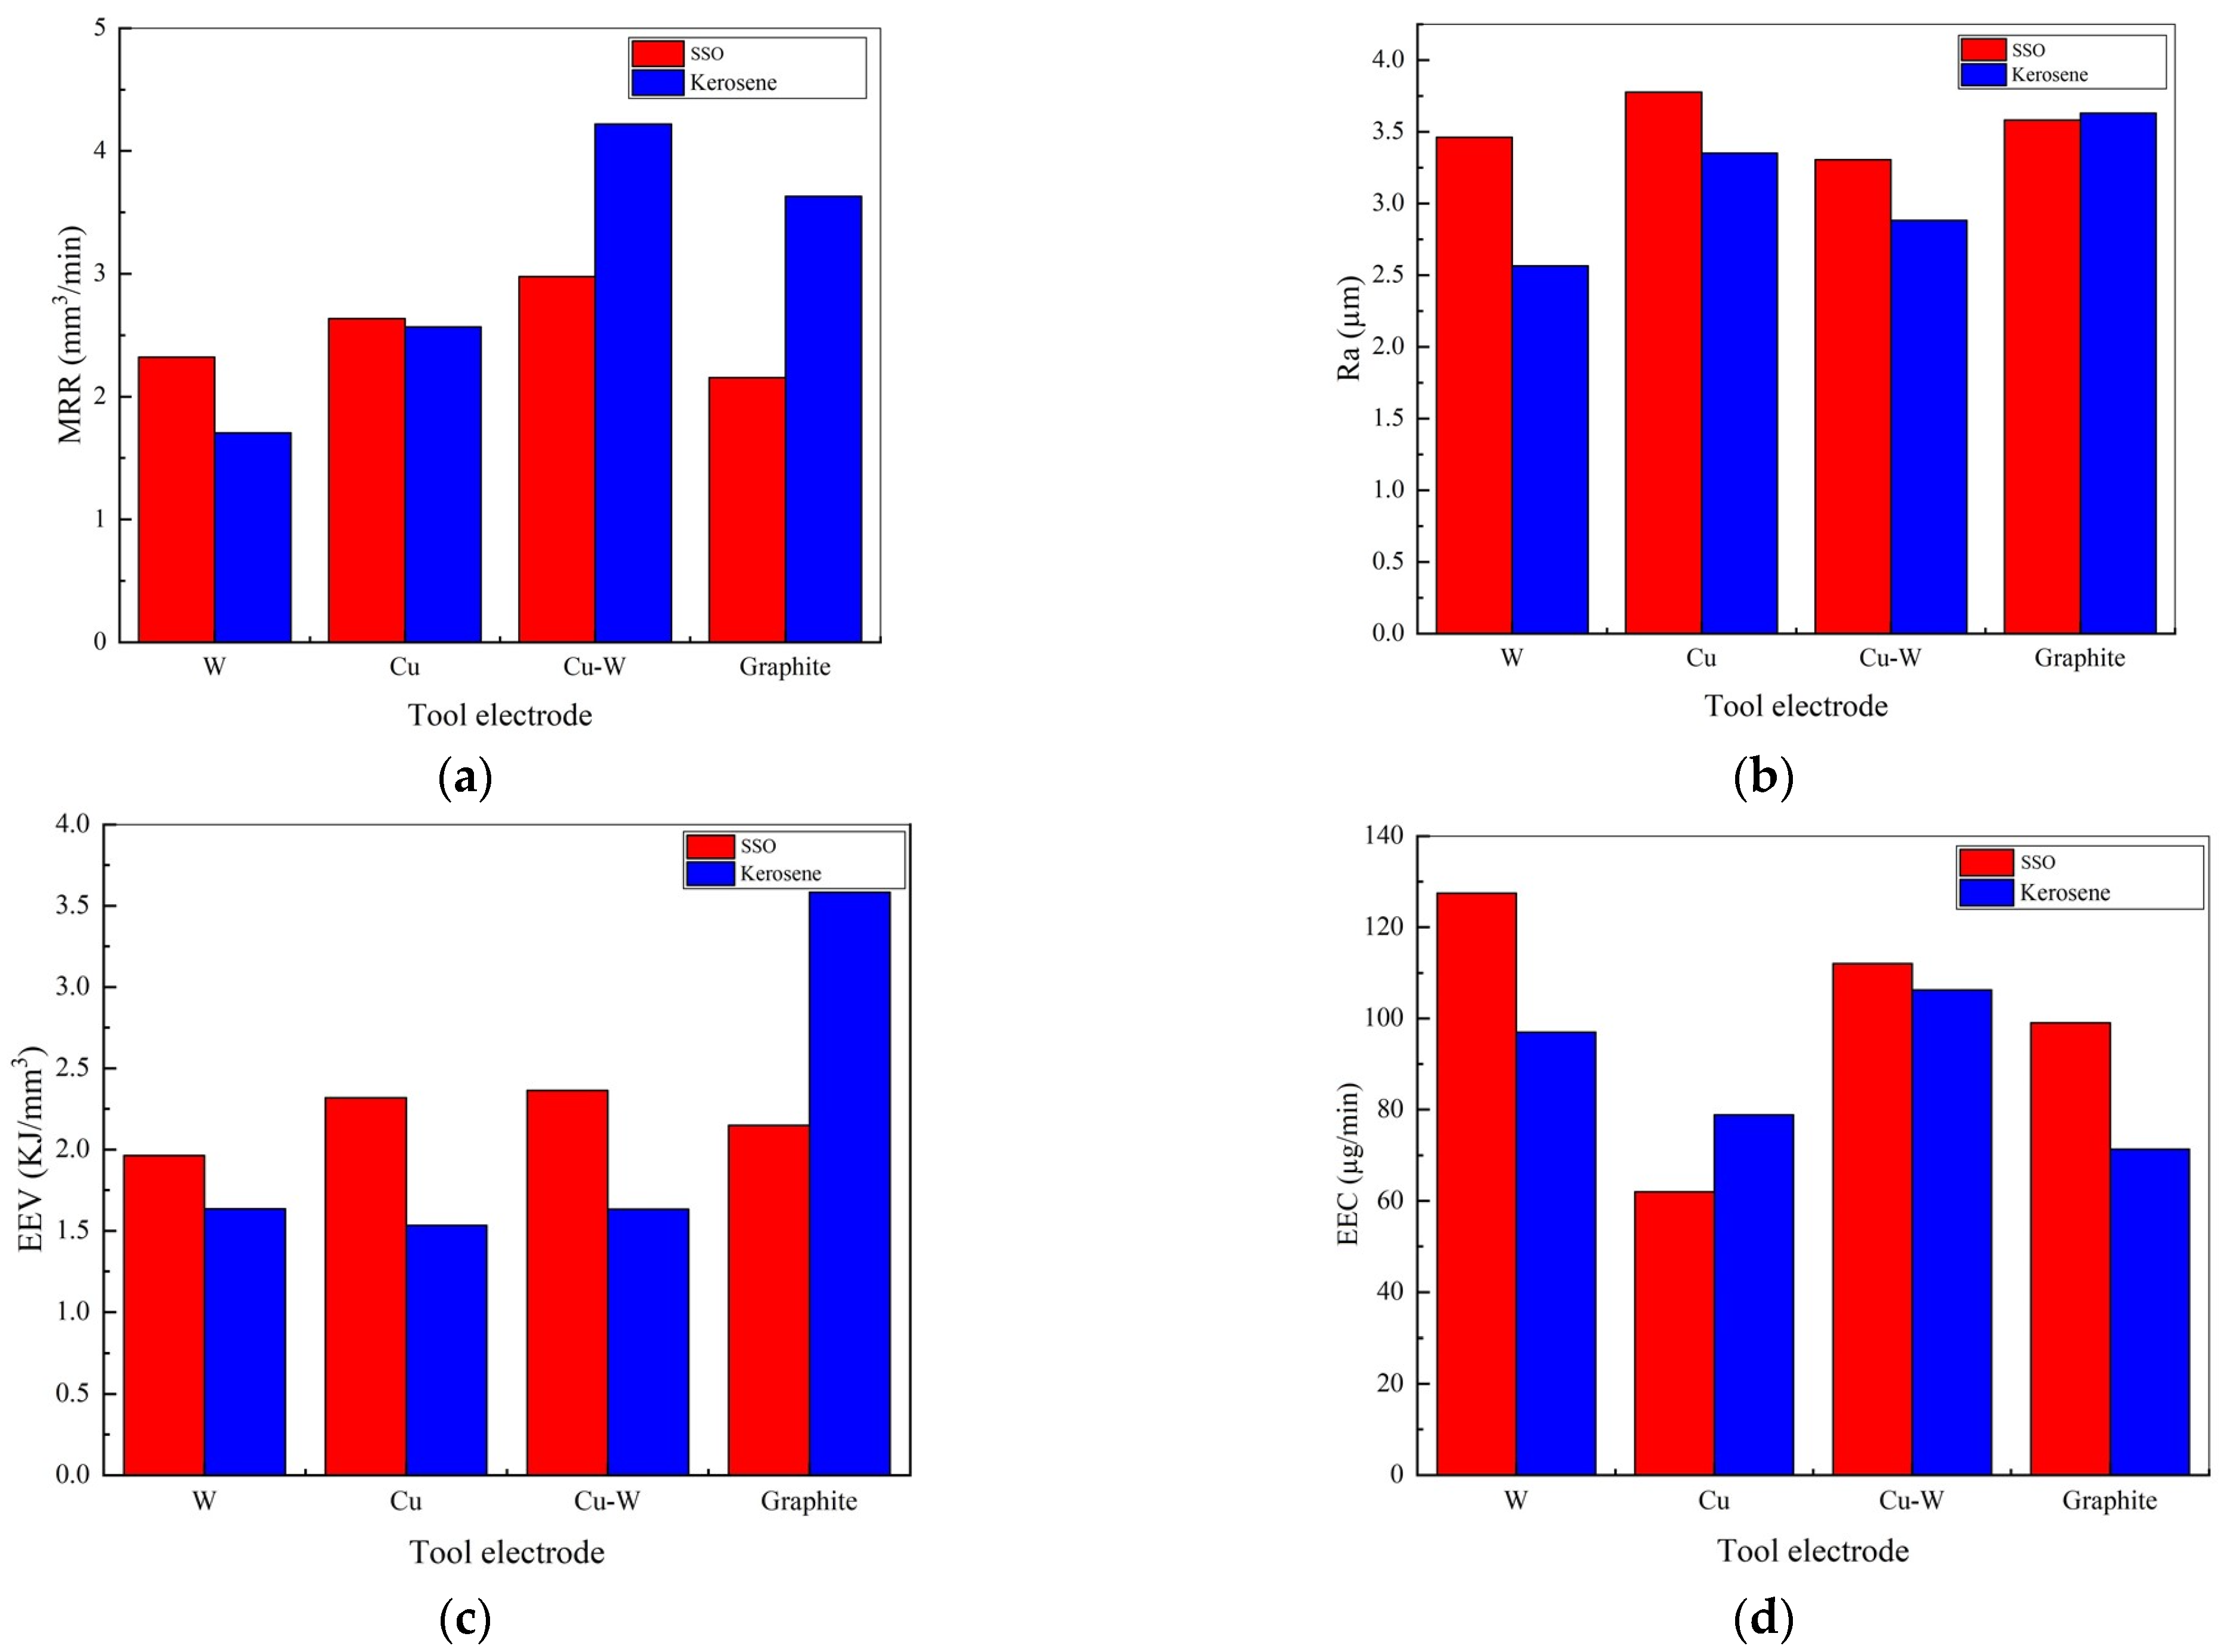
To investigate the processability of electrodes in SSO and kerosene, the mean values of the processability of different electrodes in SSO/kerosene dielectrics were calculated. As shown in Figure 7a, the MRR of the W electrode in SSO is 2.3218 mm3/min, which is about 35.15% higher than that in kerosene. Moreover, in SSO, the MRR of the Cu electrode was 2.6354 mm3/min, which was about 2.67% higher than that of kerosene. The Ra of the graphite electrode in SSO is 3.5808 µm, as shown in Figure 7b, while that of kerosene is 3.6303 µm, as shown in Figure 7c. It is clear that the Ra of the graphite electrode in SSO is smaller than that in kerosene. Figure 7c displays that the EEV of the graphite electrode in SSO is 2.1478 kJ/mm3, which is approximately 40% lower than the EEV of the graphite electrode in kerosene. Figure 7d showed that the EEC of Cu electrode in SSO is significantly lower than that of kerosene, and the EEC of Cu electrode in SSO is 62.017 µg/min, which is greater than the EEC of kerosene, which is 78.857 µg/min. It is a question of 21.36% lower.
The experimental results demonstrated that under certain conditions, the Cu electrode in SSO has a higher MRR, lower EEC, and good processing performance. Moreover, the Cu electrode is commonly used in EDM and has a lower cost. The EEV and Ra of graphite electrodes in SSO are lower, which indicates that under specific experimental parameters, EDM performance with sunflower oil as the dielectric can be better than that of kerosene. There are currently no articles on the impact of electrodes on EEV and EEC, according to Ming et al. [37], who evaluated a review article on the sustainable development of EDM.

3.3. Analysis of the Effect of Dielectrics on Debris Size

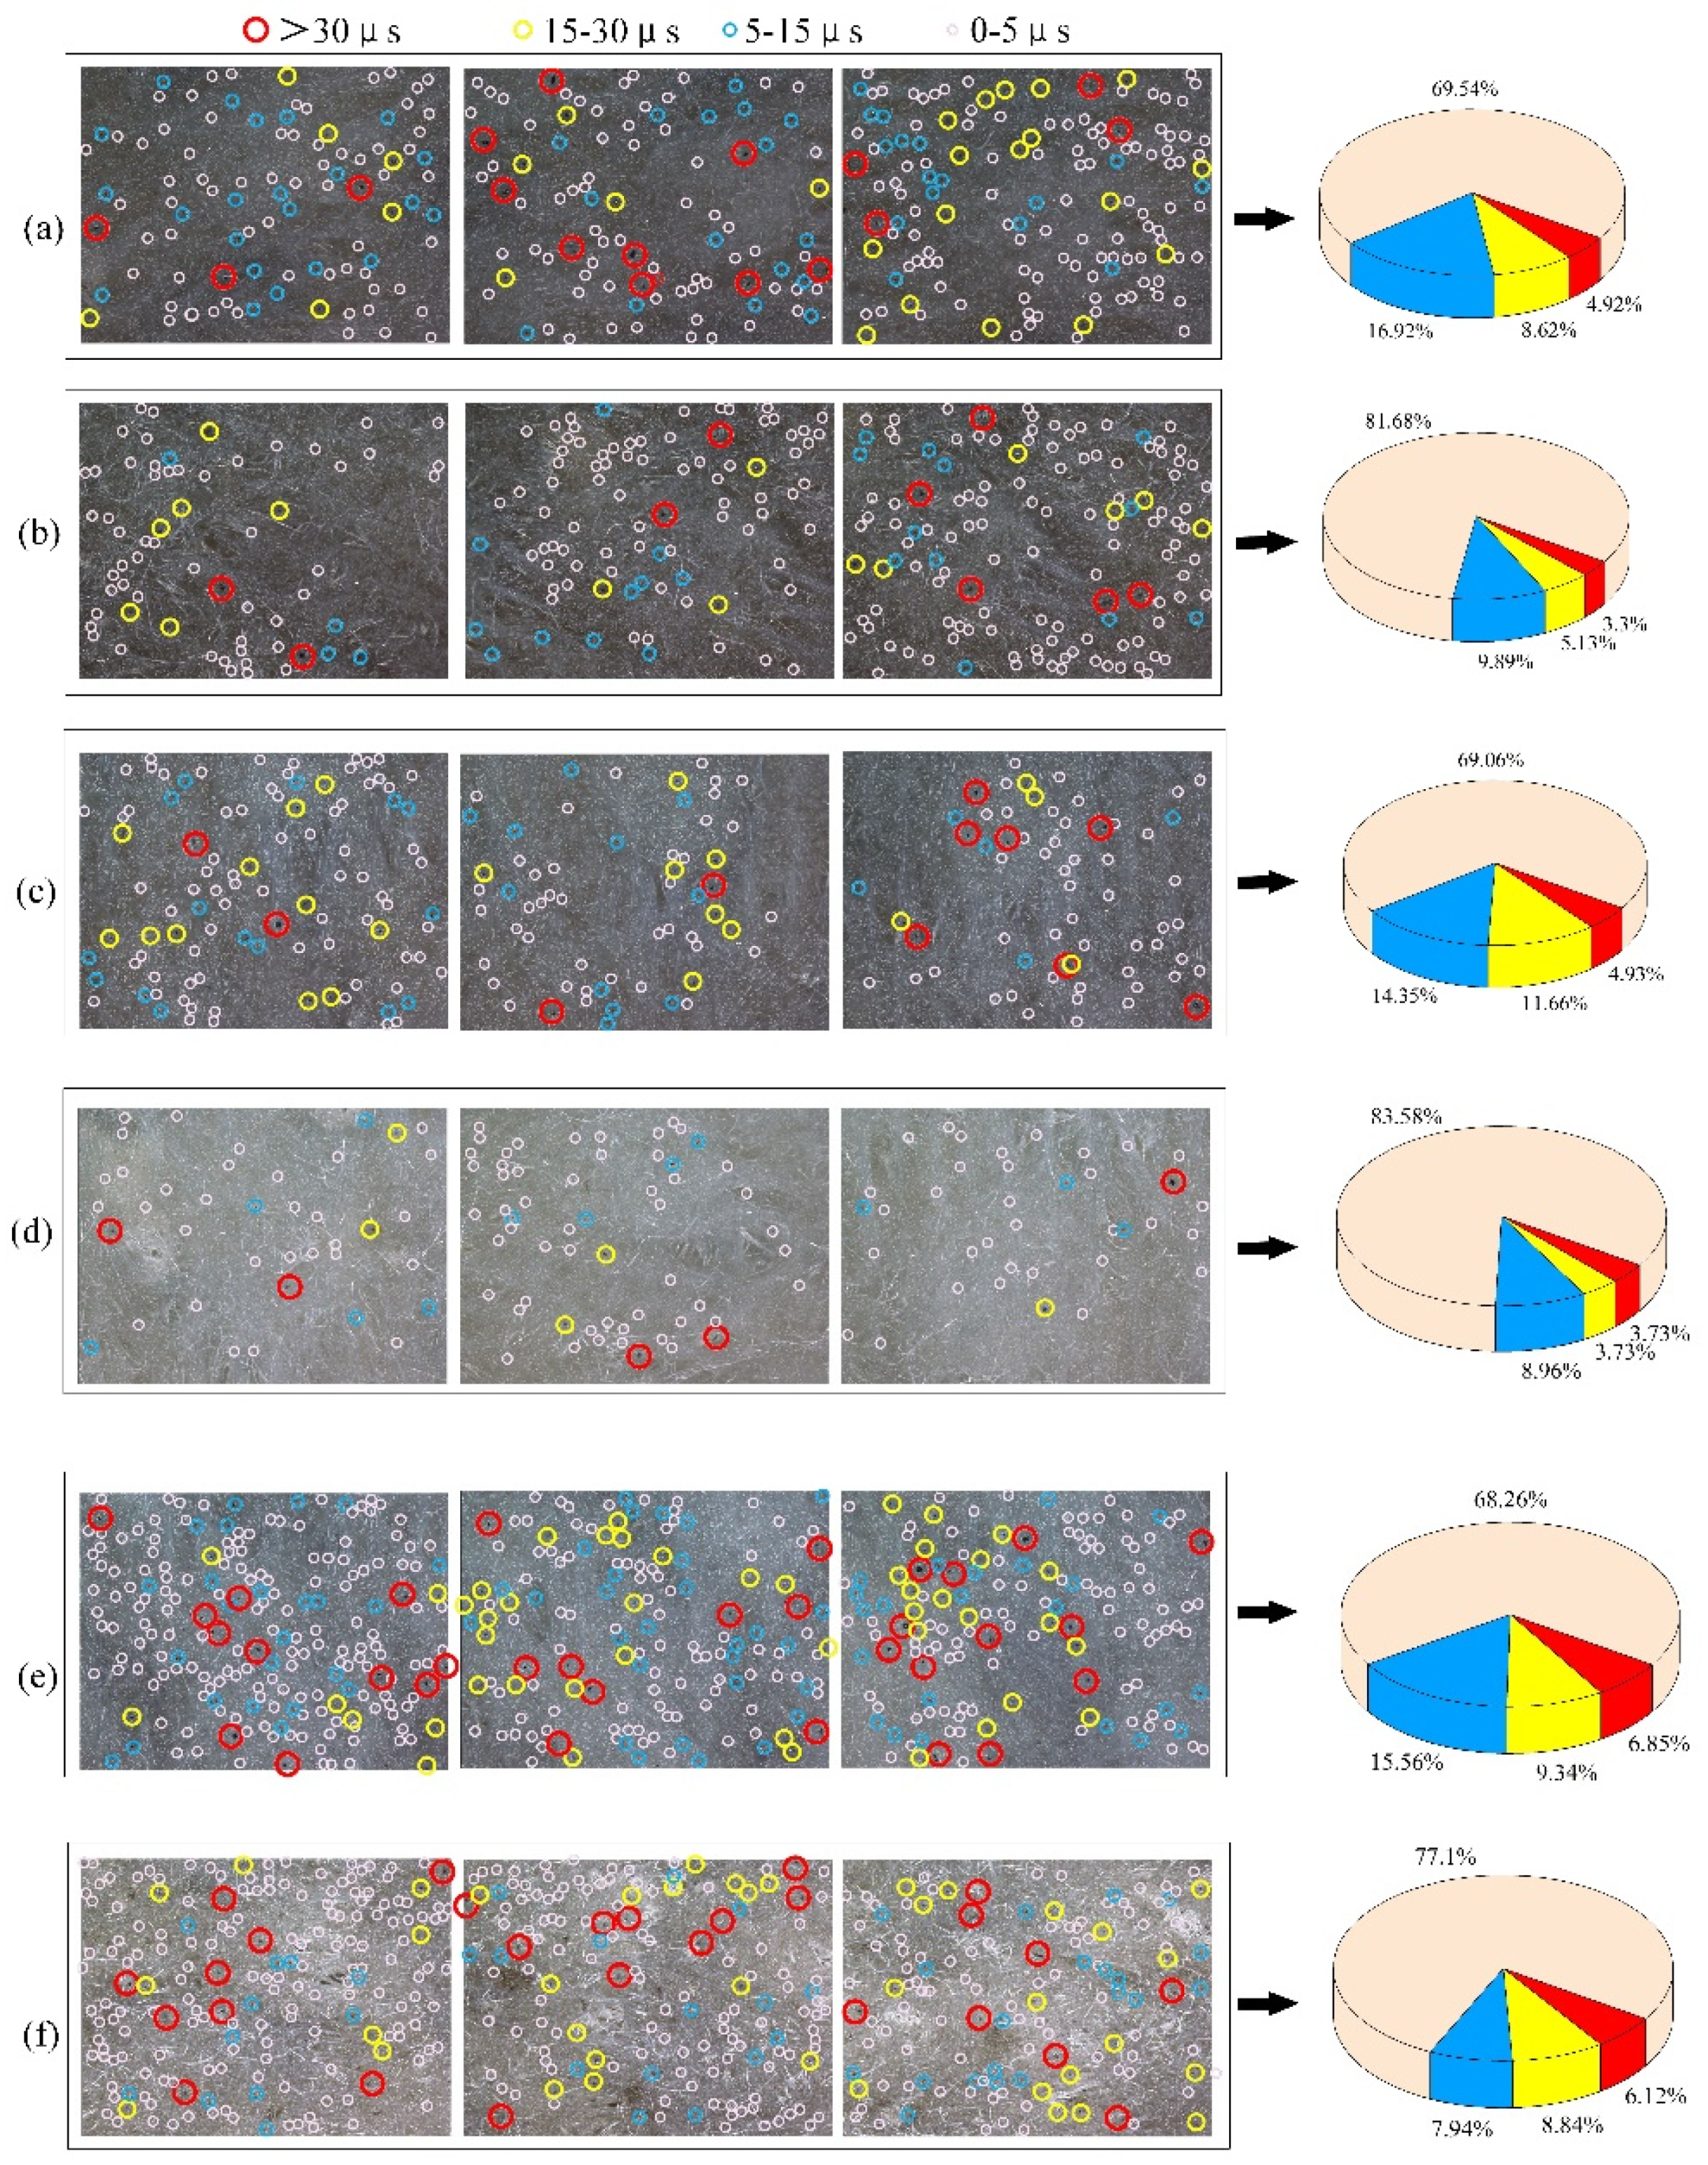
EDM will continuously generate granular debris in the discharge gap. If the debris cannot make a payment from the discharge gap in time, it will affect the subsequent discharge in the EDM process, resulting in poor machining stability. In this study, six groups of experimental processing SKD11 were performed to explore the size distribution of debris produced in SSO and kerosene. The experimental parameters are presented in Table 5. During processing, each group was performed with an equal volume of dielectric, and the oil-immersion method was adopted for machining. After the machining was completed, the dielectric was collected, and the size distribution of debris in the dielectric was observed with an electron microscope. Three pictures were extracted for each group of dielectrics for summary analysis. The scale bar of the fragments on the non-woven fabric photographed using an electron microscope is 50 µm, and these debris were divided into 4 grades with diameters of 0–5 µm, 5–15 µm, 15–30 µm and greater than 30 µm, as shown in Figure 8.
The results of the distribution analysis of the debris sizes produced in each set of experiments are presented in Figure 8. It can be seen from Figure 8a,b that the proportion of debris with a diameter larger than 30 µm account for 4.92%, and those with diameters between 15–30 µm account for 4.92%, while SSO is selected as the dielectric under the same processing parameters. Additionally, the proportion of debris between 15 and 30 µm in diameter is 8.62%, the proportion of debris between 5 and 15 µm in diameter is 16.92%, and the proportion of particles between 0–5 µm in diameter is 69.54%. In the EDM with kerosene as the dielectric, the proportion of debris with a diameter larger than 30 µm account for 3.3%. Morover, the proportion of debris diameters of between 15 and 30 µm account for 5.13%, diameters of 5–15 µm account for 9.89%, and those with diameters of 0–5 µm account for 81.68%. The proportion of debris with a large size in SSO is higher than that in kerosene. It can be seen from Figure 8c,d that the proportion of debris with a diameter of greater than 30 µm in SSO is 4.93%, and the proportion of debris with a diameter between 15–30 µm is 11.66%, which is higher than that in kerosene oil.
Debris larger than 30 µm in diameter account for 3.73% and those with diameters between 15–30 µm account for 5.13%. Figure 8e,f demonstrate that the debris with diameters larger than 30 µm in SSO account for 6.85% and are higher than 6.12% in kerosene, and for debris with diameters between 15–30 µm in SSO the pro-portion is 9.34%, which is larger than that in kerosene. It can be observed in Figure 8 that when other processing parameters are the same, the EDM with SSO as the dielectric produces large debris. This is because the viscosity of sunflower oil is higher than that of kerosene, which compresses the discharge channels and increases the energy density. This will cause the spark discharge to be more concentrated and intense in sunflower oil, so the large debris in sunflower oil account for a larger proportion. Moreover, it can be seen from the above experiments that with the increase in the current, the proportion of debris with larger diameters also increases. This is because the increase in the current causes a single pulse to release more energy, which accelerates the evaporation of the dielectric and the ejection of metal materials, resulting in large debris that account for a higher proportion. In the future, using simulation software to simulate the movement and distribution of debris in the EDM gap, an improvement of the dielectric’s machining performance based on the simulation results will be required [38].

3.4. Analysis of Interaction Effect

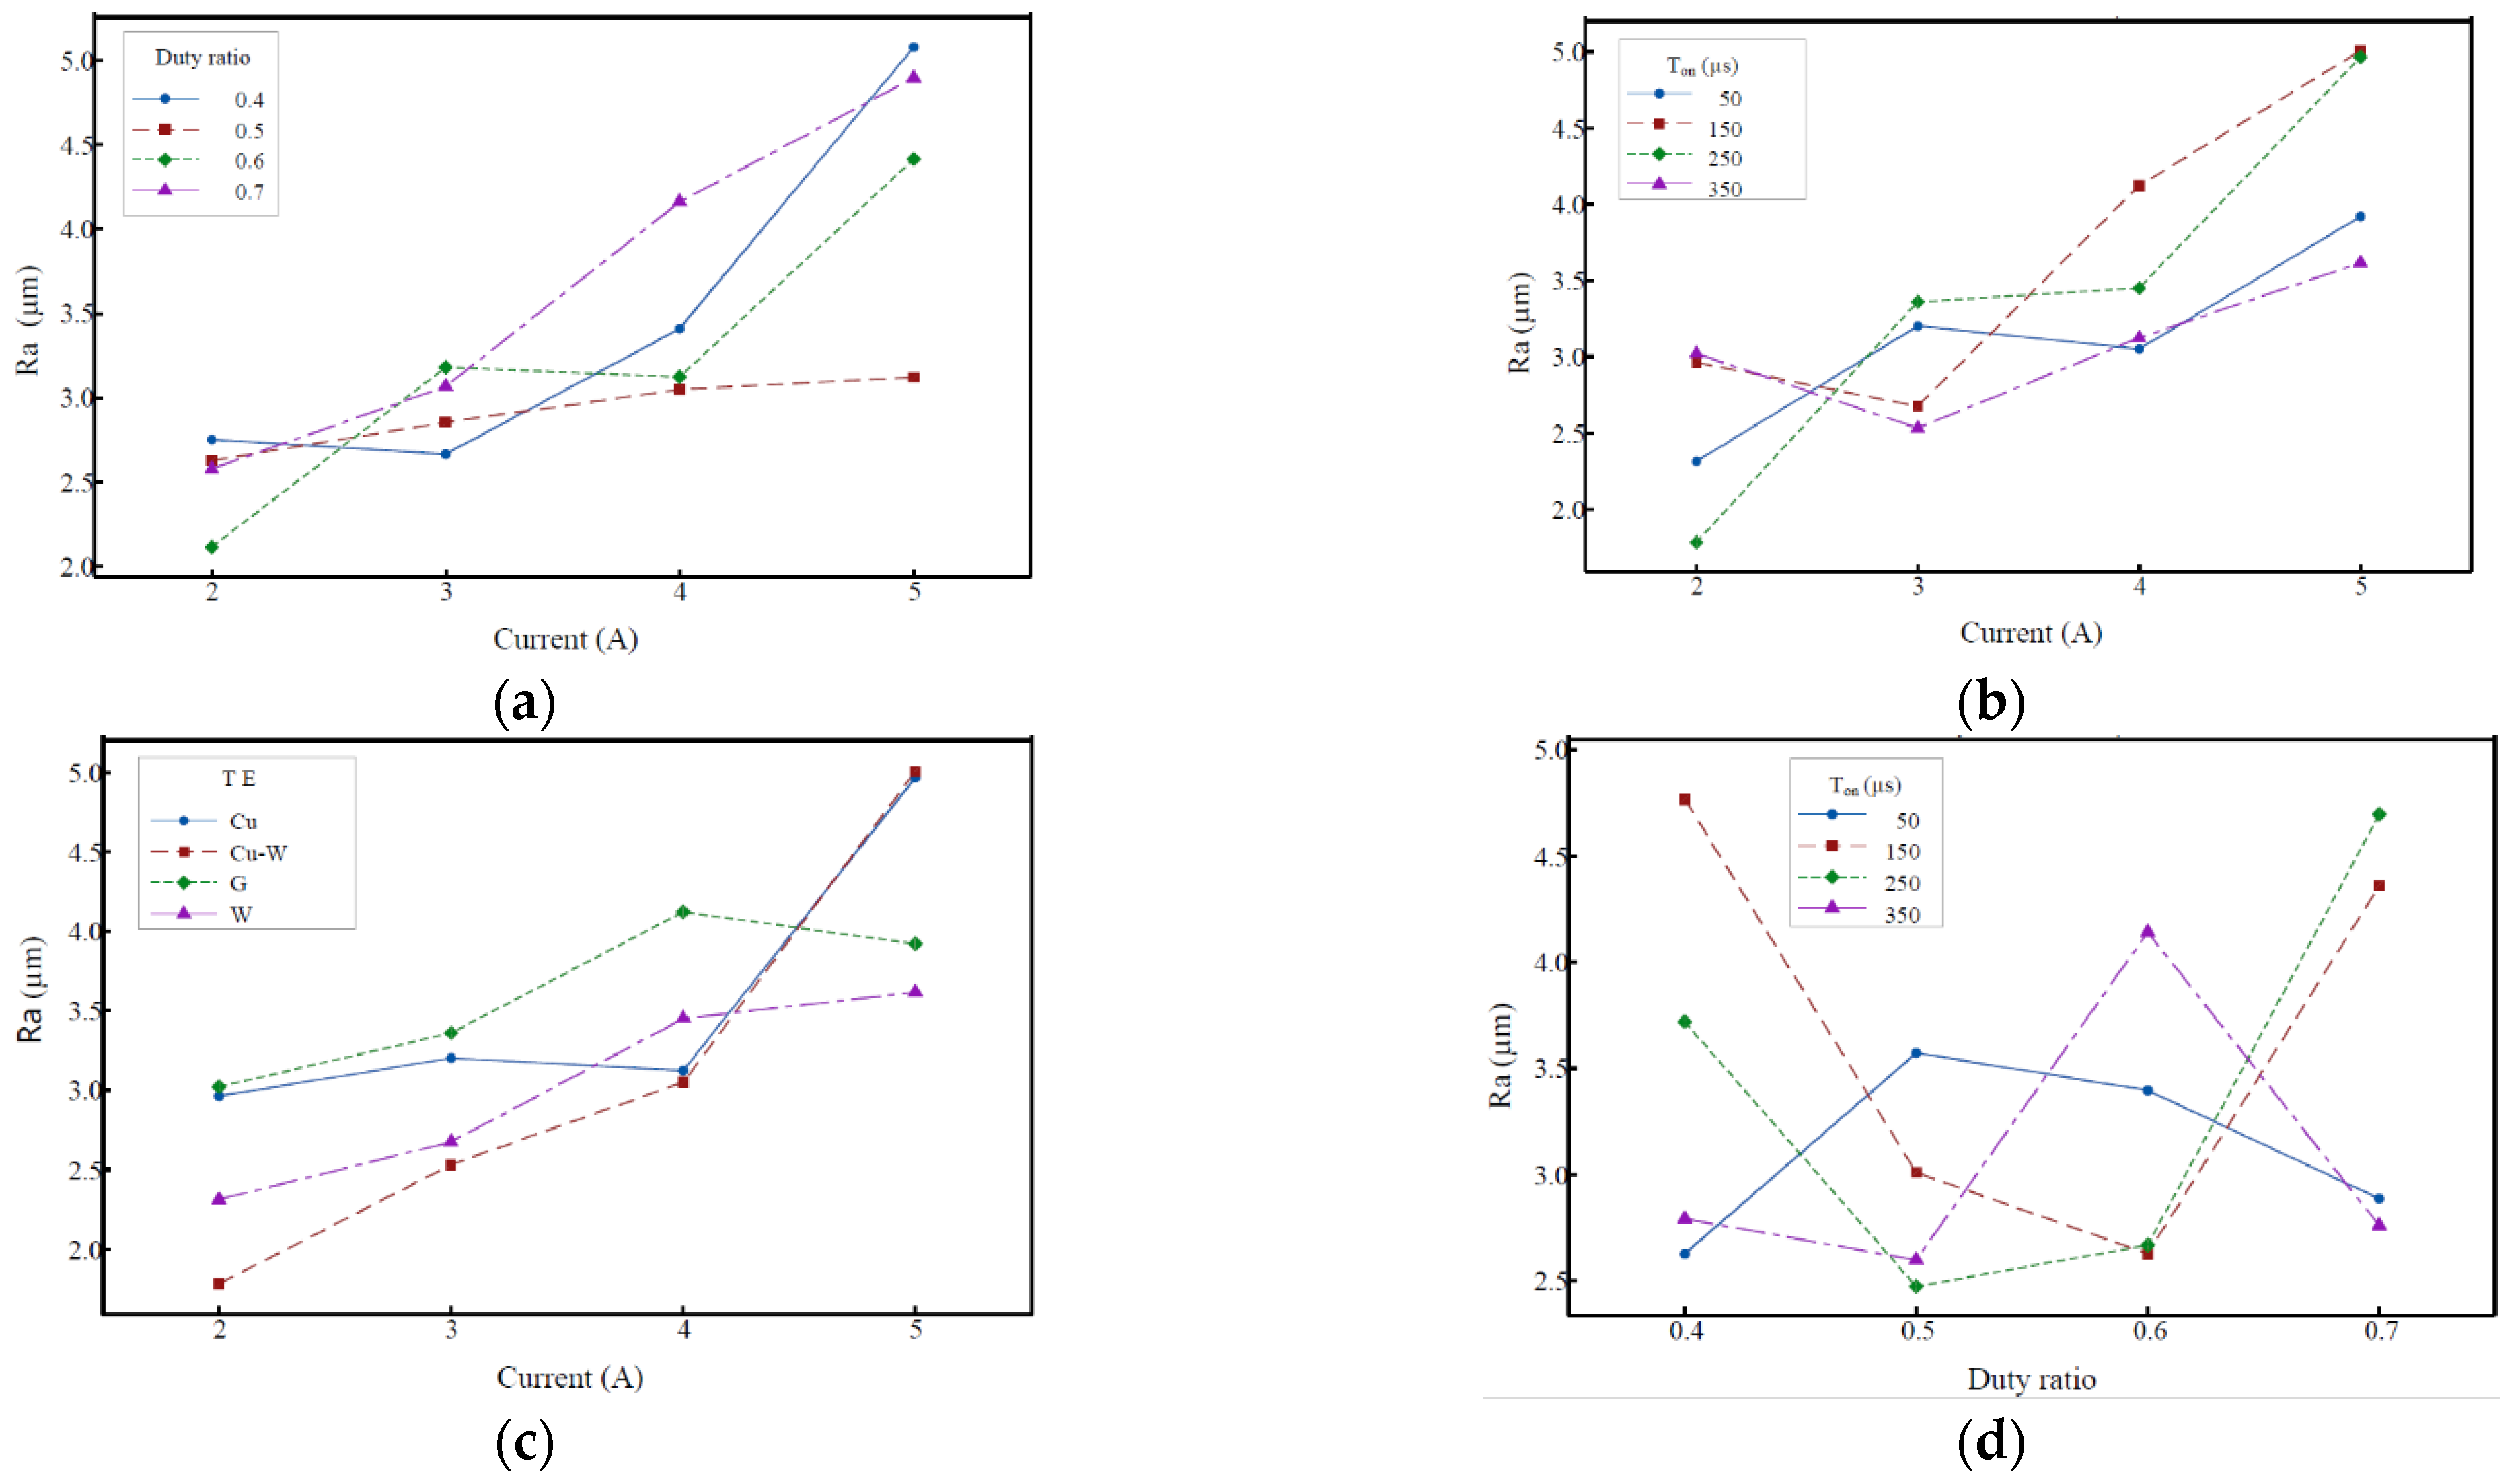
To reduce experimental error and increase the accuracy of the experimental data, a study of parameter interaction is included. Figure 9a depicts the effect of current and duty ratio interaction on MRR. The slope of the current (2, 3, 4, and 5 A) and duty ratio (0.4, 0.5, 0.6, and 0.7) are different in this diagram. As a result, an interaction between current and duty ration on MRR can be deduced. For MRR, there is a similar interaction effect between current and pulse duration, current and tool electrode, and duty ratio and pulse duration. The interaction effect on Ra is depicted in Figure 10a–d. Similarly, there is an interaction effect between current and duty ratio, between current and pulse duration, between current and tool electrode, and between duty ratio and pulse duration on Ra. It can be seen from Figure 11 and Figure 12 that there is an interaction effect between current and duty ratio, between current and pulse duration, between current and tool electrode, and between duty ratio and pulse duration on EEV and EEC. Similar experimental results have also appeared in the paper by Huang et al. [39].

4. Discussion

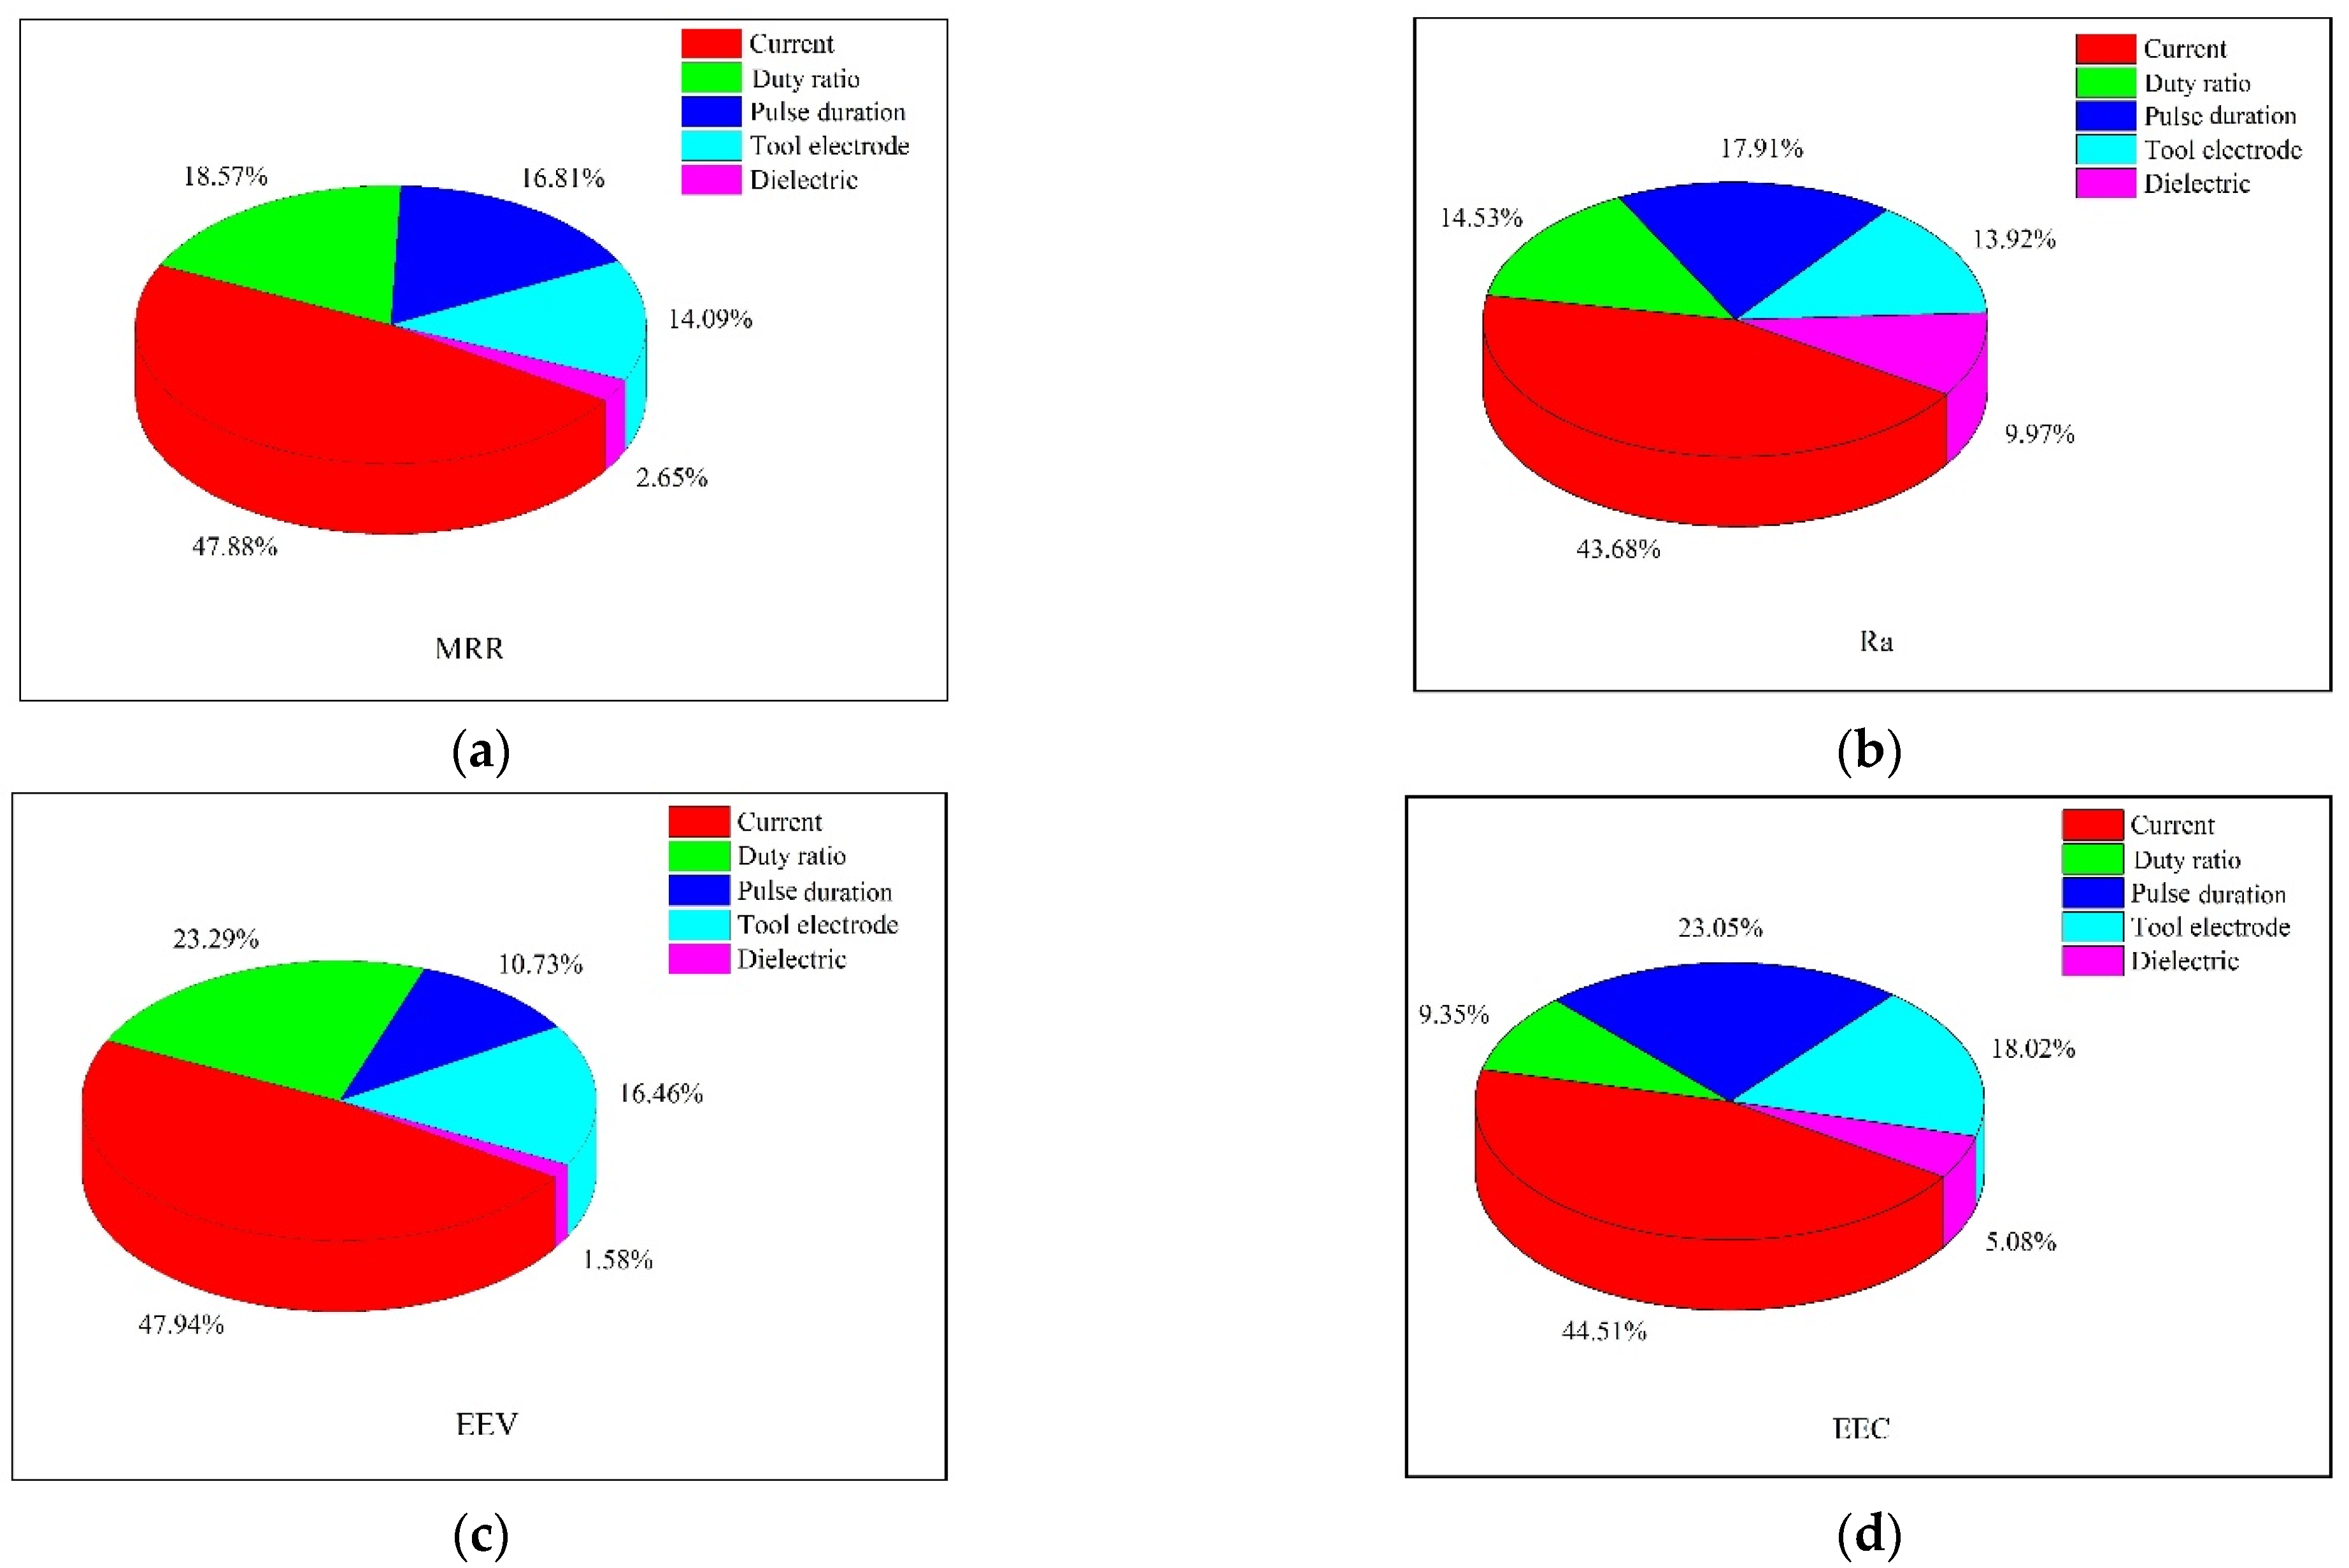
The machining performance of EDM is affected by various process parameters, such as current, duty ratio, pulse duration, electrode and dielectric, etc. In the mean value analysis, the range of the mean values of different levels of a parameter indicates the degree of influence of this parameter on the machining performance, and the larger the range, the stronger the influence. Figure 13 is the range analysis diagram of the parameter mean value of this investigation. Figure 13a shows that the current has the greatest impact on MRR, accounting for 47.88% of the total effect, and the duty ratio has the second greatest impact on MRR, accounting for 18.57%. The influences of pulse duration, electrode, and dielectric account for 16.81%, 14.09%, and 2.65%, respectively, of which the dielectric has the smallest influence on MRR. According to Figure 13b, the current has the greatest impact on Ra, followed by the duty ratio (43.68% and 17.91%, respectively), and the dielectric has the least impact on Ra. The effects of current, duty ratio, pulse duration, electrode, and dielectric on EEV are, shown in Figure 13c, 47.94%, 23.29%, 10.73%, 16.46%, and 1.58%, respectively. The impact of the current is the largest, followed by the duty ratio, and the influence of the dielectric is the smallest. The proportions of current, duty ratio, pulse duration, electrode, and dielectric are 44.51%, 9.35%, 23.05%, 18.02%, and 2.08%, respectively, as shown in Figure 13d. The influence of each process parameter on the emission is from large to small, and the order is current, duty ratio, current, pulse duration and dielectric.
In terms of processability, the MRR of kerosene oil is about 13% higher than that of SSO. This is because the higher viscosity of SSO causes the debris in the gap to be removed with large resistance, and the debris in the gap affects the stability of discharge pulse. The value of MRR of SSO will increase if it is handled by spraying or reducing the viscosity of SSO. The EEV of SSO was about 4.6% higher than that of kerosene, indicating that although SSO did not perform as well as kerosene in terms of EEV, the results were the same as kerosene. Additionally, in the experiment, the minimum value of EEV in SSO was 0.3879 kJ/mm3, which is about 25% lower than the smallest value of 0.4849 kJ/mm3 in kerosene. This shows that, under suitable parameters, SSO is better than kerosene in terms of the processability of energy efficiency. Although the Ra of SSO is about 12% higher than that of kerosene, the minimum Ra of SSO is 1.7103 µm and the minimum Ra of kerosene is 1.8537 µm in a single set of experiments. The smallest value is approximately 8.3% lower, indicating that under certain conditions, SSO can process better than kerosene. Regardless of the fact that the EEC of SSO is approximately 11.8% higher than that of kerosene, the composition of emissions from SSO and kerosene is different. The operator’s health impact is lower, suggesting that SSO has advantages over kerosene in reducing pollutant emissions and has the potential to replace kerosene as an EDM dielectric.
It can be seen from Figure 13 that among the five process parameters of current, duty ratio, pulse duration, electrode, and dielectric, the current has the greatest influence on the machining performance, followed by the duty ratio, and the dielectric has the smallest influence on the machining performance. This shows that to increase the machining performance of EDM, process parameters such as current and duty ratio should be primarily optimized, which is why it is beneficial to use SSO instead of kerosene as the dielectric for EDM. From an economic point of view, sunflowers are planted all over the world. With the entry of planting technology and oil extraction technology, the output of SSO is increasing day by day, which will greatly reduce the cost of EDM. From an ecological point of view, SSO is a renewable resource, and no pollutants are produced during the preparation process, which is more in line with the requirements of green manufacturing than mineral oil. Moreover, the flash point and fire point of SSO are greater than those of kerosene, which indicates that SSO has higher fire resistance than kerosene. In addition, the biodegradability of SSO is greater than that of kerosene. If leakage occurs accidentally, SSO can reduce the risk of polluting soil and water sources, which will greatly improve the safety of EDM.

5. Conclusions

In this study, SSO and kerosene were used as dielectrics of EDM for machine SKD11, and the machining performance of the two dielectrics under a different current, duty ratio, pulse duration and electrodes were comparatively analyzed. From the experimental results, SSO offers the opportunity to replace kerosene as a dielectric for EDM. The research results of this investigation are as follows:
(1)
The MRR of kerosene is about 13% higher than that of SSO; the EEV of SSO is about 4.6% higher than that of kerosene; the Ra of SSO is about 12% higher than that of kerosene; and the emission rate of SSO is about 11.8% higher than that of kerosene. Overall, SSO had a similar machining performance to kerosene. However, from the experimental results of a single group, the minimum value of EEV in SSO is 0.3879 kJ/mm3, which is about 25% lower than the minimum value of 0.4849 kJ/mm3 in kerosene, and the minimum Ra value of SSO is 1.7103 µm, while the minimum Ra value of kerosene is 1.8537 µm, which indicates that under suitable parameter conditions, the machining performance of SSO could be better than that of kerosene. This means that SSO has the potential to replace kerosene as a dielectric for EDM. From the influence of process parameters on the processability, the dielectric has the least influence on the machining performance. So replacing kerosene with SSO does not have a considerable impact on the machining performance. Moreover, SSO has similar properties to kerosene, and as a renewable resource, SSO costs less than kerosene. Moreover, there is no pollutant risk in the process of preparing SSO, so it will not pollute soil and water sources after accidental leakage, and the biodegradability is high. Both the flash and fire points of SSO compare with those of kerosene, which indicates that SSO is fire-resistant and is a cleaner, greener, and safer dielectric.
(2)
The experimental results show that the MRR of the W electrode in SSO is 2.3218 mm3/min, which is about 35.15% higher than that in kerosene, and the MRR of the Cu electrode in SSO is 2.6354 mm3/min, which is 2.67% higher than that in kerosene. The EEV of the graphite electrode in SSO is 2.1478 kJ/mm3, which is about 40% lower than the EEV of the graphite electrode in kerosene. The Ra of the graphite electrode in SSO is 3.5808 µm, and the Ra in kerosene is 3.6303 µm. Obviously, the Ra of the graphite electrode in SSO is smaller than that in kerosene. In SSO, the EEC of the Cu electrode is significantly smaller than that of the kerosene, and the EEC of the Cu electrode in SSO is 62.017 µg/min, which is about 21.36% lower than that of kerosene with 78.857 µg/min. This demonstrates that under certain conditions, Cu electrodes in SSO could obtain higher MRR, lower emission rates, and good machining performance. In addition, Cu electrodes are widely used in EDM with lower cost. The EEV and Ra of graphite electrodes were lower in SSO, indicating that the EDM performance with SSO as the dielectric can be preferable to that with kerosene as the dielectric.
(3)
SSO has similar properties to kerosene, and as a renewable resource, SSO costs less than kerosene. Moreover, there is no pollutant risk in the process of preparing SSO, so it will not pollute soil and water sources after accidental leakage, and its biodegradability is high. Both the flash and fire points of SSO compare with those of kerosene, which indicates that SSO is fire-resistant and is a cleaner, greener, and safer dielectric. In this study, the applicability of SSO in EDM was assessed on the basis of the successful experimental operation. Adding some additives to SSO to improve the processing performance is a future research direction.

Author Contributions

Conceptualization, W.M. and Z.X.; methodology, C.C.; software, W.M. and Z.X.; validation, X.G. and P.S.; formal analysis, S.Z.; investigation, W.M. and F.Z.; resources, W.M.; writing—original draft preparation, W.M. and Z.X.; writing—review and editing, W.M. and F.Z.; data analysis, P.S.; supervision, M.L.; funding acquisition, W.M., M.L. and Y.Y. All authors have read and agreed to the published version of the manuscript.

Funding

This research is supported by the Local Innovative and Research Teams Project of Guangdong Pearl River Talents Program, grant number 2017BT01G167. Additionally, it is supported by the National Natural Science Foundation of China, grant number 62073091 and the DGUT innovation center of robotics and intelligent equipment of China, grant number KCYCXPT2017006.

Institutional Review Board Statement

Not applicable.

Informed Consent Statement

Not applicable.

Data Availability Statement

Not applicable.

Conflicts of Interest

The authors declare no conflict of interest.

References

  1. Lazarenko, B.R. To Invert the Effect of Wear on Electric Power Contacts; Dissertation of The All-Union Institute for Electro Technique in Moscow/CCCP; Scientific Research Publishing Inc.: Moscow, Russia, 1943. [Google Scholar]
  2. Kunieda, M.; Lauwers, B.; Rajurkar, K.P.; Schumcher, B.M. Advancing EDM through Fundamental Insight into the Process. CIRP Ann. 2005, 54, 64–87. [Google Scholar] [CrossRef]
  3. Ho, K.H.; Newman, S.T. State of the art electrical discharge machining (EDM). Int. J. Mach. Tools Manuf. 2003, 43, 1287–1300. [Google Scholar] [CrossRef]
  4. Ming, W.; Shen, F.; Zhang, Z.; Huang, H.; Du, J.; Wu, J. A comparative investigation on magnetic field–assisted EDM of magnetic and non-magnetic materials. Int. J. Adv. Manuf. Technol. 2020, 109, 1103–1116. [Google Scholar] [CrossRef]
  5. Descoeudres, A.; Hollenstein, C.; Wälder, G.; Demellayer, R. Time- and spatially-resolved characterization of electrical discharge machining plasma. Plasma Sources Sci. Technol. 2008, 17, 431–438. [Google Scholar] [CrossRef] [Green Version]
  6. Joshi, S.N.; Pande, S.S. Development of an intelligent process model for EDM. Int. J. Adv. Manuf. Technol. 2009, 45, 300–317. [Google Scholar] [CrossRef]
  7. Natsu, W.; Ojima, S.; Kobayashi, T.; Kunieda, M. Temperature Distributi on Measurement in EDM Arc Plasma Using Spectroscopy. JSME Int. J. Ser. C-Mech. Syst. Mach. Elem. Manuf. 2004, 47, 384–390. [Google Scholar] [CrossRef] [Green Version]
  8. Wang, J.; Han, F.; Cheng, G.; Zhao, F. Debris and bubble movements during electrical discharge machining. Int. J. Mach. Tools Manuf. 2012, 58, 11–18. [Google Scholar] [CrossRef]
  9. Xu, B.; Chen, S.; Liang, X.; Lei, J.; Shi, H.; Fu, L.; Yang, J.; Peng, T.; Zhao, H.; Zhu, L. Recast layer removal of 304 stainless steel by combining micro-EDM with negative polarity micro-EDM. Int. J. Adv. Manuf. Technol. 2020, 107, 4713–4723. [Google Scholar] [CrossRef]
  10. Leão, F.N.; Ian, R.; Pashby, L.R. A review on the use of environmentally-friendly dielectric fluids in electrical discharge machining. J. Mater. Process. Technol. 2004, 149, 341–346. [Google Scholar] [CrossRef]
  11. Jose, M.; Sivapirakasam, S.P.; Surianarayanan, M. Analysis of aerosol emission and hazard evaluation of electrical discharge machining (EDM) process. Ind. Health 2010, 48, 478–486. [Google Scholar] [CrossRef] [Green Version]
  12. Singh, S.S.; Mehta, V.; Manchanda, J.; Phull, G.S. Investigation of electric discharge machining of Inconel 718 using special graphite electrode. IOSR J. Mech. Civ. Eng. 2015, 12, 56–61. [Google Scholar]
  13. Dewangan, S.K. Multi-Objective Optimisation and Analysis of EDM of AISI P20 Tool Steel. Ph.D. Thesis, Department of Mechanical Engineering, National Institute of Technology, Rourkela, India, 2014. [Google Scholar]
  14. Posinasetti, N.R. Manufacturing Technology: Metal Cutting and Machine Tools; McGraw-Hill Education (India) Pvt Limited: New Delhi, India, 2013; Volume 2. [Google Scholar]
  15. Jagadessha, T. Non-Traditional Machining Processes; IK International Publishing House Pvt. Limited: New Delhi, India, 2016. [Google Scholar]
  16. Bommeli, B. Study of the harmful emanations resulting from the machining by electro-erosion. In Proceedings of the Seventh International Symposium on Electro Machining (ISEM VII), Birmingham, UK, 12–14 April 1983; pp. 469–478. [Google Scholar]
  17. Tönshoff, H.K.; Egger, R.; Klocke, F. Environmental and Safety Aspects of Electrophysical and Electrochemical Processes. CIRP Ann.-Manuf. Technol. 1996, 45, 553–568. [Google Scholar] [CrossRef]
  18. Liu, Y.; Zhang, Y.; Ji, R.; Cai, B.; Wang, F.; Tian, X.; Dong, X. Experimental characterization of sinking electrical discharge machining using water in oil emulsion as dielectric. Mater. Manuf. Process 2013, 28, 355–363. [Google Scholar] [CrossRef]
  19. Masuzawa, T. Machining characteristics of EDM using water as a dielectric fluid. In Proceedings of the 22nd Machine Tool Design and Research Conference; Palgrave: London, UK, 1982; pp. 441–447. [Google Scholar]
  20. Masuzawa, T.; Tanaka, K.; Nakamura, Y.; Kinoshita, N. Water-Based Dielectric Solution for EDM. CIRP Ann.-Manuf. Technol. 1983, 32, 119–122. [Google Scholar] [CrossRef]
  21. Zhang, Q.H.; Zhang, J.H.; Deng, J.X.; Qin, Y.; Niu, Z. Ultrasonic vibration electrical discharge machining in gas. J. Mater. Processing Technol. 2002, 129, 135–138. [Google Scholar] [CrossRef]
  22. König, W.; Klocke, F.; Sparrer, M. EDM-sinking using water-based dielectrics and electropolishing—A new manufacturing sequence in tool-making. In Proceedings of the 11th International Symposium on Electromachining (ISEM XI), Lausanne, Switzerland, 17–21 April 1995; pp. 225–234. [Google Scholar]
  23. Chen, S.L.; Yan, B.H.; Huang, F.Y. Influence of kerosene and distilled water as dielectrics on the electric discharge machining characteristics of Ti-6Al-4V. J. Mater. Process. Technol. 1999, 87, 107–111. [Google Scholar] [CrossRef]
  24. Tang, L.; Du, Y. Experimental study on green electrical discharge machining in tap water of Ti-6Al-4V and parameters optimization. Int. J. Adv. Manuf. Technol. 2014, 70, 469–475. [Google Scholar] [CrossRef] [Green Version]
  25. Kunieda, M.; Furuoya, S.; Taniguchi, N. Improvement of EDM Efficiency by Supplying Oxygen Gas into Gap. Ann. Cirp. 1991, 40, 215–218. [Google Scholar] [CrossRef]
  26. Valaki, J.B.; Rathod, P.P. Assessment of operational feasibility of waste vegetable oil based bio-dielectric fluid for sustainable electric discharge machining (EDM). Int. J. Adv. Manuf. Technol. 2016, 87, 1509–1518. [Google Scholar] [CrossRef]
  27. Ng, P.S.; Kong, S.A.; Yeo, S.H. Investigation of biodiesel dielectric in sustainable electrical discharge machining. Int. J. Adv. Manuf. Technol. 2016, 90, 1–8. [Google Scholar] [CrossRef]
  28. Valaki, J.B.; Rathod, P.P.; Khatri, B. Investigations on Palm Oil based Biodielectric Fluid for Sustainable Electric Discharge Machining. In Proceedings of the International Conference on Advances in Materials and Manufacturing (ICAMM-2016), Bangkok, Thailand, 29–30 October 2016. [Google Scholar]
  29. Valaki, J.B.; Rathod, P.P.; Sankhavara, C.D. Investigations on technical feasibility of Jatropha curcas oil based bio dielectric fluid for sustainable electric discharge machining (EDM). J. Manuf. Processes 2016, 22, 151–160. [Google Scholar] [CrossRef]
  30. Khan, M.Y.; Rao, P.S.; Pabla, B.S. Investigations on the feasibility of jatropha curcas oil based biodiesel for sustainable dielectric fluid in edm process. Mater. Today Proc. 2020, 26, 335–340. [Google Scholar] [CrossRef]
  31. Das, S.; Paul, S.; Doloi, B. Feasibility investigation of neem oil as a dielectric for electrical discharge machining. Int. J. Adv. Manuf. Technol. 2020, 106, 1–11. [Google Scholar] [CrossRef]
  32. Abdullahi, U.U.; Bashi, S.M.; Yunus, R.; Mohibullah; Nurdin, H.A. The potentials of palm oil as a dielectric fluid. In Proceedings of the National Power and Energy Conference, Kuala Lumpur, Malaysia, 29–30 November 2004; pp. 29–30, 224–228.
  33. Paramashivan, S.S.; Mathew, J.; Mahadevan, S. Mathematical modeling of aerosol emission from die sinking electrical discharge machining process. Appl. Math. Modell. 2012, 36, 1493–1503. [Google Scholar] [CrossRef] [Green Version]
  34. Ming, W.Y.; Zhang, Z.; Wang, S.Y.; Huang, H.; Zhang, Y.M.; Zhang, Y.; Shen, D.L. Investigating the energy distribution of workpiece and optimizing process parameters during the EDM of Al6061, Inconel718, and SKD11. Int. J. Adv. Manuf. Technol. 2017, 92, 1–18. [Google Scholar] [CrossRef]
  35. Lin, Y.; Chen, Y.; Wang, D.; Lee, H.O. Optimization of machining parameters in magnetic force assisted EDM based on Taguchi method. J. Mater. Processing Technol. 2009, 209, 3374–3383. [Google Scholar] [CrossRef]
  36. Ming, W.Y.; Hou, J.J.; Zhang, Z.; Huang, H.; Xu, Z.; Zhang, G.J.; Huang, Y. Integrated ANN-LWPA for cutting parameter optimization in WEDM. Int. J. Adv. Manuf. Technol. 2016, 84, 1277–1294. [Google Scholar] [CrossRef]
  37. Ming, W.Y.; Xie, Z.B.; Ma, J.; Du, J.G.; Zhang, G.J.; Cao, C.; Zhang, Y. Critical review on sustainable techniques in electrical discharge machining. J. Manuf. Processes 2021, 72, 375–399. [Google Scholar] [CrossRef]
  38. Ming, W.Y.; Zhang, S.F.; Zhang, G.J.; Du, J.G.; Ma, J.; He, W.B.; Cao, C.; Liu, K. Progress in modeling of electrical discharge machining process. Int. J. Heat Mass Transf. 2022, 187, 122563. [Google Scholar] [CrossRef]
  39. Huang, Y.; Ming, W.Y.; Guo, J.W.; Zhang, Z.; Liu, G.D.; Li, M.Z.; Zhang, G.J. Optimization of cutting conditions of YG15 on rough and finish cutting in WEDM based on statistical analyses. Int. J. Adv. Manuf. Technol. 2013, 69, 993–1008. [Google Scholar] [CrossRef] [Green Version]
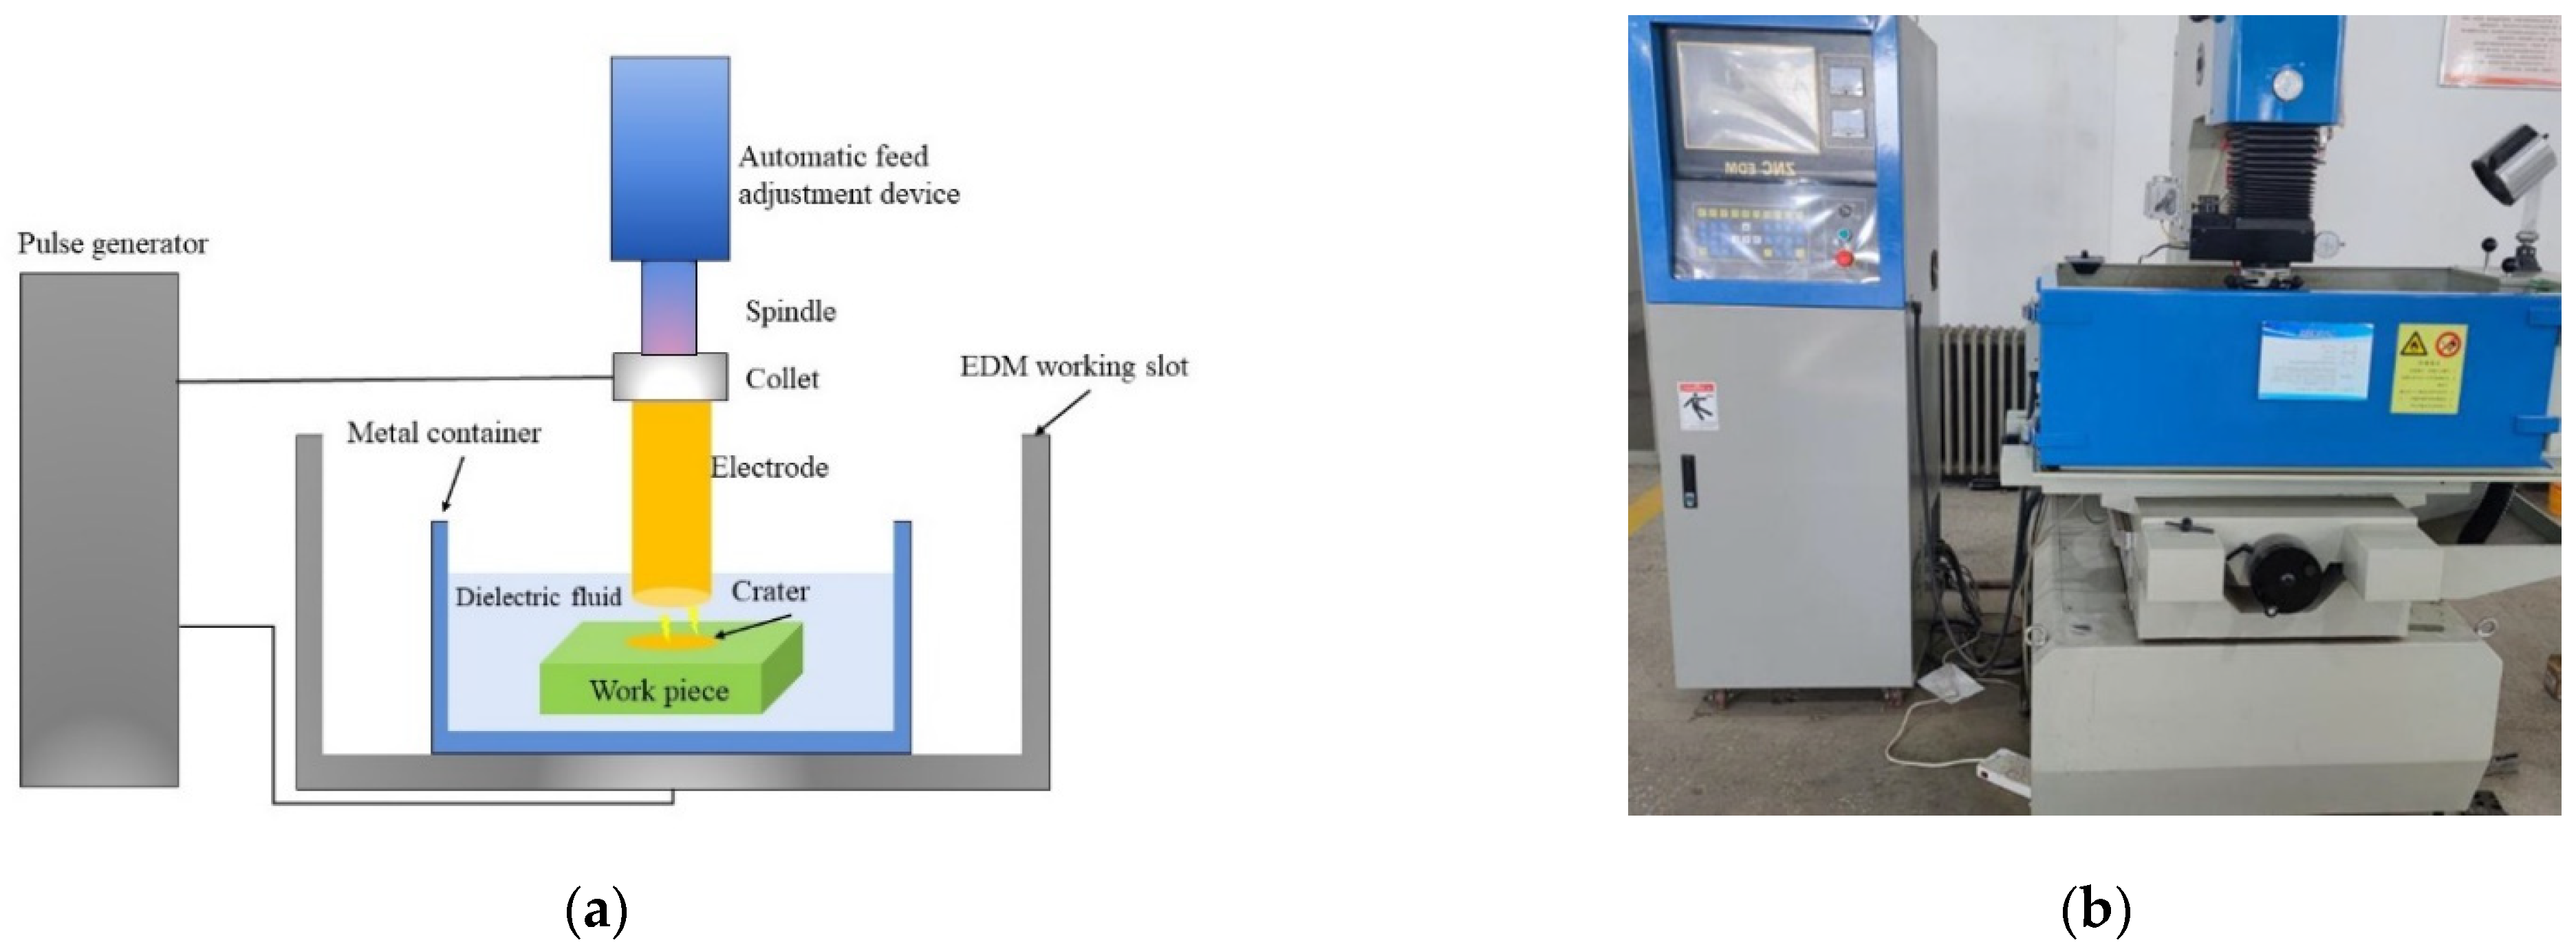
Figure 1. Schematic diagram of processing and experimental equipment; (a) schematic diagram of machining process; (b) EDM machine used in the experiment.
Crystals 12 00291 g001
Figure 2. The influence of current, duty ratio, pulse duration, electrode and dielectric on MRR.
Crystals 12 00291 g002
Figure 3. The influence of low-viscosity and high-viscosity dielectrics on discharge channels and processing performance.
Crystals 12 00291 g003
Figure 4. The influence of current, duty ratio, pulse duration, electrode and dielectric on Ra.
Crystals 12 00291 g004
Figure 5. The influence of current, duty ratio, pulse duration, electrode and dielectric on EEV.
Crystals 12 00291 g005
Figure 6. The influence of current, duty ratio, pulse duration, electrode and dielectric on EEC.
Crystals 12 00291 g006
Figure 7. Processing performance comparison of electrodes in SSO and kerosene; (a) MRR comparison of electrodes in SSO and kerosene; (b) EEV comparison of electrodes in SSO and kerosene; (c) Ra comparison of electrodes in SSO and kerosene; (d) Comparison of electrode EEC in SSO and kerosene.
Crystals 12 00291 g007
Figure 8. Debris distribution on different process parameters; (a) SSO, 3A, 0.7, 350 µs, W; (b) kerosene, 3A, 0.7, 350 µs, W; (c) SSO, 4A, 0.5, 250 µs, Cu-W; (d) kerosene, 4A, 0.5, 250 µs, Cu-W; (e) SSO, 5A, 0.4, 150 µs, Graphite; (f) kerosene, 5A, 0.4, 150 µs, Graphite.
Crystals 12 00291 g008
Figure 9. Interaction effect on MRR; (a) current and duty ratio on MRR; (b) current and pulse duration on MRR; (c) current and tool electrode on MRR; (d) duty ratio and pulse duration on MRR.
Crystals 12 00291 g009
Figure 10. Interaction effect on Ra; (a) current and duty ratio on Ra; (b) current and pulse duration on Ra; (c) current and tool electrode on Ra; (d) duty ratio and pulse duration on Ra.
Crystals 12 00291 g010
Figure 11. Interaction effect on EEV; (a) current and duty ratio on EEV; (b) current and pulse duration on EEV; (c) current and tool electrode on EEV; (d) duty ratio and pulse duration on EEV.
Crystals 12 00291 g011
Figure 12. Interaction effect on EEC; (a) current and duty ratio on EEC; (b) current and pulse duration on EEC; (c) current and tool electrode on EEC; (d) duty ratio and pulse duration on EEC.
Crystals 12 00291 g012
Figure 13. Comparison of the influence of parameters on processing performance; (a) influence of process parameters on MRR; (b) influence of process parameters on Ra; (c) influence of process parameters on EEV; (d) influence of process parameters on EEC.
Crystals 12 00291 g013
Table 1. Comparison of physical properties of Cu, W, Cu-W and graphite electrodes.
MaterialsMelting Point (°C)Boiling Point (°C)Resistivity (Ω·m)Specific Heat Capacity (J/(kg·K))Thermal Conductivity (J/(m·s·k))Density (g/cm³)
W341059305.48 × 10−84.9117019.3
Cu108325951.75 × 10−8393.564018.9
Cu-W271149304.36 × 10−8117.2724013.8
Graphite372748306.1 × 10−81774.7802.2
Table 2. Comparison of physical properties of SSO and Kerosene.
DielectricViscosity
(at 40 °C)
Flash Point
(°C)
Burning
Point (°C)
Density
(g/cm3)
SSO4.93303550.92
Kerosene2.7147520.8
Table 3. Orthogonal experimental design with 1 factor under 2 levels and 4 factors under 4 levels.
LevelDI (A)Duty RatioTon (µs)TE
1SSO20.450Cu
2Kerosene30.5150W
3 40.6250Cu-W
4 50.7350Graphite
Table 4. L32 (21 × 44) mixed orthogonal experimental results for machine SKD11.
NumberDI (A)Duty RatioTon (µs)TERa (µm)MRR (mm3/min)EEV (kJ/mm3)EEC
(µg/min)
1120.45012.25130.34083.521357.7735
2120.515023.40470.29515.083051.2856
3120.625031.71030.36124.983561.8735
4120.735042.78800.43124.870670.5176
5130.45023.00230.87552.056132.8438
6130.515012.61581.05642.129944.8150
7130.625043.62601.48931.8129119.8800
8130.735032.73301.04903.002893.1107
9140.55033.44902.76691.0842177.6000
10140.415044.21302.25911.062497.8612
11140.725014.29273.84191.0932141.0353
12140.635023.59752.66901.348881.9692
13150.55043.69654.43520.8455107.7573
14150.415035.32337.73320.3879115.5470
15150.725025.10026.70210.783381.9692
16150.635014.68584.04821.1116266.4000
17220.75012.37232.03781.030537.7575
18220.615022.52130.67172.679871.0400
19220.525031.85370.43613.439243.2000
20220.435043.25400.19226.244832.5098
21230.75023.40153.50690.898293.1107
22230.615012.73501.58731.701087.1855
23230.525043.09370.61933.633276.1143
24230.435032.33130.92511.945730.5427
25240.65032.65156.09280.5909111.5163
26240.715044.03041.05823.968935.6520
27240.425012.60781.46761.635354.4909
28240.535022.64931.58731.890059.9400
29250.65044.14309.27980.4849141.0353
30250.715034.69039.42480.5570239.7600
31250.425024.83134.50140.666591.3371
32250.535012.54701.72832.1697208.4870
Table 5. Experimental parameters for debris analysis.
NumberDielectricI (A)Duty RatioTon (µs)Electrode
1SSO30.7350W
2Kerosene30.7350W
3SSO40.5250Cu-W
4Kerosene40.5250Cu-W
5SSO50.4150Graphite
6Kerosene50.4150Graphite
Publisher’s Note: MDPI stays neutral with regard to jurisdictional claims in published maps and institutional affiliations.