Article

Experimental Study on True Triaxial Mechanical Properties of Frozen Calcareous Clay under the Influence of Multiple Factors

1
School of Civil Engineering and Architecture, Anhui University of Science and Technology, Huainan 232001, China
2
Anhui Provincial Key Laboratory of Building Structure and Underground, Anhui Jianzhu University, Hefei 230601, China
*
Author to whom correspondence should be addressed.
Crystals 2022, 12(3), 328; https://doi.org/10.3390/cryst12030328
Submission received: 5 January 2022 / Revised: 30 January 2022 / Accepted: 31 January 2022 / Published: 26 February 2022

Abstract

:
To investigate the mechanical properties of frozen saline soil, the deep calcareous clay in the Huanghuai mining area was chosen as the research object, and an orthogonal test was carried out to study the true triaxial mechanical properties of frozen saline calcareous clay under the influence of multiple factors. The stress–strain characteristics, strength, and influence trend of salted frozen calcareous clay with different salt content, stress paths, and water content, and the relationships among the above-mentioned factors, were investigated. The analysis of the test results by an orthogonal test revealed the order of importance of the factors that influenced strength. The primary and secondary order of influence σ1 is as follows: confining pressure σ3, water content ω, temperature T, medium principal stress coefficient b, and salt content φ. Under the influence of multiple factors, the strength of frozen soil in the real state is not the result of single factors with independent influences that are then simply superimposed. Instead, the complex interactions of various factors affect strength. The stress path significantly influences the stress–strain relationship of frozen calcareous clay. As the coefficient of the intermediate principal stress b increases, its influence on the strength of salted frozen calcareous clay diminishes, and the optimal principal stress coefficient b = 0.33 maximizes the strength of the specimen. The influence of the moisture content on the strength of the sample is negatively correlated. The effect of different moisture contents on the deformation and failure characteristics of unsaturated saline calcareous clay is not significantly different, and this difference does not exceed 5%.

1. Introduction

The artificial ground freezing curtain is used as a temporary support measure for underground structures because it creates dry conditions for underground engineering construction. The freezing curtain does not only need to satisfy the requirements of sealing water, but its strength must also satisfy the requirements of engineering safety construction, which is a top priority in design. Unlike conventional soil, frozen soil has a low strength owing to different factors such as its moisture content [1,2,3,4], dry density [5,6,7], loading method or rate [8,9], confining pressure [10,11], and so on. The advantage of permafrost cannot be effectively reflected. Frozen soil is generally a four-phase system, and various factors exert significant and complex effects on the strength of permafrost. For example, it has been reported [12,13] that temperature is the most important factor influencing the strength of permafrost, and the freezing of water greatly increases the cement strength between soil particles. Additionally, more water in the soil means that the volume of ice crystals increases at low temperatures, which in turn increases the strength of frozen soil [14]. Cai et al. [15], Xiao [16], and Sun et al. [17] reported that different soils have a corresponding optimal moisture content. When this value is exceeded, the strength of frozen soil does not increase and instead decreases. Xiao [16], Chen et al. [18], and Ma et al. [19] conducted frost heave tests on silt and clay under uniaxial test conditions, and established the relationships among uniaxial compressive strength, temperature, moisture content, and salt content. Pharr and Godavarti [20] investigated the unconfined compressive strength of salt-containing frozen sand under constant loading. Chen [21], Ma [22], Huang et al. [23] and others investigated artificially frozen sand, frozen clay, and frozen silt under different freezing temperatures, water contents, and loading rates. The mechanical properties of soil and their influences were described, and the corresponding criteria were initially established.
The influence of the above-mentioned factors can be determined through unconfined or conventional frozen soil triaxial tests. Among the rock and soil strength factors, the influence of intermediate principal stress cannot be ignored. For this reason, Hu et al. [24] used a flexible true triaxial instrument to conduct a series of true triaxial tests on silty fine sand under different coefficients of intermediate principal stress, observing that the intermediate principal stress gradually increased from a small principal stress. The strength of the sand also increased, but when the principal stress increased and became large, the strength slightly decreased. Zhang et al. [25] investigated the stress–strain relationship of soil under different coefficients of intermediate principal stress and different stress path conditions, elucidating the influence of the intermediate principal stress and stress path on the mechanical properties of soil. Previous studies [26,27] have investigated the influence of water content, consolidated confining pressure, the coefficient of intermediate principal stress, and intermediate principal stress ratio on the strength of frozen clay through true triaxial tests. Yang et al. [28] conducted a triaxial compression test on frozen silt at different temperatures and different confining pressures and obtained the relationship between the compressive strength of frozen silt, the temperature and confining pressure.
The above-mentioned studies clarified the unilateral relationship between the compressive strength of frozen soil and the temperature, water content, salinity, and coefficient of intermediate principal stress, but did not investigate the strength characteristics of frozen soil under the influence of multiple factors. Therefore, this study selected the deep calcareous clay in the Huanghuai mining area as the raw material and investigated the relationship between the strength of the frozen calcareous clay and different water content, salt content, temperature, confining pressure, and principal stress coefficient b by artificially mixing water and CaCl2. The relationships among the five factors were quantified to determine the degree of influence of each factor on the strength of frozen clay. Moreover, the influence trend of different moisture content and different principal stress coefficients on the strength of frozen clay was investigated in detail.

2. True Triaxial Test on Frozen Salted Calcareous Clay
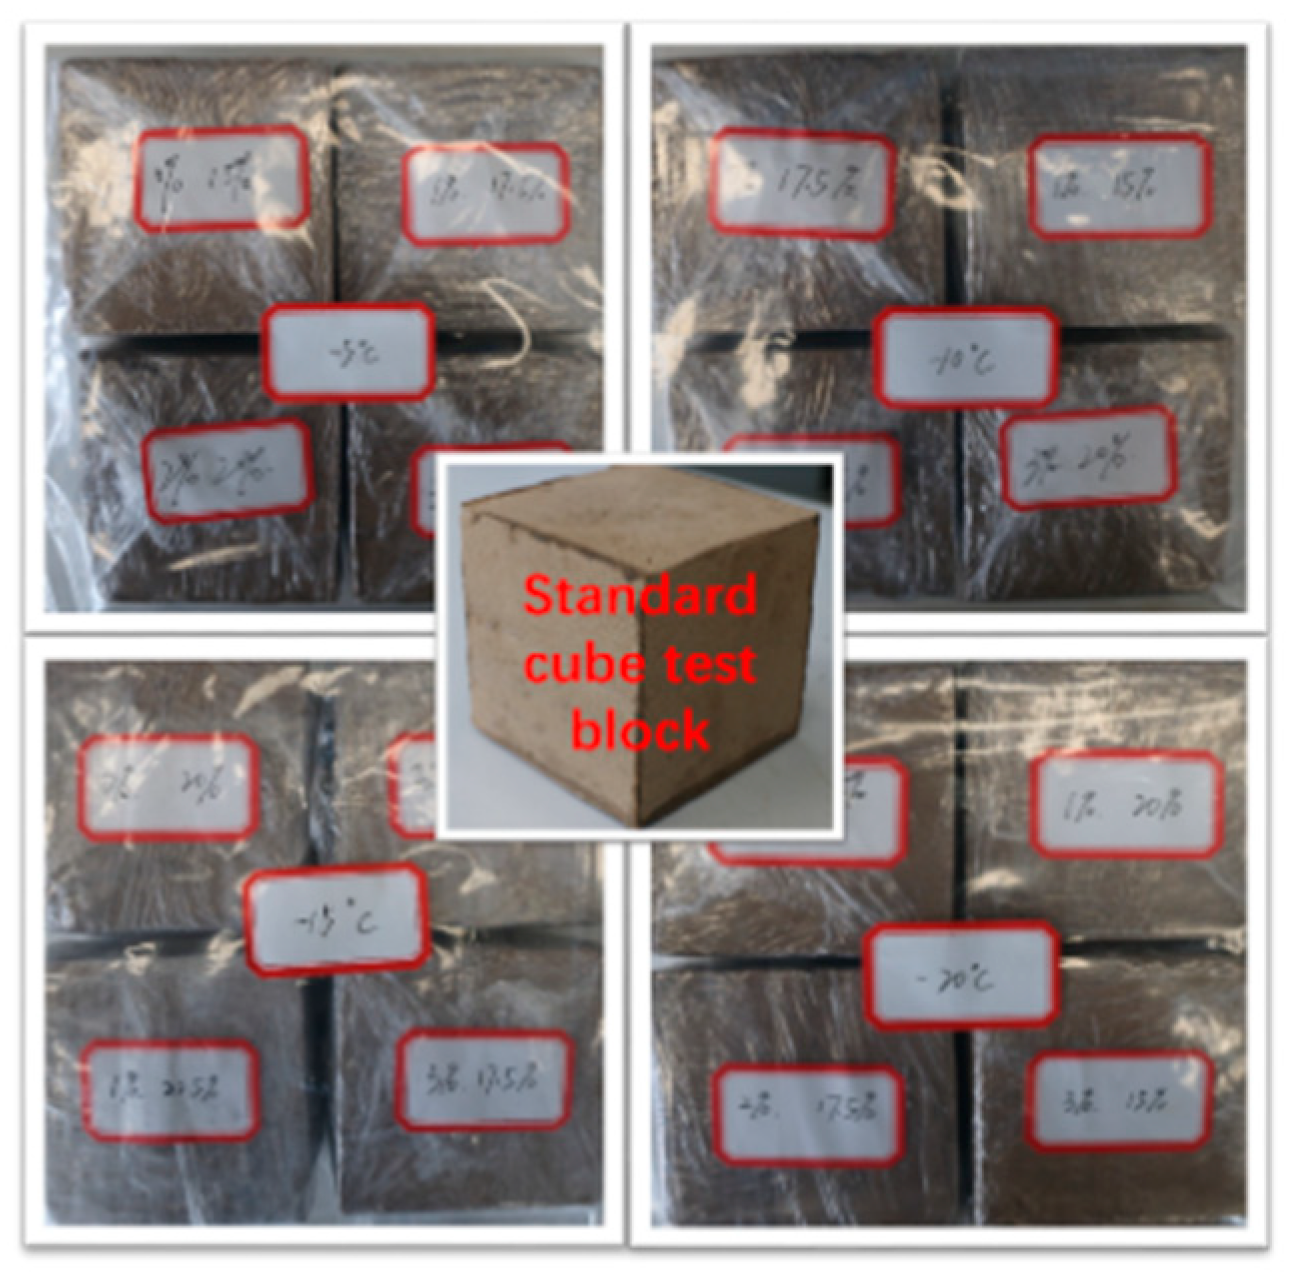
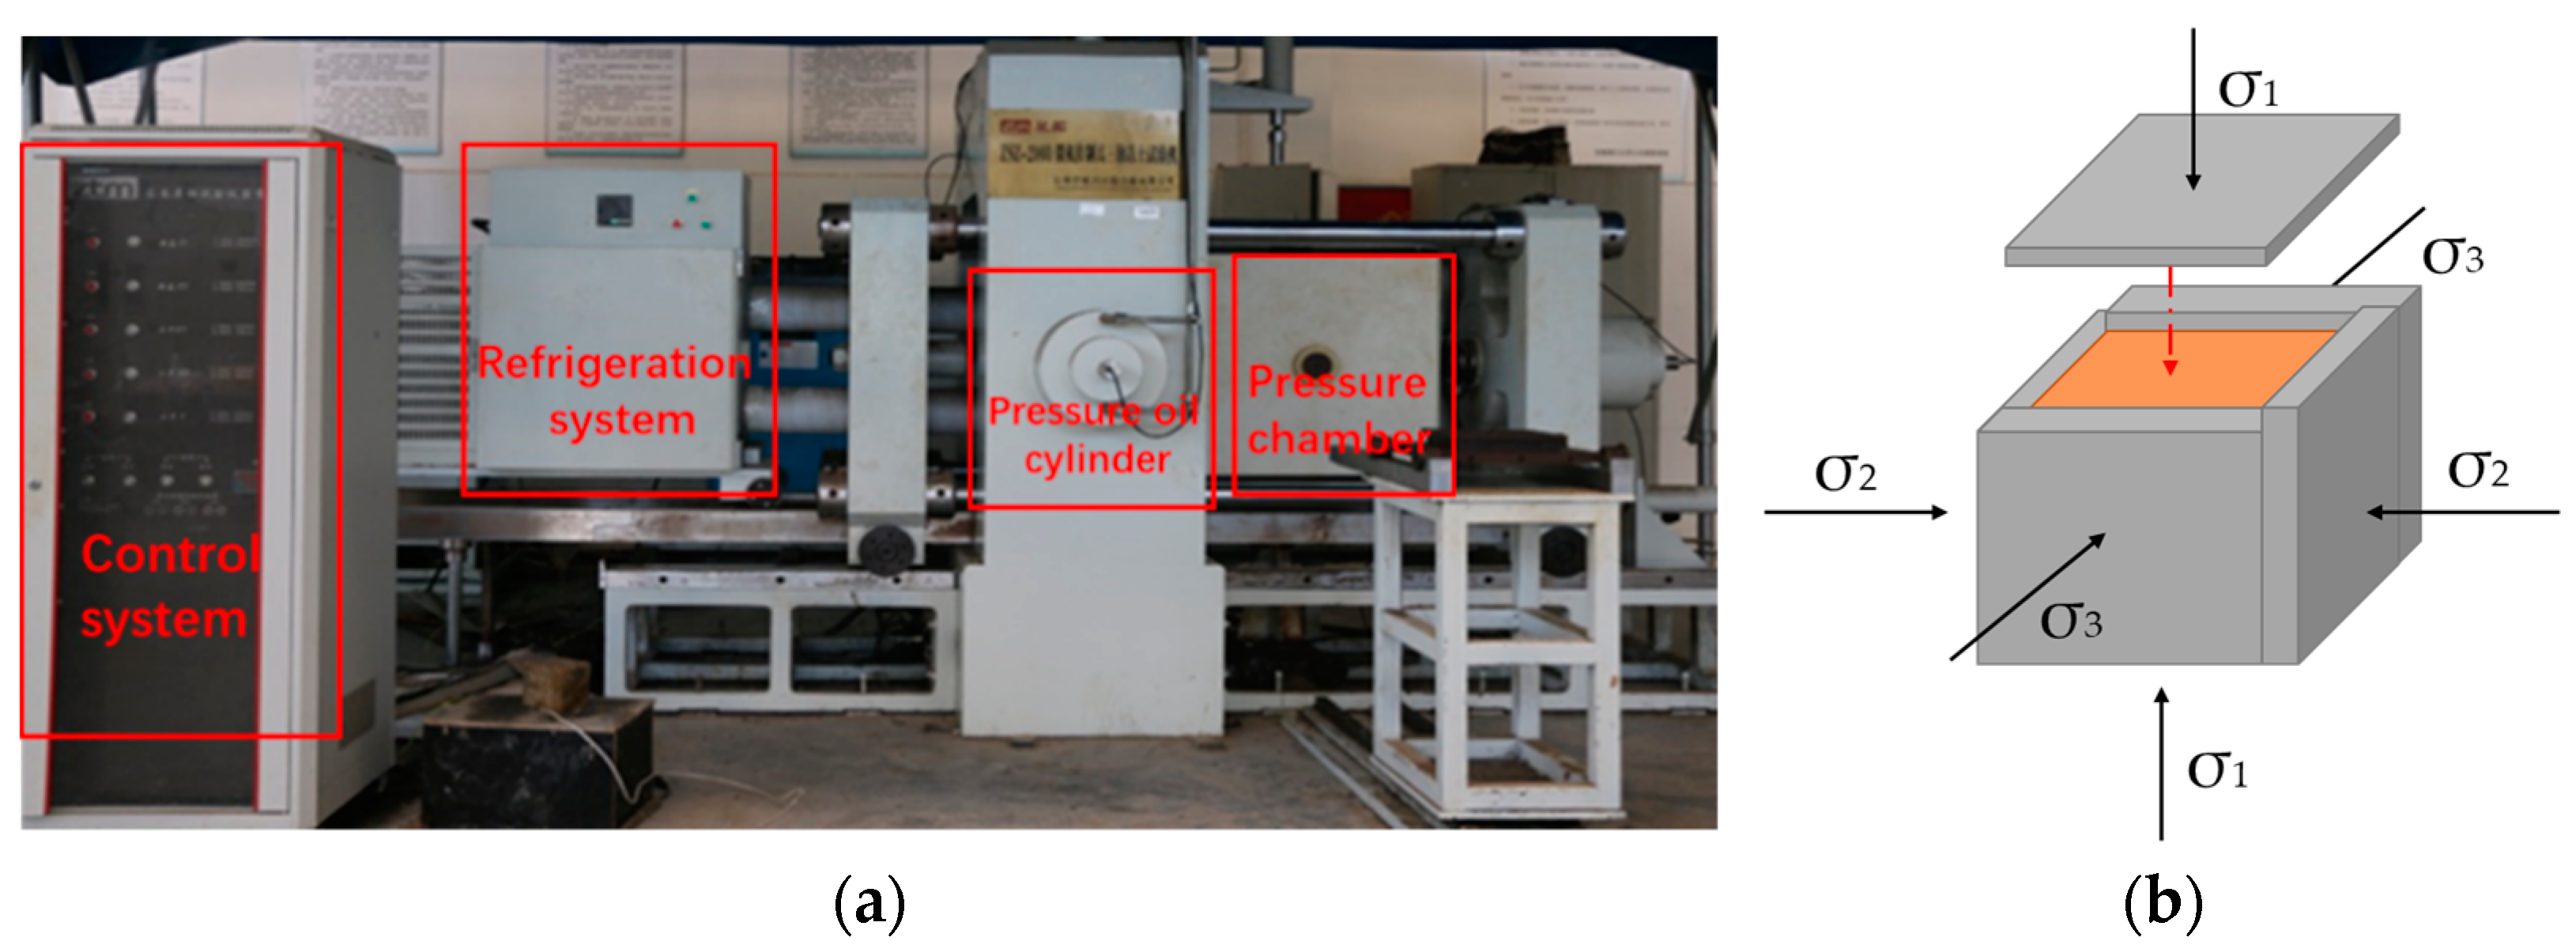
2.1. Test Plan

The sample soil material was obtained from a mine in the Huanghuai mining area, sealed and packaged, and transported back to the laboratory. The basic properties of the soil sample are listed in Table 1. Owing to the many factors considered in the experiment and the large number of experiments, the orthogonal method was adopted. Specifically, the 5-factor, 4-level, orthogonal test was adopted. The reference factors and levels are listed in Table 2. The temperature T, water content ω, salt content φ, confining pressure σ3, and coefficient of intermediate principal stress b are denoted as factors A, B, C, D, and E, respectively. The test was performed 16 times (not including the parallel test). The test plan is presented in Table 3.

2.2. Sample Preparation and Loading Mode

The frozen soil sample used in the true triaxial shear test was a cube with a size of 100 × 100 × 100 mm3, as shown in Figure 1. After the undisturbed soil sample was dried, ground, and sieved, it was sprayed with different concentrations of CaCl2 solution in layers, mixed evenly, placed in a zip-lock bag, allowed to stand for 24 h, and the dry density and volume of the sample were controlled. Mixed soil samples with a corresponding quality were packed and pressed in layers using an abrasive tool and were made into standard samples for later use. Before the test, the standard sample was frozen at the required low temperature for more than 48 h, and the true triaxial test was then carried out. The frozen soil test was conducted using a true triaxial test platform; the loading device is shown in Figure 2a.
The triaxial test platform can realize independent loading in the three principal stress directions (σ1, σ2, and σ3), and different stress paths in the three-dimensional stress space. The three principal stress directions are all loaded by rigid plates. Specifically, six steel plates are placed in a staggered manner such that they overlap each other and are individually controlled to realize the deformation of the sample during the compression process. The loading diagram is shown in Figure 2b.
This test adopts a loading method with a constant principal stress ratio b for control, as follows:
b = ( σ 2 σ 3 ) / ( σ 1 σ 3 )
During the test, σ3 is kept unchanged, and a true triaxial shear test with a constant b value through σ1 and σ2 is performed. The derivatives on both sides of Equation (1) can be obtained as follows:
σ ˙ 2 = b σ ˙ 1
The specific loading process is as follows: after the sample temperature reaches the temperature required by the test and the temperature stabilizes for half an hour, σ3 is first pressed simultaneously in three directions, such that the sample can stabilize and consolidate under equal stress in three directions until the deformation of the sample does not change. Then, σ1 and σ2 are applied with different loading rates in two directions, and the ratio of the two-way loading rates is equal to b, as required by the true triaxial test, wherein b is unchanged. Failure is considered to have occurred when the deformation in the direction of the major principal strain reaches 15 mm, that is, ε1 = 15%, or when the test monitoring curve indicates that the corresponding strength value is the failure strength, when the sample is clearly damaged.

3. Test Results and Analysis

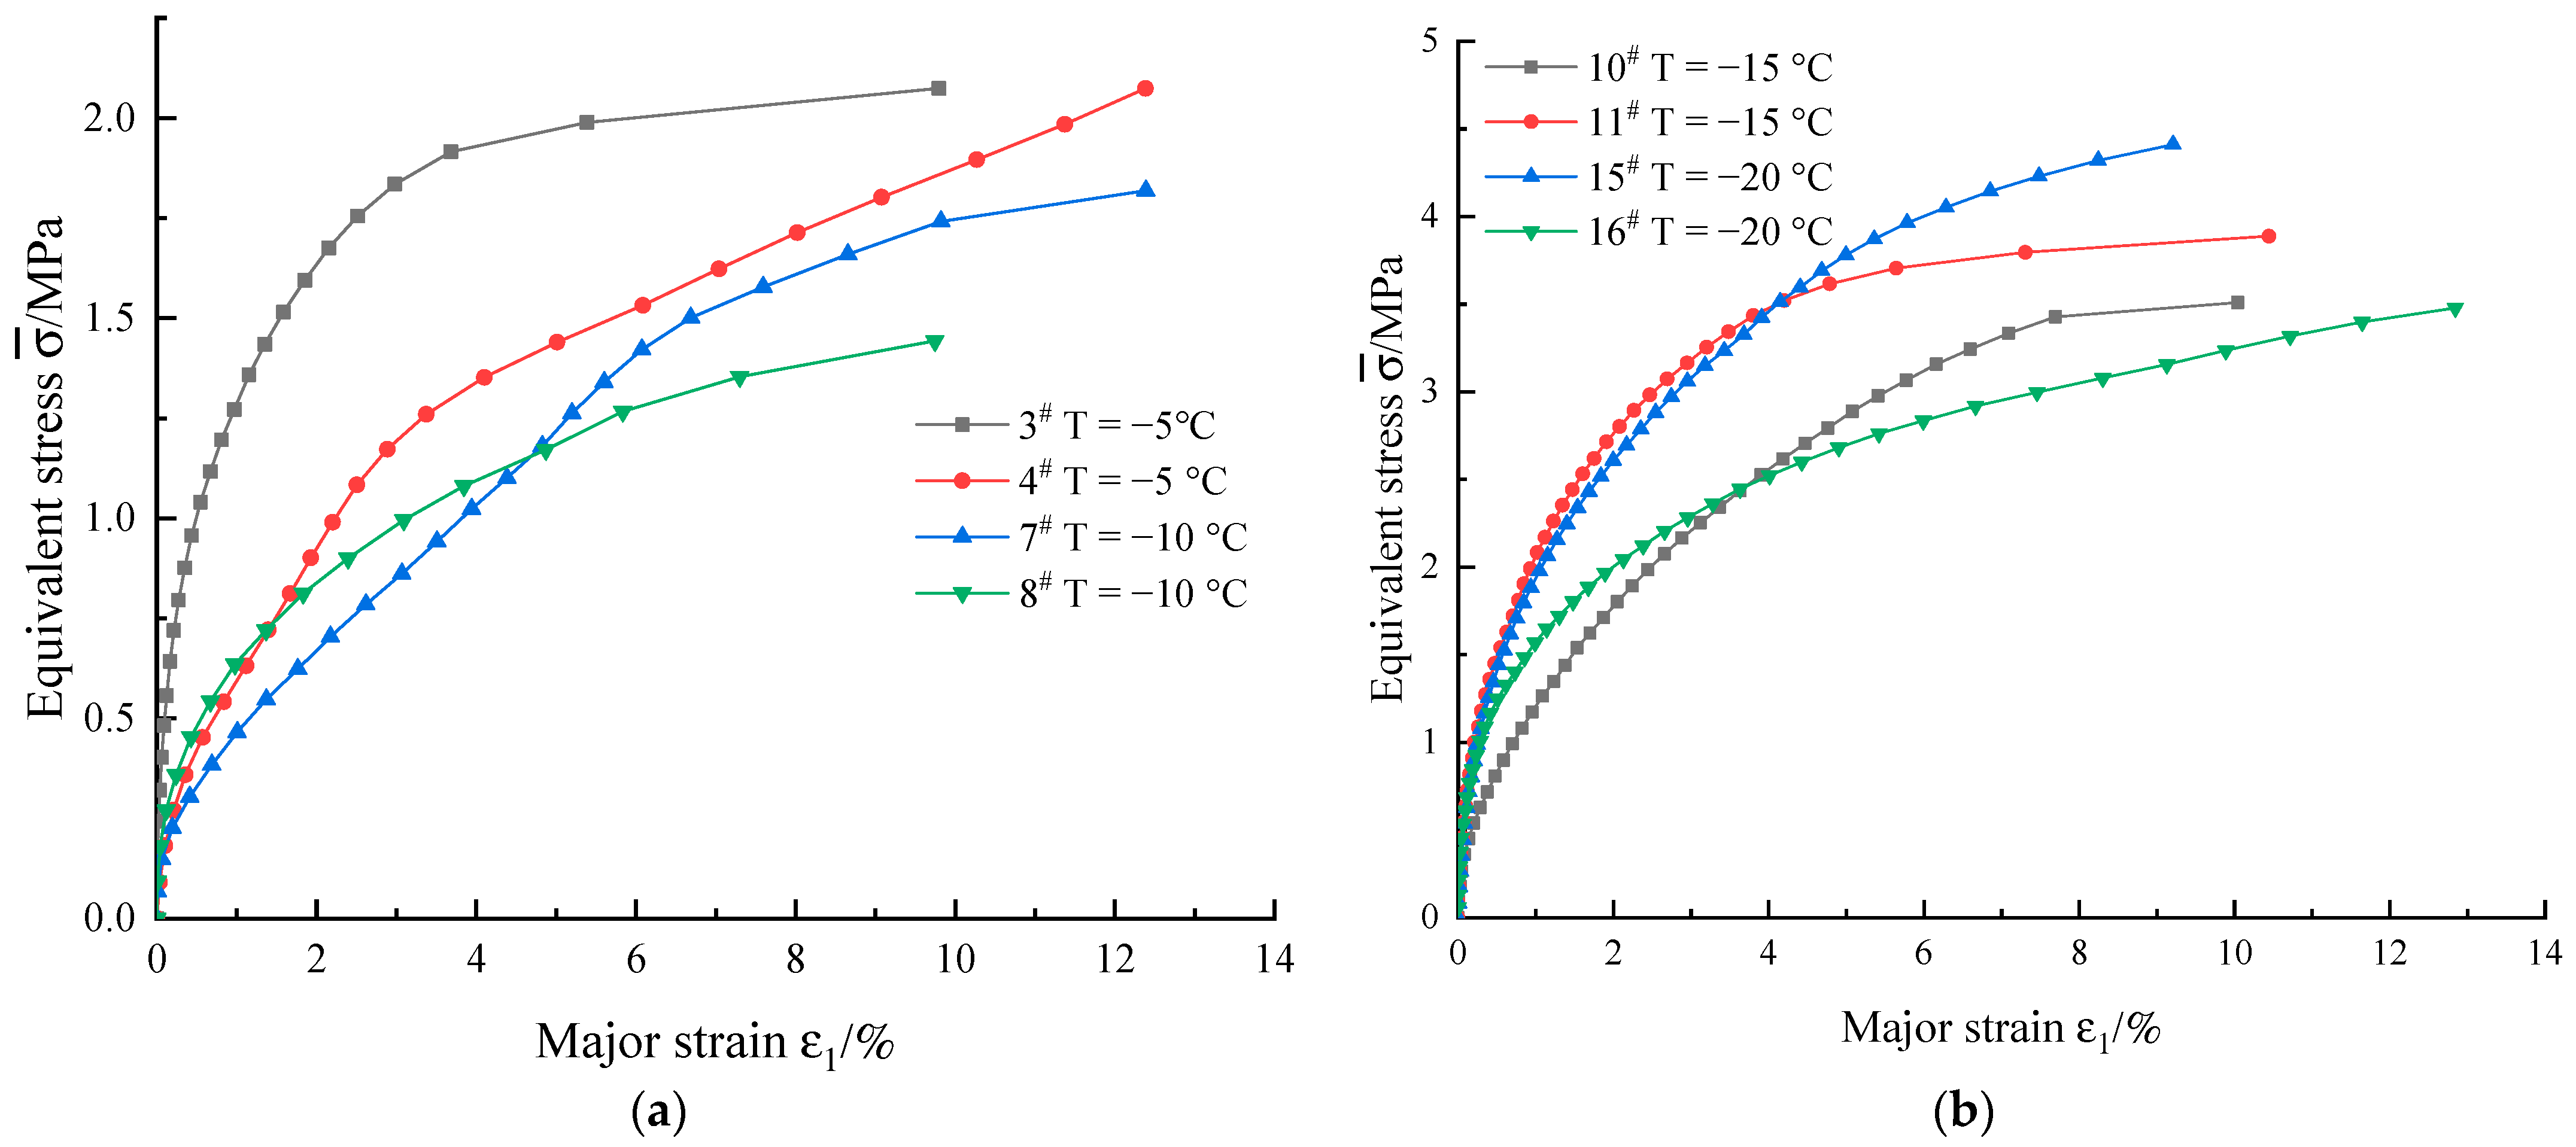
3.1. Stress–Strain Relationship Curve

Through the true triaxial orthogonal test on frozen soil, the influence of temperature T, water content ω, salt content φ, confining pressure σ3, and the coefficient of intermediate principal stress b on the macroscopic strength of frozen saline calcareous clay were investigated for better characterization. The stress–strain relationship of frozen soil was investigated under true triaxial conditions, and the stress in the test curve was the equivalent stress σ ¯ , as expressed by Equation (3). The equivalent stress–strain curve of each group of tests is shown in Figure 3, and the results for the large principal stress peak value σ1max corresponding to each group of tests are presented in Table 4.
σ ¯ = 1 2 ( σ 1 σ 2 ) 2 + ( σ 2 σ 3 ) 2 + ( σ 3 σ 1 ) 2
As shown in Figure 3, the equivalent stress–strain relationship curve of frozen calcareous clay can essentially be divided into three stages—(1) Initial linear elastic stage: when the strain ε1 < 0.5% in the major principal strain direction, the equivalent stress–strain curve is approximately linear. The main reasons for this are as follows: the frozen calcareous clay was dense, the integrity of the sample was not damaged in the initial low-stress stage, and the sample had a high water content. After a long period of freezing and confining pressure consolidation, the ice-crystal-cemented object provided a part of the instantaneous strength and resistance to small deformation, which made the equivalent stress–strain curve exhibit linear elastic change. (2) Plastic deformation stage: the equivalent stress–strain curve of the sample exhibited nonlinear change, the curve gradually curved downwards, the slope gradually decreased as the strain increased, and the stress continuously increased. During this period, owing to the continuous increase in the confining pressure, the sample was further compacted; the soil particles, voids, and ice crystal particles inside the soil sample were rearranged; and the strength of the soil sample improved further. As the stress increased, the cementation between the clay particles and the ice crystals inside the sample became damaged, which manifested as the weakening of resistance to the sample’s deformation, and the tendency of the stress to increase with the strain began to slow down. (3) Strain hardening failure stage: as the equivalent stress–strain curve of the specimen increased, the stress increased continuously.
As shown in Figure 3, frozen soil is a complex four-phase system influenced by the interaction of multiple factors. In an actual situation, the strength of frozen soil is not affected independently by various factors whose influences are then simply superimposed. Instead, the relationships among the various factors and the interrelated effects are significant. For example, water content is a decisive factor influencing the volume of ice in frozen soil. An increase in salinity will reduce the freezing temperature of the water in the soil; thus, it becomes difficult to freeze, and the volume of ice and strength will eventually decrease. Moreover, the application of confining pressure will produce a compression–thaw effect in the frozen soil, and the melting of ice crystal cement will affect the strength of the soil. Hence, the strength is affected by the complex interactions of various factors.

3.2. Strength Characteristics and Analysis

3.2.1. Analysis of the Degree of Influence of Different Factors

To investigate the influence of various control factors on the strength of frozen calcareous clay under true triaxial test conditions, based on Equation (2) and the test results presented in Table 4, the orthogonal test analysis method was used to obtain the degree of each factor’s influence on the frozen calcareous clay and the corresponding trends, as shown in Figure 4. To investigate the degree of influence exerted by various factors on the large principal stress σ1 and intermediate principal stress σ2 of frozen saline calcareous clay, a range analysis was carried out for the above-mentioned results. The analysis results are presented in Table 5 and Table 6.
From Figure 4, the influence of various factors on the strength of calcareous clay can be summarized as follows: the value of the large principal stress σ1 and intermediate principal stress σ2 decrease as the water content increases; increase with the confining pressure and coefficient of intermediate principal stress; first increase and then decrease with the increase in salt content; and first decrease, then increase, and then gradually decrease with the increase in temperature. The large principal stress and medium principal stress are complicated by various factors.
The comparison of the R values in Table 5 reveals that the primary and secondary order determining the factors affecting the large principal stress σ1 is as follows: confining pressure σ3, water content ω, temperature T, coefficient of intermediate principal stress b, salt content φ; the R value of the confining pressure and moisture content is much higher than that of the latter three factors. By comparing the value of k, it can be found that, compared with the temperature T, the middle principal stress coefficient b, salt content φ, and moisture content ω clearly affects the peak strength of the sample. The confining pressure σ3 significantly affects the peak strength of the sample; the confining pressure is positively correlated, while the water content is negatively correlated. The comparison of the R values in Table 6 reveals that the primary and secondary order determining the factors affecting the intermediate principal stress σ2 is as follows: the coefficient of intermediate principal stress b, confining pressure σ3, water content ω, temperature T, and salt content φ. By comparing the values of k, it can be found that the coefficients of the intermediate principal stress b, confining pressure σ3, and temperature T are positively correlated with the intermediate principal stress σ3. The coefficient of the intermediate principal stress b and the confining pressure σ3 significantly affect the intermediate principal stress σ2 and water content ω; the intermediate principal stress σ2 is negatively correlated. By comparing the values of k, it can be found that factor C, that is, the salt content φ, has a certain influence on the peak strength and intermediate principal stress of frozen calcareous clay compared with the other four factors. The significance is weak and the four levels exhibit the trend of first increasing, and then decreasing.
The presence of salt changes the concentration of the water solution in the sample, and thereby changes the freezing temperature of the sample. As the CaCl2 content increases, the salt from the crystallization increases, and the concentration of the salt solution in the soil decreases. During the freezing process, the soil is not frozen. As the water content decreases, the strength of the soil increases with the salt content. As the CaCl2 content in the soil continues to increase, the concentration of the soil pore solution becomes larger, the water becomes difficult to freeze, and the unfrozen water content increases. Therefore, as the salt solution concentration increases, the peak strength decreases, and the soil strength first increases and then decreases.
The coefficient of intermediate principal stress reflects the magnitude of the intermediate principal stress. Therefore, this factor exerts the most significant influence on the intermediate principal stress. Evidently, with greater compaction, the presence of an external force increases the friction on the sliding surface, the cohesive force, and the peak strength, as has been reported by previous studies [1]. Temperature is the main factor affecting the strength of frozen soil, owing to the low-temperature environment. The moisture in the sample freezes, and as the temperature decreases, the volume percentage of ice crystal cementation becomes larger and the unfrozen water content decreases, which in turn increases the bond strength between the soil particles and results in a higher strength.

3.2.2. Trend Analysis of Strength-Influencing Factors

To systematically investigate the relationship among the peak stress σ1 and intermediate principal stress σ2 of frozen calcareous clay and five factors (confining pressure σ3, water content ω, temperature T, coefficient of intermediate principal stress b, and salt content φ) according to dimensional analysis theory, an exponential function was used to fit the test data in Table 4 in Origin; the calculation formula is expressed as follows:
σ 1 = 87.0698 T 0.1975 ω 1.23085 φ 0.01043 σ 3 0.59654 b 0.02827 , R 2 = 0.96753
To more intuitively observe the influence trend of the test parameters on the large principal stress σ1 and intermediate principal stress σ2 of the sample, the optimal level was determined by a range analysis as follows: T = −10 °C, salt content φ = 1%, b = 1. The three-dimensional trend chart of the confining pressure σ3, water content ω, and major principal stress σ1 is shown in Figure 5a. For T = −10 °C, salt content φ = 15% and water content ω = 15%; the three-dimensional trend chart of the confining pressure σ3, Bishop parameter b, and intermediate principal stress σ2 is as shown in Figure 5b.
As shown in Figure 5a, as the confining pressure increased, the large principal stress σ1 significantly increased, and the strength of the sample decreased as the water content increased. The change in the water content does not significantly affect the large principal stress σ1. For example, when the confining pressure was 1 MPa, the major principal stress with a water content of 15% was 4.895 MPa, the major stress with a water content of 22.5% was 2.972 MPa, which marks a reduction of 1.923 MPa, and the rate of change was 39.3%. The confining pressure has a significant effect on the large principal stress σ1. For example, when the water content was 15%, the large principal stress with a confining pressure of 1 MPa was 4.895 MPa; the large principal stress with a confining pressure of 4 MPa was as high as 11.193 MPa, which marks an increase of 6.298 MPa; and the rate of change was 56.3%. Figure 5b shows that, as the confining pressure and coefficient of intermediate principal stress b increased, the intermediate principal stress also significantly increased. For example, when the confining pressure was 4 MPa, the coefficient of intermediate principal stress b increased from 0 to 1. The corresponding intermediate principal stress increased from 3.747 MPa to 9.128 MPa, which marks an increase of 5.381 MPa, and the rate of change was 59%. Therefore, the difference in the degree of influence of the coefficient of intermediate principal stress b and the confining pressure σ3 on the intermediate principal stress σ2 is not clear. An analysis of the reasons for this behavior reveals that, under the action of confining pressure, the solid particles, ice crystal particles, and voids inside the sample were rearranged, the sample tended to bear the peak state, and the bearing capacity continued to increase. Owing to the different loading stress paths, the resulting deformation is different, that is, each stress path exerted a different effect on the deformation. The impact of different stress paths on the strength of the soil is mainly reflected by the shear along different stress-loading paths, and the soil will produce different peak strengths. As the middle principal stress coefficient increased, the ability of frozen soil to resist deformation became stronger, and the effect became more apparent. As the b value increased, the slope of the curved surface became steeper. When b = 0.33, the curved surface became steeper and the slope deflection was apparent.
The above analysis reveals that the freezing temperature was between −5 °C and −10 °C, and the salt content was within the range of 0–3%. The main factors affecting the large principal stress σ1 and the intermediate principal stress σ2 are the confining pressure, water content, and coefficient of intermediate principal stress.

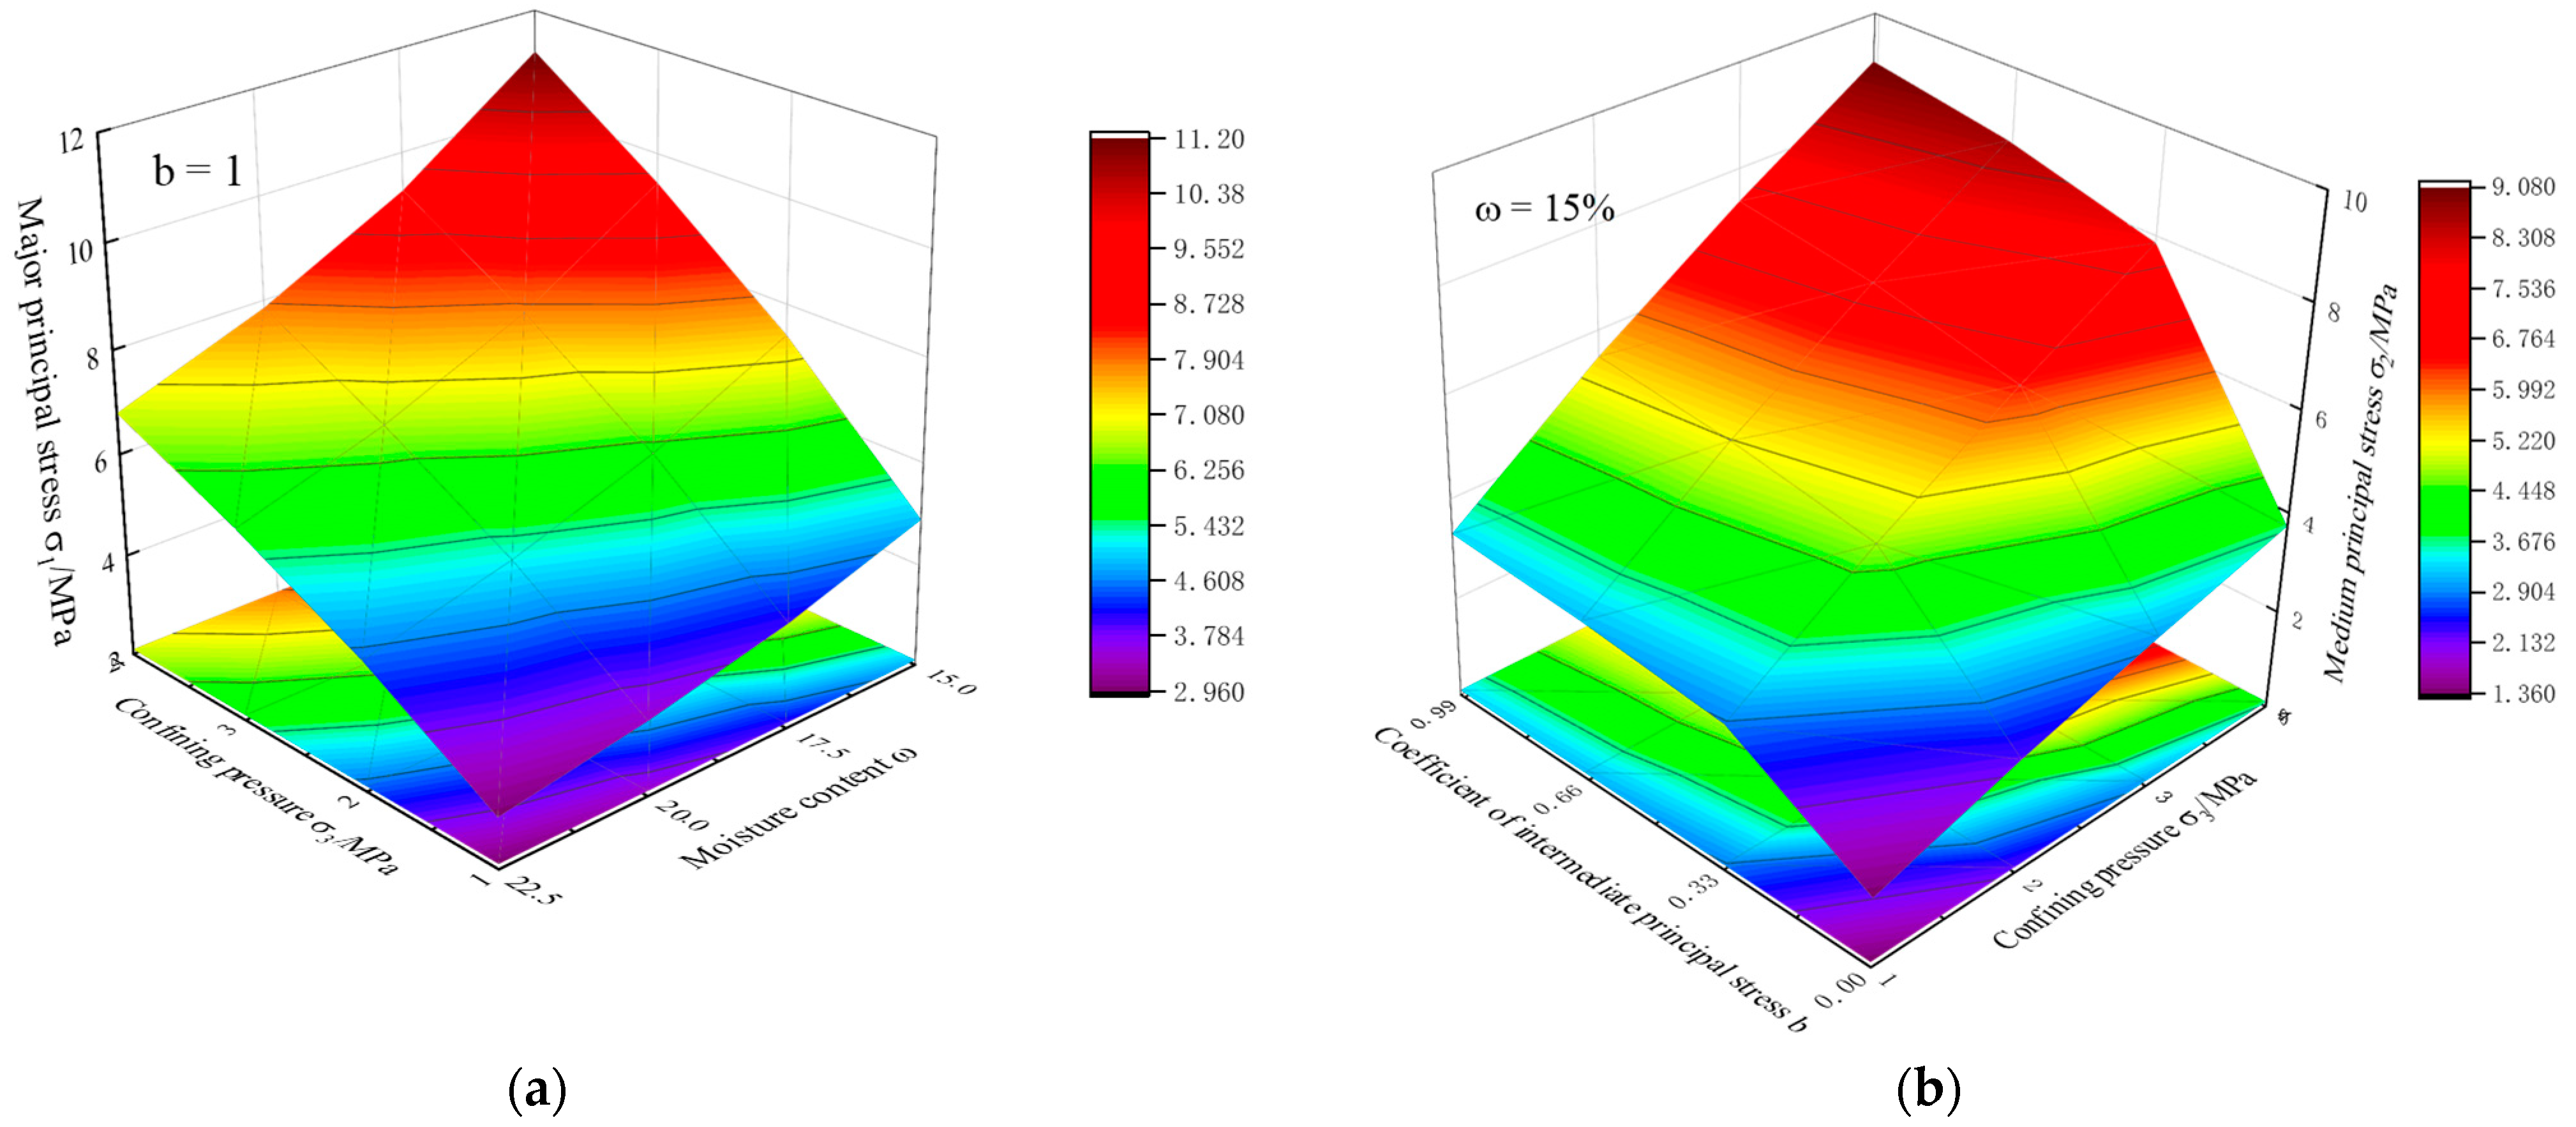
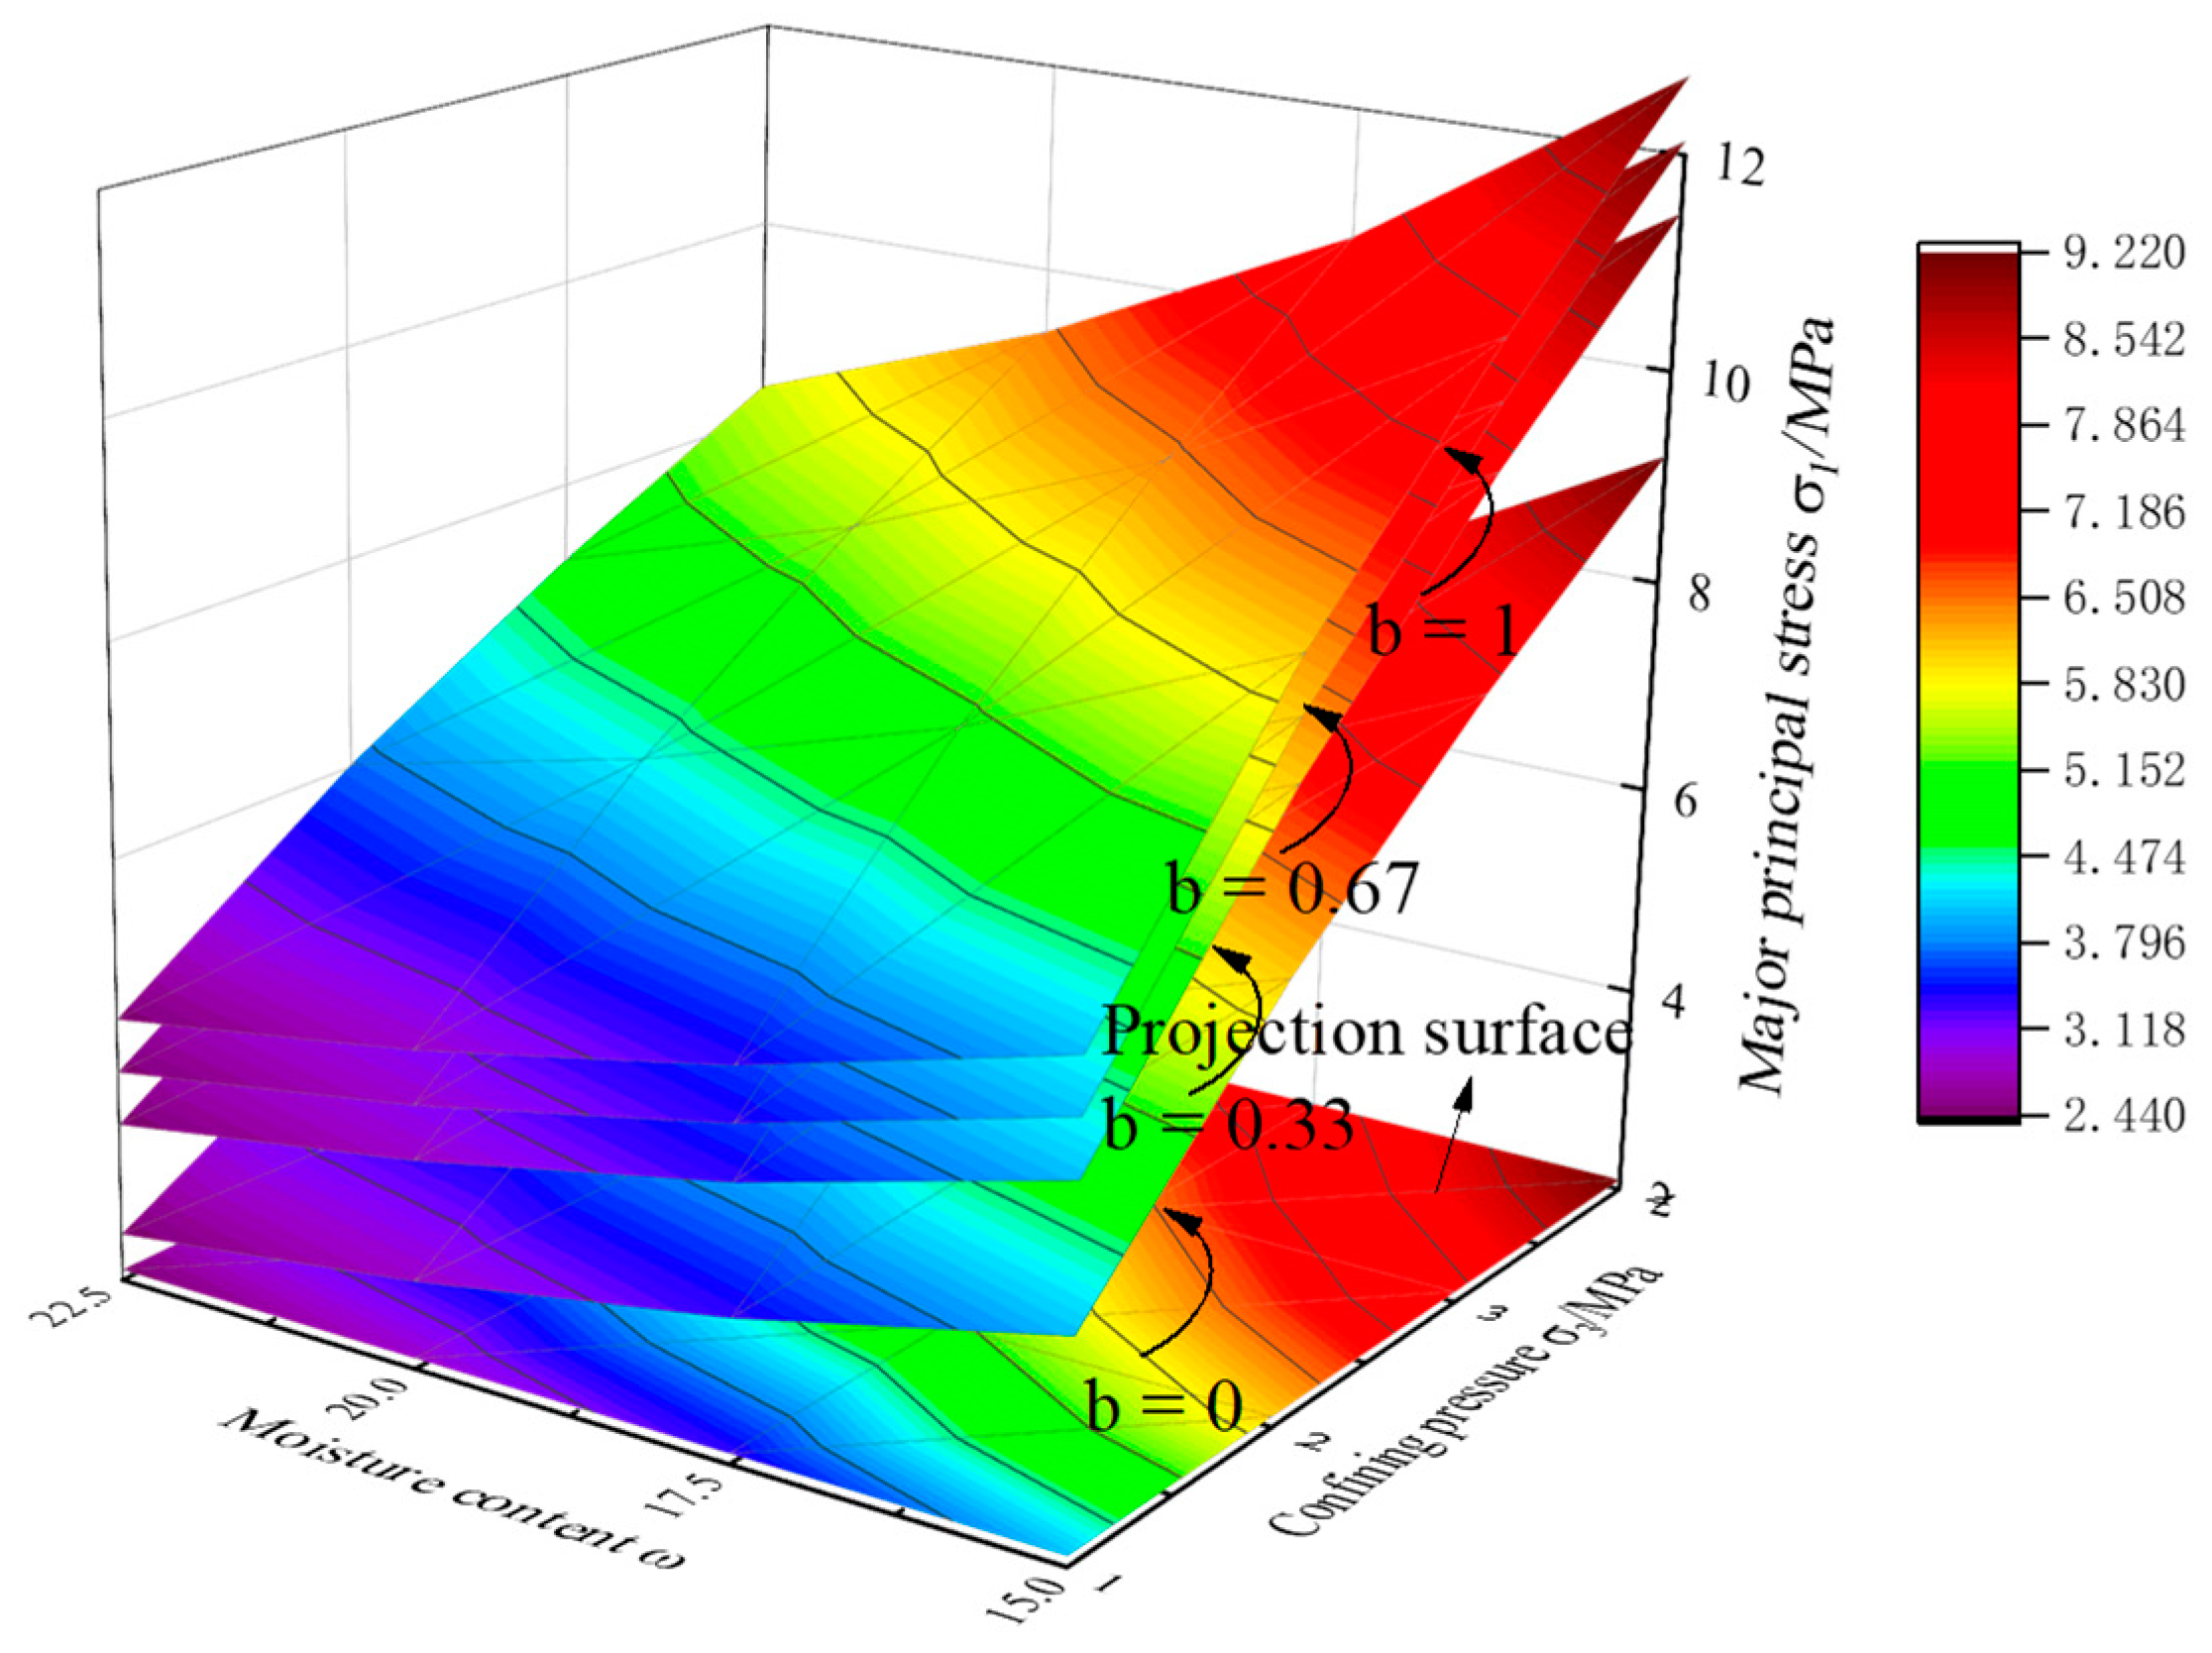
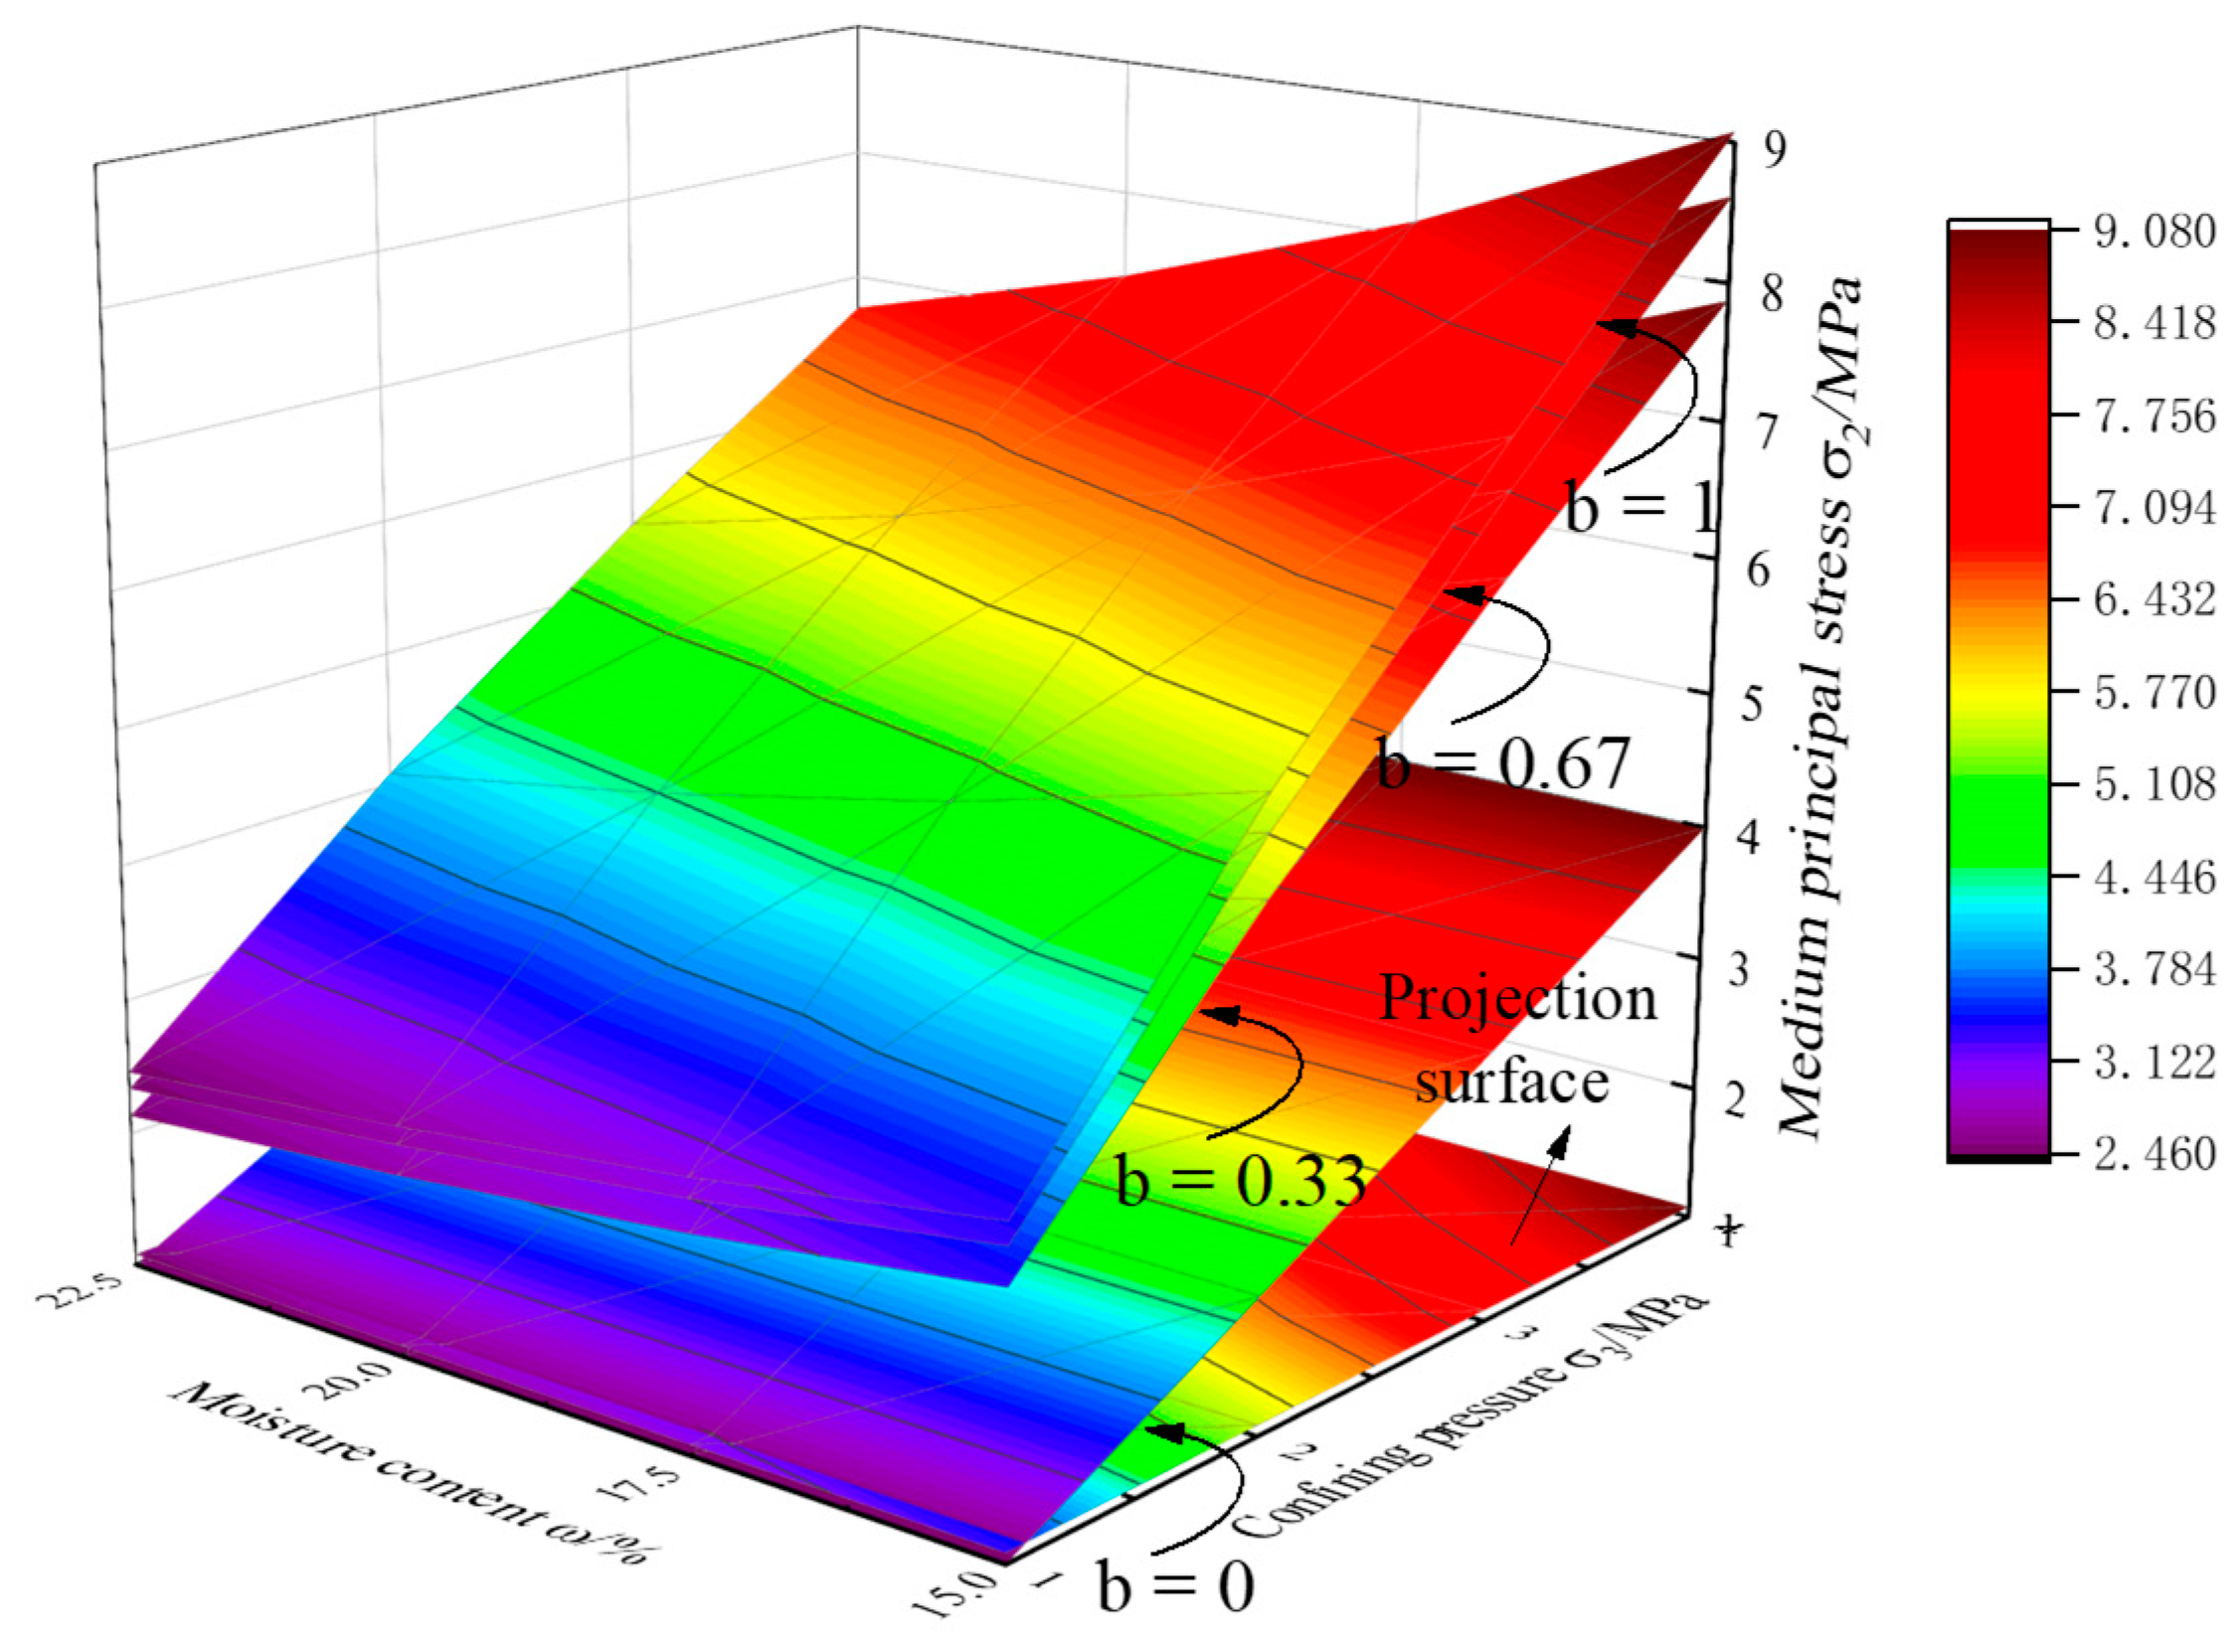
3.2.3. Influence of Different Coefficients of Intermediate Principal Stress on Strength Characteristics of Calcareous Clay

To further investigate the influence of the confining pressure, moisture content, and coefficient of intermediate principal stress on the frozen soil samples, and to facilitate the analysis of the test results combined with the analysis of the influence of the different factors listed in Table 2 and Table 3, the temperature T = −10 °C was also determined. At 10 °C with a salt content φ = 1%, the three-dimensional trend chart of the confining pressure σ3, water content ω, large principal stress σ1, and intermediate principal stress σ2 with different medium principal stress coefficient b is drawn, as shown in Figure 6 and Figure 7.
By comparing Figure 6 and Figure 7, it can be found that as the coefficient of intermediate principal stress b increased, the values of the large principal stress σ1 and intermediate principal stress σ2 of the frozen soil samples continued to increase, and the effect of each b value was different. The degree of influence gradually weakened. The slope change trend of the three-dimensional chart of σ2 under different b values is essentially the same as that of the peak stress σ1 because the magnitudes of σ2 and σ1 are mutually dependent. When the stress in the direction of σ1 reached the peak, the sample was broken and σ2 did not have room to grow. When the water content was 15% and the confining pressure was 4 MPa, the values of the large principal stress σ1 and intermediate principal stress σ2 corresponded to different coefficients of intermediate principal stress, and are listed in Table 7.
From Table 7, it can be clearly observed that when the coefficient of intermediate principal stress b increased from 0 to 0.33, the large principal stress increased from 9.207 MPa to 10.847 MPa, which marks an increase of 15.12%, and the intermediate principal stress increased from 4 MPa to 7.876 MPa, which marks an increase of 49.22%. When the principal stress coefficient b increased from 0.33 to 0.67, the large principal stress increased from 10.847 MPa to 11.067 MPa, which marks an increase of 1.99%, and the intermediate principal stress increased from 7.876 MPa to 8.622 MPa, which marks an increase of 9.12%. When the middle principal stress coefficient b increased from 0.67 to 1, the large principal stress increased from 11.067 MPa to 11.193 MPa, which marks an increase of only 1.13%, and the intermediate principal stress increased from 8.622 MPa to 9.079 MPa, which marks an increase of only 5.03%. The distribution diagram of the influence of the middle principal stress coefficient b is shown in Figure 8.
As can be seen, as the coefficient of intermediate principal stress b increased, its influence on the strength of the frozen sample diminished and there existed an optimal coefficient of intermediate principal stress b that maximized the increase in the sample’s strength. Unsaturated salt calcareous clay exhibits different deformation and failure characteristics under different stress paths, that is, the coefficient of intermediate principal stress is different. The strength characteristics are closely related to the coefficient of intermediate principal stress b; when b = 0.33, the coefficient of intermediate principal stress exerted the most significant effect on the strength of the sample.

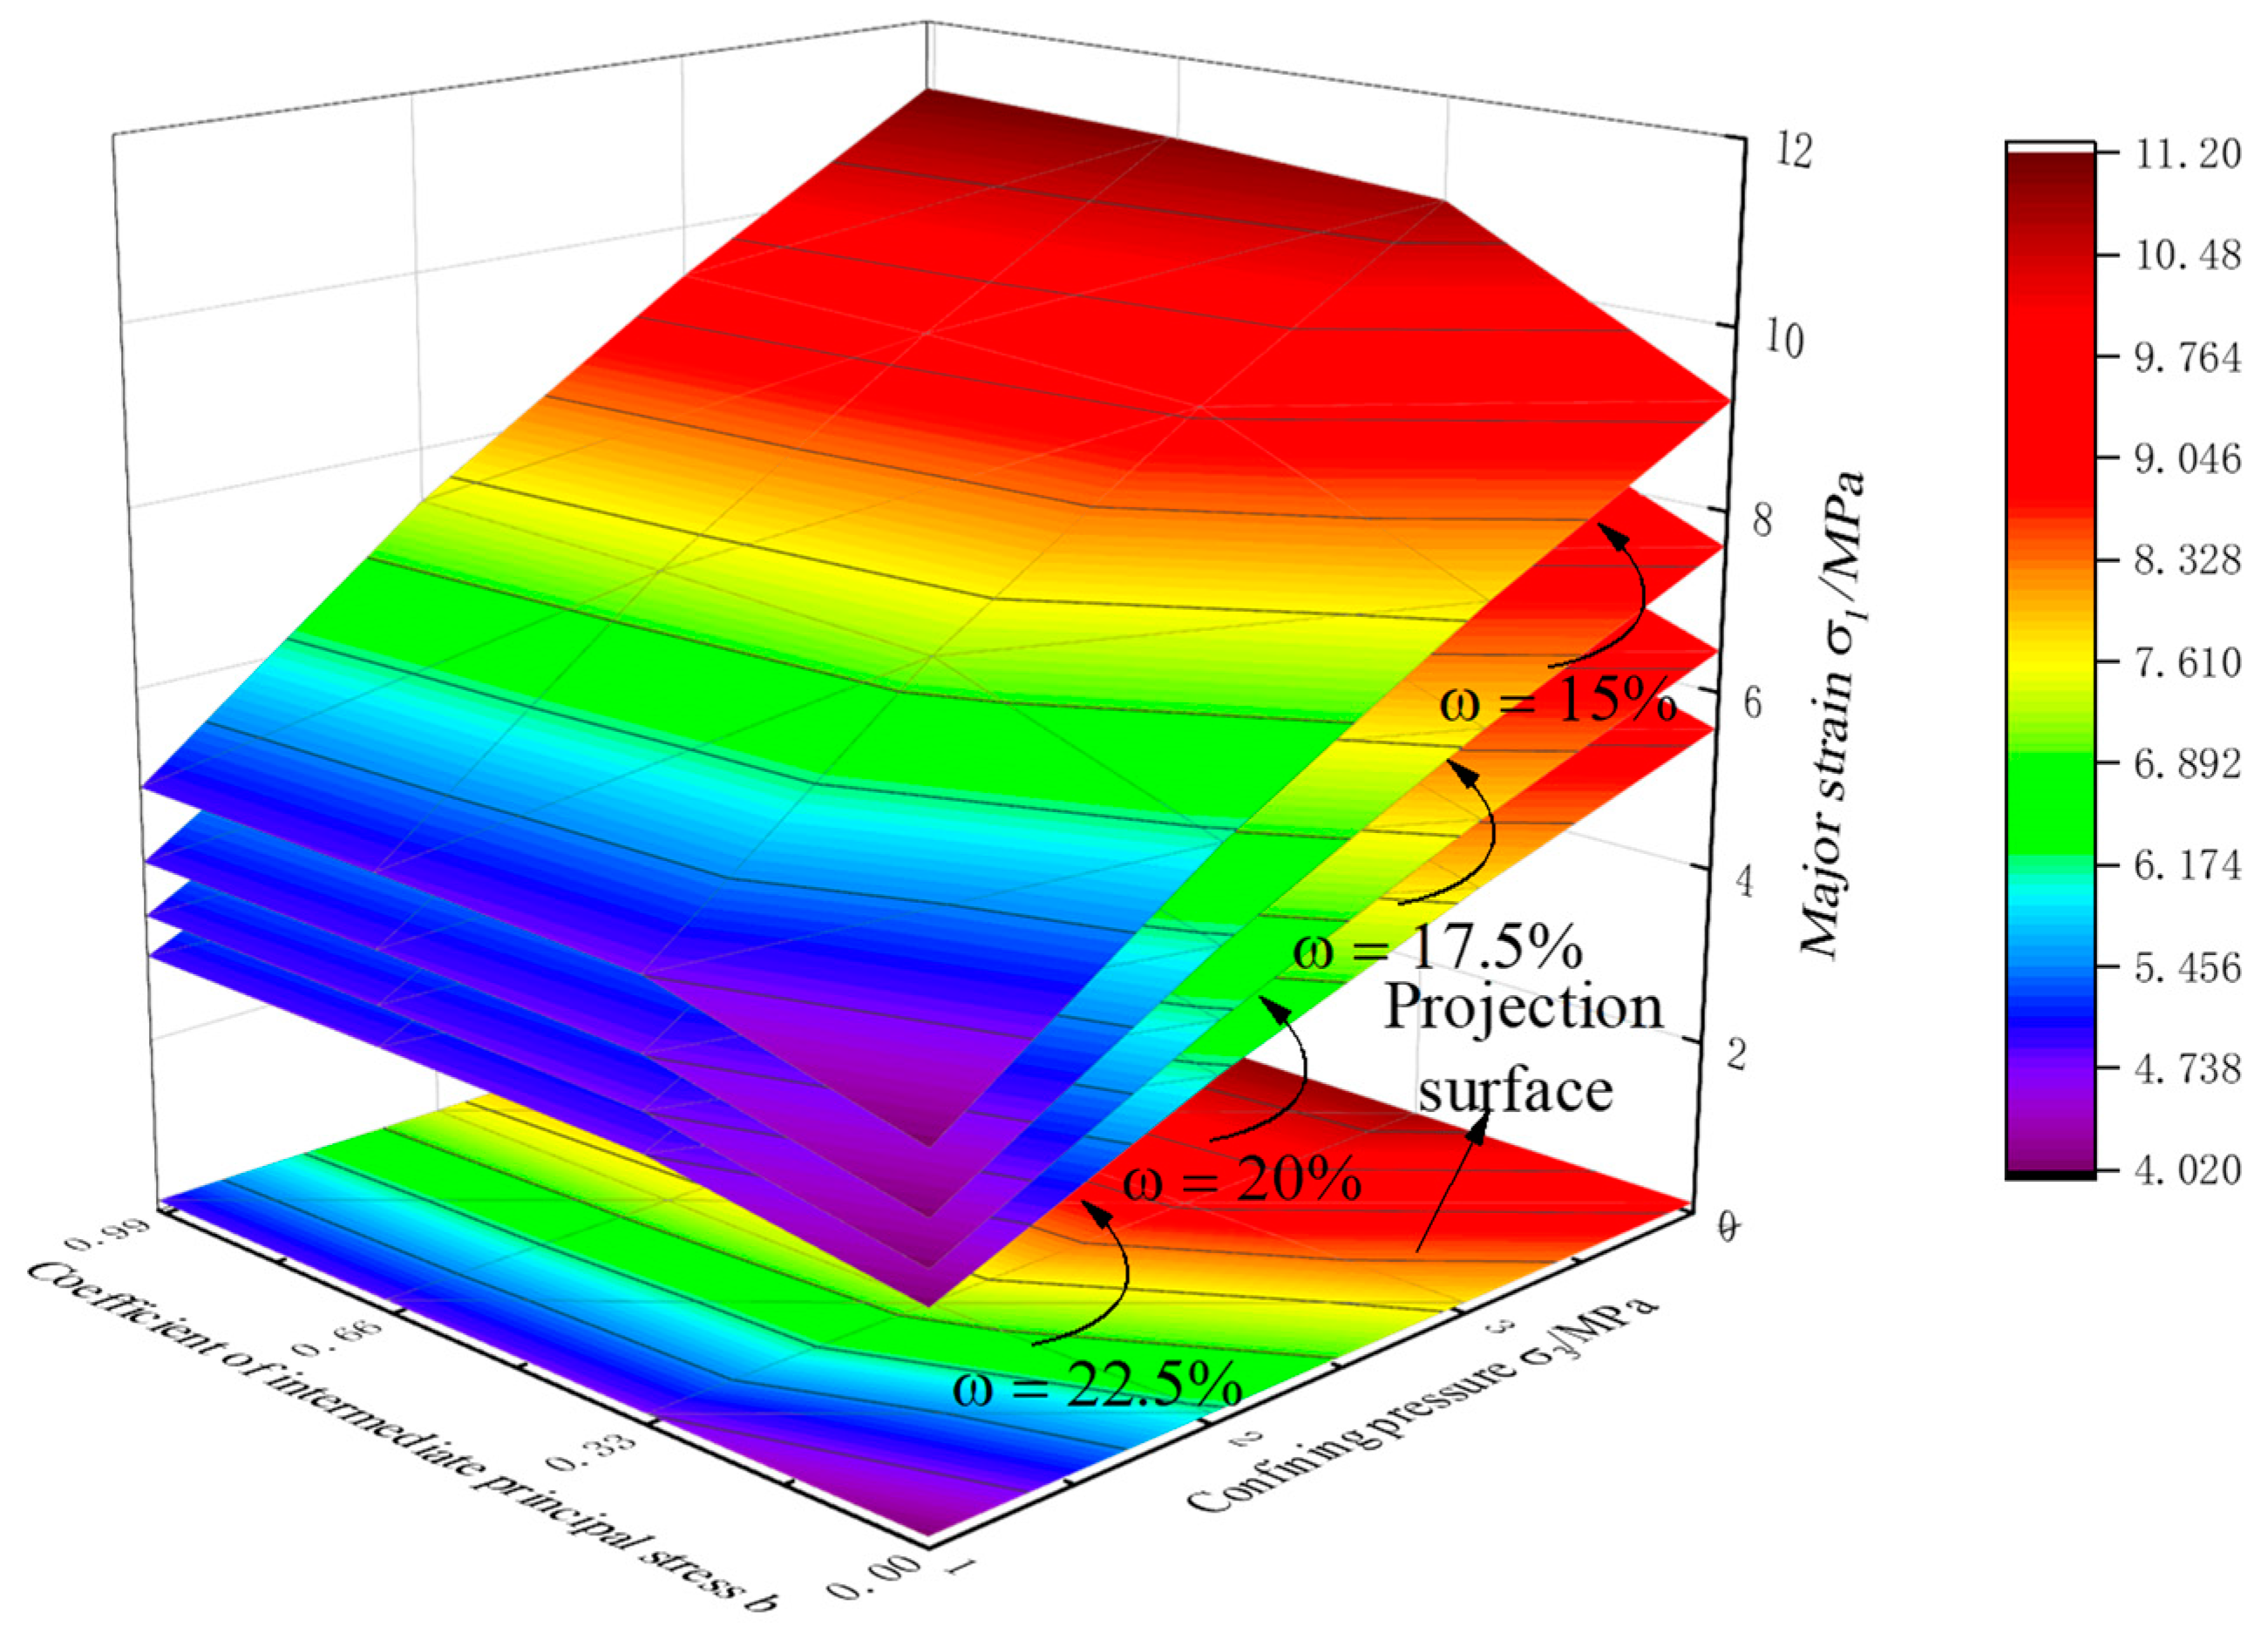
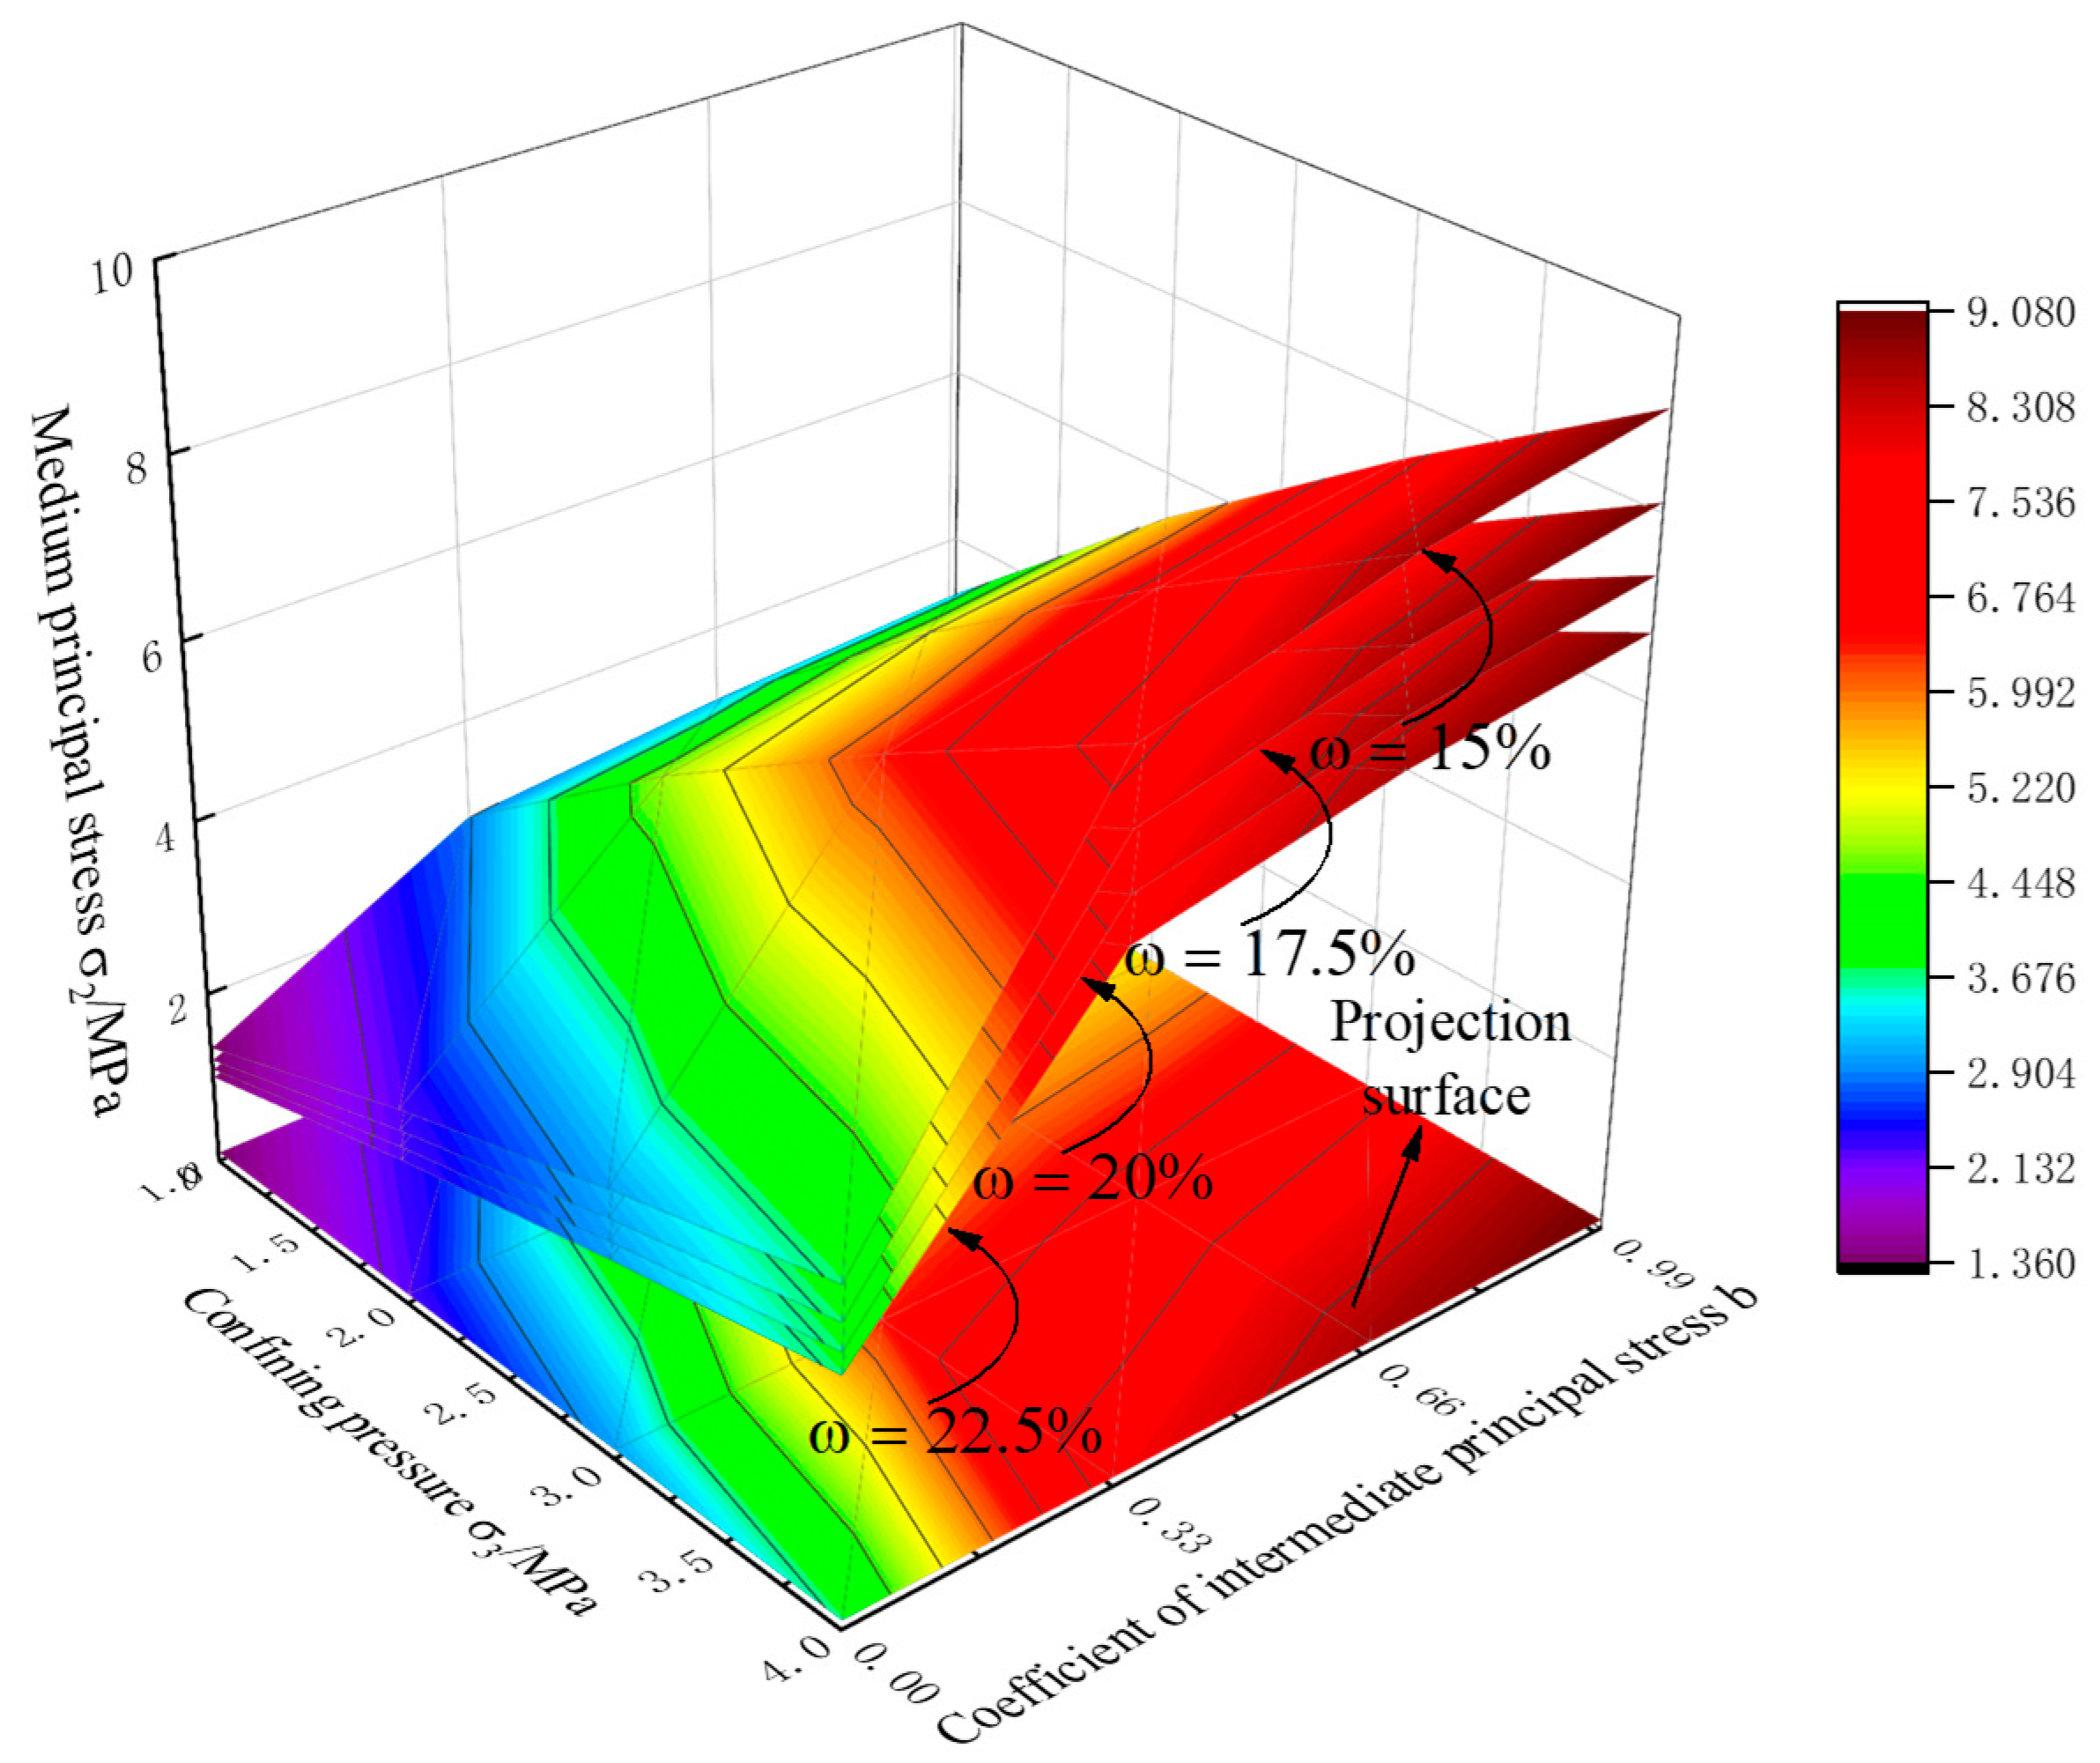
3.2.4. Influence of Different Water Contents on Strength Characteristics of Calcareous Clay

For comparison, the above-mentioned method was used to further explore the influence of different moisture contents on the strength of frozen saline calcareous clay. When the temperature T = −10 ℃ and the salt content φ = 1%, the three-dimensional trend chart of the confining pressure σ3, coefficient of intermediate principal stress b, large principal stress σ1, and intermediate principal stress σ2 with different water content ω were drawn, as shown in Figure 9 and Figure 10.
By comparing Figure 9 and Figure 10, it can be found that, under the same water content, as the confining pressure and coefficient of intermediate principal stress increased, the values of the large principal stress and intermediate principal stress also increased, and the strength of the sample continued to increase. As the moisture content ω increased, the large principal stress σ1 and intermediate principal stress σ2 of the frozen soil samples continued to decrease, the effect of the moisture content ω was different, and the degree of influence gradually weakened. When the middle principal stress coefficient b = 1 and the confining pressure was 4 MPa, the large principal stress σ1 and intermediate principal stress σ2 corresponded to different water contents, and are listed in Table 8.
From Table 8, it can be clearly observed that when the water content ω increased from 15% to 17.5%, the large principal stress decreased from 11.193 MPa to 9.258 MPa, which marks a decrease of 17.29%, and the intermediate principal stress decreased from 9.079 MPa to 8.111 MPa, which marks a decrease of 10.66%. When the water content ω increased from 17.5% to 20%, the large principal stress decreased from 9.258 MPa to 7.855 MPa, which marks a decrease of 15.15%, and the intermediate principal stress decreased from 8.111 MPa to 7.357 MPa, which marks a decrease of 9.30%. When the water content ω increased from 20% to 22.5%, the large principal stress decreased from 7.855 MPa to 6.795 MPa, which marks a decrease of 13.49%, and the intermediate principal stress decreased from 7.357 MPa to 6.750 MPa, which marks a decrease of 8.25%. The distribution diagram of the influence of water content ω is shown in Figure 11.
As can be seen, as the moisture content ω increased, the strength of the sample continued to decrease. The analysis of the reasons for this behavior reveals that the continuous increase in the water content increased the unfrozen water content in the soil, and thereby the thickness of the soil particles, the salt crystals, and unfrozen water film around the cementation increased, which led to the increase in the sliding surface during the process of loading the frozen soil, eventually resulting in a decrease in strength. Moreover, as the water content in the soil increased, more and more frozen soil exhibited the properties of ice because the compressive strength of ice crystals is much lower than that of soil particles. Based on this, it is concluded that as the water content increased, the strength of the sample continuously decreased, and the influence of the water content on the strength of the frozen sample exhibited a weakening trend. The difference among the effects of different moisture contents on the deformation and failure characteristics of unsaturated saline calcareous clay was small and did not exceed 5%.

4. Conclusions

This study experimentally investigated the effects of multiple factors on the true triaxial strength characteristics of frozen saline calcareous clay. The results drawn from this study are as follows:
(1)
The characteristics of the stress–strain curve of frozen calcareous clay can be approximately divided into three stages: (1) initial linear elastic stage: when the strain ε1 < 0.5% in the major principal strain direction, and the equivalent stress–strain curve is approximately linear. (2) plastic deformation stage: as the stress increases, the cementation between the clay particles and the ice crystals inside the sample becomes damaged, which manifests as the weakening of resistance to the sample’s deformation, and the tendency of stress to increase with strain begins to slow down. (3) Strain hardening failure stage.
(2)
Through the analysis of the orthogonal test results, the primary and secondary order of the factors influencing the strength was obtained. The primary and secondary order of influence σ1 is as follows: confining pressure σ3, water content ω, temperature T, medium principal stress coefficient b, salt content φ; The primary and secondary order of influence σ2 is as follows: middle principal stress coefficient b, confining pressure σ3, water content ω, temperature T, salt content φ. Under the influence of multiple factors, the strength of frozen soil in the real state is not independently affected by different factors whose influence is simply superimposed. Instead, the complex interactions of the various factors influence the strength.
(3)
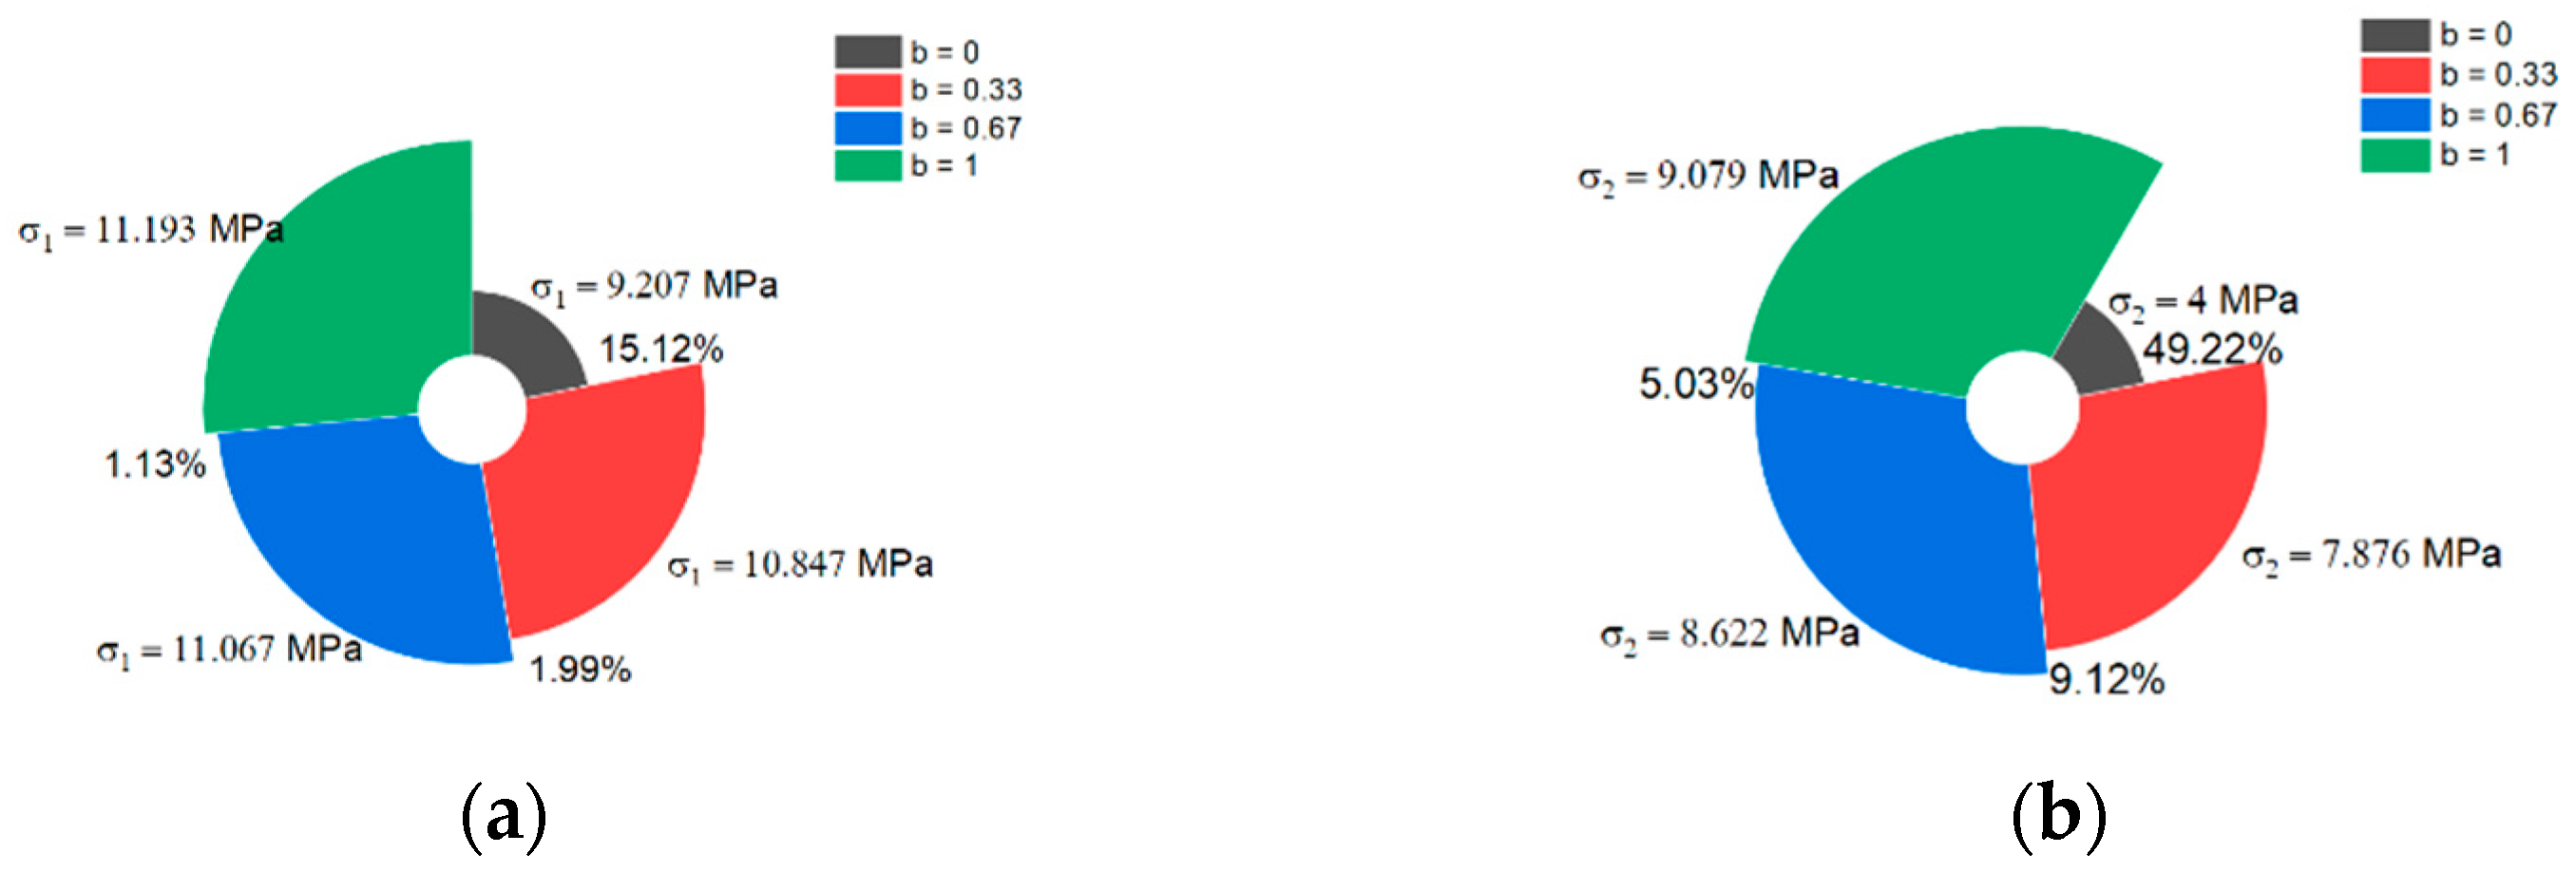
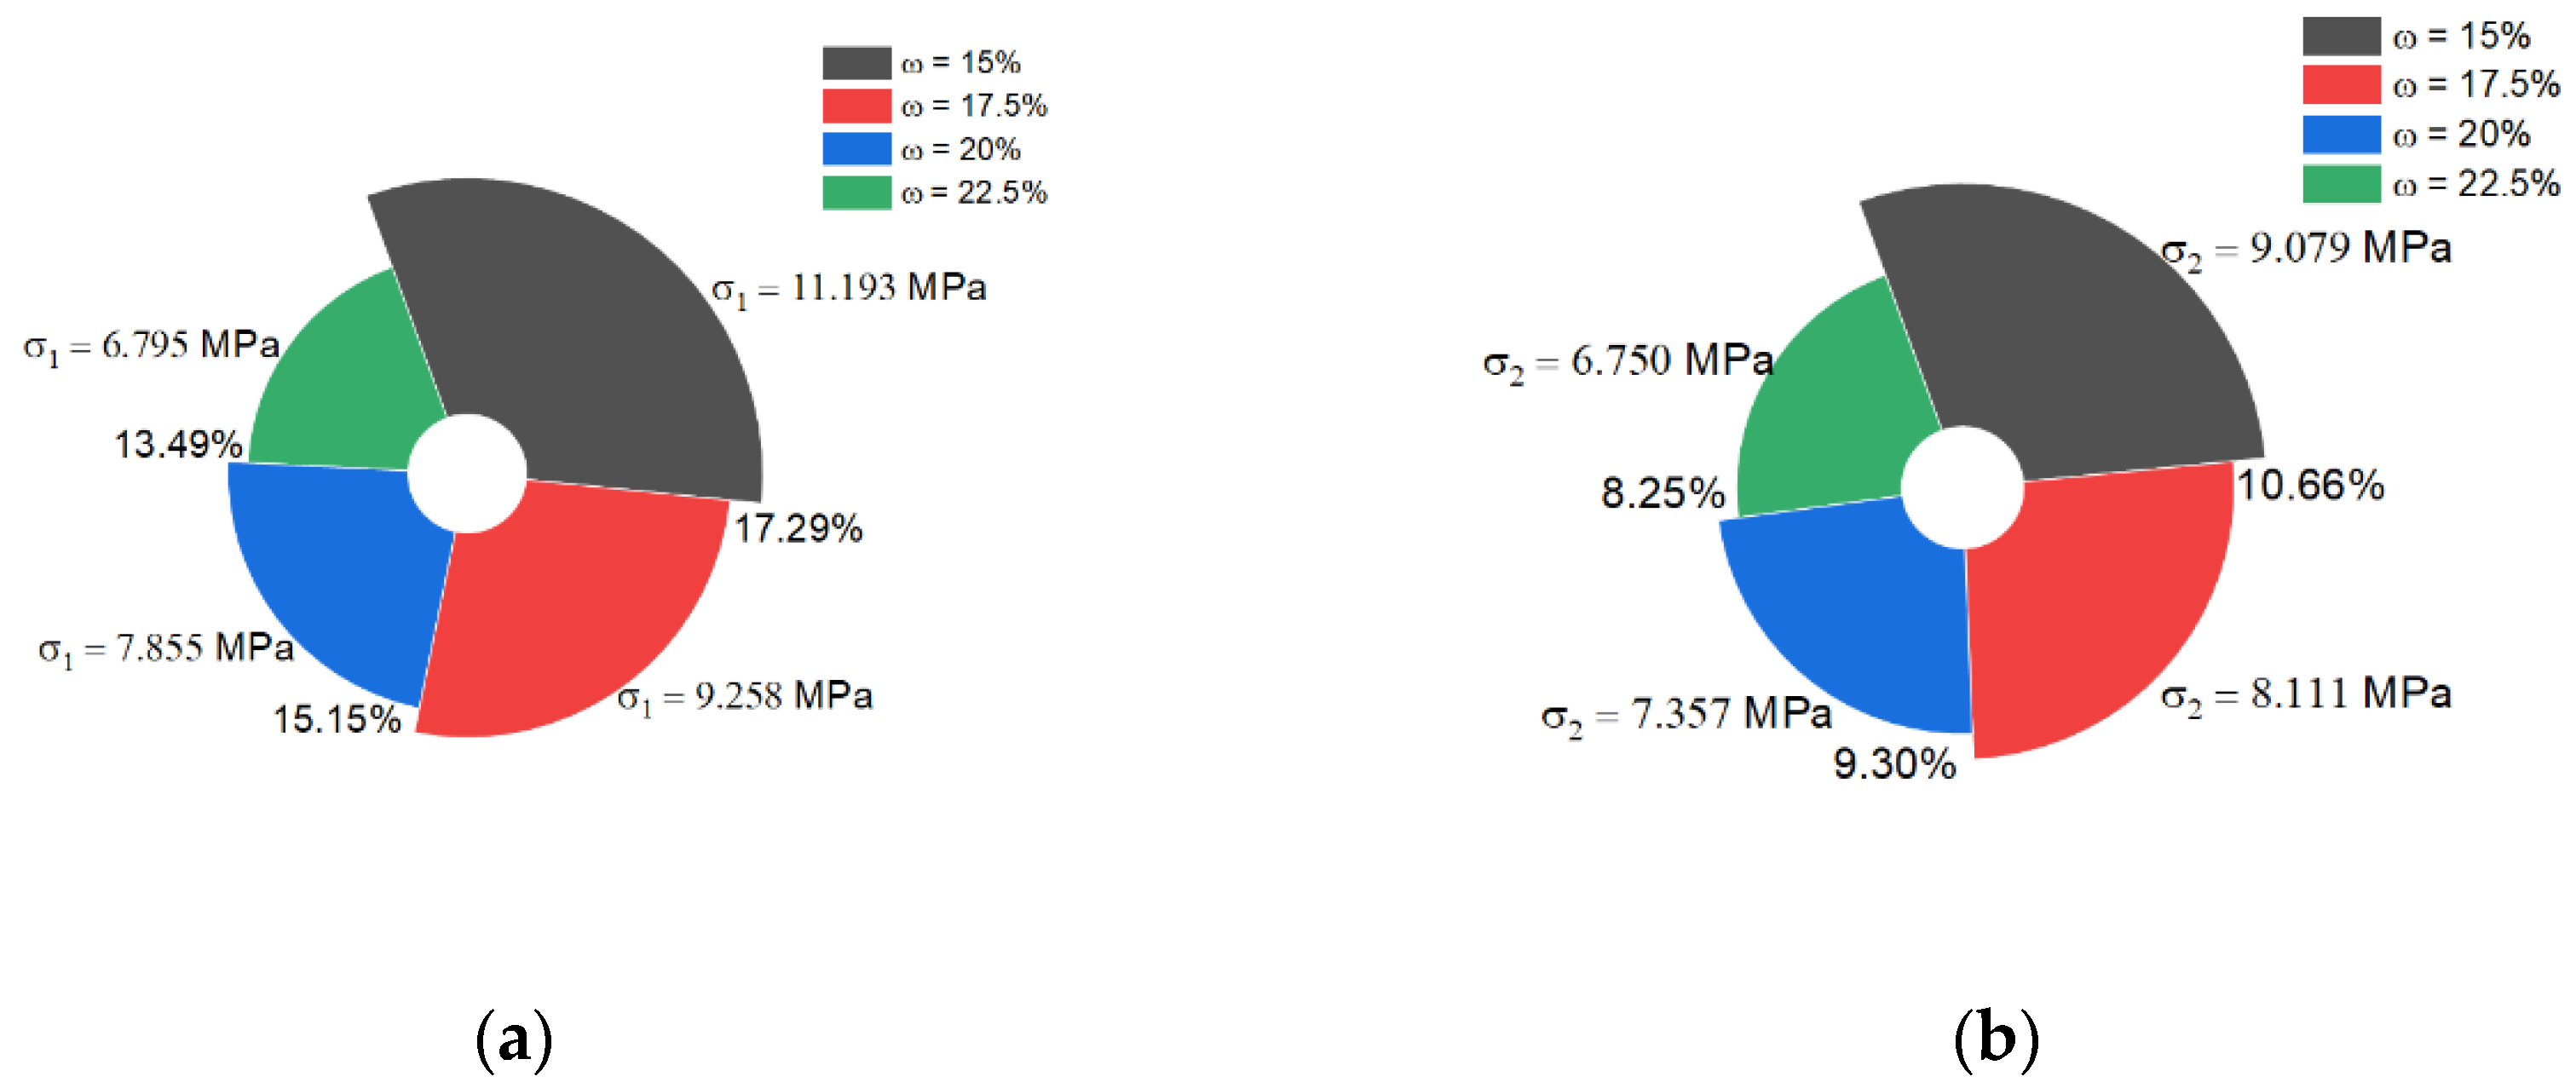
The stress path significantly influences the stress–strain relationship of frozen calcareous clay. When the coefficient of intermediate principal stress b increased from 0 to 0.33, the large principal stress increased from 9.207 MPa to 10.847 MPa, which marks an increase of 15.12%; the principal stress coefficient b increased from 0.33 to 0.67; the large principal stress increased from 10.847 MPa to 11.067 MPa, which marks an increase of 1.99%; the middle principal stress coefficient b increased from 0.67 to 1; and the large principal stress increased from 11.067 MPa to 11.193 MPa, which marks an increase of only 1.13%. As the coefficient of intermediate principal stress b increased, its influence on the strength of the frozen specimen diminished and an optimal value existed. Specifically, the principal stress coefficient b = 0.33 maximized the strength of the specimen.
(4)
The influence of the moisture content on the strength of the sample is negatively correlated. The water content ω increased from 15% to 17.5%, and the large principal stress decreased from 11.193 MPa to 9.258 MPa, which marks a decrease of 17.29%. When the water content ω increased from 17.5% to 20%, the large principal stress decreased from 9.258 MPa to 7.855 MPa, which marks a decrease of 15.15%. The water content ω increased from 20% to 22.5%, which marks a decrease of 13.49%. As the moisture content ω increased, the strength of the sample continued to decrease, but the degree of influence weakened. Different moisture contents exerted different effects on the deformation and failure of unsaturated saline calcareous clay, but the difference did not exceed 5%.

Author Contributions

Investigation, Y.C. and X.S.; methodology, C.R., Y.C. and Z.W.; software, Y.C. and B.W.; date curation, Z.W. and Y.C.; formal analysis, B.W. and W.L.; writing—original draft, Y.C. and C.R.; visualization, X.S. and Z.W.; writing—review and editing, C.R., X.S. and B.W.; conceptualization, Y.C., C.R. and Z.W.; resources, Y.C.; supervision, Y.C. and Z.W.; project administration, Y.C., C.R. and Z.W.; funding acquisition, C.R. and W.L. All authors have read and agreed to the published version of the manuscript.

Funding

The National Natural Science Foundation of China (Grant Nos. 51878005 and 51778004), Natural Science Foundation of Anhui Province (Grant No. 2108085QE251), China Postdoctoral Science Foundation (Grant No. 2021M703621), Natural Science Foundation of Anhui University of Science and technology (xjzd2020-18), Talent Introduction Project of Anhui University of Science and Technology (13200403). Research Foundation for Introduction of Talents of Anhui University of Science and Technology (No. 2021YJRC12).

Institutional Review Board Statement

Not applicable.

Informed Consent Statement

Not applicable.

Data Availability Statement

Not applicable.

Conflicts of Interest

The authors declare no conflict of interest.

References

  1. Mu, R.; Guo, J.; Huang, Z. Research on the influence of uneven water content on the shear strength of red clay. People’s Pearl River 2018, 39, 63–66. [Google Scholar]
  2. Zhao, R.; Zuo, S.; Wang, S. Triaxial shear strength test of Guiyang remolded red clay with different water content. Hydrogeol. Eng. Geol. 2015, 42, 90–95. [Google Scholar]
  3. Liang, B.; Mo, K. Research on the Shear Strength Characteristics of Remolded Red Clay under Different Moisture Contents. Shanxi Archit. 2010, 36, 101–102. [Google Scholar]
  4. Tang, L.; Yang, X.; Cha, X. Model test of shear strength relationship of remolded low liquid limit clay based on water content. J. Chang. Univ. Sci. Technol. Nat. Sci. Ed. 2021, 18, 26–32. [Google Scholar]
  5. Li, T.; Liu, B.; Yang, W. Experimental study on the influence of matrix suction on the shear strength of remolded red clay. J. Chin. Univ. Min. Technol. 2013, 42, 375–381. [Google Scholar]
  6. Huang, Z.; Chen, Y.; Song, R.; Song, L.J. Experimental study on unsaturated properties of loess-like silty clay in Sanmenxia area. Rock Soil Mech. 2010, 31, 1759–1762. [Google Scholar]
  7. Wang, D.; Luan, M.; Yang, Q. Study on the soil-water characteristic curve of reshaped unsaturated clay and its influencing factors. Rock Soil Mech. 2009, 30, 751–756. [Google Scholar]
  8. He, S.; Xue, K.; Hu, Y.; Zou, Y.L.; Chang, L.C.; Li, S. The influence of loading rate and ambient temperature on the rock mechanical properties of clay. Exp. Mech. 2018, 33, 757–768. [Google Scholar]
  9. Zhu, Q.; Yin, Z.; Zhu, J. Experimental study on the loading rate effect of soft clay: Progress and trends. Rock Soil Mech. 2014, 35, 7–24. [Google Scholar]
  10. Sheng, J.; Wu, C.; Ye, G. Study on strength characteristics of Shanghai clay by true triaxial test. Rock Soil Mech. 2013, 34, 47–52. [Google Scholar]
  11. Zhang, F.; Chen, X. Experimental study on deformation and strength characteristics of unsaturated clay. Chin. J. Rock Mech. Eng. 2009, 28, 3808–3814. [Google Scholar]
  12. Lu, J.; Xu, J.; Chen, Y. Experimental study on the effect of temperature on the consolidation and strength characteristics of silty clay. Chin. J. Disaster Prev. Mitig. Eng. 2017, 37, 598–603. [Google Scholar]
  13. Cheraghian, G.; Khalili Nezhad, S.S.; Bazgir, S. Improvement of Thermal Stability of Polyacrylamide Solution Used as a Nano-fluid in Enhanced Oil Recovery process by Nanoclay. Int. J. Nanosci. Nanotechnol. 2015, 3, 201–208. [Google Scholar]
  14. Chou, Y.; Jiang, X.; He, B. Experimental study on mechanical properties of frozen loess based on structure. J. Glaciol. Geocryol. 2014, 36, 913–921. [Google Scholar]
  15. Cai, Z.; Wu, Z.; Huang, Y. Experimental study on the influence of water content and salt content on the unconfined compressive strength of frozen soil. Chin. J. Geotech. Eng. 2014, 36, 1580–1586. [Google Scholar]
  16. Xiao, H. The relationship between the uniaxial compressive strength of artificial frozen soil and temperature and water content. Geotech. Eng. World 2008, 124, 62–63. [Google Scholar]
  17. Sun, L.; Lu, J.; Li, H. Experimental study on the influence of water content and salt content on the strength characteristics of artificial frozen soil. Chin. J. Geotech. Eng. 2015, 37, 27–31. [Google Scholar]
  18. Chen, J.; Li, D.; Bing, H. Experimental study on the influence of water content on the uniaxial compressive strength of frozen saline silt Chen Jin. J. Glaciol. Geocryol. 2012, 34, 441–446. [Google Scholar]
  19. Ma, H.; Zhang, F.; Feng, D.; Tang, K. Experimental study on frost heave of saturated silty clay under unidirectional freezing conditions. J. Build. Mater. 2016, 19, 926–932. [Google Scholar]
  20. Pharr, G.M.; Godavarti, P.S. A Comparison of the Creep Behavior of Saline Ice and Frozen Saline Ottawa Sand at a −8 °C. Cold Reg. Sci. Technol. 1987, 14, 273–279. [Google Scholar] [CrossRef]
  21. Chen, X. Experimental Study on the Characteristics of Instantaneous Unconfined Compressive Strength of Artificial Frozen Soil. Constr Techol. 1991, 6, 32–35. [Google Scholar]
  22. Ma, Q. Experimental study on uniaxial tensile and compressive strength of artificial frozen soil. Rock Soil Mech. 1996, 3, 76–81. [Google Scholar]
  23. Huang, X.; Li, D.; Ming, F. Experimental study on uniaxial compression and tensile strength characteristics of frozen soil. J. Glaciol. Geocryol. 2016, 38, 1346–1352. [Google Scholar]
  24. Hu, P.; Huang, M.; Ma, S. True triaxial test and strength characteristics of silty fine sand Hu Ping. Rock Soil Mech. 2011, 32, 465–470. [Google Scholar]
  25. Zhang, M.; Xu, C.; Du, X. True triaxial test study on the influence of Coefficient of intermediate principal stress and stress path on sand shear characteristics. J. Water Conserv. 2015, 46, 1072–1079. [Google Scholar]
  26. Dai, J.; Su, Z.; Zhao, M. Study on true triaxial test and strength characteristics of silty clay. Rock Soil Mech. 2016, 37, 2534–2546. [Google Scholar]
  27. Ma, S.; Yao, Z.; Liu, S. The damage constitutive model of frozen sand under the influence of Coefficient of intermediate principal stress_Ma Shilong. Coal Geol. Prospect. 2020, 48, 130–136. [Google Scholar]
  28. Yang, Y.; Lai, Y.; Li, S. Analysis of deformation failure and energy characteristics of frozen silt under triaxial compression. Rock Soil Mech. 2010, 31, 3505–3510. [Google Scholar]
Figure 1. Standard cube test block.
Crystals 12 00328 g001
Figure 2. Test instrument and loading schematic diagram: (a) True triaxial testing machine; (b) Frozen soil sample and loading diagram. The arrows show the direction of each force.
Crystals 12 00328 g002
Figure 3. Orthogonal true triaxial equivalent stress–strain curve of frozen saline calcareous clay. (a) T = −5 °C–T = −10 °C, (b) T = −15 °C–T = −20 °C.
Crystals 12 00328 g003
Figure 4. Analysis of the degree of influence of various factors. (a) Diagram of average values of factors influencing the major principal stress σ1; (b) Diagram of average values of factors influencing the intermediate principal stress σ2.
Crystals 12 00328 g004
Figure 5. A 3D graph of the trend of influences on strength of frozen calcareous clay. (a) Three-dimensional chart of confining pressure, water content, and major principal stress; (b) Three-dimensional trend chart of confining pressure, coefficient of intermediate principal stress, and intermediate principal stress.
Crystals 12 00328 g005
Figure 6. Three-dimensional trend chart of confining pressure, water content, and major principal stress under different b values.
Crystals 12 00328 g006
Figure 7. Three-dimensional trend chart of confining pressure, water content, and intermediate principal stress under different b values.
Crystals 12 00328 g007
Figure 8. Distribution diagram of the influence of b value of middle principal stress coefficient: (a) σ1 intensity wind rose diagram, (b) σ2 intensity wind rose diagram.
Crystals 12 00328 g008
Figure 9. Three-dimensional trend chart of b value, confining pressure, and major principal stress with different water contents.
Crystals 12 00328 g009
Figure 10. Three-dimensional trend chart of b value, confining pressure, and intermediate principal stress with different water contents.
Crystals 12 00328 g010
Figure 11. Distribution diagram of influence of moisture content ω: (a) σ1 intensity wind rose diagram, (b) σ2 intensity wind rose diagram.
Crystals 12 00328 g011
Table 1. Basic physical parameters of calcareous clay.
Soil TypeMoisture Content
ω (%)
Wet Density
ρ (g/cm3)
Dry Density
ρd (g/cm3)
Specific Gravity
Gs
Void RatioLiquid Limit
ωl (%)
Plastic Limit
ωp (%)
Liquid
Limit Index
IL
Plastic Limit Index
IP
Calcareous clay22.622.041.662.7360.645435−0.6519
Table 2. Levels of calcareous clay factors considered in true triaxial test.
5 FactorsTemperature
(A)
Moisture Content
(B)
Salt Content
(C)
Confining Pressure
(D)
Coefficient of Intermediate Principal Stress b (E)
4 Levels
K1−5 °C15%0%1 MPa0
K2−10 °C17.5%1%2 MPa0.33
K3−15 °C20%2%3 MPa0.67
K4−20 °C22.5%3%4 MPa1
Table 3. Plan of true triaxial test.
Test NumberTemperature T/°CMoisture Content
ω/%
Salt Content φ/%Confining Pressure σ3/MPaCoefficient of Intermediate Principal Stress b
1#−515010
2#−517.5120.33
3#−520230.67
4#−522.5341
5#−1015131
6#−1017.5040.67
7#−1020310.33
8#−1022.5220
9#−1515240.33
10#−1517.5330
11#−1520021
12#−1522.5110.67
13#−2015320.67
14#−2017.5211
15#−2020140
16#−2022.5030.33
Table 4. True triaxial test results for saline calcareous clay.
Numberσ1max/MPaNumberσ1max/MPa
1#3.7899#10.396
2#5.69410#6.509
3#5.3511#5.914
4#6.1112#3.071
5#10.20913#7.94
6#9.56814#5.197
7#3.06415#8.411
8#3.47416#6.941
Table 5. Analysis of the degree of influence of various factors on principal stress σ1.
Factor LevelABCDEExcellent LevelFactor Priority
Major principal stress σ1max/
MPa
K15.2368.0836.5533.7805.546A4B1C2D4E4D > B > A > E > C
K26.5796.7426.8465.7556.524
K36.4735.6856.1047.2526.482
K47.1224.8995.9068.6216.857
R1.8863.1840.9404.8411.311
(NOTE: R = Kmax − Kmin).
Table 6. Analysis of the degree of influence of various factors on intermediate principal stress σ2.
Factor LevelABCDEExcellent LevelFactor Priority
Intermediate principal stress σ2max/
MPa
K13.7285.8234.7372.5702.500A2B1C2D4E4E > D > B > A > C
K25.4064.7904.9544.2793.827
K34.3514.0444.4735.5235.171
K44.8733.7004.1945.9876.860
R1.6782.1230.7603.4174.360
(NOTE: R = Kmax − Kmin).
Table 7. Corresponding stress values with different middle principal stress coefficients.
Coefficient of Intermediate Principal Stress bMajor Principal Stress σ1/MPaIntermediate Principal Stress σ2/MPaConfining Pressure σ3/MPa
09.20744
0.3310.8477.876
0.6711.0678.622
111.1939.079
Table 8. Stress values corresponding to different water contents.
Moisture Content ωMajor Principal Stress σ1/MPaIntermediate Principal Stress σ2/MPaConfining Pressure σ3/MPa
15%11.1939.0794
17.5%9.2588.111
20%7.8557.357
22.5%6.7956.750
Publisher’s Note: MDPI stays neutral with regard to jurisdictional claims in published maps and institutional affiliations.

