Communication

Investigation of Lattice Plasmon Modes in 2D Arrays of Au Nanoantennas

by
Antonio Ferraro
1,2,*,
Joseph Marae Djouda
3,4,*,
Giuseppe Emanuele Lio
1,2,*,
Gaëtan Lévêque
5,
Pierre-Michel Adam
6,
Cesare Paolo Umeton
1,2,
Thomas Maurer
6 and
Roberto Caputo
1,2,7,*
1
Physics Department, University of Calabria, I-87036 Rende, Italy
2
Consiglio Nazionale delle Ricerche-Istituto di Nanotecnologia (CNR-Nanotec)-UOS Rende, I-87036 Rende, Italy
3
ERMESS, EPF Engineering School, 55 Avenue du Président Wilson, 94230 Cachan, France
4
ENS Paris-Saclay, CentraleSupélec, CNRS, LMPS-Laboratoire de Mécanique et Technologie, Université Paris-Saclay, 91190 Gif-sur-Yvette, France
5
Institute of Electronics, Microelectronics and Nanotechnology, Cité Scientifique, Avenue Henri Poincaré, CS 60069, CEDEX, 59652 Villeneuve d’Ascq, France
6
Laboratory Light, Nanomaterials and Nanotechnologies—L2n, University of Technology of Troyes and CNRS ERL 7004, 12 rue Marie Curie, CS 42060, CEDEX, 10004 Troyes, France
7
Institute of Fundamental and Frontier Sciences, University of Electronic Science and Technology of China, Chengdu 610054, China
*
Authors to whom correspondence should be addressed.
Crystals 2022, 12(3), 336; https://doi.org/10.3390/cryst12030336
Submission received: 28 January 2022 / Revised: 22 February 2022 / Accepted: 24 February 2022 / Published: 28 February 2022
(This article belongs to the Special Issue Active Hybrid Soft Metamaterials)

Abstract

:
The coupling of gold nanoantennas (AuNAs) in the arrangement of monomers in bidimensional gratings is investigated both experimentally and numerically. The influence of edge diffraction, corresponding to the grazing propagation of specific diffracted orders, and the dependence of grating parameters on lattice plasmon modes are studied. It is shown that the grating pitch influences the spectral position of the Rayleigh wavelength related to the grazing diffraction in air and/or in glass. In order to investigate the effect of diffraction and its interplay with the Rayleigh wavelength, extinction measurements with different incidence angles are carried out. For incidence angles above θ = 20 , along with the excitation of quadrupolar and vertical modes, very narrow dips or sharp excitations are observed in the spectra. These ones strongly depend on the respective spectral position of Rayleigh anomaly and specific dipolar mode, on the propagation direction of the grazing diffraction, and on the considered plasmon mode. These features are explained in the light of numerical calculations obtained with Green’s tensor method. All the above different characteristics and couplings are of great practical interest, especially for a possible implementation in biosensor devices and for other technological applications spanning from precision medicine and life science to telecommunications and energy systems.

1. Introduction

Nanoscience is under intense investigation due to the numerous applications in our daily life such as in molecular detection, imaging, anticounterfeiting, smart optics, and energy harvesting, just to name a few [1,2,3,4,5,6]. In this scenario, metal nanoantennas assemblies are widely studied for their ability to confine light and influence its behavior both in the near- and far-field. Many applications have already been realized by tailoring the super absorption behavior for smart energy-harvesting systems, as well as the spectral and phase behavior of light in metalenses, thermoplasmonic, sensing and even light emission properties, when fluorescent materials are combined with the antennas [7,8,9,10,11,12,13,14]. In most of these applications, metasurfaces comprise specific spatial distributions of nanoantennas or arrays with a fixed periodicity or aperiodic patterns. The typical geometry includes a monolayer of nanoparticles exhibiting plasmonic properties supported by a rigid or flexible substrate [15,16]. In this vast scenario of possibilities, a relevant role is played by phased arrays showing collective resonances or so-called lattice plasmon modes (LPMs). In this case, the periodical organization of nanoparticles gives rise to the appearance of plasmon modes in the wide spectral range, which are spectrally extremely different from the corresponding ones observed in isolated particles [17,18,19,20,21]. Lattice plasmon resonance has been deeply investigated in spectroscopy techniques: plasmon-enhanced fluorescence [22] and enhanced Raman spectroscopy [23]. Nowadays, these kinds of techniques are used for the detection of pollutants, proteins, DNA, and biologically relevant nanoparticles [24,25,26]. The optical properties of metal nanoantennas are also used in lasing applications [27] and in telecommunications [28,29]. Lattice plasmon resonance (LPM) has been also coupled to effects of mechanical stretching in order to implement surface mechanical sensors [15,30,31] or to improve and simultaneously tune the optical and thermal response of a given physical system [32]. In their study, Odom et al. [33] exploited mechanical stretching to actively obtain a very narrow linewidth (close to 5 nm in wavelength) in an array of aluminum nanoparticles.
Recently, an in-depth study of these modes has been theoretically performed by investigating in details arrays of Au monomers and dimers [21,34,35,36]. A related experimental verification is not simple, since arrays with different periodicities have to be fabricated by means of very precise nanotechnology tools to ensure high-quality nanoscale morphological features over large areas. The present investigation is devoted to this aim. The understanding of the optical properties of bidimensional gratings of metal nanoantennas is very attractive for the related scientific and technological potential; in particular for realizing complex devices like nanoantennas for molecular biosensing, thermoplasmonics for precision medicine or even telecommunications.

2. Experimental Section

A single or isolated nanoantenna supports a non-dispersive dipolar mode both for Transverse Electric (TE) and Transverse Magnetic (TM) polarization at normal incidence, which is also the only available mode due to the symmetry of the particle. Furthermore, in addition to the dipolar mode, angle-resolved extinction spectroscopy allows the excitation of a quadrupolar mode both for TE and TM polarization, and of a dipolar vertical mode for TM polarization [37]. Once the single AuNA is repeated on the surface of a substrate to realize an array with a quite close separation of the elements (center-to-center less than 3d), the configuration of the electric field couplings in the grating becomes more complex, since the AuNAs not only interact with the exciting light but also with each other. As such, the overall plasmonic response of the array is influenced by diffraction effects arising from the spatial arrangement of the nanoantennas. In terms of resonance effects, arrays of AuNAs support dispersive modes called lattice plasmon modes (LPMs), which depend on the array features, such as separation between nanoantennas or periodicity (identical or different in the two directions), AuNAs size, and the direction and polarization of the incident light [38]. On the other hand, the diffraction orders (DOs) depend on the grating period and/or on the incident angle, and they can be radiative or evanescent. Evanescent waves are waves with a rapidly decaying amplitude and no transport of energy. A specific case of diffraction corresponds to the excitation at the so-called Rayleigh anomaly (RA), which indicates the switch of a given diffracted order from radiative (shorter wavelength) to evanescent (longer wavelength) [19,39,40,41,42]. At this transition, the wave vector of the corresponding DO becomes parallel to the grating plane, the propagation becomes grazing and can be located at the interface between the substrate and particle (bottom of the AuNAs), or at the interface between the particle and air (top of the AuNAs). In the following, Rayleigh wavelengths will be marked with circles on spectra, which are coded in color depending on the integer associated with the diffraction along the direction of propagation; see Figure 1.
Due to the great variety of possible modes, metal nanoantenna assemblies become optical systems exhibiting a wide range of properties. The change of shape of AuNAs, separation between them, and spatial arrangement can yield a great quantity of exciting properties [43], thus making AuNAs arrays suitable for fundamental research and for technological applications in many domains.
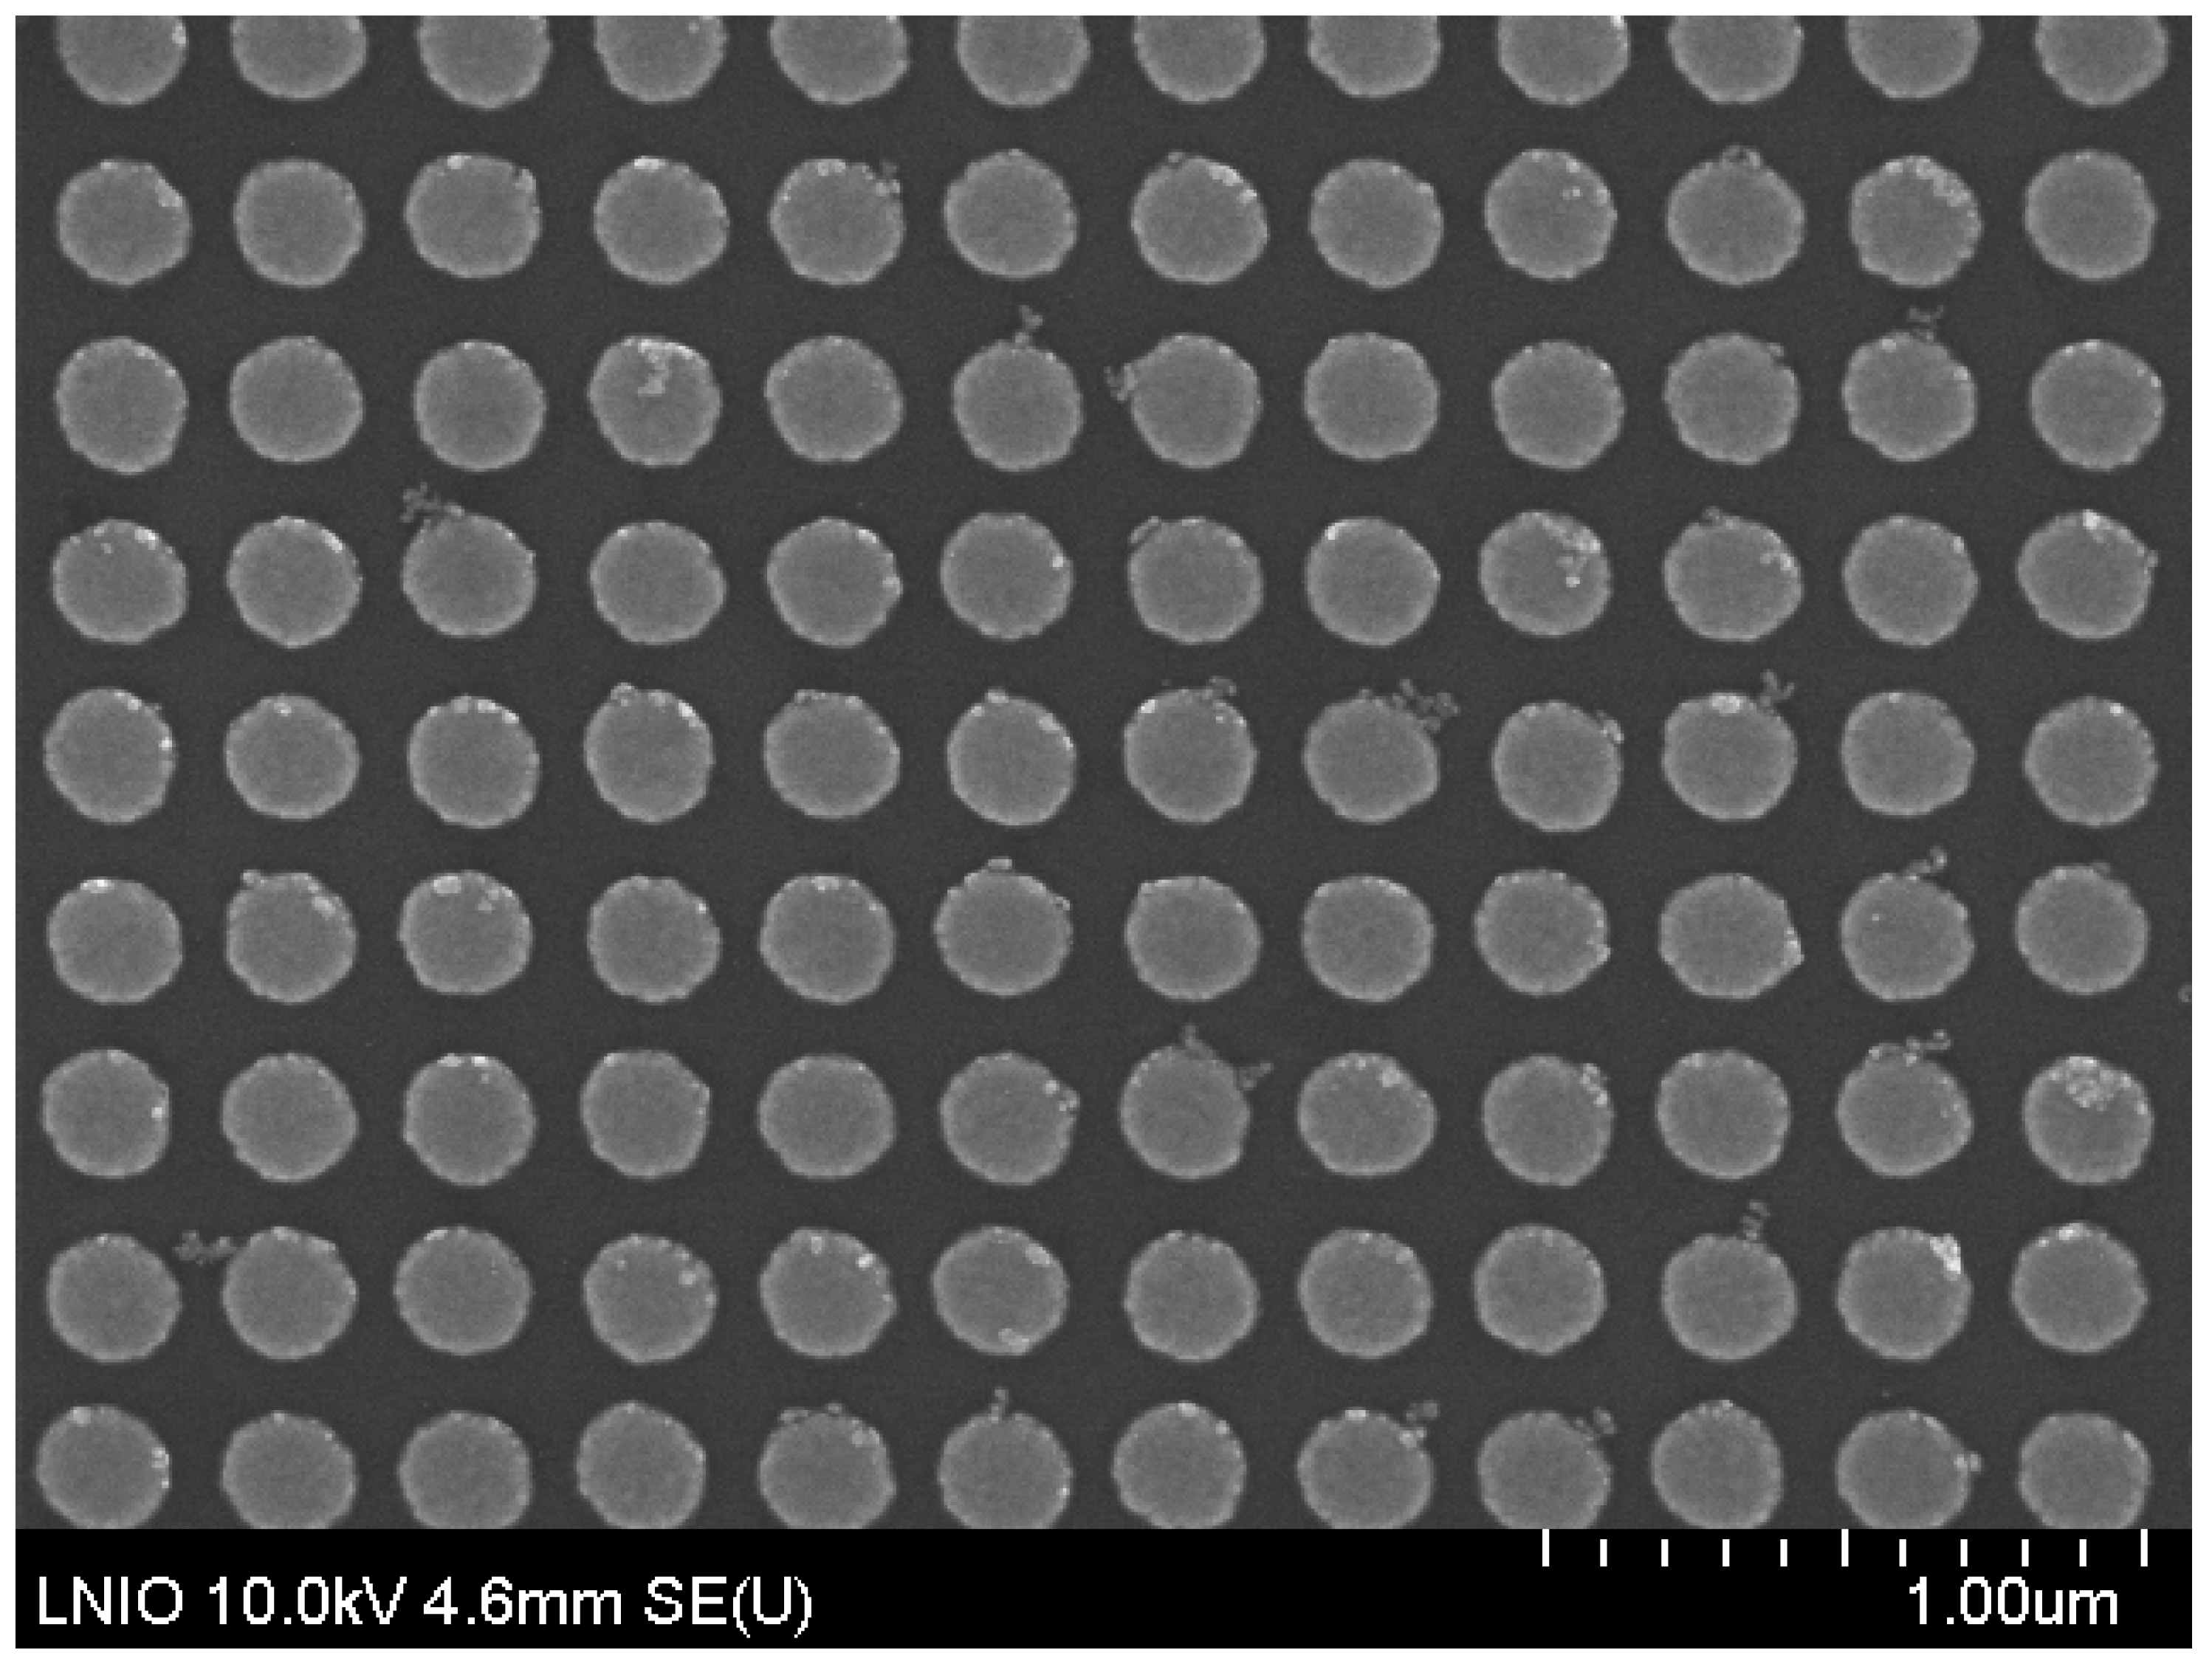
In our experiments, 2D gratings of Au nanoantennas have been fabricated on a glass substrate by electron beam lithography (EBL) using the process reported in [10,44]. The AuNAs have an average diameter (d) of 200 nm and 50 nm height. In all samples, the separation between nanoantennas was fixed in the y direction ( P y ) to 300 nm, while in the x direction, it varied from sample to sample, from 300 to 1000 nm by steps of 100 nm. Figure 2 reports the acquired SEM image of the grating, which exhibits P y = 300 nm and P x = 400 nm, highlighting the high fidelity of the fabrication process. The extinction spectra of the gratings were acquired by using a homemade confocal setup which enables varying the incidence angle and polarization of the exciting light while numerical simulation was performed using a periodized version of Green’s tensor formalism [21,44].

3. Result and Discussion

3.1. Plasmonic Response at Normal Incidence

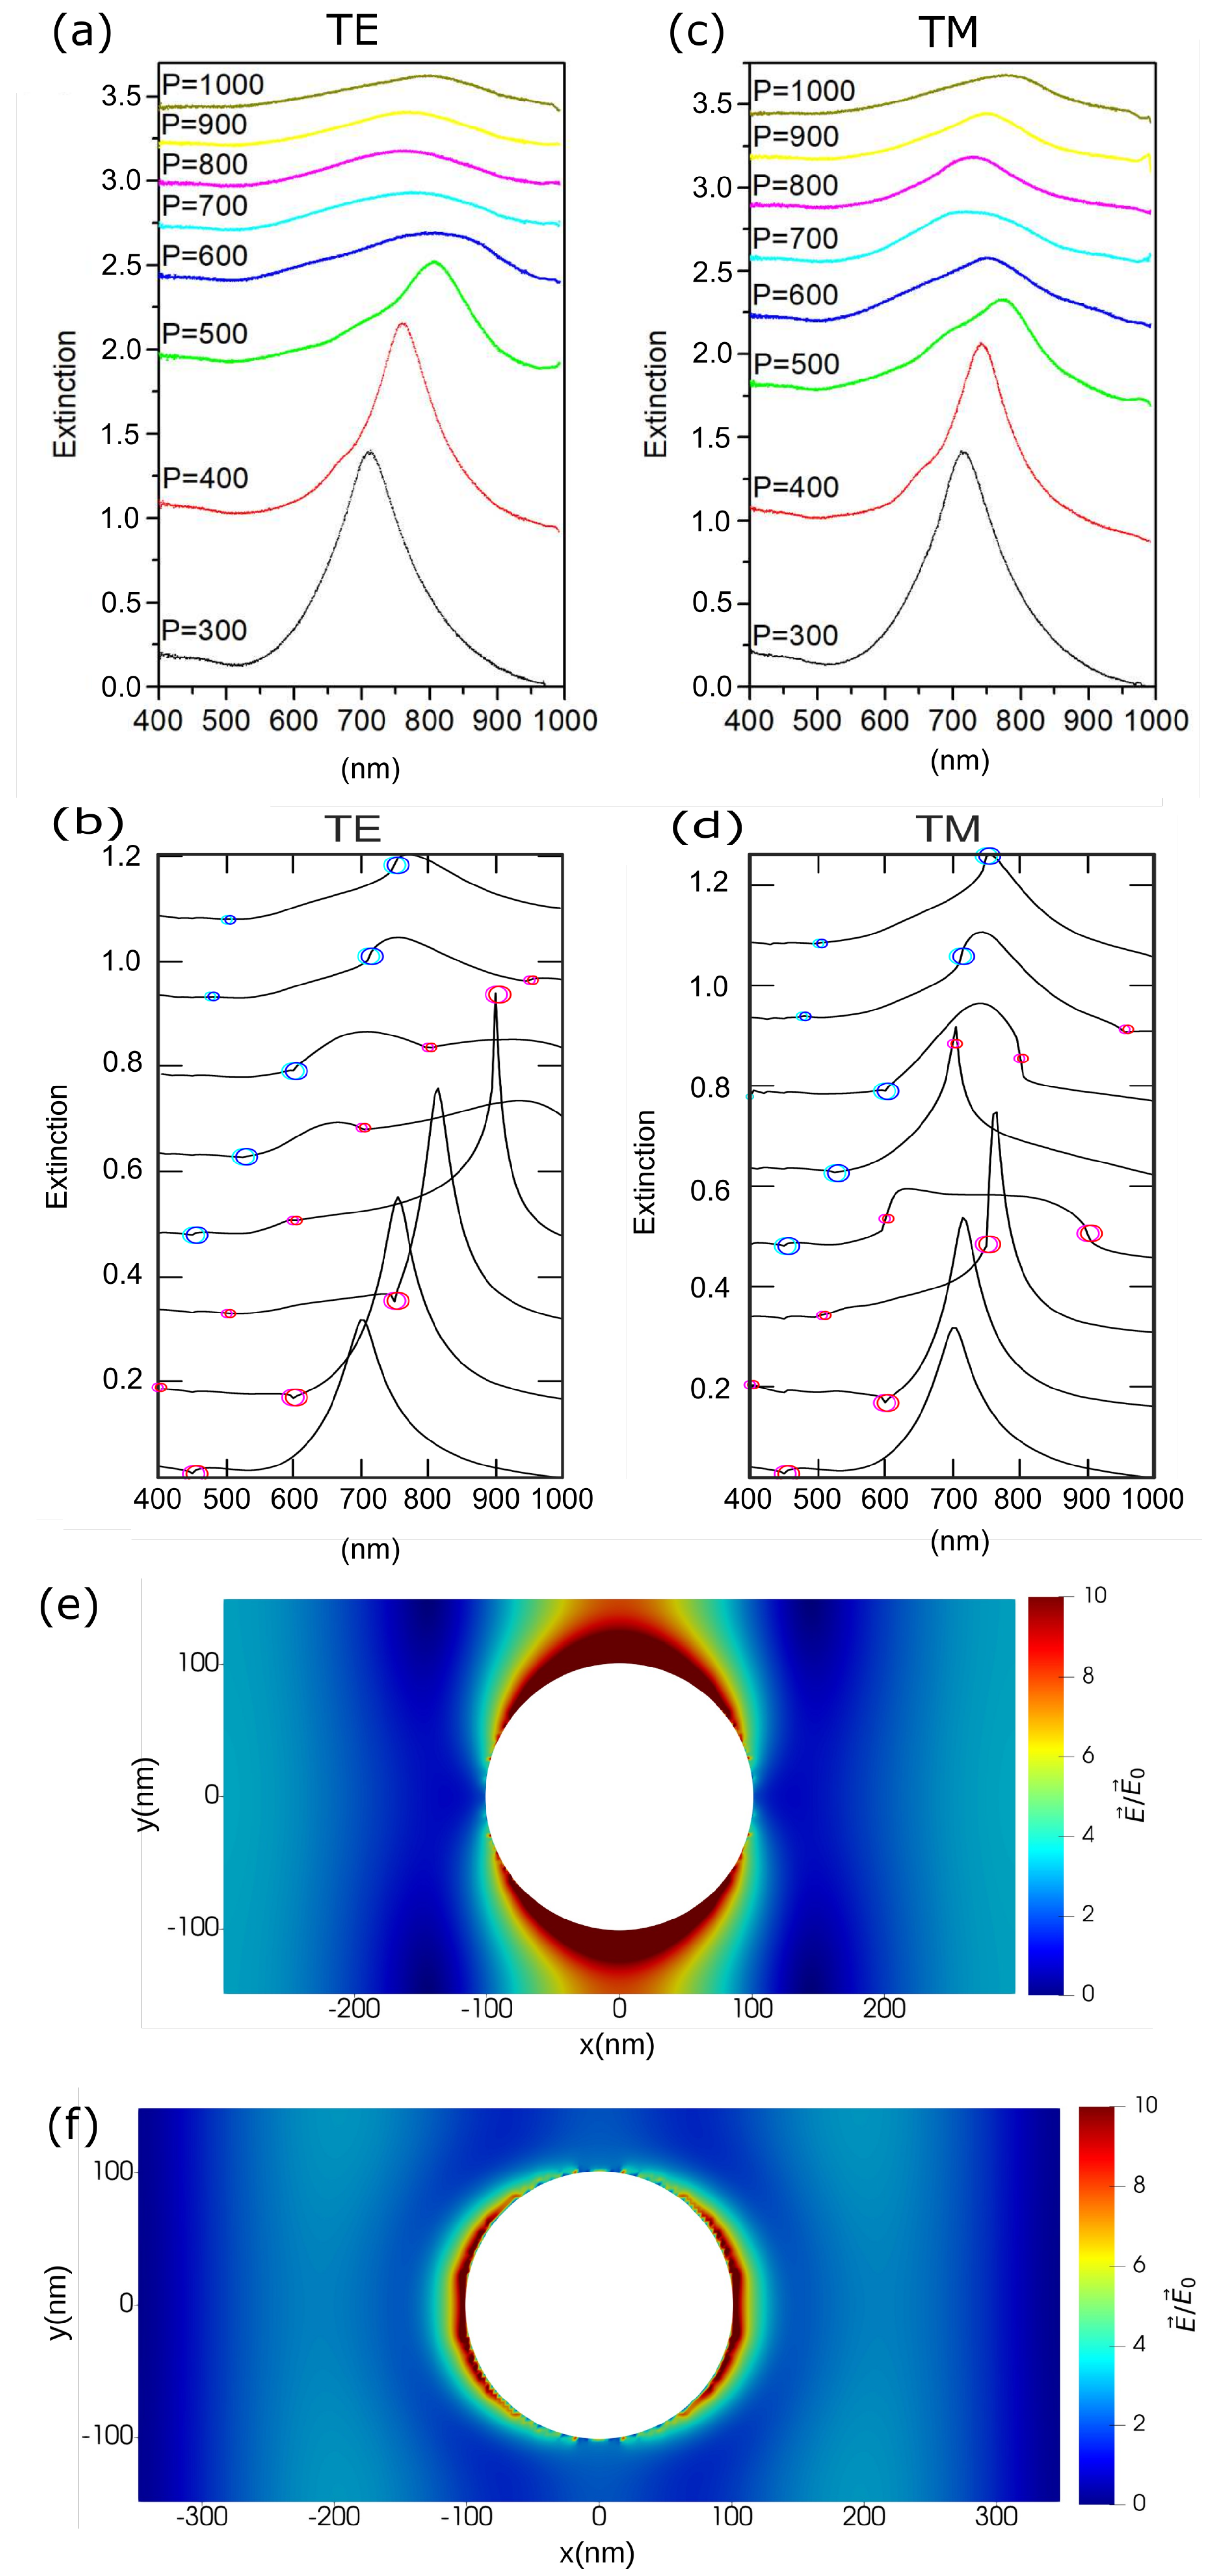
This section reports the extinction spectra at normal incidence both for TE and TM polarization, which were obtained in arrays of Au nanoantennas with P y = 300 nm and P x values that vary from 300 to 1000 nm. Figure 3 shows the trend of LPMs presenting the experimental (top) and numerical (bottom) spectra in case of TE (a,b) and TM (c,d) polarization. As a general feature, experimental and numerical extinction spectra show a good agreement in terms of peaks spectral positions. However, the sharpness exhibited by some numerical spectra (e.g., P x = 500 nm, TE polarization and P x = 600 nm, TM polarization) is not evident in the corresponding experimental results. This can be related to the fact that approximation to a pure plane wave of the incoming light is quite stretched because of the numerical aperture (NA) value of the involved optical objectives. For the incoming light, this circumstance determines a range of k vectors centered around the normal direction, and therefore, the detected spectrum of a given array is the result of an average of the many spectra corresponding to different angles of excitation.
For the array with P x = P y = 300 nm, curves related to TE and TM polarization states are identical, showing a marked dipolar peak at λ = 710 nm because the electric field of the incoming light experiences the same distribution of AuNAs on both x and y directions. The spectral position of the lattice dipolar peak is first red-shifted with the pitch variation ( P x = 300 –600 nm (TE) and P y = 300 –500 nm (TM)), suddenly blue-shifted in samples for which P x = 700 –800 nm, then again progressively red-shifted for P x = 900 –1000 nm. As a general comment, the presence of a periodical arrangement with its DOs has a substantial influence on the extinction spectra that increases proportionally with the array pitch. In more detail, in case of TE polarization (Figure 3a,b), for P x = 300 nm, being the DOs spectrally far from the lattice dipolar plasmon excitation, it has no influence on the spectra. When the pitch increases ( P x = 400 nm), the first DO (1, 0), propagating at the glass-particles interface, is spectrally located at λ ( 1 , 0 ) g l a s s = 600 nm (red circle): it results in a sharp dip and has no interaction with the plasmon excitation. For P x = 500 nm, this first DO is now spectrally located at λ ( 1 , 0 ) g l a s s = 750 nm; although it does not interact yet with the plasmon excitation, it creates a sharp minimum at the edge of the lattice dipolar peak. In the array with P x = 600 nm, the spectral positions of the first DO (1, 0) and of the dipolar excitation are very close and interact, thus resulting in a narrow peak at λ = 900 nm. The electric field distribution, calculated 5 nm above the glass substrate, is reported in Figure 3e. The light blue bands on the side of the cylinder is the signature of the Rayleigh anomalies. The axis limits correspond to the unit cell of the investigated grating. This peak is exhibited only in numerical spectra and presents a good amplitude and a full width at half maximum (FWHM) of less than 10 nm. Incidentally, where application-oriented investigations are concerned, this feature could be of some interest for lasing applications or nanoantenna devices [27]. Still in the curve of the sample with P x = 600 nm, the first DO (1, 0) propagating in air (small red circle) is located at λ ( 1 , 0 ) a i r = 600 nm and has no influence on the spectra. For P x = ( 700 1000 ) nm, the first DO propagating at the glass interface is out of the considered wavelength range. However, for P x = 700 nm, the first DO (1, 0) propagating at the air interface and the second DO (2, 0) propagating at the glass–particles interface together influence the features of the dipolar excitation. In fact, the dipolar peak is in this case placed between these two DOs, and it is small and quite broad. When present, these broad peaks are usually spectrally limited by the positions of close DOs. This is clearly visible also in the curves related to P x = 800 nm and P x = 900 nm. In particular, for P x = 1000 nm, the first DO propagating at the particles–air interface is out of the spectral range; the second DO (2, 0) at the glass–particles interface is instead spectrally close to the plasmon excitation and an interaction is evident: the resulting peak shows a larger amplitude, compared to the one of the previous broad peaks, and it is narrower. The spectral shifts obtained in the sample with P x = ( 300 600 ) nm are noticeable, and the lattice dipolar peaks are narrow. The high sensibility of the plasmon excitation to the NPs separation can be used to design nano-strain sensors [15,45,46,47].
In case of TM polarization (Figure 3c,d), the lattice dipolar plasmon peaks obtained in the spectral interval P x = ( 300 500 ) nm present a lower extinction amplitude and a less pronounced wavelength range of the red-shift with respect to the TE case. This is mainly due to the fact that the incoming electric field has both x and y components, but only the x one induces a dipolar excitation of the AuNAs. As such, a potential increase of the incidence angle would decrease the x component even more, thus damping the plasmon shift. In the numerical results, for the NAs array with P x = 600 nm, the dipolar excitation interacts with the (1, 0) DOs propagating both at the interface of NAs–air ( λ ( 1 , 0 ) a i r = 600 nm) and at their interface with glass ( λ ( 1 , 0 ) g l a s s = 900 nm); the resulting peak is very broad, about 300 nm. By comparing this result with the corresponding one for TE polarization, it is possible to infer that for the same configuration of nanoantennas, depending on the exciting polarization, it is possible to obtain very narrow dipolar or very broad dipolar peaks. The broad peak is quite attractive for biosensors design as it could be used to enhance the fluorescence emission of photosystems [48]. Indeed, because of the peak broadness, the spectral position of the considered photosystem emission can remain in the range of plasmon excitation even if the external conditions change, thus leading to a continuous enhancement of the emission. When the pitch of the AuNAs array increases ( P x = 700 nm), the behavior observed for TE and TM polarization is inverse: the narrow peak appears in TM case and the broad peak appears in TE, spreading on around 150 nm. The broad peak is confined between the DOs (2, 0) and (1, 0) propagating at the interface of NAs with glass and air, respectively. The narrow peak originates from the interaction of the dipolar (TM) excitation with the DO (1, 0) propagating at the interface of NAs–air (small red circle). The resulting electric field, calculated 5 nm above the glass substrate, is reported in Figure 3f. With this configuration, it is possible to switch from biosensor to nanoantenna or lasing device by simply changing the exciting polarization or by modifying the array pitch (by realizing, if needed, a stretchable device). In the arrays with P x = 800 nm and P x = 900 nm, the same feature is observed in both polarization configurations; the dipolar mode is limited between the two previous DOs, (2, 0) and (1, 0), and the resulting peak is broad enough. For a sample with P x = 1000 nm, the spectral position of the DO (1, 0) propagating at the interface of nanoantennas–air is out of the spectral range of the detector used herein. The second order of diffraction (1, 0), propagating at the interface of NPs–glass, interacts with the dipolar excitation, thus resulting in a narrower lattice dipolar plasmon peak with larger amplitude with respect to the TE case. The above results clearly show that the arrays of AuNAs with variable Px represent an extremely rich platform that allows exploring the lattice dipolar plasmon mode in a huge number of possible technological applications, and particularly in sensing where the sensitivity of the nanoantennas array can increase or decrease by changing the polarization configuration.

3.2. Plasmonic Response at Oblique Incidence

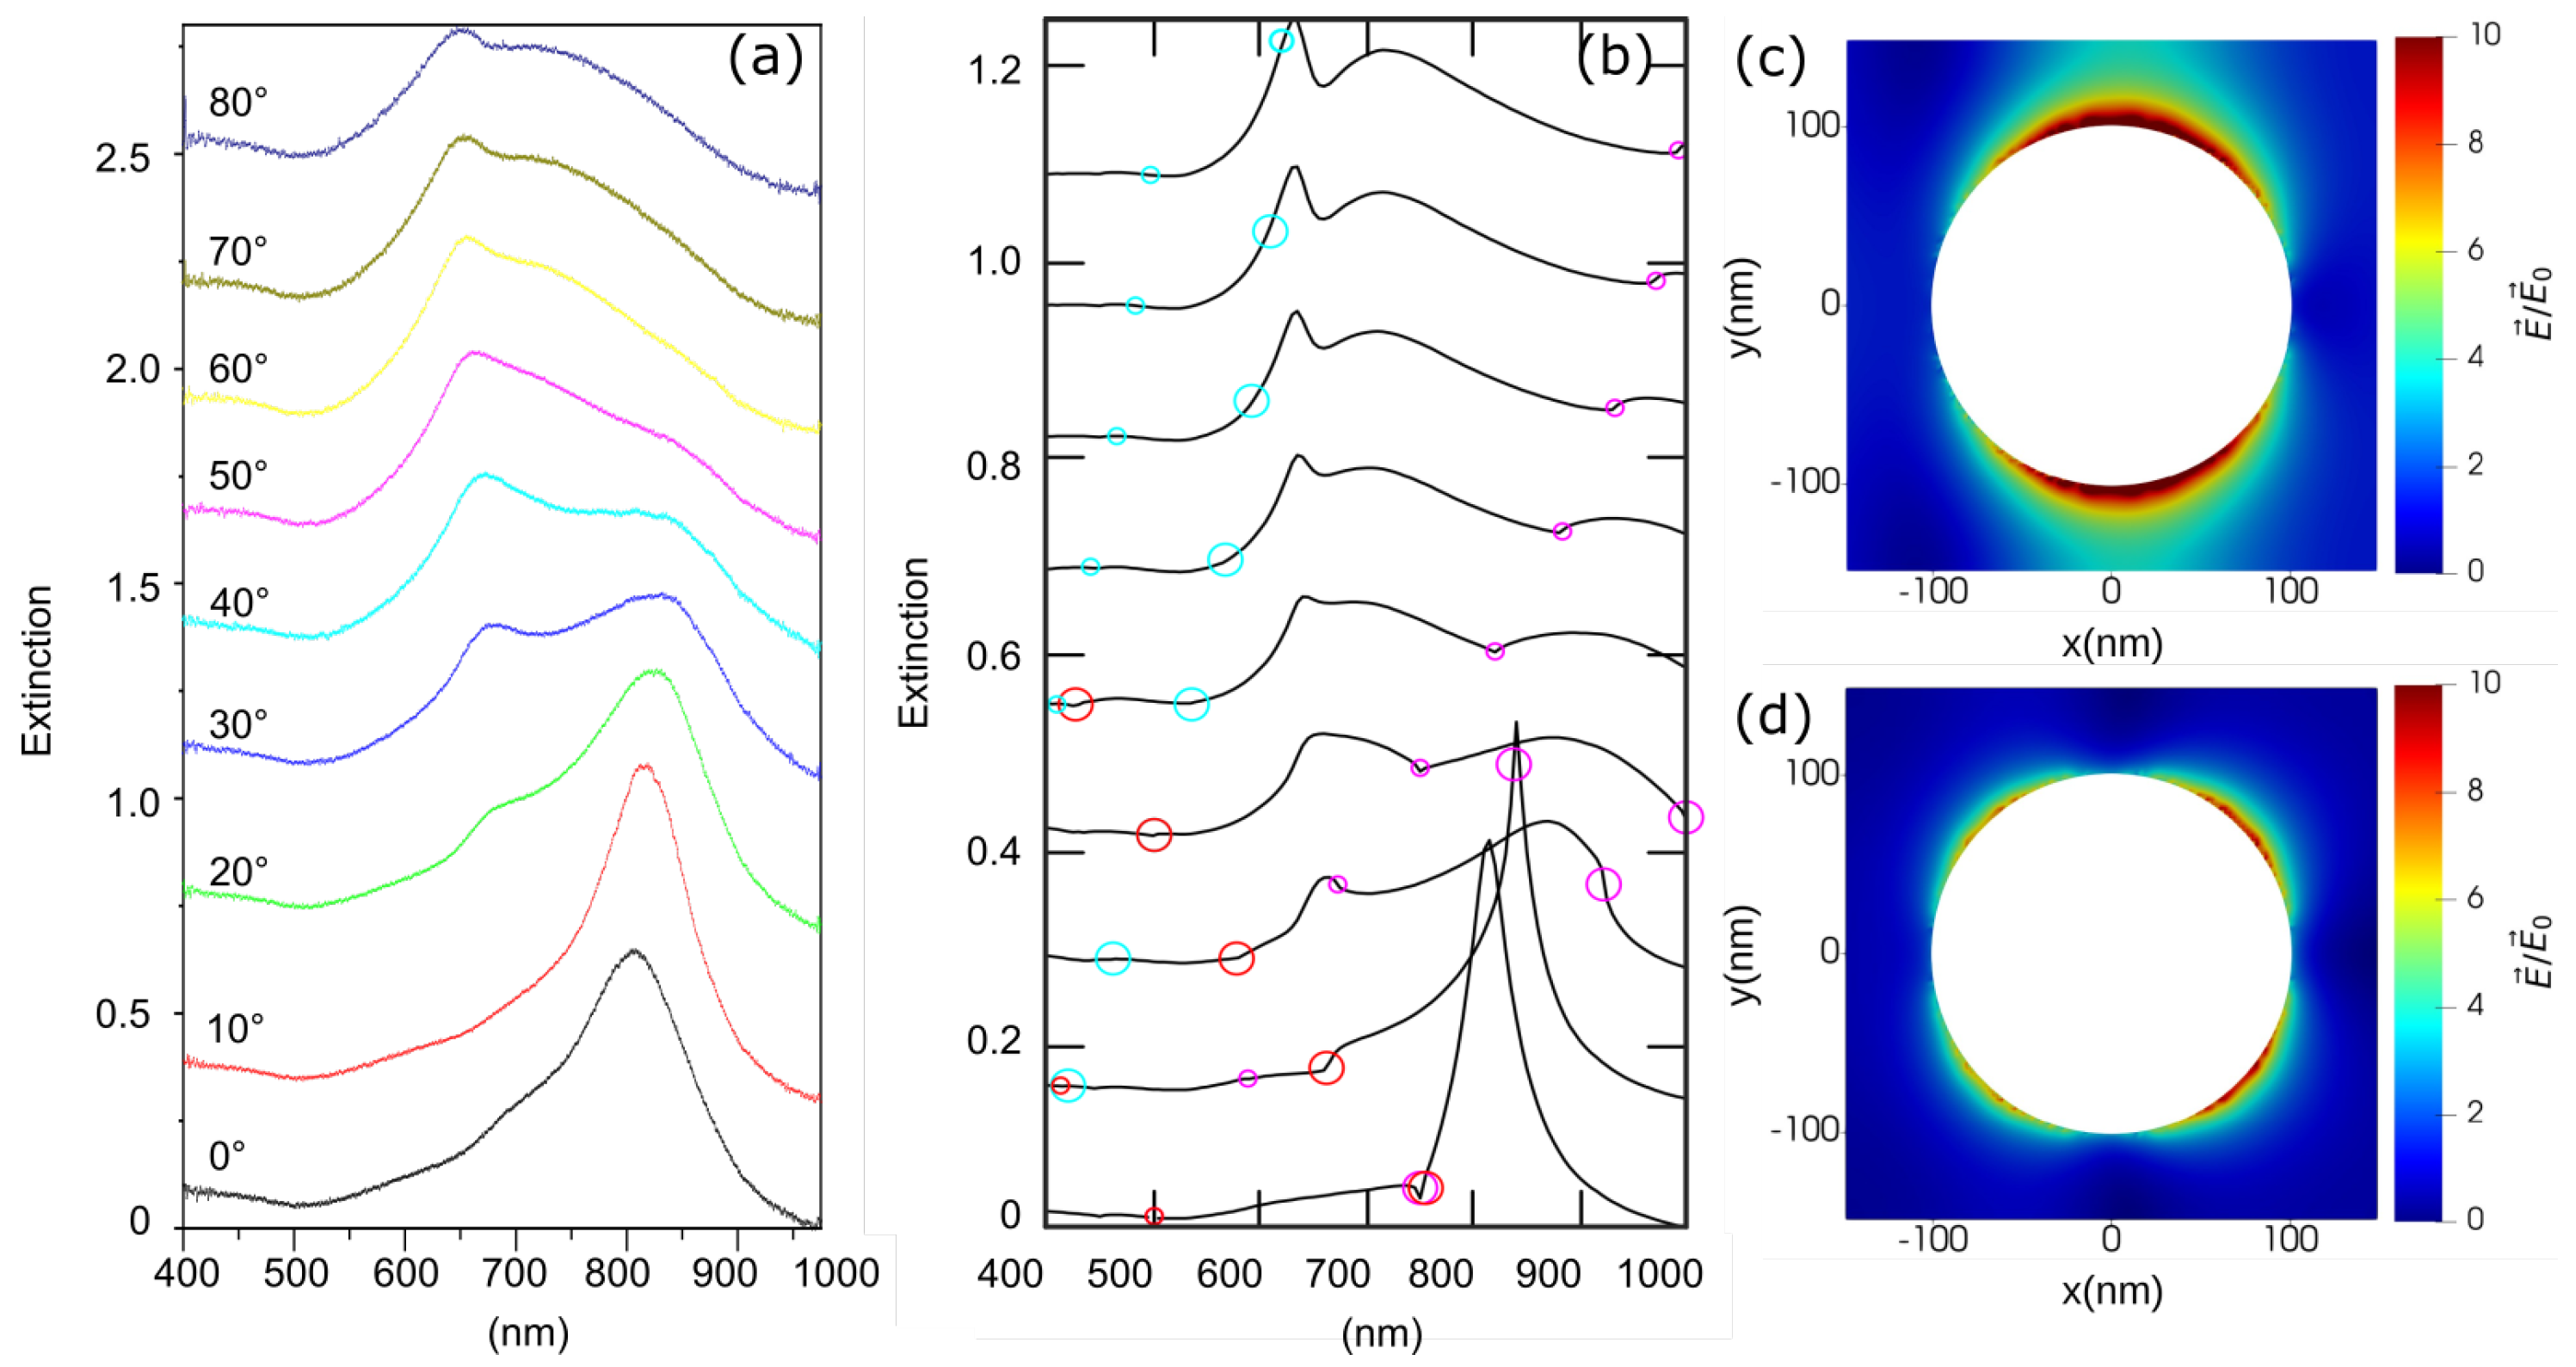
Later on, the extinction spectra were acquired by varying the incidence angle of exciting light from 0 to 80 . This choice is extremely effective in order to deeply investigate the edge diffraction effects on the plasmon response of metal NAs. For the technical reasons mentioned in the previous section, sharp minima and narrow peaks are not exhibited in the experimental spectra. However, the good spectral correspondence of experimental and numerical modes deserves to be mentioned. Figure 4 shows the experimental (a) and numerical (b) spectra of angle-resolved measurements for the array with P y = 300 nm and P x = 500 nm, with TE polarization of the impinging light. At normal incidence, a very narrow peak is visible around λ ( 1 , 0 ) glass = 800 nm in the simulated spectra; this peak results from the interaction between the first DO (1, 0) propagating at the NAs–glass interface and the NAs dipolar mode. By increasing the incidence angle to θ = 10 , in addition to the previous (1, 0) DO, the (−1, 0) DO, propagating at the interface of NAs with glass and air, also arises. This diffracted order is spectrally very close to the dipolar mode, thus resulting in a strong interaction that determines a very narrow peak (few nm) with significant amplitude; see the field distribution in Figure 4c. This peak is red-shifted with respect to the corresponding one measured at normal incidence. The evanescent wave (1, 0) at the glass interface causes a sharp dip at λ ( 1 , 0 ) air = 680 nm. The shoulder corresponding to the quadrupolar mode is also visible, and its spectral position is close to the (1, 0) diffraction at the glass interface. For θ = 20 , the spectra present two clear peaks: a broad red-shifted lattice dipolar plasmon mode and a well defined blue-shifted quadrupolar mode. The DO (−1, 0) at the air interface is very close to the quadrupolar mode and interacts with it, giving rise to the observed well-defined peak. The dipolar mode does not couple with the DO (−1, 0) at the glass interface. Indeed, the spectral position of the last one is way too far to allow the interaction between the evanescent wave and dipolar plasmon excitation. The DO (1, 0) is blue-shifted and has then no influence on the spectra. For θ = 30 , the DO (−1, 0) at the interface with glass is at the limit of the detector range used herein. The dipolar mode is enclosed between this DO and the DO (−1, 0) at the interface with air at λ = 750 nm, resulting in a very broad peak. The quadrupolar mode is also broad but more visible. A new DO, (−2, 0), in the glass appears in the spectrum (cyan circle). This evanescent wave does not influence the lattice quadrupolar mode because of their spectral separation. By further increasing the incidence angle of the incoming light ( θ = 40 and larger angles), the lattice dipolar plasmon mode is progressively blue-shifted. The (−2, 0) DO propagating at the interface with glass becomes progressively closer to the quadrupolar mode; see the field distribution in Figure 4d, until they are spectrally superimposed for θ = 80 . This lattice quadrupolar plasmon mode is well-defined and shows an amplitude even larger than the lattice dipolar plasmon mode on the same curve. The DO (−1, 0) propagating at the interface with air is progressively red-shifted and locally causes sharp minima. Finally, the identification of a general trend in angle-resolved measurements of the spectral position of modes of samples with a larger pitch of the array is much more complex. Indeed, in those cases, the plasmon coupling is influenced by multiple diffraction orders propagating at the glass and air interfaces. This deep mode analysis will be the object of further research.

4. Conclusions

The coupling of modes in arrays of Au nanoantennas has been analyzed in terms of several parameters, such as variation of the array pitch (from 300 to 1000 nm), polarization of the impinging light (TE and TM), and excitation angle (from 0 to 80 ). Experimental results are in good agreement with the numerical study. As a result of the 2D ordered arrangement of Au nanoantennas, the array supports evanescent diffraction waves propagating at the glass or air interfaces of the NAs that depend on the array parameters (separation in x and y directions) and excitation angle. It is found that the diffraction waves largely influence the concavity of extinction spectra, the plasmon mode, and hence the potential technological applications. At normal incidence illumination, by varying the array pitch in the x direction, it is possible to implement a strain nano-sensor with a considerable range of sensitivity. This sensor can operate both with TE and TM polarizations. When the considered diffracted order is spectrally quite close to the plasmon mode, the latter results in a very narrow peak. This coupling condition can be efficiently implemented in applications such as lasing and wave guiding. However, the utilized experimental conditions (e.g., high NA optical objectives) did not allow highlighting these narrow peaks in the experimental spectra. On the other hand, the spectral position of the plasmon modes measured in the experiments matches quite well with the numerical one. In specific conditions, both at normal illumination and for certain given angles, it is possible to obtain either very narrow peaks or broad modes spectrally extending for hundreds of nanometers depending on the exciting polarization state (TE or TM). These configurations could be suitable for application in plasmon-enhanced spectroscopy, especially in the implementation of a biosensor for molecule detection. An advantage in angle-resolved measurements operation is the possibility of obtaining different coupling responses for a given array, exploiting high DOs interplay when the illumination angle is increased. Finally, this paper highlights the existence of a variety of experimental coupling in arrays of nanoantennas. Despite the difficulties in obtaining experimental narrow peaks, it clearly appears that the nanoantennas in 2D configuration present a huge potential for technological applications.

Author Contributions

All authors contributed to numerical and experimental results. All authors have contributed to writing the manuscript. All authors have read and agreed to the published version of the manuscript.

Funding

This work has been supported by the Agence Nationale de la Recherche and the FEDER (INSOMNIA project, contract “ANR-18-CE09-0003“). Financial support of NanoMat (www.nanomat.eu) by the “Ministère de l’enseignement supérieur et de la recherche,” the “Conseil régional Champagne-Ardenne,” the “Fonds Européen de Développement Régional (FEDER) fund,” and the “Conseil général de l’Aube” is also acknowledged. This work has been made within the framework of the Graduate School NANO-PHOT (École Universitaire de Recherche, contract ANR-18-EURE-0013). The author(s) would like to acknowledge networking support by the COST Action IC1208 and MP1302.

Data Availability Statement

Data underlying the results presented in this paper are not publicly available at this time but may be obtained from the authors upon reasonable request.

Acknowledgments

This work has been supported by “DEMETRA—Sviluppo di tecnologie di materiali e di tracciabilità per la sicurezza e la qualità dei cibi” PON ARS01 00401; by the Agence Nationale de la Recherche and the FEDER (INSOMNIA project, contract “ANR-18-CE09-0003“). Financial support of NanoMat (www.nanomat.eu) by the “Ministère de l’enseignement supérieur et de la recherche,” the “Conseil régional Champagne-Ardenne,” the “Fonds Européen de Développement Régional (FEDER) fund,” and the “Conseil général de l’Aube” is also acknowledged. This work has been made within the framework of the Graduate School NANO-PHOT (École Universitaire de Recherche, contract ANR-18-EURE-0013). The author(s) would like to acknowledge networking support by the COST Action IC1208 and MP1302.

Conflicts of Interest

The authors declare no conflict of interest.

References

  1. Lio, G.E.; Ferraro, A.; Giocondo, M.; Caputo, R.; De Luca, A. Color Gamut Behavior in Epsilon Near-Zero Nanocavities during Propagation of Gap Surface Plasmons. Adv. Opt. Mater. 2020, 8, 2000487. [Google Scholar] [CrossRef]
  2. Colburn, S.; Zhan, A.; Majumdar, A. Metasurface optics for full-color computational imaging. Sci. Adv. 2018, 4, eaar2114. [Google Scholar] [CrossRef] [Green Version]
  3. Lio, G.E.; De Luca, A.; Umeton, C.P.; Caputo, R. Opto-mechanically induced thermoplasmonic response of unclonable flexible tags with hotspot fingerprint. J. Appl. Phys. 2020, 128, 093107. [Google Scholar]
  4. Lio, G.E.; Ferraro, A.; Ritacco, T.; Aceti, D.M.; De Luca, A.; Giocondo, M.; Caputo, R. Leveraging on ENZ Metamaterials to Achieve 2D and 3D Hyper-Resolution in Two-Photon Direct Laser Writing. Adv. Mater. 2021, 33, 2008644. [Google Scholar] [CrossRef] [PubMed]
  5. Ghindani, D.; Rashed, A.R.; Habib, M.; Caglayan, H. Gate Tunable Coupling of Epsilon-Near-Zero and Plasmonic Modes. Adv. Opt. Mater. 2021, 9, 2100800. [Google Scholar] [CrossRef]
  6. Linic, S.; Chavez, S.; Elias, R. Flow and extraction of energy and charge carriers in hybrid plasmonic nanostructures. Nat. Mater. 2021, 20, 916–924. [Google Scholar] [CrossRef]
  7. Chaharsoughi, M.S.; Tordera, D.; Grimoldi, A.; Engquist, I.; Berggren, M.; Fabiano, S.; Jonsson, M.P. Hybrid Plasmonic and Pyroelectric Harvesting of Light Fluctuations. Adv. Opt. Mater. 2018, 6, 1701051. [Google Scholar] [CrossRef]
  8. Aieta, F.; Genevet, P.; Kats, M.A.; Yu, N.; Blanchard, R.; Gaburro, Z.; Capasso, F. Aberration-free ultrathin flat lenses and axicons at telecom wavelengths based on plasmonic metasurfaces. Nano Lett. 2012, 12, 4932–4936. [Google Scholar] [CrossRef]
  9. Yu, N.; Capasso, F. Flat optics with designer metasurfaces. Nat. Mater. 2014, 13, 139–150. [Google Scholar] [CrossRef]
  10. Ferraro, A.; Lio, G.E.; Hmina, A.; Palermo, G.; Maurer, T.; Caputo, R. Tailoring of Plasmonic Functionalized Metastructures to Enhance Local Heating Release. Nanophotonics 2021, 10, 3907–3916. [Google Scholar] [CrossRef]
  11. Cui, T.; Bai, B.; Sun, H.B. Tunable metasurfaces based on active materials. Adv. Funct. Mater. 2019, 29, 1806692. [Google Scholar] [CrossRef]
  12. Špačková, B.; Homola, J. Sensing properties of lattice resonances of 2D metal nanoparticle arrays: An analytical model. Opt. Express 2013, 21, 27490–27502. [Google Scholar] [CrossRef] [PubMed]
  13. Lozano, G.; Louwers, D.J.; Rodríguez, S.R.; Murai, S.; Jansen, O.T.; Verschuuren, M.A.; Rivas, J.G. Plasmonics for solid-state lighting: Enhanced excitation and directional emission of highly efficient light sources. Light. Sci. Appl. 2013, 2, e66. [Google Scholar] [CrossRef] [Green Version]
  14. Lozano, G.; Rodriguez, S.R.; Verschuuren, M.A.; Rivas, J.G. Metallic nanostructures for efficient LED lighting. Light. Sci. Appl. 2016, 5, e16080. [Google Scholar] [CrossRef] [PubMed] [Green Version]
  15. Cataldi, U.; Caputo, R.; Kurylyak, Y.; Klein, G.; Chekini, M.; Umeton, C.; Bürgi, T. Growing gold nanoparticles on a flexible substrate to enable simple mechanical control of their plasmonic coupling. J. Mater. Chem. C 2014, 2, 7927–7933. [Google Scholar] [CrossRef]
  16. Koya, A.N.; Cunha, J.; Guerrero-Becerra, K.A.; Garoli, D.; Wang, T.; Juodkazis, S.; Proietti Zaccaria, R. Plasmomechanical Systems: Principles and Applications. Adv. Funct. Mater. 2021, 31, 2103706. [Google Scholar] [CrossRef]
  17. Vecchi, G.; Giannini, V.; Rivas, J.G. Surface modes in plasmonic crystals induced by diffractive coupling of nanoantennas. Phys. Rev. B 2009, 80, 201401. [Google Scholar] [CrossRef] [Green Version]
  18. Giannini, V.; Vecchi, G.; Rivas, J.G. Lighting up multipolar surface plasmon polaritons by collective resonances in arrays of nanoantennas. Phys. Rev. Lett. 2010, 105, 266801. [Google Scholar] [CrossRef] [Green Version]
  19. Giannini, V.; Fernández-Domínguez, A.I.; Heck, S.C.; Maier, S.A. Plasmonic nanoantennas: Fundamentals and their use in controlling the radiative properties of nanoemitters. Chem. Rev. 2011, 111, 3888–3912. [Google Scholar] [CrossRef]
  20. Humphrey, A.D.; Barnes, W.L. Plasmonic surface lattice resonances on arrays of different lattice symmetry. Phys. Rev. B 2014, 90, 075404. [Google Scholar] [CrossRef] [Green Version]
  21. Mahi, N.; Leveque, G.; Saison, O.; Marae-Djouda, J.; Caputo, R.; Gontier, A.; Maurer, T.; Adam, P.M.; Bouhafs, B.; Akjouj, A. In depth investigation of lattice plasmon modes in substrate-supported gratings of metal monomers and dimers. J. Phys. Chem. C 2017, 121, 2388–2401. [Google Scholar] [CrossRef]
  22. Li, J.F.; Li, C.Y.; Aroca, R.F. Plasmon-enhanced fluorescence spectroscopy. Chem. Soc. Rev. 2017, 46, 3962–3979. [Google Scholar] [CrossRef] [PubMed]
  23. Le Ru, E.; Etchegoin, P. Principles of Surface-Enhanced Raman Spectroscopy: And Related Plasmonic Effects; Elsevier: Cham, Switzerland, 2008. [Google Scholar]
  24. Xu, H.; Bjerneld, E.J.; Käll, M.; Börjesson, L. Spectroscopy of single hemoglobin molecules by surface enhanced Raman scattering. Phys. Rev. Lett. 1999, 83, 4357. [Google Scholar] [CrossRef] [Green Version]
  25. Bauch, M.; Toma, K.; Toma, M.; Zhang, Q.; Dostalek, J. Plasmon-enhanced fluorescence biosensors: A review. Plasmonics 2014, 9, 781–799. [Google Scholar] [CrossRef] [Green Version]
  26. Langer, J.; Jimenez de Aberasturi, D.; Aizpurua, J.; Alvarez-Puebla, R.A.; Auguié, B.; Baumberg, J.J.; Bazan, G.C.; Bell, S.E.; Boisen, A.; Brolo, A.G.; et al. Present and future of surface-enhanced Raman scattering. ACS Nano 2019, 14, 28–117. [Google Scholar] [CrossRef] [PubMed] [Green Version]
  27. Wang, D.; Bourgeois, M.R.; Lee, W.K.; Li, R.; Trivedi, D.; Knudson, M.P.; Wang, W.; Schatz, G.C.; Odom, T.W. Stretchable Nanolasing from Hybrid Quadrupole Plasmons. Nano Lett. 2018, 18, 4549–4555. [Google Scholar] [CrossRef]
  28. Thackray, B.D.; Thomas, P.A.; Auton, G.H.; Rodriguez, F.J.; Marshall, O.P.; Kravets, V.G.; Grigorenko, A.N. Super-narrow, extremely high quality collective plasmon resonances at telecom wavelengths and their application in a hybrid graphene-plasmonic modulator. Nano Lett. 2015, 15, 3519–3523. [Google Scholar] [CrossRef]
  29. Lio, G.E.; Madrigal, J.B.; Couteau, C.; Blaize, S.; Caputo, R. Conceptual Implementation of a Photonic–Plasmonic Transistor onto a Structured Nano-Guided Hybrid System. Phys. Status Solidi A 2020, 217, 1900911. [Google Scholar] [CrossRef]
  30. Maurer, T.; Marae-Djouda, J.; Cataldi, U.; Gontier, A.; Montay, G.; Madi, Y.; Panicaud, B.; Macias, D.; Adam, P.M.; Lévêque, G.; et al. The beginnings of plasmomechanics: Towards plasmonic strain sensors. Front. Mater. Sci. 2015, 9, 170–177. [Google Scholar] [CrossRef] [Green Version]
  31. Laible, F.; Horneber, A.; Fleischer, M. Mechanically Tunable Nanogap Antennas: Single-Structure Effects and Multi-Structure Applications. Adv. Opt. Mater. 2021, 9, 2100326. [Google Scholar] [CrossRef]
  32. Palermo, G.; Cataldi, U.; Condello, A.; Caputo, R.; Bürgi, T.; Umeton, C.; De Luca, A. Flexible thermo-plasmonics: An opto-mechanical control of the heat generated at the nanoscale. Nanoscale 2018, 10, 16556–16561. [Google Scholar] [CrossRef] [PubMed]
  33. Zhou, W.; Odom, T.W. Tunable subradiant lattice plasmons by out-of-plane dipolar interactions. Nat. Nanotechnol. 2011, 6, 423–427. [Google Scholar] [CrossRef] [PubMed]
  34. Locatelli, A.; De Angelis, C.; Modotto, D.; Boscolo, S.; Sacchetto, F.; Midrio, M.; Capobianco, A.D.; Pigozzo, F.M.; Someda, C.G. Modeling of enhanced field confinement and scattering by optical wire antennas. Opt. Express 2009, 17, 16792–16800. [Google Scholar] [CrossRef] [PubMed]
  35. Auguié, B.; Bendana, X.M.; Barnes, W.L.; de Abajo, F.J.G. Diffractive arrays of gold nanoparticles near an interface: Critical role of the substrate. Phys. Rev. B 2010, 82, 155447. [Google Scholar] [CrossRef] [Green Version]
  36. Sadeghi, S.; Wing, W.; Campbell, Q. Normal and anomalous plasmonic lattice modes of gold nanodisk arrays in inhomogeneous media. J. Appl. Phys. 2016, 119, 114307. [Google Scholar] [CrossRef] [Green Version]
  37. Meier, M.; Wokaun, A.; Liao, P.F. Enhanced fields on rough surfaces: Dipolar interactions among particles of sizes exceeding the Rayleigh limit. JOSA B 1985, 2, 931–949. [Google Scholar] [CrossRef]
  38. Auguié, B.; Barnes, W.L. Collective resonances in gold nanoparticle arrays. Phys. Rev. Lett. 2008, 101, 143902. [Google Scholar] [CrossRef] [Green Version]
  39. Rayleigh, L. On the dynamical theory of gratings. Proc. R. Soc. Lond. Ser. Contain. Pap. Math. Phys. Character 1907, 79, 399–416. [Google Scholar]
  40. Byelobrov, V.O.; Zinenko, T.L.; Kobayashi, K.; Nosich, A.I. Periodicity Matters: Grating or lattice resonances in the scattering by sparse arrays of subwavelength strips and wires. IEEE Antennas Propag. Mag. 2015, 57, 34–45. [Google Scholar] [CrossRef]
  41. Ferraro, A.; Zografopoulos, D.C.; Verschuuren, M.A.; de Boer, D.K.; Kong, F.; Urbach, H.P.; Beccherelli, R.; Caputo, R. Directional Emission of Fluorescent Dye-Doped Dielectric Nanogratings for Lighting Applications. ACS Appl. Mater. Interfaces 2018, 10, 24750–24757. [Google Scholar] [CrossRef]
  42. Kravets, V.G.; Kabashin, A.V.; Barnes, W.L.; Grigorenko, A.N. Plasmonic surface lattice resonances: A review of properties and applications. Chem. Rev. 2018, 118, 5912–5951. [Google Scholar] [CrossRef]
  43. Kildishev, A.V.; Boltasseva, A.; Shalaev, V.M. Planar photonics with metasurfaces. Science 2013, 339, 1232009. [Google Scholar] [CrossRef] [PubMed] [Green Version]
  44. Marae-Djouda, J.; Caputo, R.; Mahi, N.; Lévêque, G.; Akjouj, A.; Adam, P.M.; Maurer, T. Angular plasmon response of gold nanoparticles arrays: Approaching the Rayleigh limit. Nanophotonics 2017, 6, 279–288. [Google Scholar] [CrossRef]
  45. Chang, K.H.; Cheng, J.S.; Lu, T.W.; Lee, P.T. Engineering surface lattice resonance of elliptical gold nanodisk array for enhanced strain sensing. Opt. Express 2018, 26, 33215–33225. [Google Scholar] [CrossRef] [PubMed]
  46. Marae-Djouda, J.; Gontier, A.; Caputo, R.; Lévêque, G.; Bercu, B.; Madi, Y.; Montay, G.; Adam, P.M.; Molinari, M.; Stagon, S.; et al. Dense brushes of tilted metallic nanorods grown onto stretchable substrates for optical strain sensing. ACS Appl. Nano Mater. 2018, 1, 2347–2355. [Google Scholar] [CrossRef]
  47. Utyushev, A.D.; Zakomirnyi, V.I.; Rasskazov, I.L. Collective lattice resonances: Plasmonics and beyond. Rev. Phys. 2021, 6, 100051. [Google Scholar] [CrossRef]
  48. Ashraf, I.; Konrad, A.; Lokstein, H.; Skandary, S.; Metzger, M.; Djouda, J.M.; Maurer, T.; Adam, P.M.; Meixner, A.J.; Brecht, M. Temperature dependence of metal-enhanced fluorescence of photosystem I from Thermosynechococcus elongatus. Nanoscale 2017, 9, 4196–4204. [Google Scholar] [CrossRef]
Figure 1. Rayleigh anomalies color code; m is the diffraction order along the direction of propagation.
Crystals 12 00336 g001
Figure 2. SEM image of gratings of monomers ( d = 200 nm) with vertical pitch (Py) of 300 nm and horizontal pitch (Px) of 400 nm.
Crystals 12 00336 g002
Figure 3. Experimental (top) and numerical (bottom) extinction spectra at normal incidence on gratings with P y = 300 nm and Px varying from 300 to 1000 nm, for TE (a,b) and TM (c,d) polarization. Electric field distribution calculated 5 nm above the glass substrate for (e) P x = 600 nm, wavelength of 900 nm with TE polarization (f) for P x = 700 nm, wavelength of 700 nm with TM polarization.
Crystals 12 00336 g003
Figure 4. Experimental (a) and numerical (b) extinction spectra with incidence angle varying from 0 to 80 for array having pitch P y = 300 nm and the P x = 500 nm for TE polarization. Electric field distribution calculated 5 nm above the glass substrate for (c) θ = 10 and wavelength of 840 nm, (d) for θ = 70 and wavelength of 630 nm.
Crystals 12 00336 g004
Publisher’s Note: MDPI stays neutral with regard to jurisdictional claims in published maps and institutional affiliations.