Abstract
During the solidification of hypoeutectic Al–7% Si alloy, density differences develop in the melt due to variations in concentration and temperature. On Earth, melt flow can occur due to gravity, which then affects the solidification process. The microgravity environment strongly eliminates convection in the melt and allows investigation of the solidification process in purely diffusive circumstances. In this study, four solidification experiments were performed on grain-refined and non-grain-refined Al–7 wt% Si alloy on-board the International Space Station (ISS) in the Materials Science Lab (MSL) to study the effect of solidification parameters (solid/liquid front velocity (v) and temperature gradient (G)) on the grain structure and dendritic microstructure. The grain structure has been analyzed in detail in some earlier studies. The aim of this work was to carry out detailed analysis of the macrosegregation caused by the diffusion of Si from the initial mushy zone during the homogenization step and the subsequent solidification phase of the experiments as well as the correlated distribution of eutectic along the solidification direction. The secondary dendrite arm spacing (SDAS) for different process conditions was also studied. For these two issues, microgravity experimental results were compared to simulation results. The macrosegregation was calculated by the finite difference method. Because the steady-state solidification conditions were never reached, the solidification process was characterized by the average front velocity and temperature gradient. Considering the actual liquidus temperature (TL) caused by macrosegregation, the SDAS was calculated as a function of the average processing parameters and the actual liquidus temperature with the classical Kirkwood’s equation. As a result, good agreement was obtained between the calculated and measured SDAS.
1. Introduction
The first technological step to produce solid materials from pure metals and alloys is solidification. The final mechanical properties of the products are basically determined by the microstructural parameters that develop during solidification. Cast alloys, such as Al–7 wt% Si, usually contain a solid solution phase and eutectic. The microstructural parameters characterize the different phases and their morphologies. For Al–7 wt% Si, this is the microstructure of the eutectic and the primary phase. To fully characterize the microstructure, the relative amount, the lamella distance, and the distribution are evaluated for the eutectic, while the grain structure (both equiaxed and columnar) and the solid solution primary and secondary dendrite arm spacings are measured for the primary phase. On Earth, because of variations in concentrations and spatial temperatures, buoyancy convection can develop in the liquid phase, superimposing diffusive transport. Therefore, it is impossible to achieve purely diffusive conditions during solidification experiments of massive samples on Earth. Moreover, detailed investigation of grain formation is hindered by buoyancy-driven flow and by the movement of crystals growing in the melt.
The secondary dendrite arm spacing (SDAS, λ2) is one of the most important microstructural parameters of solid solution alloys that are fully or partly solidified (such as the hypoeutectic Al–7% Si cast alloy) because their mechanical properties are strongly dependent on the SDAS. The SDAS can change during solidification by coarsening [1,2,3,4,5]. The coarsening of the secondary dendrite arm is also a diffusion process. The bigger arms can grow, and the smaller arms disappear [6,7]. Therefore, the SDAS changes during solidification:
At the end of the solidification, the following applies:
where is a constant for a given alloy, t is the time, is the local solidification time, and and are kinetic constants.
Suppose the coarsening of the secondary dendrite arm is a pure diffusion process, n = 1/3 and m < n, (m varies between 0.26 and 0.31 [8]). The liquid flow can disturb the coarsening of the secondary dendrite arm. In this case, it overlaps with the diffusion and changes the kinetic of the coarsening, so that 0.33 < n < 0.5 [9,10,11]).
The unidirectional solidification process can be characterized by the temperature gradient (G) in front of the solid/liquid interface (S/L) and its moving velocity (v):
where and are the liquidus and solidus temperature of the alloy, respectively.
Equation (2) is rigorously valid if G and v are the same at the S/L and E/L interfaces. If they are different, it must be considered when calculating the local solidification time, t0.
In unidirectional solidified hypoeutectic alloys (such as Al–7% Si), a mushy zone develops, in which the concentration of the alloying element changes. The concentration is about the same as the initial concentration at the solid/liquid interface (the primary dendrite tip) but higher at the liquid/eutectic interface. During solidification, the alloying element diffuses from the mushy zone to the liquid phase, increasing the element concentration before the solid/liquid interface and decreasing the liquidus temperature and the ΔT. The well-known undercooling gradient and the temperature gradient zone melting (TGZM) was thoroughly analyzed by in situ observation in [12]. The buoyancy convection overlapping the diffusion can also enhance this effect.
Natural convection is overlapped with diffusion on Earth due to the buoyancy force. Therefore, it is impossible to investigate the pure effect of G and v on the SDAS.
The main aim of this work was to study the effect of G and v on the SDAS in purely diffusive conditions considering the following:
- The G and v are not the same at the S/L and E/L interfaces.
- The concentration and then the liquidus temperature change along with the sample.
Solidification experiments under microgravity conditions provide unique benchmark data in diffusive conditions [13,14,15]. Indeed, microgravity conditions suppress gravity-driven phenomena, such as sedimentation and convective flow, due to density differences in the liquid [16]. Thus, a comparative study of directional solidification of Al–7 wt% Si alloys in space and on Earth is ideal for understanding eutectic distribution along the solidification direction and the secondary dendrite arm spacing microstructure. Earlier experiments have shown the CET is less progressive in microgravity conditions compared to Earth conditions due to fluid flow and sedimentation. Additionally, it has been shown that the eutectic percentage is globally lower and the DAS higher in samples solidified on Earth compared to those solidified in microgravity [17,18,19]. The present work compared the modeling and experiments focusing on the evolution of the eutectic and SDAS along the solidification direction in diffusive conditions.
The Material Science Laboratory (MSL) was made available by the European Space Agency (ESA) on-board the International Space Station (ISS), which is being used as a platform for experiments with long microgravity periods. Within Batch2a of the ESA project CETSOL (columnar-to-equiaxed transition in solidification processes), several experiments were carried out using solidification quenching furnace (SQF), a furnace dedicated to directional solidification experiments. These experiments allow pure diffusive solidification conditions and therefore provide unique data for testing the fundamental theories of grain and microstructure formation and for validation and development of numerical models describing the coarsening of secondary dendrite arms in particular. By comparing the results of space- and ground-based experiments, it is also possible to obtain precise information on the effect of buoyancy-driven flow on the microstructure.
The Al–7 wt% Si hypoeutectic alloy was chosen for the experiments because it is the base alloy (with 0.3% Mg) for automotive and transportation applications. The grain structure and the columnar-to-equiaxed transition (CET) were analyzed and discussed in detail for the four experiments in previous papers [17,18,19]. In the present work, we focused on the effect of solidification parameters, namely the velocity of the solid/liquid front and the temperature gradient, on macrosegregation caused by the diffusion of Si from the initial mushy zone during the homogenization step and during solidification experiments, which leads to changes in the eutectic percentage and distribution along the solidification direction and on the secondary dendrite arm spacing.
2. Materials and Methods
2.1. Alloy
Grain-refined and non-grain-refined Al–7 wt% Si alloys used in the experiments were provided by Hydro Aluminium Rolled Products GmbH. The alloys were made from high-purity 99.99 wt% Al and Si material using a vacuum metallurgy process. For grain refinement, 0.5 wt% AlTi5B master alloy was added.
2.2. Solidification Path of Al–7 wt% Si Alloys
Based on differential thermal analysis (DTA) measurements, the solidification path of binary nonmodified Al–7wt% Si alloy was determined with the equilibrium phase diagram [20]. Solidification started at a temperature of 614 °C by the formation of α aluminum dendrites (white part in Figure 1) and was completed by the development of Al–Si binary eutectic (Al solid solution and Si) at a temperature of 574 °C (black part in Figure 1). One part of the eutectic was located between the secondary and tertiary dendrite arms (“A” in Figure 1), while the other part was situated between the primary dendrites (“B” in Figure 1) or at the grain boundaries (“C” in Figure 1).
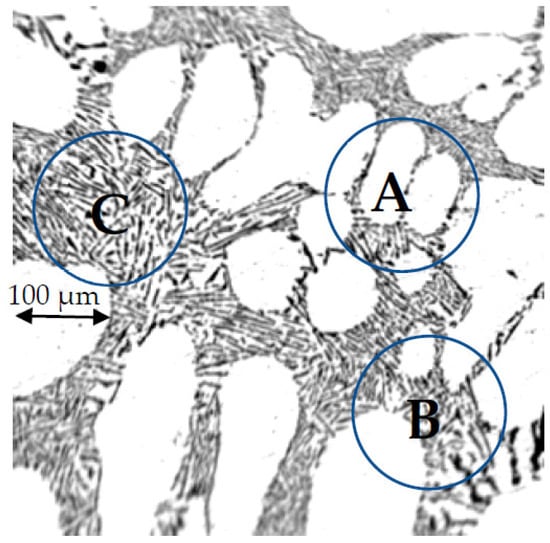
Figure 1.
The typical solidified microstructure of nonmodified Al–7wt% Si alloy at a cooling rate of 0.5 K/s.
The calculated equilibrium amount of eutectic based on the Al–Si equilibrium phase diagram was 48.5 wt%. The eutectic that forms between the secondary dendrite arms will often degenerate, i.e., the Al solid solution part of the eutectic solidifies on the primary Al solid solution and does not produce a new α nucleus, while the Si phase remains between the dendrite arms. Therefore, the amount of the measured eutectic is lower than the calculated one by about ~10% [21,22].
2.3. Microgravity Solidification Experiments
Microgravity solidification experiments were carried out on-board the International Space Station (ISS) using the solidification and quenching furnace (SQF) with or without stirring by a rotating magnetic field (RMF). The SQF furnace consisted of hot and cold zones separated by an adiabatic zone. The hot and cold zones were equipped with heaters that could be adjusted independently to achieve the required temperature gradient along the main axis of the sample. Solidification of the alloy was performed by controlled displacement of the furnace relative to the fixed sample cartridge assembly at a chosen velocity, which could be varied during the experiment.
The RMF device was integrated into the SQF furnace outside the heating element. The length of the RMF device was 170 mm, so the whole sample length could be stirred during the experiments. A moderate RMF with a frequency of f = 57 Hz and relatively small magnetic induction of B = 0.5 mT was applied. It is well known that such an RMF prevents strong macrosegregation during solidification. Details of the SQF and RMF facilities are described in [16,17,18].
The Al–7 wt % Si alloy samples (diameter: 8 mm, length 245 mm) were inserted into Al2O3 tube crucibles. The temperature distribution was measured during the whole experiment by 12 thermocouples (TC1–TC12) located at the outer surface of the crucible. The distance between the thermocouples was 20 mm.
The experimental procedure was carried out in several steps. First, the furnace with the sample was heated up step by step to the initial temperature in a temperature gradient of G = 4 K/mm to melt about 120 mm part of the sample. After that, temperatures were maintained for 14,000 s (B2F1 and B2F2 samples) or 28,000 s (B2F5 and B2F6) to homogenize the temperature and solute distribution before starting the solidification processes, which consisted of two stages. In the first stage (state I), a slow pulling rate (v1 = 0.02 mm/s) was applied to achieve columnar growth in stationary conditions. After a solidified length of z1 = 20 mm, the second solidification stage (stage II) started with different solidification conditions for the four samples. The main goal of these new solidification parameters was to promote columnar-to-equiaxed transition. For refined B2F1 and nonrefined B2F2 samples, the pulling rates were sharply increased from 0.02 to 0.2 mm/s, while the refined B2F5 and nonrefined B2F6 samples were solidified with constant furnace moving velocity (0.02 mm/s). Concomitantly, for all experiments, an additional cooling rate of the hot zone (R = 0.133 K/s) was applied to reduce the temperature gradient and thus favor CET. In the case of nonrefined samples (B2F2 and B2F6), an RMF was added to promote CET if possible.
The parameters of the four solidification experiments are given in Table 1.

Table 1.
Control parameters for the four samples solidified under microgravity; vn is the furnace pulling velocity, and zn is the furnace movement with vn in stage n.
2.4. Microstructural Characterization
The microstructural characterization methods were described in detail in a previous study [22]. The grain structure and the columnar-to-equiaxed transition (CET) were analyzed and discussed for the four experiments in [23,24,25,26]. In the present study, we focused on the effect of solidification parameters, namely the velocity of the solid/liquid front and the temperature gradient, on the relative amount of eutectic and secondary dendrite arm spacing.
The eutectic percentage was measured by a quantitative metallography method as follows. The optical microscopy images of longitudinal sections of samples were segmented into binary images using a threshold to separate the two phases; the dendrite phase and eutectic appeared in white and black, respectively. Based on these binary images, the eutectic percentage (E%) was determined using a box-averaging method as well as dendrite arm spacing (DAS) using the linear intercept method. It must be mentioned that the DAS measured by the intercept method is not equal to the true SDAS and is often slightly higher because of the method of measurement. However, the latter cannot be measured on large surfaces, whereas the DAS can be systematically measured on the whole metallography. The box size for both the E% and DAS was 0.5 mm in length and equal to the sample diameter in width.
3. Results and Discussion
3.1. Evaluation of Thermal Data
The solidification process of the samples can be characterized by the isotherm velocities (vL and vE) and the temperature gradients (GL and GE) of the solid/liquid (S/L) and eutectic (E/L) fronts as a function of time. Therefore, a detailed analysis of these parameters as a function of time was first performed to compare the planned and measured parameters.
3.1.1. Determination of Solidification Velocities as a Function of Time
As mentioned earlier, temperature vs. time (cooling curve) was measured by 12 thermocouples. During the analysis, it was assumed that the undercooling of the primary dendrite tips and the eutectic was very small. Accordingly, the solidification started at the liquidus temperature (TL) and was completed at the eutectic temperature (TE). Therefore, the velocities of the solid/liquid front (represented by the primary tips) and the eutectic front (E/L) was calculated by the moving velocity of the liquidus and eutectic isotherms.
The temperatures measured by the TC1 to TC5 thermocouples were lower than the TE eutectic temperature, so this part of the sample was not melted and remained fully solid during the whole experiment. Thus, only the cooling curves of the samples (T (t) function) recorded by the TC6 to TC12 thermocouples are displayed in Figure 2. The two dashed horizontal lines indicate the liquidus and eutectic temperatures, respectively. The dotted vertical lines show the instances where the solidification conditions were changed from stage I to stage II. On the top of the figures, the positions of the thermocouples (in millimeter) are given.
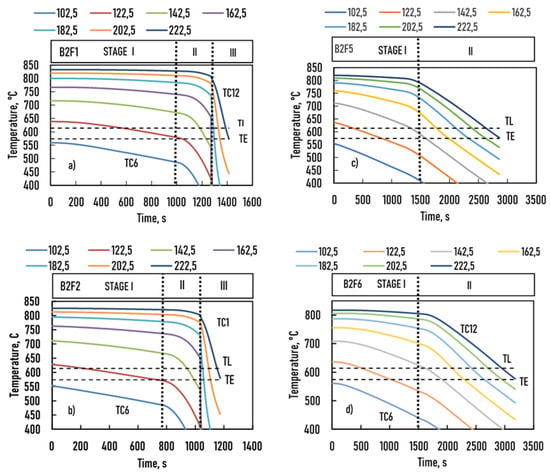
Figure 2.
Temperature recordings as a function of time for the four samples. (a) B2F1, (b) B2F2, (c) B2F5, and (d) B2F6.
From the temperature data given by the thermocouples, it was possible to construct a matrix (Table 2). In Table 2, x (TCk) is the position of the kth thermocouple (mm), i is the number of time step (in practice, one time step usually lasts Δt = 1 s), T (i,k) is the temperature (in °C) of the kth thermocouple at the ith time step, and n and m are the maximum number of time steps and thermocouples, respectively. A column corresponds to the cooling curve at one position, and a row corresponds to the temperature (T) as a function of the sample length (x) at a given time step.

Table 2.
The temperature as a function of time and the position in the sample.
The parameters of the solidification experiments were calculated as follows:
- (i)
- Using one row from the data set of Table 2, a 6–10 order polynomic function was used to fit the temperature–sample position T (xs) function at every time step with an accuracy higher than R2 > 0.999999. The maximum time steps was 1500 for B2F1 and B2F2 samples and 3000 for B2F5 and B2F6 samples. During the calculations, one time step lasted 1 s for all four experiments.
- (ii)
- From all T (xs) functions, the xL and xE sample positions were determined at T = TL and T = TE temperatures by a numerical method that generated the xL-t (position of S/L front vs. time) and xE-t (position of E/L front vs. time) data sets. Again, a 6–10 order polynomic function was used to fit these two data sets (xL (t) and xE (t) functions) with an accuracy higher than R2 > 0.999999. For B2F1 and B2F2 samples, the data sets were divided into two parts at 1500 s when the pulling velocity changed from 0.02 to 0.2 mm/s because it was impossible to calculate the xL (t) and xE (t) function with a single function with high accuracy.
- (iii)
- The velocity of the liquidus and eutectic isotherms (vL (t) and vE (t)) were numerically derived.
- (iv)
- By combining vL (t) and xL (t) as well as vE (t) and xE (t) functions, the velocity of the liquidus and eutectic isotherms as a function of the sample length xs was obtained.
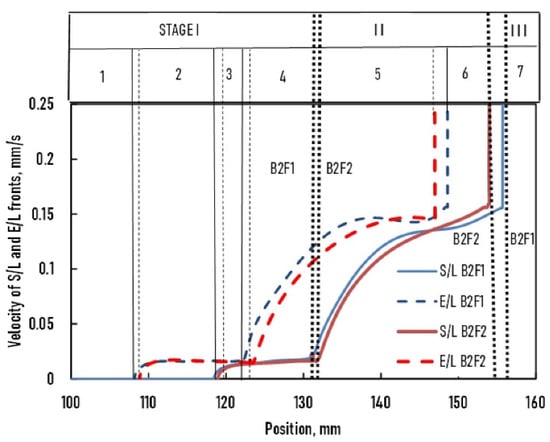
Figure 3.
Velocity of S/L and E/L fronts vs. position of B2F1 and B2F2 samples. The thin vertical solid and broken lines mark the margin of the relevant parts of the sample, while the dotted vertical lines show the instances where the solidification conditions were changed from stage I to stage II.
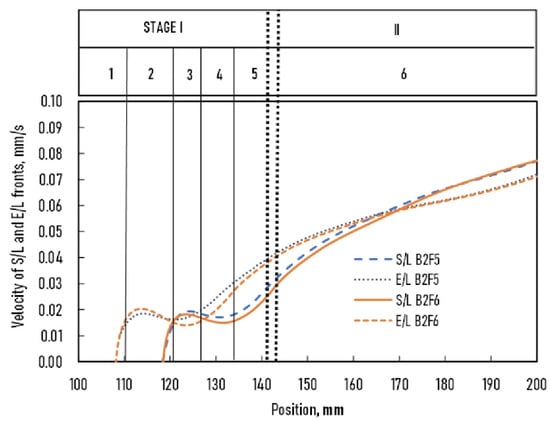
Figure 4.
Velocity of S/L and E/L fronts vs. position of B2F5 and B2F6 samples.
The curves of the S/L and E/L fronts for samples B2F1 and B2F2 were nearly the same as those for samples B2F5 and B2F6, so these two experiments were comparable.
From these curves, the history of the growth process could be followed in detail and divided into six relevant parts in which the solidification process was different.
Stage I
- Up to 108 mm: The sample was not melted.
- From 108 to 118 mm: The sample was partly melted (initial mushy zone, about 10 mm). The E/L front moved at 0.02 mm/s through the initial mushy zone, except in the first ~3 mm, when the velocity increased from 0 to 0.02 mm/s.
- From 118 to 124 mm: The velocity of the E/L front decreased from 0.02 to 0.015 mm/s, while the S/L front velocity increased from 0 to 0.02 mm/s.
- From 124 to 132 mm: The S/L front velocity decreased from 0.02 to 0.015 mm/s, while the E/L front velocity increased from 0.015 to 0.03 mm/s.
- From 132 to 141 mm: The S/L front velocity increased from 0.015 to 0.03 mm/s, while the E/L front velocity increased from 0.03 to 0.04 mm/s.
Stage II
- 6
- From 141 mm: Both front velocities increased to 0.06 mm/s (~170 mm), at which point the velocity of both fronts was identical. After this, the velocity of the S/L front was higher than that of the E/L front.
3.1.2. Determination of the Temperature Gradients as A Function of Time
In the second step, the T (xs) functions were used to numerically derive the temperature gradients at the TL and TE temperatures as a function of time (GL (t) and GE (t) functions). Then, the GL (t) and xL (t) as well as the GE (t) and xE (t) were combined to calculate the functions of GL (xs) and GE (xs) functions.
For the B2F1 and B2F2 samples (Figure 5), the GL (xs) and GE (xs) functions evolved in parallel and increased from the bottom to the top of the samples. The temperature gradient at the E/L front was higher than at the S/L front throughout solidification. However, a difference was observed in both samples. At the S/L front, the temperature gradient of the B2F1 sample was higher than that of the B2F2 sample by about ~0.5 K/mm. In contrast, the temperature gradient at the E/L front was comparable in both samples in parts 4 and 5, where the velocities of the S/L and E/L fronts were the same.
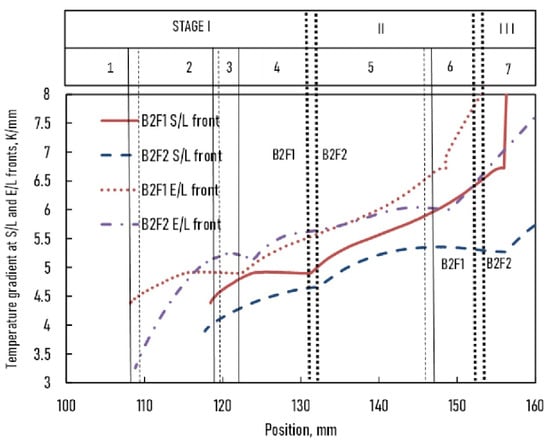
Figure 5.
The temperature gradient vs. position of B2F1 and B2F2 samples.
For B2F5 and B2F6 samples (Figure 6), the GL (xs) and GE (xs) functions evolved in parallel and decreased from the bottom to the top of the samples. The temperature gradient was slightly higher in the B2F6 sample than in the B2F5 sample in stage I. When the magnetic induction was switched on, the difference was reversed, most likely because of the melt flow that developed. The difference between the GL (xs) and GE (xs) in stage I was small but increased to about 0.5 K/mm in stage II.
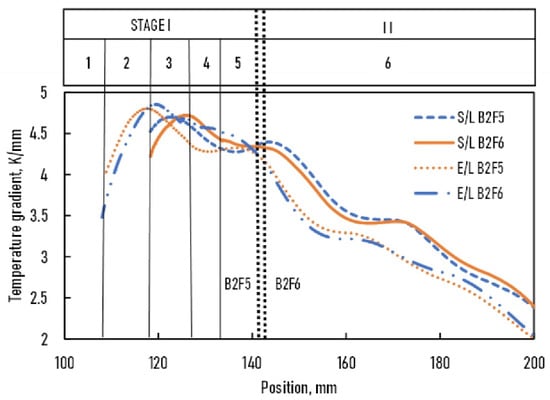
Figure 6.
The temperature gradient vs. position of B2F5 and B2F6 samples.
3.2. Analysis of the Microstructure
The primary dendrites and the grain structure of the samples were analyzed in detail in [23,24,25,26]. In this work, the amount of eutectic and secondary arm spacing were analyzed as a function of the processing parameters of the experiments.
3.2.1. Relative Amount of Eutectic
Figure 7 shows the measured volume % of eutectic as a function of position in the four samples. As mentioned previously, the theoretical equilibrium amount (E%) of the Al–Si eutectic was 48.5 wt%. Knowing that the densities of Al (2700 kg/m3) and Si (2329 kg/m3) are close to each other, the volume percentage of eutectic was calculated (about 51.8 vol%) and is represented as a plain line in Figure 7. The measured values of the volume eutectic percentage along the four samples changed continuously in each sample from ~65 to ~40 vol% from the bottom to the top. The reasons for the higher initial value of the E% compared to the equilibrium value could be ascribed to the following three mechanisms:
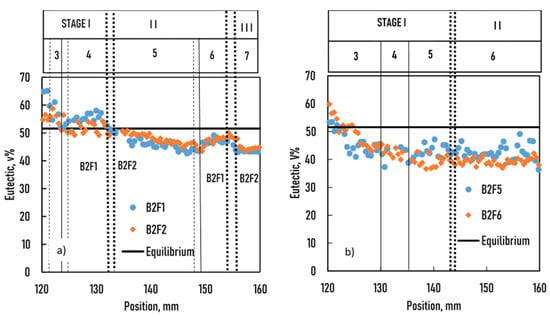
Figure 7.
The measured amount of eutectic vs. position in the sample (a): samples B2F1 and BF2, (b): samples B2F5 and B2F6.
- (i)
- Scattering due to the measuring method and/or the nonuniform microstructure. This scattering was constant for all positions of the sample and was estimated to be within ±3 vol%.
- (ii)
- Microsegregation as calculated by the Scheil equation [27]. It was found that the maximum nonequilibrium eutectic would be 2 vol%, which is much lower than the measured discrepancy. Moreover, the maximum difference would be the same at all positions in the sample.
- (iii)
- Higher Si concentration than the nominal one (7 wt%). This could be due to the diffusion of Si from the initial mushy zone to the melted part of the sample during temperature stabilization before the solidification experiments. This mechanism is known as thermal gradient zone melting (TGZM) [12]. The region of the samples that was solidified later was held at a higher temperature than the TE for 28,000 s (B2F1 and B2F2 samples) and 14,000 s (B2F5 and B2F6 samples).
The continuously changing E% cannot be explained by the first two mechanisms, so the third one seems to be the most likely explanation.
The lower measured volume eutectic amount E% (~44 vol% for B2F1 and B2F2 samples and ~40 vol% for B2F5 and B2F6 samples) compared to the equilibrium value (51.8 vol%) at the top of the sample could be explained by the formation of degenerate eutectic between the secondary dendrite arms (“A” in Figure 1). As mentioned earlier, about 10% of the eutectic degenerates [21,22]. Assuming that the concentration did not change at the top of the sample by either convection due to the absence of gravity or by diffusion because the diffusion distance was too long, a correction factor, KC, was calculated to obtain 51.8 vol% at the top of the samples (KC = 51.6/44 = 1.17 for B2F1 and B2F2 samples, and KC = 51.8/42 = 1.23 for B2F5 and B2F6 samples). Additionally, assuming that the rate of the degenerated eutectic was the same in the whole sample, the eutectic amount, E%, was recalculated with these correction factors. As the parameters (v and G) of all samples were very similar, these experiments could then be compared. The Si weight concentration was calculated as follows:
and
where ρeut and ρα are 2650 and 2700 kg/m3, respectively, and CE and Cα,max are 12.6 and 1.65 wt%, respectively.
The average concentration as a function of the position of the sample is given in Figure 8 by blue circles.
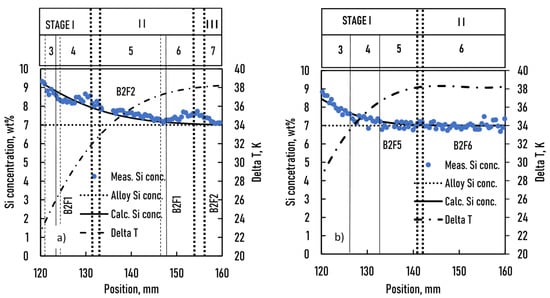
Figure 8.
Calculated Si concentration from the corrected measured amount of eutectic, the calculated concentration by diffusion, and the calculated temperature range of solidification (TL–TE) vs. position in the samples.position in the samples (a): samples B2F1 and BF2, (b): samples B2F5 and B2F6.
3.2.2. Calculation of the Concentration Distribution by a Cellular Automata (CA) Method
As mentioned earlier, the developed concentration distribution can only be explained by the diffusion of Si from the initial mushy zone to the melted part of the sample by TGZM [12]. The initial mushy zone is not a fully melted part of the sample. After resolidification of this part of the sample, its microstructure coarsened. The Si concentration of the liquid phase was CE = 12.6 wt% (concentration of the eutectic) at the bottom of the mushy zone and C0 = 7 wt% (concentration of the alloy) at the top. The temperature difference between the TL and TE was ΔT = 614−574 = 40 K, so the length of the mushy zone was xmush = ΔT/G = 10 mm.
The liquid fraction changed along the mushy zone (0 at the eutectic temperature (TE) and 1 at the liquidus temperature (TL)). The average liquid fraction was 0.32. As the diffusion occurred only in the liquid phase in the mushy zone, the Aef effective cross section was proportional to the average fraction of the liquid phase, i.e., Aeff = 0.32A. In the melted part of the sample, the fraction of the liquid phase was infinite. Therefore, Aeff = A, where A is the cross section of the sample perpendicular to the sample axis.
The concentration distribution in the melted part was calculated by the explicit finite difference method (EFDM), assuming steady-state diffusion across the mushy zone.
The sample was divided into 25 cells. The length of one cell (Δx) was 3 mm, and the time step (Δt) was 75 s. The diffusion of Si from the mushy zone to the first cell and from the first cell to the second cell at the hth time step was as follows:
The concentration of the first cell was as follows:
The ith cell at the hth time step was as follows:
where = 6.45 · 10−3 mm2/s [28], = 3 mm, and = 75 s.
The calculation time was 28,000 s for the B2F1 and B2F2 samples and 14,000 s for the B2F5 and B2F6 samples. The stabilization period applied during the microgravity experiments. The results of the calculations are depicted in Figure 8. The concentration distribution can also change during solidification. It is similar to what happens in the initial mushy zone; Si diffuses to the liquid phase at the level of the S/L front from the moving mushy zone. As a result, the liquid phase concentration at the level of the S/L front increases, while the average concentration of the solidified part decreases behind the front. Because the front velocity was slower in stage I than in stage II in B2F1 and B2F2 samples and constant during the whole experiment in both B2F5 and B2F6 samples, diffusion could be significant during all experiments. This phenomenon is well known as gradient undercooling (ΔTG = DL∗G/v) [12]. In the case of B2F5 and B2F6 samples, the initial concentration slightly decreased in stage I, and because the overall concentration of the sample was constant (7 wt%), it increased in stage II. In the case of B2F1 and B2F2, in part 3 and at the beginning of part 4, the concentration decreased slightly, similar to the case of B2F5 and B2F6 samples. In part 4, the S/L front moved with 0.02 mm/s, but the E/L front moved with a continuously increasing velocity, hindering the diffusion of Si from the mushy zone to the liquid phase. The Si that remained in it increased the average Si concentration of this part. A similar phenomenon was visible in part 6.
3.2.3. Comparison of the Measured and Calculated Secondary Dendrite Arm Spacing (SDAS)
The SDAS is an important parameter of the solidified microstructure because the cast workpiece mechanical properties significantly depend on it. The SDAS depends on the temperature range (ΔT) and the parameters (front velocity and temperature gradient) of solidification [1,2,3,4,5,6,7,8]:
where is the cooling rate, is the local solidification time at xs, and is a constant for an alloy.
In the case of steady-state solidification, ΔT, G, and v are constant in the whole sample, so the microstructure spacing can be characterized with a single SDAS.
The temperature range of solidification depends on the actual concentration of the sample. If there is no macrosegregation, ΔT is constant all along the sample. In our experiments, the Si concentration continuously varied in the four samples, so the ΔT also concomitantly varied. Using the calculated concentrations based on diffusion, the ΔT can be calculated as a function of the position in the sample by the following relation:
As shown earlier, v and G changed along with the sample, and they were different at the S/L and E/L fronts at a given xs (Figure 6 and Figure 7). Two different local solidification times at a given xs were obtained when GS/L (xs) × vS/L (xs) or GE/L (xs) × vE/L (xs) calculations were used. Consequently, we used the average values of vav (xs) and Gav (xs) (Figure 9 and Figure 10):
and
where ) and are the velocities and the temperature gradients at S/L and E/L fronts, respectively.
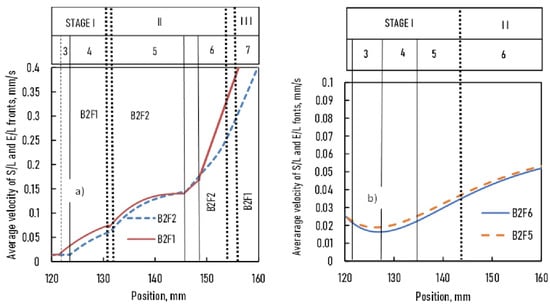
Figure 9.
Average velocity of S/L and E/L fronts vs. position in the sample (a): samples B2F1 and BF2, (b): samples B2F5 and B2F6.
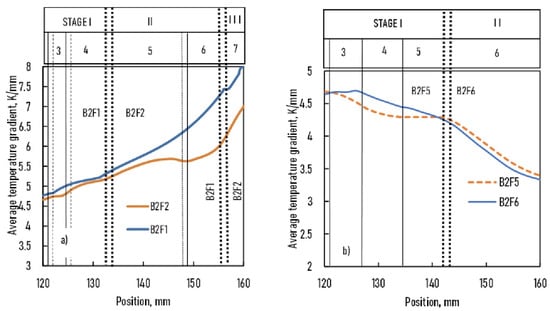
Figure 10.
Average temperature gradient of S/L and E/L fronts vs. position in the sample (a): samples B2F1 and BF2, (b): samples B2F5 and B2F6.
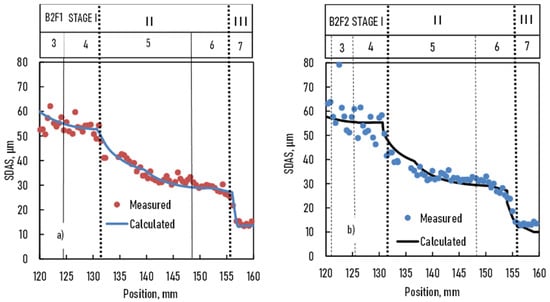
Figure 11.
Secondary dendrite arm spacing of B2F1 and B2F2 samples vs. position in the sample (a): samples B2F1 and BF2, (b): samples B2F5 and B2F6.
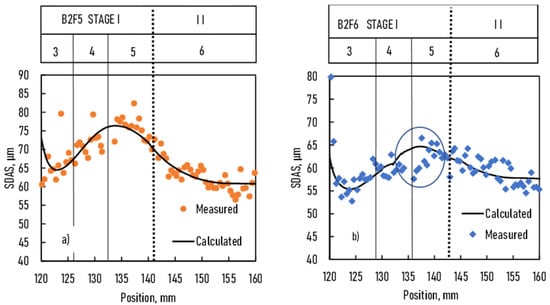
Figure 12.
Secondary dendrite arm spacing of B2F5 and B2F6 samples vs. position in the sample (a): samples B2F1 and BF2, (b): samples B2F5 and B2F6.
For B2F1 and B2F2 samples, the solidification parameters and the initial concentration distribution before solidification were practically the same. Consequently, the measured DAS was very similar for both samples, and the ratio of the average DAS of the two samples was 1.05. The agreement between the measured DAS and the calculated SDAS was good despite the fact that DAS generally overestimates the SDAS as discussed above. The used correction factor K was 7.5. The scattering of the measured DAS when the cooling rate was slow (parts 3 and 4) was wide and higher than in parts 5, 6, and 7, where the cooling rate increased. For the B2F2 sample, stirring by magnetic induction in stage II did not affect the SDAS.
For B2F5 and B2F6 samples, the solidification parameters and the concentration distribution before solidification were practically the same, similar to the case of B2F1 and B2F2. The measured DAS was similar but not identical for both samples. In the calculations, the correction factor K was 10 and 9 for B2F5 and B2F6 samples, respectively. The agreement between the measured and calculated SDAS was not so good compared to the case of B2F1 and B2F2 samples. The scattering of the measured DAS was higher than in B2F1 and B2F2 because the microstructure was coarser (like the microstructure of parts 3 and 4 of B2F1 and B2F2 samples). When magnetic induction was switched on in B2F6, the S/L and the E/L fronts were at 132 and 142 mm, respectively. The decrease in DAS between parts 4 and 5 (marked by a circle in the figure) would have resulted from the melt flow induced by magnetic induction. Because of the very low front velocities, the time was long enough to develop the magnetic stirring effect. In the B2F2 sample, the front velocities were higher, so a similar effect was not seen.
The different K values can be explained by the measurement method of DAS. The DAS measured by the intercept method overestimates the actual SDAS. Measurement of the SDAS along a parallel line with the primary dendrite arms and perpendicular to the secondary dendrite arms gave a K value of 4.5 [22].
The B2F1 and B2F5 samples contained grain refiners, but they did not affect the SDAS.
4. Summary
Four different solidification experiments were performed on-board the ISS in the SQF with or without stirring by rotating magnetic field (RMF). Unlike the B2F1 and B2F5 samples, the B2F2 and B2F6 samples that solidified with RMF stirring did not contain grain refiners. The B2F1 and B2F2 samples were solidified by changing the furnace moving velocity (0.02 to 0.20 mm/s), while the B2F5 and B2F6 samples were solidified with constant furnace moving velocity (0.02 mm/s). We then analyzed the amount of eutectic percentage and the secondary arm spacing as a function of the parameters of the experiments.
The detailed solidification parameters (velocity and temperature gradient at the S/L and E/L fronts) were calculated by a new method:
- (i)
- The velocity (v) of the S/L and E/L fronts and the temperature gradient (G) of all four samples at a given position were determined. Based on that, the B2F1and B2F2 samples could be divided into seven different solidification phases, and the B2F5 and B2F6 samples could be divided into six. The local solidification time changed continuously, and the steady-state solidification conditions were never reached.
- (ii)
- As the parameters (v and G) of the B2F1 and B2F2 and B2F5 and B2F6 samples were comparable, these experiments could be used as benchmarks for comparison.
The amount of eutectic decreased from the bottom to the top of the sample due to diffusion of Si from the initial mushy zone (partially melted part of the sample) to the melted part of the sample before solidification began because the samples were held at a higher temperature than the TE for 28,000 s (B2F1 and B2F2 samples) and 14,000 s (B2F5 and B2F6 samples).
- (i)
- The measured eutectic percentage was lower than the expected theoretical equilibrium value because about 10–15% degenerated. From the corrected volume% of eutectic, first the weight% of eutectic and then the Si concentration were calculated. Based on that, the actual concentration-dependent liquidus temperature (TL) was determined as a function of the position.
- (ii)
- The initial concentration as a function of the position was calculated by explicit finite difference method assuming that the diffusion rate of Si across the initial mushy zone was constant. The measured and calculated concentrations showed good agreement, except where the velocity of the E/L front was higher than that of the S/L front (parts 4 and 6). This discrepancy can explain why there was not enough time for diffusion of Si from the mushy zone to the liquid phase. The Si that remained in it increased the average Si concentration of this part.
The secondary dendrite arm spacing (SDAS) changed in all four samples during solidification. In the case of B2F1 and B2F2 samples, the average velocity of the fronts and the average temperature gradient increased and the SDAS decreased from the bottom to the top of the sample. In the case of B2F5 and B2F6 samples, the average velocity of the fronts and the average temperature gradient decreased in part 3. Then, the average velocity of the fronts increased, while the average temperature gradient decreased, producing a complicated SDAS as a function of the position.
- (i)
- Taking into consideration the decrease in the liquidus temperature calculated from the initial concentration distribution, the SDAS was calculated with a well-known equation as a function of the position using the average velocity (vav) and temperature gradient (Gav) [29,30]:K varies from 7.5 and 10. The different K values can be explained by the measurement method of DAS. The DAS measured by the intercept method overestimates the actual SDAS. Measurement of the SDAS along a parallel line with the primary dendrite arms and perpendicular to the secondary dendrite arms gave a K value of 4.5. The fact that n = 1/3 means that the coarsening of the secondary dendrite arms was purely diffusive.
- (ii)
- The calculated SDAS (using the K and n mentioned above) and the measured DAS showed perfect accordance when the scattering of the measurement was small, especially for finer microstructure, such as in the B2F1 and B2F2 samples.
- (iii)
- The B2F1 and B2F5 samples contained grain refiners, but they did not affect the SDAS.
- (iv)
- Magnetic stirring had a small effect (the SDAS decreased slightly) in the case of sample B2F6 because the front velocities were very low, meaning the time was long enough for developing the effect of magnetic stirring. In the B2F2 sample, the front velocities were higher, so a similar effect was not seen.
5. Conclusions
Four different solidification experiments were performed on-board the ISS in the SQF with or without stirring by rotating magnetic field (RMF). The effect of the temperature gradient, solid/liquid front velocity, macrosegregation, and RMF on the amount of Al–Si eutectic and secondary dendrite arm spacing was investigated.
- (1)
- It was shown that steady-state solidification conditions were never reached. At a given sample position, the velocity of the solid/liquid (S/L) and eutectic/liquid (E/L) fronts and the temperature gradient at the two fronts were different. The solidification process could be characterized by the average front velocity and average temperature gradient.
- (2)
- Because of the long time taken for temperature homogenization before the solidification phase started, TGZM took place, and diffusion of Si from the initial mushy zone to the melted part of the sample caused macrosegregation. This change in concentration altered the liquidus temperature and then the temperature interval of solidification.
- (3)
- Considering these two facts, the calculated and measured SDAS and the amount of eutectic were in good accordance.
Author Contributions
Conceptualization, A.R. (András Roósz); funding acquisition, A.R. (András Roósz) and G.Z.; investigation, A.R. (András Roósz), Y.L., N.M.-N., G.Z. and Z.V.; methodology, A.R. (András Roósz); project administration, A.R. (András Roósz) and G.Z.; software, A.R. (Arnold Rónaföldi); supervision, A.R. (András Roósz), G.Z. and H.N.-T.; validation, A.R. (András Roósz), A.R. (Arnold Rónaföldi), Y.L., N.M.-N., G.Z., H.N.-T., M.S. and Z.V.; writing—original draft, Z.V.; writing—review and editing, A.R. (András Roósz), N.M.-N., H.N.-T. and Z.V. All authors have read and agreed to the published version of the manuscript.
Funding
This research was funded by the European Space Agency under the CETSOL (columnar-to-equiaxed solidification processes) ESA MAP (AO-99-117) and the CETSOL/HUNGARY ESA PRODEX (No 4000131880/NL/SH) projects, the FWF-NKFIN (130946 ANN) joint project, the French National Space Agency (CNES), and the German BMWi/DLR under FKZ 50WM1743 and FKZ 50WM2043.
Institutional Review Board Statement
Not applicable.
Informed Consent Statement
Not applicable.
Data Availability Statement
Data may be requested from the corresponding authors.
Conflicts of Interest
The authors declare no conflict of interest.
References
- Whisler, N.; Kattamis, T. Dendritic coarsening during solidification. J. Cryst. Growth 1972, 15, 20–24. [Google Scholar] [CrossRef]
- Young, K.P.; Kirkwood, D.H. The dendrite arm spacings of aluminum-copper alloys solidified under steady-state conditions. Metall. Trans. A 1975, 6, 197–205. [Google Scholar]
- Flemings, M.C. Coarsening in Solidification Processing. Mater. Trans. 2005, 46, 895–900. [Google Scholar] [CrossRef]
- Kurz, W.; Fisher, D.J. Fundamentals of Solidification, 4th ed.; Trans Tech Publications Ltd.: Zurich, Switzerland, 1998. [Google Scholar]
- Kurz, W.; Fisher, D. Dendrite growth at the limit of stability: Tip radius and spacing. Acta Met. 1981, 29, 11–20. [Google Scholar] [CrossRef]
- Furer, U.; Wunderlin, R. Metal Solidification; DGM Fachber: Stuttgart, Germany, 1977; Volume 144. [Google Scholar]
- Kirkwood, D. A simple model for dendrite arm coarsening during solidification. Mater. Sci. Eng. 1985, 73, L1–L4. [Google Scholar] [CrossRef]
- Roósz, A. The Effect of Temperature Gradient and Primary Arm Tip Velocity on Secondary Dendrite Arm Spacing at Steady-state Conditions Solidification. Cast Met. 1988, 1, 223–226. [Google Scholar] [CrossRef]
- Steinbach, S.; Ratke, L. The Influence of Fluid Flow on the Microstructure of Directionally Solidified AlSi-Base Alloys. Met. Trans. A 2007, 38, 1388–1394. [Google Scholar]
- Ratke, L.; Voorhees, P.W. Coarsening Basics and Growth Laws. In Growth and Coarsening; Springer: Berlin/Heidelberg, Germany, 2002; pp. 117–126. [Google Scholar]
- Orth, A.; Ratke, L. Influence of TMF-induced fluid flow on the microstructure of Al-Si7-Mn1 wt.% alloy. IOP Conf. Ser. Mater. Sci. Eng. 2012, 27, 012044. [Google Scholar] [CrossRef]
- Thi, H.N.; Reinhart, G.; Buffet, A.; Schenk, T.; Mangelinck-Noël, N.; Jung, H.; Bergeon, N.; Billia, B.; Härtwig, J.; Baruchel, J. In situ and real-time analysis of TGZM phenomena by synchrotron X-ray radiography. J. Cryst. Growth 2008, 310, 2906–2914. [Google Scholar] [CrossRef]
- Akamatsu, S.; Nguyen-Thi, H. In situ observation of solidification patterns in diffusive conditions. Acta Mater. 2016, 108, 325–346. [Google Scholar] [CrossRef]
- Ngomesse, F.; Reinhart, G.; Soltani, H.; Zimmermann, G.; Browne, D.; Sillekens, W.; Nguyen-Thi, H. In situ investigation of the Columnar-to-Equiaxed Transition during directional solidification of Al–20 wt.% Cu alloys on Earth and in microgravity. Acta Mater. 2021, 221, 117401. [Google Scholar] [CrossRef]
- Murphy, A.; Mathiesen, R.; Houltz, Y.; Li, J.; Lockowandt, C.; Henriksson, K.; Zimmermann, G.; Melville, N.; Browne, D. XRMON-SOL: Isothermal equiaxed solidification of a grain refined Al–20wt%Cu alloy. J. Cryst. Growth 2016, 440, 38–46. [Google Scholar] [CrossRef]
- Soltani, H.; Ngomesse, F.; Reinhart, G.; Benoudia, M.C.; Zahzouh, M.; Nguyen-Thi, H. Impact of gravity on directional solidification of refined Al-20wt.%Cu alloy investigated by in situ X-radiography. J. Alloy. Compd. 2020, 862, 158028. [Google Scholar] [CrossRef]
- Liu, D.; Mangelinck-Noël, N.; Gandin, C.-A.; Zimmermann, G.; Sturz, L.; Nguyen-Thi, H.; Billia, B. Simulation of directional solidification of refined Al–7 wt.%Si alloys—Comparison with benchmark microgravity experiments. Acta Mater. 2015, 93, 24–37. [Google Scholar] [CrossRef]
- Li, Y.; Mangelinck-Noël, N.; Zimmermann, G.; Sturz, L.; Nguyen-Thi, H. Comparative study of directional solidification of Al-7 wt% Si alloys in Space and on Earth: Effects of gravity on dendrite growth and Columnar-to-equiaxed transition. J. Cryst. Growth 2019, 513, 20–29. [Google Scholar] [CrossRef]
- Zimmermann, G.; Sturz, L.; Nguyen-Thi, H.; Mangelinck-Noel, N.; Li, Y.Z.; Gandin, C.-A.; Fleurisson, R.; Guillemot, G.; McFadden, S.; Mooney, R.P.; et al. Columnar and Equiaxed Solidification of Al-7 wt.% Si Alloys in Reduced Gravity in the Framework of the CETSOL Project. JOM 2017, 69, 1269–1279. [Google Scholar] [CrossRef][Green Version]
- Murray, J.L.; McAlister, A.J. The Al-Si (aluminum-silicon) system. Bull. Alloy. Phase Diagr. 1984, 5, 74. [Google Scholar]
- Kasperovich, G.; Volkmann, T.; Ratke, L.; Herlach, D. Microsegregation during Solidification of an Al-Cu Binary Alloy at Largely Different Cooling Rates (0.01 to 20,000 K/s): Modeling and Experimental Study. Met. Mater. Trans. A 2008, 39, 1183–1191. [Google Scholar] [CrossRef]
- Veres, Z.; Roósz, A.; Rónaföldi, A.; Sycheva, A.; Svéda, M. The effect of melt flow induced by RMF on the meso- and micro-structure of unidirectionally solidified Al—7wt% Si alloy. J. Mater. Sci. Technol. 2022, 103, 197–208. [Google Scholar]
- Li, Y.; Mangelinck-Noël, N.; Zimmermann, G.; Sturz, L.; Nguyen-Thi, H. Effect of solidification conditions and surface pores on the microstructure and columnar-to-equiaxed transition in solidification under microgravity. J. Alloy. Compd. 2018, 749, 344–354. [Google Scholar] [CrossRef]
- Li, Y.; Mangelinck-Noël, N.; Zimmermann, G.; Sturz, L.; Nguyen-Thi, H. Modification of the microstructure by rotating magnetic field during the solidification of Al-7 wt.% Si alloy under microgravity. J. Alloy. Compd. 2020, 836, 155458. [Google Scholar] [CrossRef]
- Liu, D.; Mangelinck-Noël, N.; Gandin, C.-A.; Zimmermann, G.; Sturz, L.; Thi, H.N.; Billia, B. Structures in directionally solidified Al–7wt.% Si alloys: Benchmark experiments under microgravity. Acta Mater. 2014, 64, 253–265. [Google Scholar] [CrossRef]
- Li, Y.Z.; Mangelinck-Noël, N.; Nguyen-Thi, H.; Zimmermann, G.; Sturz, L.; Cool, T.; Gulsoy, E.B.; Voorhees, P.W. Critical pa-rameters concerning the columnar-to-equiaxed transition in solidification processing. In Proceedings of the 6th Decennial International Conference on Solidification Processing, Old Windsor, UK, 25–27 July 2017; pp. 317–321. [Google Scholar]
- Scheil, E. Bemerkungen zur Schichtkristallbildung. Int. J. Mater. Res. 1942, 34, 70–72. [Google Scholar] [CrossRef]
- Zhang, H.; Wu, M.; Zheng, Y.; Ludwig, A.; Kharicha, A. Numerical study of the role of mush permeability in the solidifying mushy zone under forced convection. Mater. Today Commun. 2019, 22, 100842. [Google Scholar] [CrossRef]
- Ronté, V.; Roólsz, A. The effect of cooling rate and composition on the secondary dendrite arm spacing during solidification. Part I: Al-Cu-Si alloys. Int. J. Cast Met. Res. 2001, 13, 337–342. [Google Scholar] [CrossRef]
- Rontó, V.; Roósz, A. The effect of the cooling rate or the local solidification time and composition on the secondary dendrite arm spacing during solidification PART II: Al–Mg–Si alloys. Int. J. Cast Met. Res. 2001, 14, 131–135. [Google Scholar] [CrossRef]
Publisher’s Note: MDPI stays neutral with regard to jurisdictional claims in published maps and institutional affiliations. |
© 2022 by the authors. Licensee MDPI, Basel, Switzerland. This article is an open access article distributed under the terms and conditions of the Creative Commons Attribution (CC BY) license (https://creativecommons.org/licenses/by/4.0/).