Article

Optical Temperature Sensor Capabilities of the Green Upconverted Luminescence of Er3+ in La3NbO7 Ceramic Powders

by
Miguel A. Hernández-Rodríguez
1,
Alvaro Egaña
2,
Ulises R. Rodríguez-Mendoza
3,
Victor Lavín
3 and
Juan E. Muñoz-Santiuste
2,*
1
Phantom-G, CICECO—Aveiro Institute of Materials, Department of Physics, Universidade de Aveiro, 3810-193 Aveiro, Portugal
2
Departamento de Física, MALTA Consolider Team, Escuela Politécnica Superior, Universidad Carlos III de Madrid, Avenida de la Universidad 30, E-28911 Leganés, Madrid, Spain
3
Departamento de Física, MALTA Consolider Team, IMN and IUdEA, Universidad de La Laguna, Apdo. 456, E-38200 San Cristóbal de La Laguna, Santa Cruz de Tenerife, Spain
*
Author to whom correspondence should be addressed.
Crystals 2022, 12(4), 455; https://doi.org/10.3390/cryst12040455
Submission received: 28 February 2022 / Revised: 15 March 2022 / Accepted: 22 March 2022 / Published: 24 March 2022
(This article belongs to the Section Polycrystalline Ceramics)

Abstract

:
We present a study of the Er3+ upconverted luminescence in erbium doped Lanthanum Niobium Oxide, La3NbO7, ceramic powder, prepared by solid state reaction. This study focuses on the analysis of the feasibility of this system as a temperature sensor. Efficient UC luminescence was observed under the 975 nm excitation showing intense green, red and NIR (850 nm) emission bands. The NIR luminescence centred at about 850 nm and lying on the first biological window is mainly insensitive to the temperature. In contrast, the upconverted green bands, associated with the (2H11/2,4S3/2) →4I15/2 transitions, showed a high sensibility to temperature. Their temperature dependence was studied from RT up to 525 K, paying special attention to the physiological range of temperature (303–318 K). The high thermal sensitivities obtained, in comparison with other Er3+ and Er3+-Yb3+ based optical temperature sensors in such ranges, suggest the potential application of this phosphor in thermal sensing, suitable for both biological systems and other industrial applications requiring higher temperatures.

1. Introduction

Measuring temperature accurately and reliably is very important in several application areas, ranging from health care to industrial applications [1,2,3,4,5]. The working mechanism of optical temperature sensors is based on the temperature dependence of the material’s optical properties, which allows for the monitoring of temperature in certain locations such as in electrical power stations, refineries, and coal mines. These sensors can also be useful in building fire detection [6,7]. In addition to precision and reliability, other characteristics such as high sensitivity and resolution and fast response are also required when using these materials as temperature sensors [2]. Changes in optical properties and their dependence on temperature have been studied in different ways: the spectral position of emission and absorption lines, their intensity, bandwidths and decay time and even polarization [2]. Since the discussions in the 1970s of the possible application of the fluorescence intensity ratio (FIR) technique for temperature sensing[8], this technique is among the most widely used due to its excellent advantages in terms of sensitivity and stability [9]. The classical use of this technique requires the presence of thermally coupled levels (TCL), two nearby energy levels which are assumed to be in a state of thermal quasi-equilibrium [10], in which luminescence intensities are measured. The energy distance between these TCLs must be small enough to allow a redistribution of the population of thermal origin between the lower and higher energy levels, which is the origin of the FIR technique. However, at the same time there has to be a separation between levels large enough to solve the emission lines originating in each one of them. A typical value between 200 and 2000 cm−1 [11] is usually accepted as the energy gap between levels that allows the application of the FIR technique. Most of the trivalent lanthanide ions (Pr3+, Nd3+, Eu3+, Ho3+, Er3+, Tm3+) fulfil the above requirement and their introduction in small amounts into host materials of different types allows for the use of these materials as potential optical thermometers [12,13,14,15,16]. The narrow absorption and emission bands and the relatively long luminescence lifetimes commonly observed in trivalent lanthanide ions are the principal advantages of these materials compared to other organic materials and quantum dots. Furthermore, the specific properties of the various host materials make it possible to configure rare-earth doped systems providing a wide variety of additional advantages. For instance, we highlight the high resistance to blinking or photobleaching of some materials, allowing wide applications in forensic sciences, biomedicine (bioimaging, photo-dynamic therapy or laser heating), optical temperature and/or pressure sensors [15,16,17,18,19,20].
Oxides with general formula La3BO7 (B = Os, Re, Nb, Ta and other transition metals) manifest some interesting catalytic, dielectric and magnetic properties [21,22,23]. Due to their comparatively high melting points, fine particle size, chemical stability and proton conductivity at high temperatures, La3TaO7 and La3NbO7 are proposed as materials for thermal barrier coatings [24] or as electrolytes [25,26] in some high temperature electrolysers. The weberite like structure of La3NbO7 compounds is an anion-deficient fluorite-related superstructure with Cmcm space group [27]. The structure is usually described as formed by slabs of c-axis oriented chains of tilted NbO6 octahedra, sharing corners with parallel rows of lanthanum dodecahedra (one third of La ions in 8-fold oxygen coordination) edge-sharing parallel to (100). The remaining La ions, having 7-fold oxygen coordination, lie in between these layers. La ions can be substituted by other rare earth (RE) ions of similar radius.
In a previous work [28], we report the optical properties of the Er3+-doped La3NbO7 ceramic compound, checking the properties of this system from a structural point of view; we consider the viability of incorporating luminescent ions in this matrix and the effect of the impurities on the structure, etc., through the erbium luminescence. In this work, we explore the capabilities of the upconverted green emission of phosphors La3-NbO7:Er3+ as an optical temperature sensor working in the VIS range, under NIR excitation for two different temperature ranges: those with applications in biological processes (303–318 K) and biomedicine and in other higher temperature ranges (up to 525 K) relevant for industrial applications.

2. Materials and Methods

Following the synthesis route described in Reference [29], we prepared powder samples with nominal composition La3−xErxNbO7 (x = 0.01, 0.05 and 0.1) by the solid state reaction method. Stochiometric amounts of La2O3 (99.99%), Er2O3 (99.9%) and Nb2O5 (99.9%) Sigma-Aldrich (Darmstadt, Germany) powders were used as precursor. Rietveld’s analysis was carried out for X-ray diffraction patterns obtained from the samples confirmed by the orthorhombic Cmcm space group where the erbium ions were randomly allocated in the lanthanum sites 4c and 8g, surrounded by 8 and 7 oxygens, respectively. The X-ray diffraction patterns of a series of sintered samples with increasing amounts of Er2O3 powders previously reported in [28] prove the formation of the La3−xErxNbO7 phase (x = 0.01, 0.05, 0.1), with the largest peaks indexed with the type structure weberite based on the Cmcm space group. However, (see Supplementary Materials), some additional peaks appear in the XRD patterns and the foreign reflections correspond to a small amount of LaNbO4 secondary phase. The relative percentage of this secondary phase increases with the amount of erbium in the samples. This fact appears to be inherent to the fabrication route in which the presence of Er3+ disturbs the necessary secondary La2O3 + LaNbO4 → La3NbO7 reaction and eventually becomes responsible for the segregated phases [28,29]. Samples of the nominal formula La3−xErxNbO7 (x = 0.1), having 9.6% of LaNbO4 secondary phase, were used in this work in an effort to maximize the emission intensity. Although present in our samples, the mentioned minority phases do not play a relevant role in our study. Additional details of sample preparation and structural analysis were described in Reference [28], together with the room temperature study of the luminescence of the Er3+ ion in this host matrix.
Up-conversion luminescence experiments presented in this work were performed in the temperature range from RT to 525 K in a tube-shaped electric furnace with the sample placed in its centre. The heating rate was 1 K/min to maintain thermal stability in the sample. The furnace temperature was monitored with a K-type thermocouple positioned close to the sample and connected to a voltmeter Fluke Calibrator 714 (Fluke Calibration, Everett, WA, USA). Erbium up-converted luminescence was excited using a tunable Ti-sapphire cw laser Spectra Physics 3900S (Fluke Calibration, Everett, WA, USA) pumped by a 532 nm diode laser (Spectra Physics Millennia Prime Laser 15SJSPG). The excitation wavelength was selected to be 975 nm. To avoid overheating the sample, the laser power was kept as low as possible. Through a lens system at the furnace exit, the up-converted green emissions were collimated and then focused on an optical fiber coupled to a 0.3 m focal length single grating spectrometer (Andor Shamrock 303i). The light was detected by a Peltier cooled silicon CCD camera (Andor Newton DU490A-1.7) with a resolution of about 0.7 nm (about 25 cm−1 in the green region) and an integration time of 10 s. All spectra were corrected for the spectral response of the equipment. Conventional room temperature luminescence measurements were performed using a 488–490 nm laser diode as an excitation source and emission signal was detected with the experimental set-up described elsewhere [28].

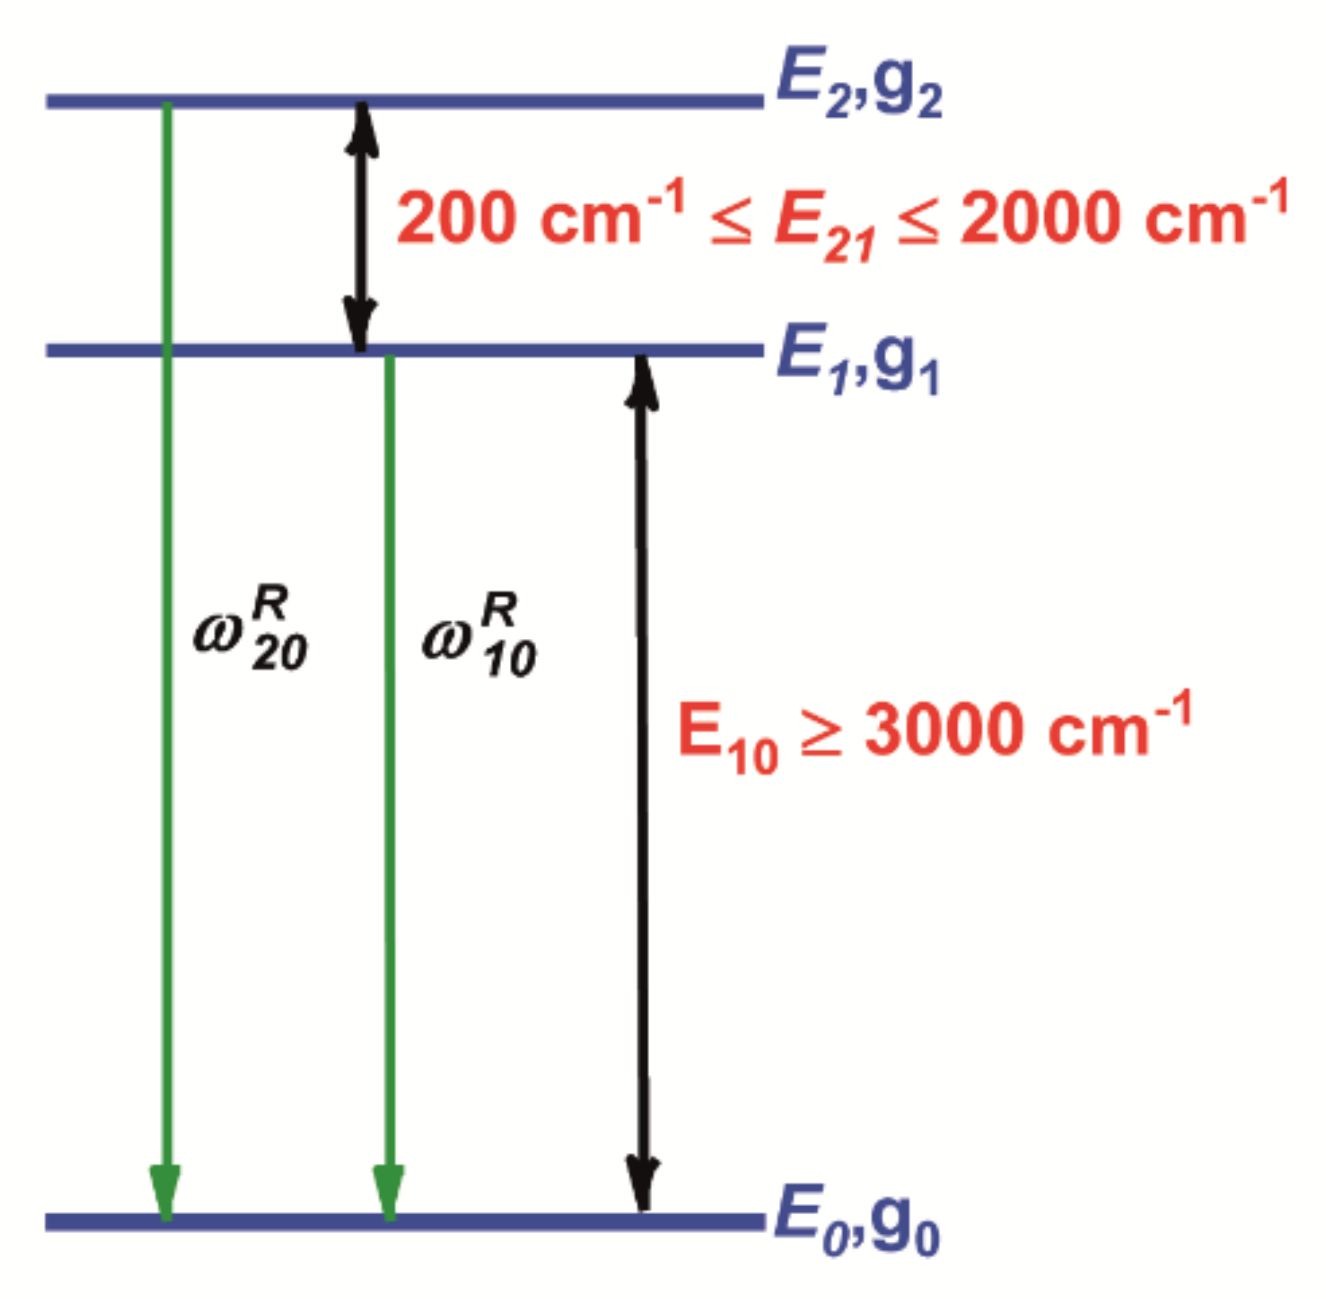
Fluorescence Intensity Ratio (FIR) Technique

FIR technique uses the ratio between the intensities of the emissions coming from two TCL to characterize a temperature sensor in the following way [9]. Consider the luminescence of two TCL, having E1 and E2 energies, to a final level with energy E0 (see Figure 1) being I20 and I10 their respective integrated intensities. By describing the population of both levels in thermal equilibrium using Boltzmann’s distribution, we can define a thermometric parameter ∆ as [9]:
Δ = I 20 I 10 = ω 20 R g 2 E 2 ω 10 R g 1 E 1 e - E 21 / KT = C   e - E 21 / KT
where K is the Boltzmann constant, E21 = E2 ‒ E1 is the energy separation between the thermalized emitter levels, g2 and g1 their respective degenerations (2J + 1) and ω ij R is the spontaneous emission rates that can be calculated using the theory of Judd–Ofelt [30,31,32,33,34]. Besides accuracy, two relevant figure quantities characterize a thermal sensor: the relative sensitivity and the resolution. The sensor relative thermal sensitivity SREL (in % K−1) is defined using the following expression [35]:
S REL = 1 Δ d Δ dT × 100 = E 21 KT 2 × 100
This parameter has the advantage of allowing the comparison of the performance with temperature of different optical temperature sensors regardless of their nature. From Equation (2), larger energy gap between the TCL levels implies higher thermal sensitivity. Nonetheless, this is true only to a certain extent, because larger energy gap also means lower population in the upper level, leading to lower intensity emission coming from such level [9,35].
Concerning the temperature resolution, it is usual to define the temperature uncertainty, δT (in K), as the smallest temperature change that can be achieved in each measurement. The temperature uncertainty can be estimated according to the equation: [35]:
δ T = 1 S REL δ Δ Δ
where SREL is the relative sensitivity and the δ∆/∆ is the relative uncertainty on ∆, which for typical sensitive detectors (CCDs, among others) is around 0.03% [35].

3. Results and Discussion
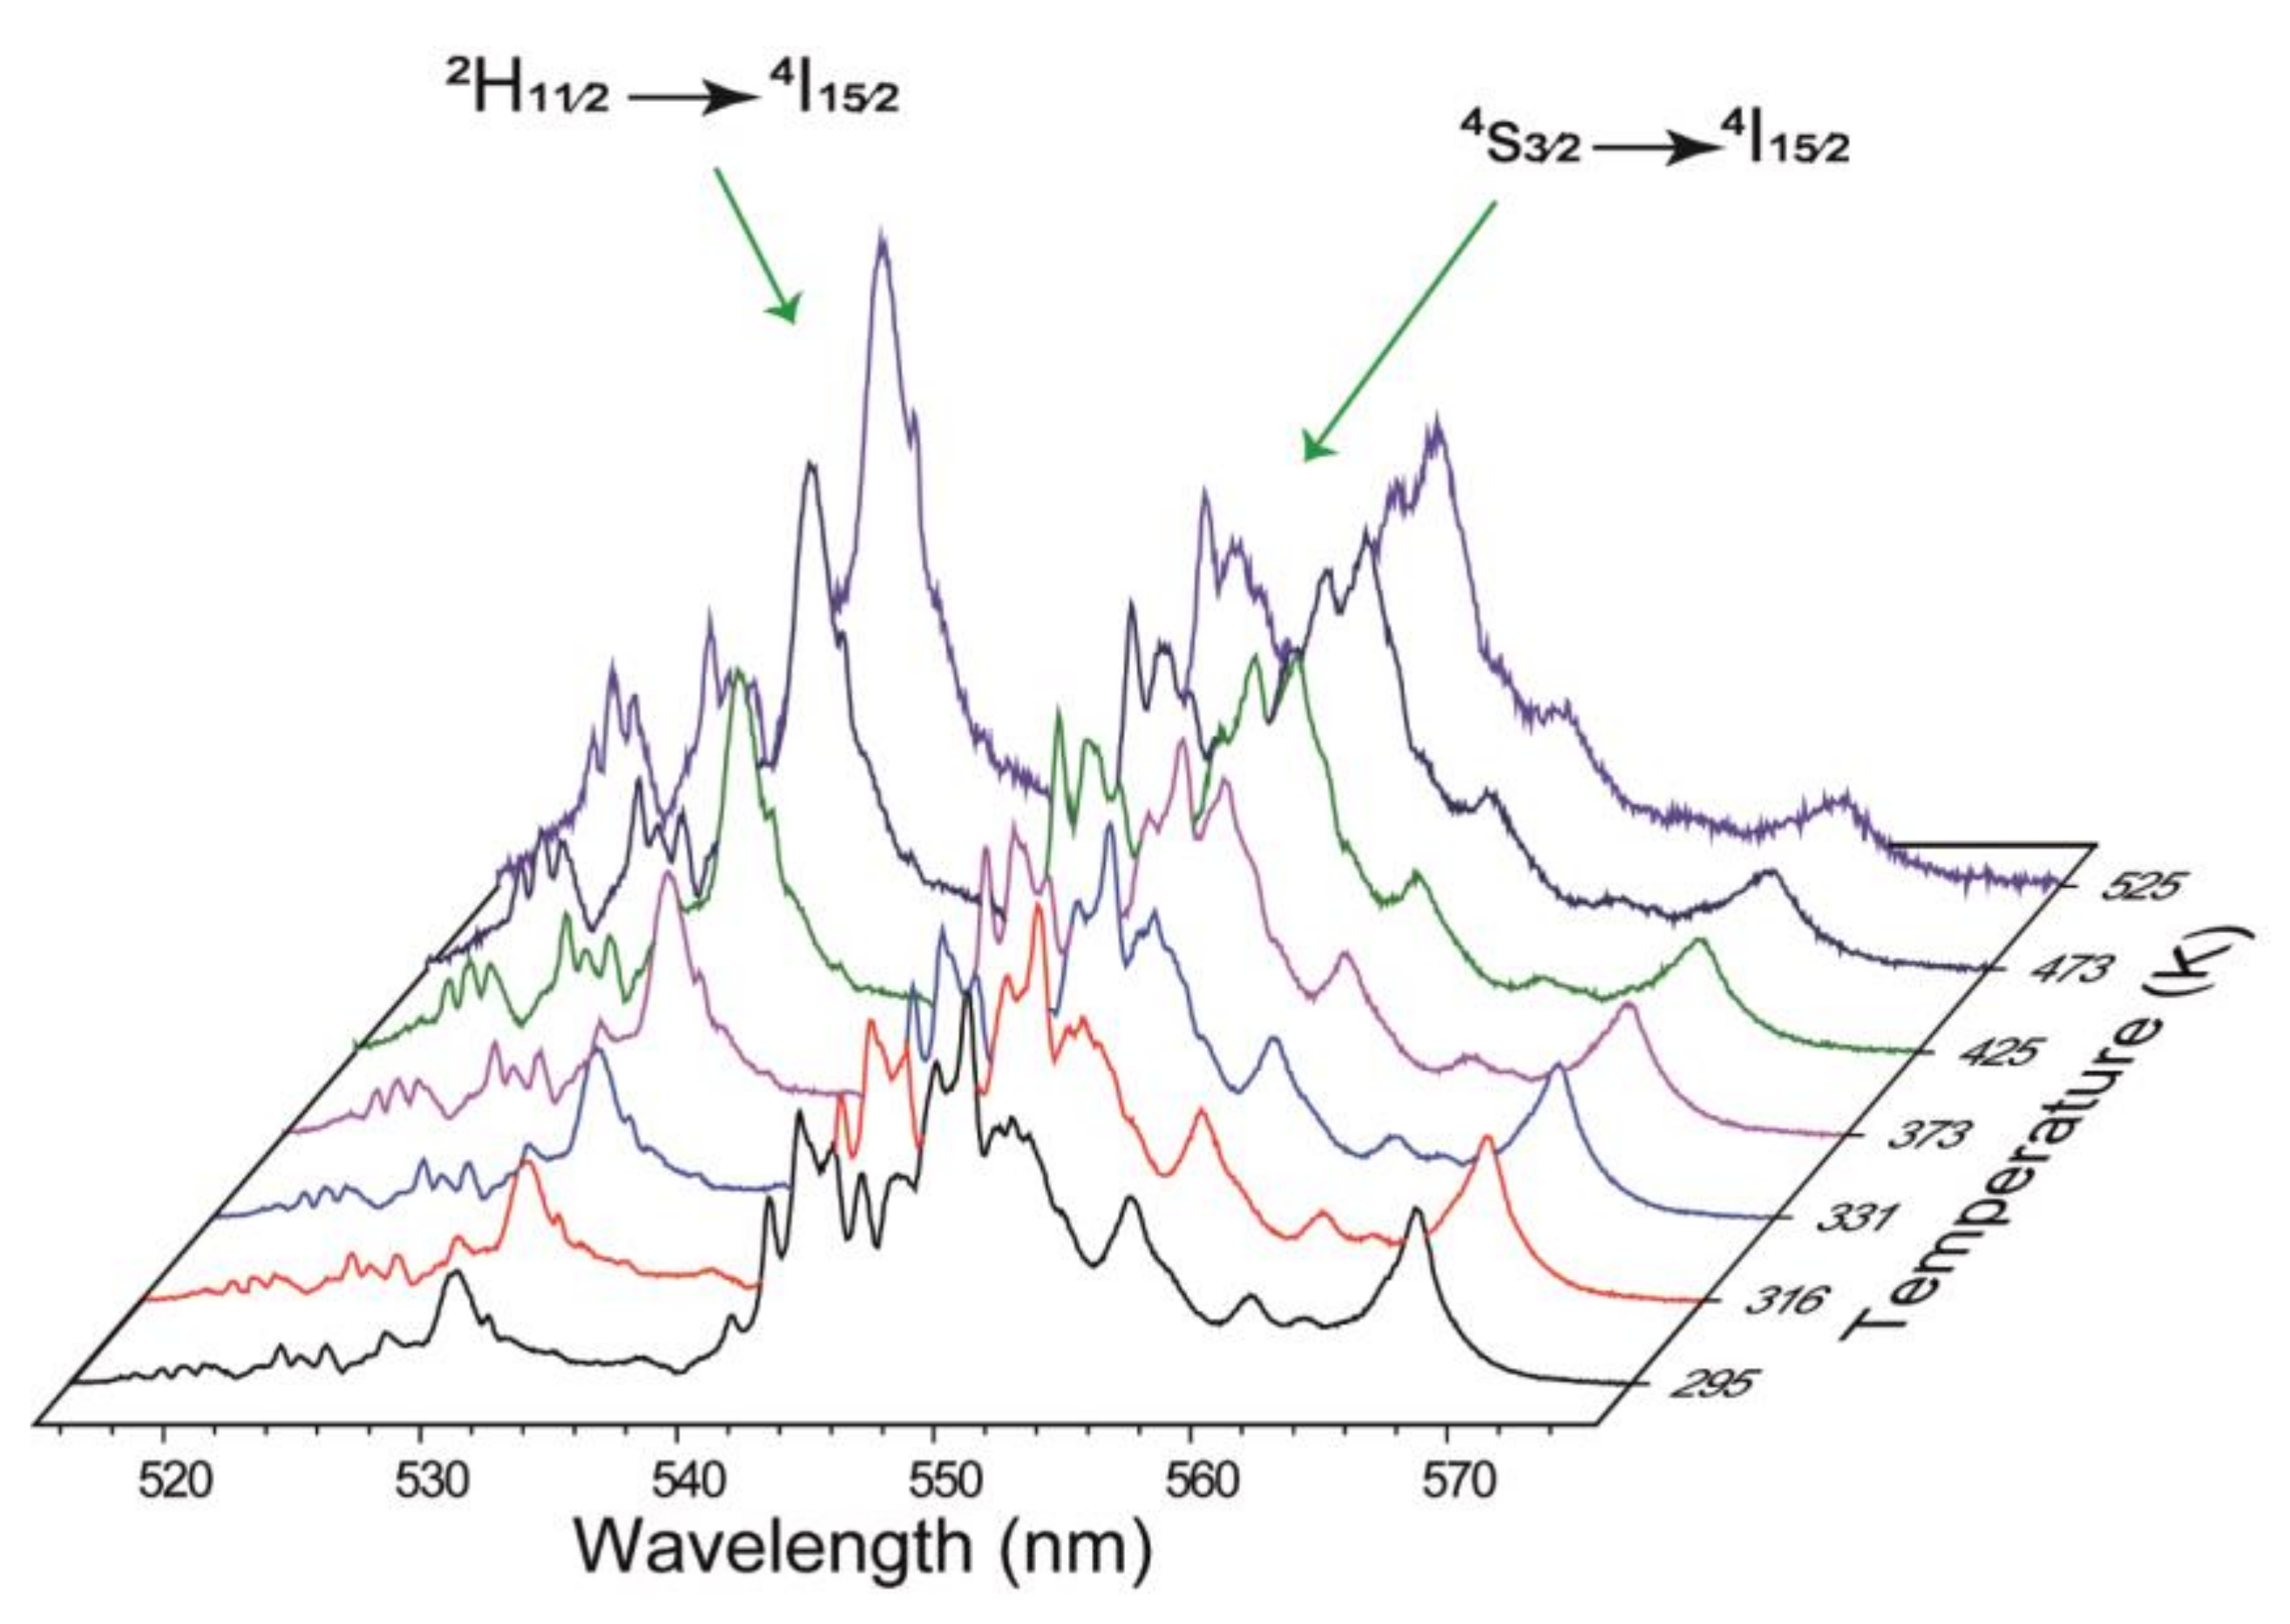
3.1. Luminescence

VIS-NIR conventional luminescence of Er3+ ions obtained from a La2.9Er0.1NbO7 powder sample excited at 488 nm and the upconverted luminescence obtained under the 975 nm excitation, both recorded in ambient conditions, are shown in Figure 2. A simplified level scheme is included on the side of Figure 2 showing the main excitation channels in which these VIS-NIR emissions are originated. In the VIS region, we observe the characteristic green bands corresponding to the (2H11/2,4S3/2) → 4I15/2, transitions, dominating the spectra, together with a less intense red emission band centred at 660 nm corresponding to the 4F9/24I15/2 erbium transition. A low NIR luminescence band centred at about 850 nm, lying on the first biological window and corresponding to the 4S3/24I13/2 transition, is also obtained. From the analysis of integrated intensity of upconverted emission versus excitation power, a slope of 1.5 is obtained (see inset in the lower side), indicating that at least two IR photons are involved in the process in accordance with previous data [28,36,37]. We must note that the same bands are obtained in both spectra, but they have different relative intensities, depending on the luminescence origin. Obviously, the spectrum at the bottom of this figure was not obtained with low-power laser excitation. Thus, the effective temperature of the sample is higher in this spectrum than in that of conventional luminescence (upper side of the figure), originating from the 530 nm band having higher relative intensity. In all luminescence channels, the luminescence consists of broad bands, formed by a strong spread of narrow lines that extend to energies lower than usual values in other oxides. This fact is indicative of the Er3+ incorporation in a system with occupation of several available centres. Indeed, some intense narrow emission peaks observed in the low energy side of each emission band, those centred at 573, 695 and 883 nm, appear as characteristic features of the Er3+ luminescence in these samples. As the La3NbO7 matrix has two La sites with different oxygen coordination, we can assume that this widespread characteristic luminescence is mainly due to the emission of erbium ions incorporated in both sites, as was previously indicated [28]. However, because samples are fine powders in which the discontinuity in grain boundaries supports several types of defects, and due to the presence of LaNbO4 secondary phase in the samples used in this work, the origin of the emission peaks is not definitively clear. Finally, we must emphasize that the presence of the secondary LaNbO4 phase does not seem to play a significant role in this study, since we have not found differences in the luminescence behaviour in samples with different erbium concentration La3−xNbErxO7 with x = 0.01, 0.05 or 0.1) nor in samples with the same erbium nominal concentration (x = 0.1) synthesized in different series; so, the measurements’ repeatability appears to be guaranteed.

3.2. Optical Sensor Calibration

We have studied the temperature dependence of all upconverted emission bands. Concerning the ~850 nm NIR luminescence lying on the first biological window, our primary interest was focused on the physiological range of temperature (303–318 K). Unfortunately, we found that both intensity and shape of the 850 nm band are mainly insensitive to the temperature changes in this narrow range of temperature.
Since the green upconverted emissions of La3−xNbO7: Er3+ (x = 0.1) phosphor present high intensities and quantum yields along with the hypersensitivity of the upper thermalized energy level 2H11/2 [30,38], we analysed the feasibility of using this powdered material as a temperature sensor, working not only in the VIS range belonging within the physiological range of temperature but also at high temperatures.
In this regard, the temperature evolution of the green upconverted emissions related to the (2H11/2,4S3/2) → 4I15/2 transitions of Er3+ ions were measured in this sample, and the obtained spectra are shown in Figure 3. In these spectra it can be observed that as the temperature increases, the intensity of the emission band related to the transition 2H11/24I15/2 also increases. In addition, the 4S3/24I15/2 emission band decreases due to the thermally induced population from this level to the upper one. In this sense, the relationship between the intensity areas of these green upconverted emission bands related to the (2H11/2,4S3/2) → 4I15/2 can be considered as I20 and I10 in order to obtain the “upconverted” radiometric thermometric ∆ in Equation (2).
The temperature evolution of ∆ in the whole range of temperature is shown in Figure 4. It is clearly observed that such parameter increases as the temperature does, describing a curve that can be simulated using the Boltzmann’s distribution law (Equation (1)). Using a standard least-squares fitting procedure, the values of C = 5.96 and an energy gap E21 = 768 cm−1 were determined. This data and the high thermal stability of this compound make it to be a good candidate for optical measurements of temperature in a range wider than that studied here.
Let us now focus our attention on the low temperature side of the range studied in this work. The relative thermal sensitivity SREL as a function of temperature T, as defined by Equation (2) and also shown in Figure 4 in the biological range of temperatures, shows relatively high values of around 1.26 and 1.19 % K−1 at 295 K and 303 K, respectively, with a low temperature uncertainties δT of around 0.05 K. The capabilities of the La2.9Er0.1NbO7 phosphor as an optical temperature sensor are compared to other Er3+ and Er3+-Yb3+-based optical temperature sensors listed in Table 1. From this table, it is clear that this material presents good performance with temperature showing high thermal sensitivities compared to other phosphors, for instance CaWO4:Er3+-Yb3+, Na2Y2B2O7:Er3+-Yb3+, BaMoO4:Er3+-Yb3+ or KLa(MoO4)2:Er3+-Yb3+ phosphors [39,40,41,42], among others, at high temperature range. On the other hand, La3−xNbO7Erx (x = 0.1) phosphor also shows high thermal sensitivities within the physiological temperature range. In this narrow range (303–318 K), the sensitivity is comparable to other materials reported for applications in such range; for example, YAP: Er3+-Yb3+ nanoperovskites [13], which also exhibit applications in laser heating, or NaYbF4:Er3+ powders [43], which can be used for biological purposes, such as photo-thermal therapy or even drug release.
The obtained SREL values suggest the application of this material as an optical temperature sensor working in the VIS range, and the obtained parameters suggest that this material is not only interesting from the point of view of industry applications at high temperatures but also within the physiological range of temperature for applications in biological systems.

4. Conclusions

The temperature dependence of green-upconverted emissions of Er3+ ions in La3NbO7 phosphors was studied within both the physiological temperature range from 303 K to 318 K and at higher temperatures, up to 525 K, under excitation at 975 nm. The thermal sensitivity obtained for the green thermally coupled emission bands ranged between 1.26% K−1 at 295 K and 1.19% K−1 at 303 K. Compared to other optical temperature sensors based on Er3+ and Yb3+-Er3+ excited in the NIR range and working in the VIS range, these values are high enough to support the viability of the Er3+:La3NbO7 phosphor as an optical temperature sensor. Based on the FIR technique for both temperature ranges under study, the physiological temperature range with applications in biological systems and higher temperature ranges could be interesting for some industrial applications.

Supplementary Materials

The following supporting information can be downloaded at: https://www.mdpi.com/article/10.3390/cryst12040455/s1, Figure S1. Powder XRD pattern of a La3‒xErxNbO7 (x = 0.1) powder sample. Vertical bars correspond to Bragg positions. Difference between measured and calculated intensities is given at the bottom. Inset shows the high intensity region (25–35 degrees) in which some extra peaks corresponding to the secondary LaNbO4 phase are indicated with “*”. The peak marked with “+” is due to La2O3, Figure S2. High resolution SEM image (BSE, 5000×) of a region of a La2.9Er0.1NbO7 sample showing regions labeled as A and B with strong microstructure differences. EDS spectra corresponding to (A) and (B) regions are showed in the lower side. Table S1. Structure Refinement Results of La3‒xErxNbO7 (x = 0.1) from XRD data, Table S2. Results of compositional analysis of regions (A) and (B) from EDS data.

Author Contributions

Conceptualization, M.A.H.-R., V.L., U.R.R.-M. and J.E.M.-S., validation M.A.H.-R., V.L., U.R.R.-M. and J.E.M.-S.; investigation, M.A.H.-R. and A.E.; writing—original draft preparation, M.A.H.-R. and A.E.; writing—review and editing, J.E.M.-S.; supervision, U.R.R.-M., V.L. and J.E.M.-S.; funding acquisition, V.L., U.R.R.-M. and J.E.M.-S. All authors have read and agreed to the published version of the manuscript.

Funding

This research has been partially supported by the Spanish Ministerio de Ciencia, Innovación y Universidades (MICINN) through the Spanish projects RTI2018-101020-B-100 and PID2019-106383GB-C44, by the Madrid Government (Comunidad de Madrid-Spain) under the Multiannual Agreement with UC3M in the line of Excellence of University Professors (EPUC3MXX) and in the context of the V PRICIT (Regional Programme of Research and Technological Innovation) by the Agencia Canaria de Investigación, Innovación y Sociedad de la Información (ACIISI) (ProID2017010078).

Institutional Review Board Statement

Not applicable.

Informed Consent Statement

Not applicable.

Data Availability Statement

Not applicable.

Acknowledgments

M.A.H.-R. thanks MINECO for the FPI grant (BES-2014-068666). U.R.R.-M. thanks Gobierno de Canarias and EU-FEDER for grant ProID2020010067.

Conflicts of Interest

The authors declare no conflict of interest.

References

  1. Xu, W.; Cui, Y.; Hu, Y.; Zheng, L.; Zhang, Z.; Cao, W. Optical temperature sensing in Er3+-Yb3+ codoped CaWO4 and the laser induced heating effect on the luminescence intensity saturation. J. Alloy. Compd. 2017, 726, 547–555. [Google Scholar] [CrossRef]
  2. Jaque, D.; Vetrone, F. Luminescence nanothermometry. Nanoscale 2012, 4, 4301–4326. [Google Scholar] [CrossRef] [PubMed]
  3. Brites, C.D.S.; Lima, P.P.; Silva, N.J.O.; Millán, A.; Amaral, V.S.; Palacio, F.; Carlos, L.D. Thermometry at the nanoscale using lanthanide-containing organic-inorganic hybrid materials. J. Lumin. 2013, 133, 230–232. [Google Scholar] [CrossRef] [Green Version]
  4. McLaurin, E.; Bradshaw, L.R.; Gamelin, D.R. Dual-Emitting Nanoscale Temperature Sensors. Chem. Mater. 2013, 25, 1283–1292. [Google Scholar] [CrossRef]
  5. Vetrone, F.; Naccache, R.; Zamarron, A.; de la Fuente, A.J.; Sanz-Rodriguez, F.; Maestro, L.M.; Rodriguez, E.M.; Jaque, D.; García Solé, J.; Capobianco, J.A. Temperature sensing using fluorescent nanothermometers. ACS Nano 2010, 4, 3254–3258. [Google Scholar] [CrossRef]
  6. Sun, M.; He, Q.; Kuang, X.; Zhang, Q.; Ye, S.; Huang, B. Probing oxide-ion conduction in low-temperature SOFCs. Nano Energy 2018, 50, 88–96. [Google Scholar] [CrossRef]
  7. Dos Santos, P.V.; De Araujo, M.T.; Gouveia-Neto, A.S.; Medeiros Neto, J.A.; Sombra, A.S.B. Optical temperature sensing using upconversion fluorescence emission in Er3+/Yb3+-codoped chalcogenide glass. Appl. Phys. Lett. 1998, 73, 578–580. [Google Scholar] [CrossRef]
  8. Kusama, H.; Sovers, O.J.; Yoshioka, T. Line Shift Method for Phosphor Temperature Measurements. Jpn. J. Appl. Phys. 1976, 15, 2349–2358. [Google Scholar] [CrossRef]
  9. Wade, S.; Collins, S.F.; Baxter, G. Fluorescence intensity ratio technique for optical fiber point temperature sensing. J. Appl. Phys. 2003, 94, 4743–4756. [Google Scholar] [CrossRef]
  10. Alencar, M.A.R.C.; Maciel, G.S.; de Araújo, C.B.; Patra, A. Er3+-doped BaTiO3 nanocrystals for thermometry: Influence of nanoenvironment on the sensitivity of a fluorescence based temperature sensor. Appl. Phys. Lett. 2004, 84, 4753–4755. [Google Scholar] [CrossRef]
  11. León-Luis, S.F.; Rodriguez-Mendoza, U.; Lalla, E.; Lavín, V. Temperature sensor based on the Er3+ green upconverted emission in a fluorotellurite glass. Sens. Actuators B Chem. 2011, 158, 208–213. [Google Scholar] [CrossRef]
  12. Hernández-Rodríguez, M.A.; Lozano-Gorrín, A.D.; Martín, I.R.; Rodríguez-Mendoza, U.R.; Lavín, V. Comparison of the sensitivity as optical temperature sensor of nano-perovskite doped with Nd3+ ions in the first and second biological windows. Sens. Actuators B Chem. 2018, 255, 970–976. [Google Scholar] [CrossRef]
  13. Hernández-Rodriguez, M.A.; Lozano-Gorrín, A.D.; Lavín, V.; Rodríguez-Mendoza, U.R.; Martín, I.R.; Manjón, F.J. Analysis of the upconversion emission of yttrium orthoaluminate nano-perovskite co-doped with Er3+/Yb3+ions for thermal sensing applications. J. Lumin. 2018, 202, 316–321. [Google Scholar] [CrossRef]
  14. Runowski, M.; Bartkowiak, A.; Majewska, M.; Martin, I.R.; Lis, S. Upconverting lanthanide doped fluoride NaLuF4:Yb3+-Er3+-Ho3+-optical sensor for multi-range fluorescence intensity ratio (FIR) thermometry in visible and NIR regions. J. Lumin. 2018, 201, 104–109. [Google Scholar] [CrossRef]
  15. Hernández-Rodríguez, M.A.; Lozano-Gorrín, A.D.; Lavín, V.; Rodríguez-Mendoza, U.R.; Martín, I.R. Yttrium orthoaluminate nanoperovskite doped with Tm3+ ions as upconversion optical temperature sensor in the near-infrared region. Opt. Express 2017, 25, 27845–27856. [Google Scholar] [CrossRef] [PubMed]
  16. García-Rodríguez, L.; de Sousa-Vieira, L.; Hernández-Rodriguez, M.; Lozano-Gorrín, A.; Lavín, V.; Rodríguez-Mendoza, U.; González-Platas, J.; Ríos, S.; Martín, I. Nanoperovskite doped with Yb3+ and Tm3+ ions used as an optical upconversion temperature sensor. Opt. Mater. 2018, 83, 187–191. [Google Scholar] [CrossRef]
  17. Hernández-Rodríguez, M.; Lozano-Gorrín, A.; Martín, I.; Rodríguez-Mendoza, U.; Lavín, V. Spectroscopic properties of Nd3+ ions in YAP nano-perovskites. J. Lumin. 2017, 188, 204–208. [Google Scholar] [CrossRef]
  18. Lozano-Gorrín, A.D.; Rodríguez-Mendoza, U.R.; Venkatramu, V.; Monteseguro, V.; Hernández-Rodríguez, M.A.; Martín, I.R.; Lavín, V. Lanthanide-doped Y3Ga5O12 garnets for nanoheating and nanothermometry in the first biological window. Opt. Mater. 2018, 84, 46–51. [Google Scholar] [CrossRef]
  19. Hernández-Rodríguez, M.A.; Muñoz-Santiuste, J.E.; Lavín, V.; Lozano-Gorrín, A.D.; Rodríguez-Hernández, P.; Muñoz, A.; Venkatramu, V.; Martín, I.R.; Rodríguez-Mendoza, U.R. High pressure luminescence of Nd3+ in YAlO3 perovskite nanocrystals: A crystal-field analysis. J. Chem. Phys. 2018, 148, 044201. [Google Scholar] [CrossRef]
  20. Hernández-Rodríguez, M.; Rodríguez-Mendoza, U.; Lavín, V.; Muñoz-Santiuste, J.; Martín, I.; Lozano-Gorrín, A. High pressure sensitivity of anti-Stokes fluorescence in Nd3+ doped yttrium orthoaluminate nano-perovskites. J. Lumin. 2018, 196, 20–24. [Google Scholar] [CrossRef]
  21. Cai, L.; Nino, J.C. Structure and dielectric properties of Ln 3NbO7 (Ln = Nd, Gd, Dy, Er, Yb and Y). J. Eur. Ceram. Soc. 2007, 27, 3971–3976. [Google Scholar] [CrossRef]
  22. Abe, R.; Higashi, M.; Sayama, K.; Abe, Y.; Sugihara, H. Photocatalytic Activity of R3MO7 and R2Ti2O7 (R = Y, Gd, La; M = Nb, Ta) for Water Splitting into H2 and O2. J. Phys. Chem. B 2006, 110, 2219–2226. [Google Scholar] [CrossRef] [PubMed]
  23. Wakeshima, M.; Nishimine, H.; Hinatsu, Y. Crystal structures and magnetic properties of rare earth tantalates RE3TaO7(RE = rare earths). J. Phys. Condens. Matter 2004, 16, 4103–4120. [Google Scholar] [CrossRef]
  24. Lia, Y.; Xub, Q.; Dai, L. A Calcination Technology for Ultrafine La3NbO7 Powder Prepared by Sol-Gel Process. Adv. Mater. Res. 2012, 412, 271–274. [Google Scholar] [CrossRef]
  25. Preux, N.; Rolle, A.; Merlin, C.; Benamira, M.; Malys, M.; Estournes, C.; Rubbens, A.; Vannier, R.-N. La3TaO7 derivatives with Weberite structure type: Possible electrolytes for solid oxide fuel cells and high temperature electrolysers. Comptes Rendus Chim. 2010, 13, 1351–1358. [Google Scholar] [CrossRef] [Green Version]
  26. Kato, K.; Toyoura, K.; Nakamura, A.; Matsunaga, K. First-principles analysis on proton diffusivity in La3NbO7. Solid State Ionics 2014, 262, 472–475. [Google Scholar] [CrossRef]
  27. Cai, L.; Nino, J.C. Complex ceramic structures. I. Weberites. Acta Cryst. B 2009, 65, 269–290. [Google Scholar] [CrossRef]
  28. Egaña, A.; Cantelar, E.; Tardío, M.; Muñoz Santiuste, J.E. Synthesis and luminescence properties of Er3+ doped La3NbO7 ceramic powder. Opt. Mater. 2019, 97, 109393. [Google Scholar] [CrossRef]
  29. Dai, L.; Xu, Q.; Zhu, S.Z.; Liu, L. Preparation of Ultra–Fine La3NbO7 Powder by Solid State Reaction. Key Eng. Mater. 2012, 512–515, 158–161. [Google Scholar] [CrossRef]
  30. León-Luis, S.F.; Rodriguez-Mendoza, U.; Gonzalez, P.H.; Martin, I.R.; Lavin, V. Role of the host matrix on the thermal sensitivity of Er3+ luminescence in optical temperature sensors. Sens. Actuators B Chem. 2012, 174, 176–186. [Google Scholar] [CrossRef]
  31. León-Luis, S.F.; Rodriguez-Mendoza, U.; Martin, I.R.; Lalla, E.; Lavin, V. Effects of Er3+ concentration on thermal sensitivity in optical temperature fluorotellurite glass sensors. Sens. Actuators B Chem. 2013, 176, 1167–1175. [Google Scholar] [CrossRef]
  32. Venkatramu, V.; León-Luis, S.F.; Rodríguez-Mendoza, U.R.; Monteseguro, V.; Manjón, F.J.; Lozano-Gorrín, A.D.; Valiente, R.; Navarro-Urrios, D.; Jayasankar, C.K.; Muñoz, A.; et al. Synthesis, structure and luminescence of Er3+-doped Y3Ga5O12 nano-garnets. J. Mater. Chem. 2012, 22, 13788–13799. [Google Scholar] [CrossRef]
  33. Judd, B.R. Optical Absorption Intensities of Rare-Earth Ions. Phys. Rev. 1962, 127, 750–761. [Google Scholar] [CrossRef]
  34. Ofelt, G.S. Intensities of Crystal Spectra of Rare-Earth Ions. J. Chem. Phys. 1962, 37, 511–520. [Google Scholar] [CrossRef]
  35. Brites, C.D.S.; Milla, A.; Carlos, L.D. Lanthanides in Luminescent Thermometry. In Handbook on the Physics and Chemistry of Rare Earths; Bünzli, J.V.G., Pecharsky, V.K., Eds.; Elsevier: Amsterdam, The Netherlands, 2016; Volume 49, pp. 339–427. [Google Scholar]
  36. Sung Lim, C.; Aleksandrovsky, A.S.; Molokeev, M.S.; Oreshonkov, A.S.; Atuchin, V. Microwave sol–gel synthesis and upconversion photoluminescence properties of CaGd2(WO4)4: Er3+/Yb3+ phosphors with incommensurately modulated structure. J. Solid State Chem. 2015, 228, 160–166. [Google Scholar]
  37. Sung Lim, C.; Aleksandrovsky, A.S.; Molokeev, M.S.; Oreshonkov, A.S.; Atuchin, V.V. Microwave synthesis and spectroscopic properties of ternary scheelite-type molybdate phosphors NaSrLa(MoO4)3:Er3+,Yb3+. J. Alloys Compd. 2017, 713, 156–163. [Google Scholar]
  38. Peacock, R.D. The Intensities of Lanthanide f-f Transitions. Struct. Bond. 1975, 22, 83–122. [Google Scholar]
  39. Zhao, H.; Zhang, Z.; Qin, F.; Li, L.; Zheng, Y.; Zhou, Y. Using the upconversion luminescence of the CaWO4 :Yb3+ − X3+ (X = Er/Ho/Tm) phosphors for ratiometric thermal sensing. J. Lumin. 2018, 202, 301–308. [Google Scholar]
  40. Soni, A.K.; Rai, V.K.; Mahata, M.K. Yb3+ sensitized Na2Y2B2O7: Er3+ phosphors in enhanced frequency upconversion, temperature sensing and field emission display. Mater. Res. Bull. 2017, 89, 116–124. [Google Scholar] [CrossRef]
  41. Liu, X.; Lei, R.; Huang, F.; Deng, D.; Wang, H.; Zhao, S.; Xu, S. Dependence of upconversion emission and optical temperature sensing behavior on excitation power in Er3+ /Yb3+ co-doped BaMoO 4 phosphors. J. Lumin. 2019, 210, 119–127. [Google Scholar] [CrossRef]
  42. Liu, H.; Zuo, C.; Liu, Y.; Gao, G.; Liu, D.; Wang, T.; Liu, T.; Zhang, Y. Optical thermometry through infrared excited green upconversion of KLa(MoO4)2:Yb3+/Er3+ phosphor. J. Lumin. 2019, 207, 93–97. [Google Scholar] [CrossRef]
  43. Liu, G.; Wu, L.; Wei, X.; Zhang, D.; Hu, L. Investigation on laser-induced heating in NaYbF4:Er3+ for accurate photo-thermal conversion with temperature feedback. Opt. Commun. 2018, 426, 418–422. [Google Scholar] [CrossRef]
  44. Du, P.; Luo, L.; Li, W.; Yue, Q.; Chen, H. Optical temperature sensor based on upconversion emission in Er-doped ferroelectric 0.5Ba(Zr0.2Ti0.8)O3-0.5(Ba0.7Ca0.3)TiO3 ceramic. Appl. Phys. Lett. 2014, 104, 2–6. [Google Scholar] [CrossRef]
  45. Suo, H.; Zhao, X.; Zhang, Z.; Shio, R.; Wu, Y.; Xiang, J.; Guo, C. Local Symmetric Distortion Boosted Photon Up-conversion and Thermometric Sensitivity in lanthanum Oxide Nanospheres. Nanoscale 2018, 10, 9245–9251. [Google Scholar] [CrossRef]
  46. Jin, Y.; Pang, T. Highly efficient green upconversion luminescence of ZnMoO4:Yb3+/Er3+/Li+ for accurate temperature sensing. Spectrochim. Acta Part A Mol. Biomol. Spectrosc. 2019, 211, 306–312. [Google Scholar] [CrossRef]
  47. León-Luis, S.F.; Monteseguro, V.; Rodríguez-Mendoza, U.R.; Rathaiah, M.; Venkatramu, V.; Lozano-Gorrín, A.D.; Valiente, R.; Muñoz, A.; Lavín, V. Optical nanothermometer based on the calibration of the Stokes and upconverted green emissions of Er3+ ions in Y3Ga5O12 nano-garnets. RSC Adv. 2014, 4, 57691–57701. [Google Scholar] [CrossRef] [Green Version]
  48. Li, L.; Qin, F.; Zhou, Y.; Zheng, Y.; Zhao, H.; Zhang, Z. Temperature sensing based on the 4F7/2/4S3/2−4I15/2 upconversion luminescence intensity ratio in NaYF4:Er3+/Yb3+ nanocrystals. J. Lumin. 2019, 206, 335–341. [Google Scholar] [CrossRef]
  49. Leal, J.J.; Narro-García, R.; Flores-De los Ríos, J.P.; Gutierrez-Mendez, N.; Ramos-Sánchez, V.H.; González-Castillo, J.R.; Rodríguez, E. Effect of TiO2 on the thermal and optical properties of Er3+/Yb3+ co-doped tellurite glasses for optical sensor. J. Lumin. 2019, 208, 342–349. [Google Scholar] [CrossRef]
  50. Du, P.; Luo, L.; Li, W.; Yue, Q. Upconversion emission in Er-doped and Er/Yb-codoped ferroelectric Na0.5Bi0.5TiO3 and its temperature sensing application. J. Alloys Compd. 2014, 116, 014102–014107. [Google Scholar] [CrossRef]
  51. Wang, X.; Yan, X. Ultraviolet and infrared photon-excited synergistic effect in Er3+−doped YbF3+ phosphors. Opt. Lett. 2011, 36, 4353–4355. [Google Scholar] [CrossRef]
Figure 1. Simple scheme for thermal coupled energy levels theory. E21 is the energy gap between the two excited levels E2 and E1, g i is the degeneracy of the i-th level and ω i j R is the spontaneous emission rate between the i-th and j-th levels.
Crystals 12 00455 g001
Figure 2. Luminescence spectrum of the phosphor with nominal composition La2.9Er0.1NbO7 obtained at ambient conditions under 488 nm (upper) and under 975 nm laser excitation (lower). Main transitions are indicated in the upper spectrum. On the right side, a simplified level scheme of Er3+ ion is sketched showing the excitation and de-excitation channels. The inset in the lower spectra shows an example of the upconverted intensity versus excitation power obtained for the emission at 850 nm, showing a slope of 1.5. Similar results were previously reported for green and red upconverted bands [28].
Crystals 12 00455 g002
Figure 3. Thermal evolution of the normalized green upconverted emissions of La2.9Er0.1NbO7 phosphor from 295 K up to 525 K under 975 nm laser excitation.
Crystals 12 00455 g003
Figure 4. Experimental integrated intensity ratio, ∆, (a) in the whole temperature range and (b) in the physiological range of temperature (303 K–318 K), black squares, and relative sensitivity (SREL), blue lines of the La2.9Er0.1NbO7 powder samples obtained from the emission bands associated to the 2H11/24I15/2 and 4S3/24I15/2 transitions. A Boltzmann type curve was fitted to the experimental values of ∆ according to Equation (1) (red line). Temperature uncertainty, δT, computed by Equation (3) in the (c) whole temperature range as well as (d) within the physiological range of temperature.
Crystals 12 00455 g004
Table 1. Relative SREL thermal sensitivities, temperature range and excitation wavelength of different nanomaterials doped with Er3+ ions, or co-doped with Yb3+ ions, used in optical temperature sensing in the biological temperature range. Classification has been done according to the value of the relative sensitivity SR calculated at 303 K.
Er3+ Doped and Er3+-Yb3+ Based Host Matrixλexc (nm)T Range
(K)
FIR EquationSREL
(%K−1)
at 303 K
Ref.
BZT-BCT: Er3+ ceramic980200–4439.97•exp(−1135/T)1.24[44]
Y2O3: Er3+-Yb3+ nanoparticles980273–48013.30•exp(−1131/T)1.23[45]
ZnMoO4:Yb3+-Er3+-Li+980300–40014.27•exp(−1111/T)1.21[46]
NaYbF4: Er3+980293–59310.78•exp(−1098/T)1.20[43]
La3-xNbO7: xEr3+ (x = 0.1) phosphor975295–5255.96•exp(−1097/T)1.19This work
KLa(MoO4)2: Yb3+-Er3+ phosphor980303–42321.95•exp(−1079/T)1.18[42]
YAP: Er3+-Yb3 nanoperovskites980296–6005.77•exp(−1073/T)1.17[13]
Y3Ga5O12: Er3+ nanoparticles488/800300–33511.04•exp(−1047/T)1.16[47]
NaYF4: Er3+-Yb3+ nanocrystals980303–48330.80•exp(−1034/T)1.13[48]
BaMoO4: Er3+-Yb3+ phosphors980300–57520.06•exp(−980/T)1.07[41]
Tellurite glass: Er3+-Yb3 (7.5 mol% TiO2)785318–4318.10•exp(−962/T)1.05[49]
CaWO4: Er3+-Yb3+ phosphors980303–75317.20•exp(−944/T)1.02[39]
Chalcogenide glass: Er3+-Yb31060296–4388.85•exp(−962/T)1.01[7]
Na0.5Bi0.5TiO3: Er3+-Yb3+ ceramic98093–6134.71•exp(−827/T)0.90[50]
Na2Y2B2O7: Er3+-Yb3+ phosphor980300–61327.60•exp(−766/T)0.83[40]
NaLuF4:Yb3+-Er3+-Ho3+975298–5031.46•exp(−654/T)0.71[14]
Silicate glass: Er3+-Yb3+980296–7233.65•exp(−593/T)0.64[51]
Publisher’s Note: MDPI stays neutral with regard to jurisdictional claims in published maps and institutional affiliations.

