Article

Investigation of Magnetic Entropy Change in Intermetallic Compounds SmNi3−xFex Based on Maxwell Relation and Phenomenological Model

1
ICMPE, CNRS, University Paris Est Creteil, UMR 7182, 2 Rue Henri Dunant, 94320 Thiais, France
2
Laboratoire Matériaux Organisation et Propriétés (LR99ES17), Faculté des Sciences de Tunis, Université de Tunis El Manar, Tunis 2092, Tunisia
3
Capgemini Engineering, Direction Research & Innovation Department, 2 Rue Paul Dautier, 78140 Vélizy-Villacoublay, France
4
Faculty of Sciences, University of Sfax, LSME, BP1171, Sfax 3018, Tunisia
5
Department of Chemistry, College of Science and Arts, Ar-rass, Qassim University, PO Box 53, Buraydah 51921, Saudi Arabia
*
Author to whom correspondence should be addressed.
Crystals 2022, 12(4), 481; https://doi.org/10.3390/cryst12040481
Submission received: 19 February 2022 / Revised: 24 March 2022 / Accepted: 25 March 2022 / Published: 31 March 2022

Abstract

:
In this study, we investigate the crystal structure, magnetic, and magnetocaloric effect properties in the intermetallic compounds SmNi 3 x Fe x using a phenomenological model based on Landau mean-field theory and Maxwell relation (conventional method). SmNi 3 x Fe x compounds were prepared under high pure argon by arc melting. To minimize the amount of other possible impurity phases, the ingots were heat-treated at 1073 K for seven days. X-ray diffraction (XRD) under and without an applied magnetic field was used for the structural study. Rietveld analysis with FullProf computer code was used to analyze X-ray diffraction data. The magnetization against temperature was measured under several applied magnetic fields. After the partial substitutions of nickel atom with iron one, we notice an increase of cell parameters. In addition, Curie temperature value increases significantly with the increase of iron content. According to the Landau model, SmNi 3 x Fe x compounds exhibit a second-order magnetic phase transition. The magnetic entropy change was determined with theoretical and experimental methods. Finally, a comparison between theoretical magnetic entropy change and the experimental show an agreement between the two methods.

1. Introduction

Intermetallic compounds present very interesting structural and magnetic properties. As a result, they have been used in many different technological applications [1]. Intermetallic compounds are intensively studied; they are studied for hydrogen absorption [2,3], for their thermomagnetic properties [4,5], for their magnetocaloric effect [6,7,8,9,10,11,12,13,14,15,16,17,17], and for their critical behavior around ferromagnetic to paramagnetic phase transition [18,19]. The SmNi 3 compound is a compound with very interesting structural and magnetic properties. This is due to the fact that the atomic environments of the Sm and Ni atoms are very different and not equivalent [20]. In RNi 3 intermetallics, the different exchange interactions do not have the same importance in determining the Curie temperature. We can consider that the Curie temperature’s only contribution is the exchange interaction between the magnetic moments of the 3 d 3 d sublattice. A low Curie temperature characterizes the SmNi 3 compound. This is mainly due to the low magnetic moment of the Ni atom and short Ni–Ni interatomic distances between the atoms at the 6 c 18 h and 18 h 18 h sites that lead to negative Ni–Ni interactions. Entropy is a measure of order in the magnetocaloric system. The magnetic entropy Δ S M variation is evaluated by the magnetic measurement method, and this method is directly related to the magnetization isotherms as a function of the applied magnetic field for different temperatures. It is possible to obtain the value of Δ S M , at different fields and temperatures, after numerical integration of Maxwell’s relation [21]. The magnetocaloric effect (MCE) in various magnetic materials has been extensively investigated experimentally and also theoretically, not only because of their potential applications for active magnetic refrigeration but also for understanding the fundamental properties of these materials. The experimental study of the magnetocaloric effect requires the measurement of the magnetization as a function of the magnetic field for several temperatures around the magnetic transition while respecting the adiabatic condition of the magnetic field variation, so this measurement is very time-consuming and energetically costly. In this work, we have determined, theoretically and experimentally, the magnetic and magnetocaloric properties of two intermetallic compounds, SmNi 3 and SmNi 2.2 Fe 0.8 , for several magnetic field values. For the theoretical method, one measure of magnetization at low magnetic field is necessary to calculate the magnetic entropy change for a given magnetic field variation. Finally, a comparison is made between the two methods.

2. Experiments

SmNi 3 and SmNi 2.2 Fe 0.8 were prepared from high-purity elements samarium 99.98%, nickel 99.9%, and iron 99.9% by arc-melting technique under a purified argon atmosphere. The elements were placed in a copper crucible cooled by cold water. After ingot formation, the compound was wrapped into tantalum foil and introduced into a silica tube sealed under secondary vacuum 2 × 10 6 bar [22,23]. The ingot was heat-treated for seven days at 1073 K and finally water quenched [24,25]. Phase analysis was performed by X-ray powder diffraction (XRD), using a D8 Brucker diffractometer with Cu K α radiation λ = 1.54178 Å. XRD data of the samples were collected between 20 ° and 80 ° at room temperature with 0.015 step width.
XRD diagrams are analyzed with the Rietveld method [26,27] using the Fullprof program [28,29]. A Physical Properties Measurement System (PPMS) magnetometer was used for measurements at low temperatures. Isotherms were collected at an interval of 2 K around T C with an applied magnetic field up to 5 T. To obtain the internal field H int , the external applied magnetic field H ext was corrected for the demagnetization effect using H int = H ext N d M ( T , H e x t ) . Demagnetization constant N d was determined from M vs. H ext curve in low field region following the method given in Reference [30].

3. Results and Discussion

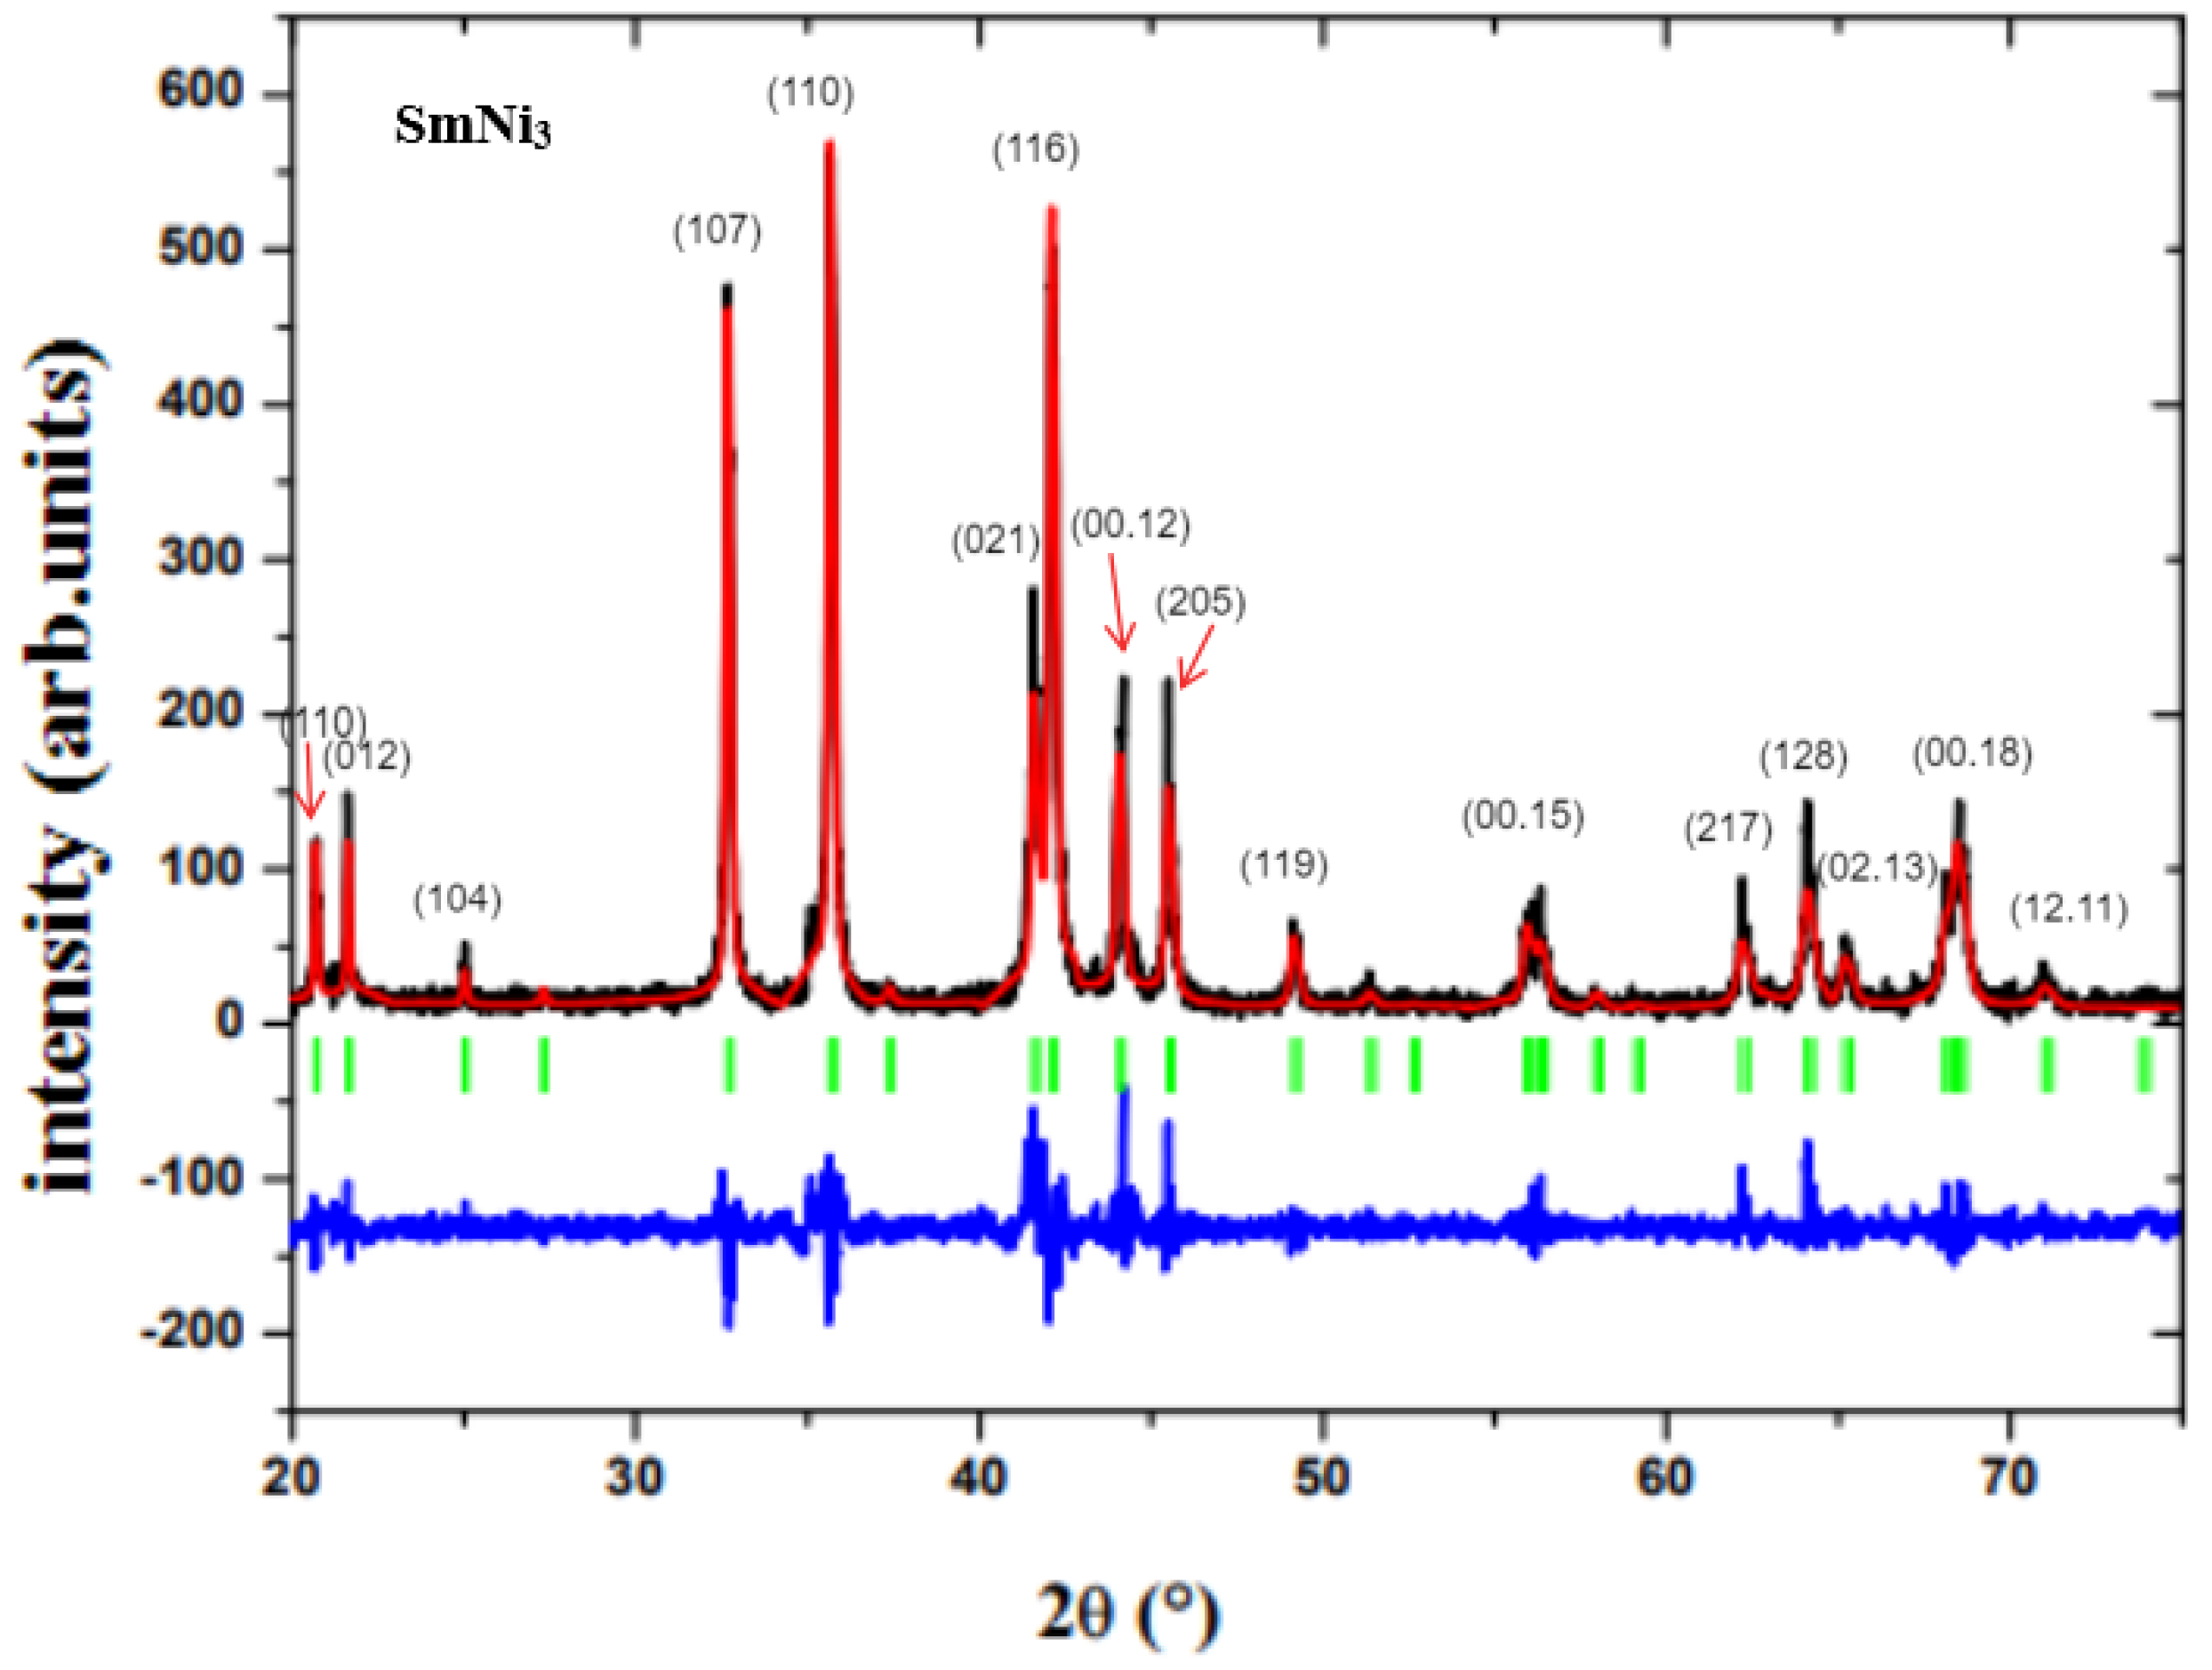
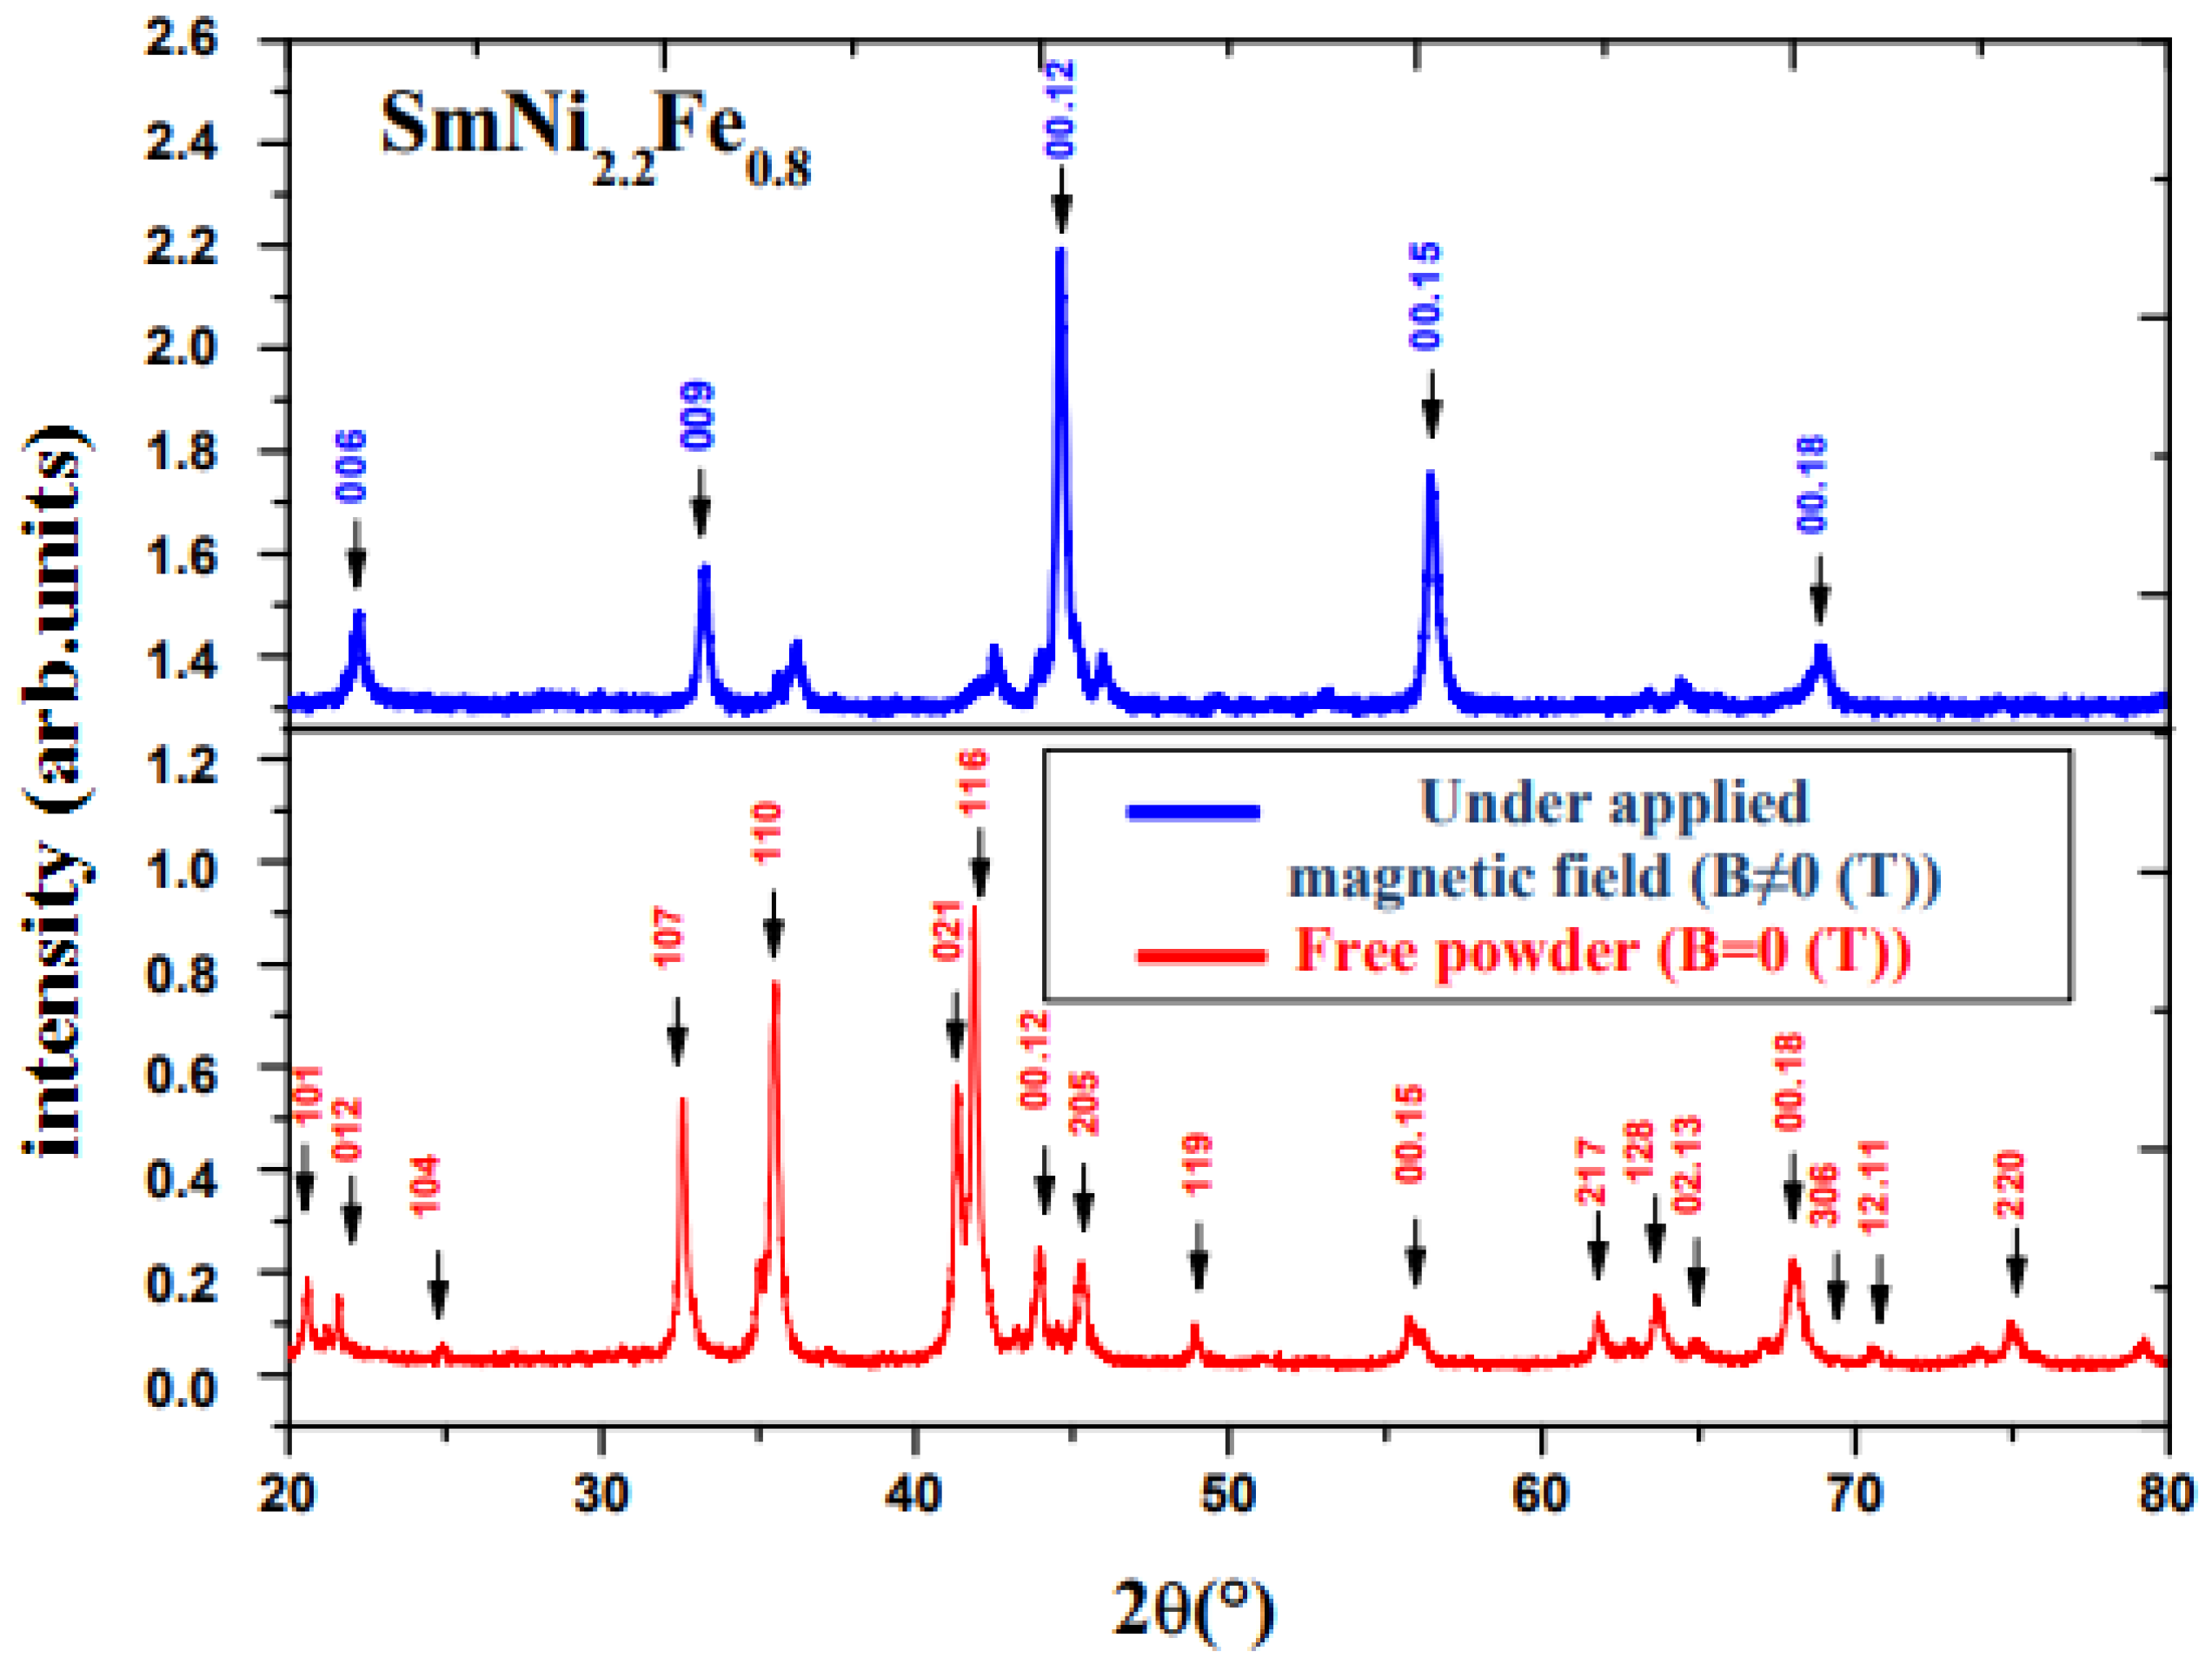
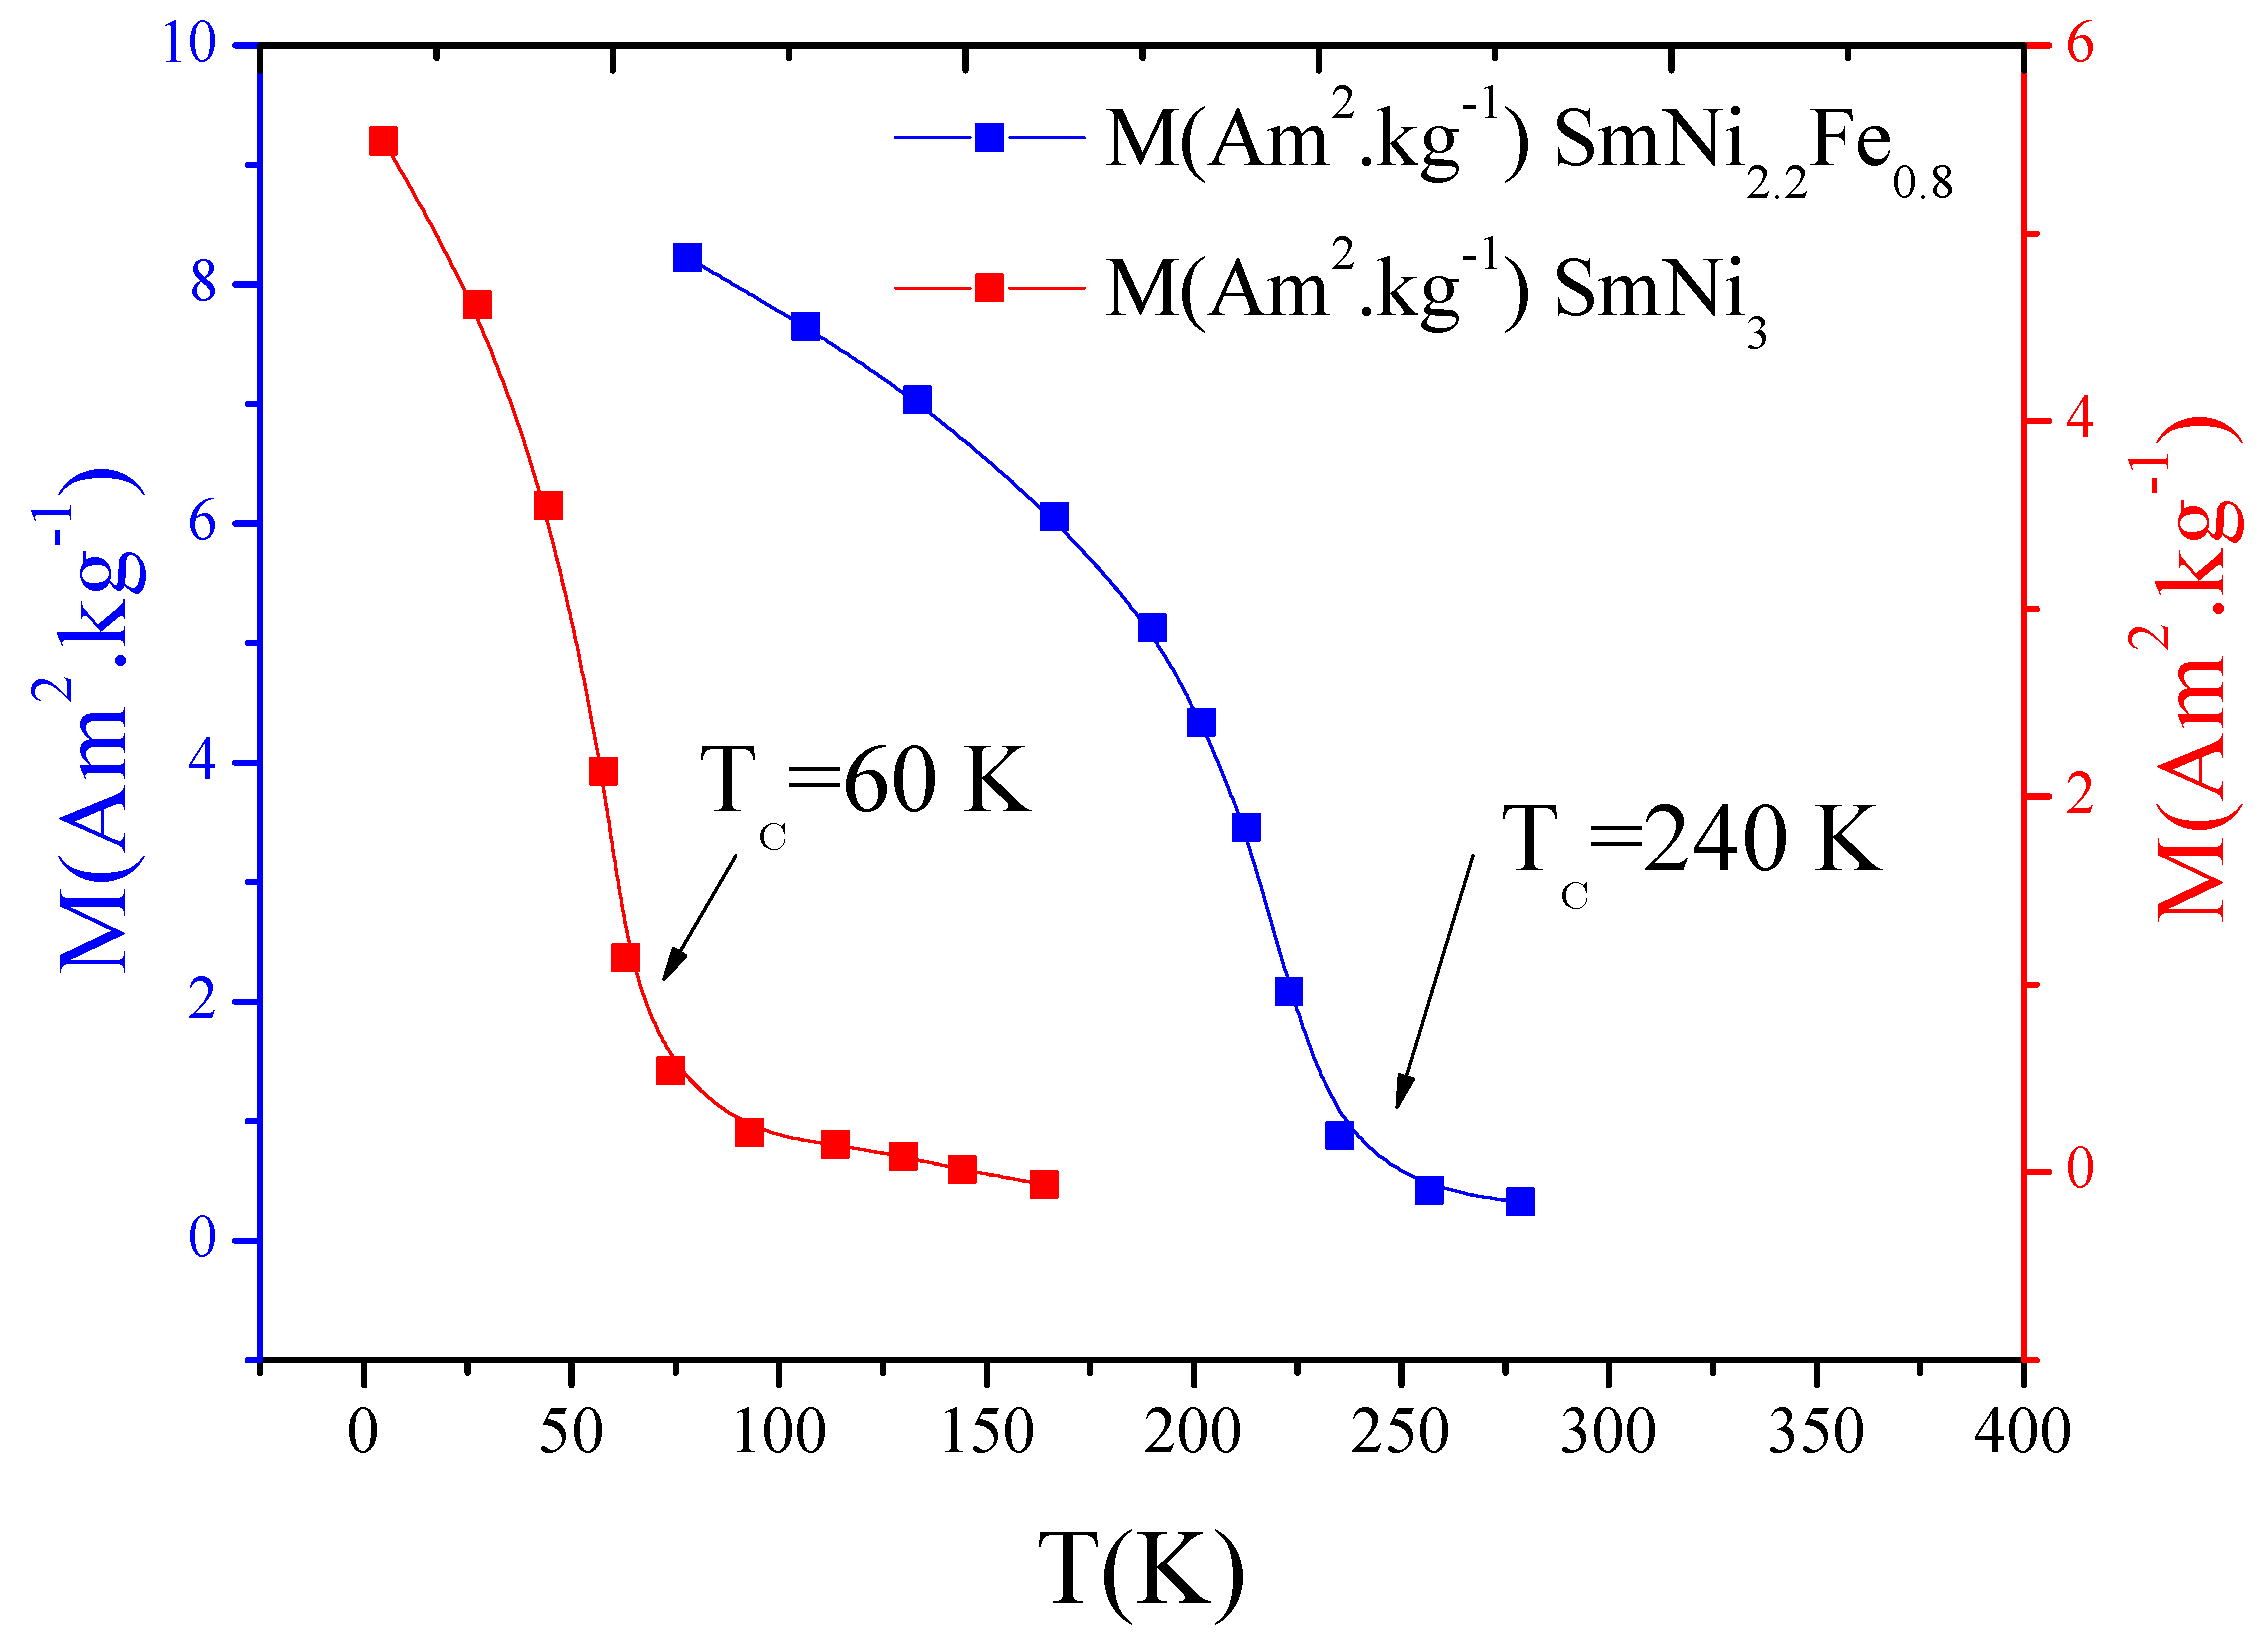
3.1. Structure and Magnetic Properties

The structure of SmNi 3 can be described by an alternating stacking of hexagonal blocks of SmNi 5 type and cubic blocks of SmNi 2 type along the hexagonal axis. For the same composition, two structure types are possible: the hexagonal structure (H) of space group P 6 3 / m m c or the rhombohedral structure (R) of space group R 3 ¯ m . In the rhombohedral structure of SmNi 3 x Fe x , Sm atoms occupy two crystallographic sites, 3 a and 6 c , while Ni atoms occupy three non-equivalent sites: 3 b , 6 c , and 18 h . Therefore, the iron atoms were placed to share the different Ni sites: 3 b , 6 c , and 18 h . Figure 1 shows the Rietveld refinement pattern of SmNi 3 compound XRD. The Rietveld refinement of the diffractograms obtained by X-ray diffraction for SmNi 3 x Fe x (x = 0, 0.4, and 0.8) shows that the cell parameters a and c increase when the concentration of iron increases. Consequently, the cell volume increases Figure 2, and, obviously, the interatomic distances increase; the increase of the interatomic distances has a significant effect on the value of the Curie temperature; this effect will be discussed in the magnetic results.
The SmNi 3 x Fe x compounds have a significant uniaxial magnetocrystalline anisotropy; it results from the anisotropies provided by Sm. Figure 3 shows the comparison between X-ray diffractograms of free and oriented powder measured at 300 K on SmNi 3 x Fe x (x = 0, 0.8). The XRD obtained on oriented powders shows some reticular planes disappearance and the reinforcement of indexed Bragg peaks ( 00 l ) compared to the diagram measured on free powder; thus, the axis of easy magnetization at room temperature is the c-axis. This anisotropy is clearly shown by strengthening the Bragg peaks of type ( 00 l ) .
In the case of an R-T intermetallic compound, there are three types of exchange interactions: the exchange interaction between the magnetic moments of the transition metal atoms ( 3 d 3 d ), the exchange interaction between the magnetic moments of the rare-earth atoms ( 4 f 4 f ), and the exchange interaction between the two sublattices ( 3 d 4 f ). Among these three configurations, the exchange 4 f 4 f is the weakest. Similarly, we can neglect the 3 d 4 f exchange. In this case, only the 3 d 3 d exchange interaction would be considered. Therefore, only the interaction between the magnetic moments of the 3 d 3 d transition metal contributes to the Curie temperature. It should be noted that there are two types of exchange interactions 3 d 3 d in intermetallics, positive and negative. In the case where inter-atomic distance (Ni–Ni/Fe) is lower than a certain critical distance (2.45 Å), the exchange interactions are negative; otherwise, they are positive [31].
In our case, after the partial substitution of the nickel atom by the iron one, the Curie temperature increases noticeably from 60 K to 239 K (Figure 4); obviously, this is due to the exchange interactions. In this case, the coexistence of three effects can be responsible for strengthening the ferromagnetic order. First, the value of the magnetic moment of iron is higher than the magnetic moment of nickel; the second factor is the electronic effect. Although the electronic configuration of the iron atom is different to that of nickel, the additional iron electrons are added in an antisymmetric way in the 3 d band, which allows increasing the amplitude of exchange interactions. Several DFT calculations have demonstrated this effect; we can cite Reference [32]. Thirdly, the magnetovolumic effect: in fact, the Rietveld refinement results show that the lattice parameters increase with the concentration of iron. As a result, the interatomic distances increase, and consequently the amplitude of the exchange interactions between the atoms increases; this effect was demonstrated for the first time for intermetallics with the help of a Mössbauer study [31].
Figure 5 and Figure 6 present isothermal magnetization M ( μ 0 H , T ) measured at different magnetic fields between 0 and 5 T and temperatures from 28 to 78 K and from 200 to 250 K for SmNi 3 and SmNi 2.2 Fe 0.8 , respectively. They show that for temperatures lower than the T C , which corresponds to a ferromagnetic state, the magnetization increases notably according to the magnetic field. However, the material is paramagnetic for temperatures higher than T C , and the magnetization increases slowly with the applied magnetic field. We also note that the magnetization decreases when the temperature increases for a given magnetic field.

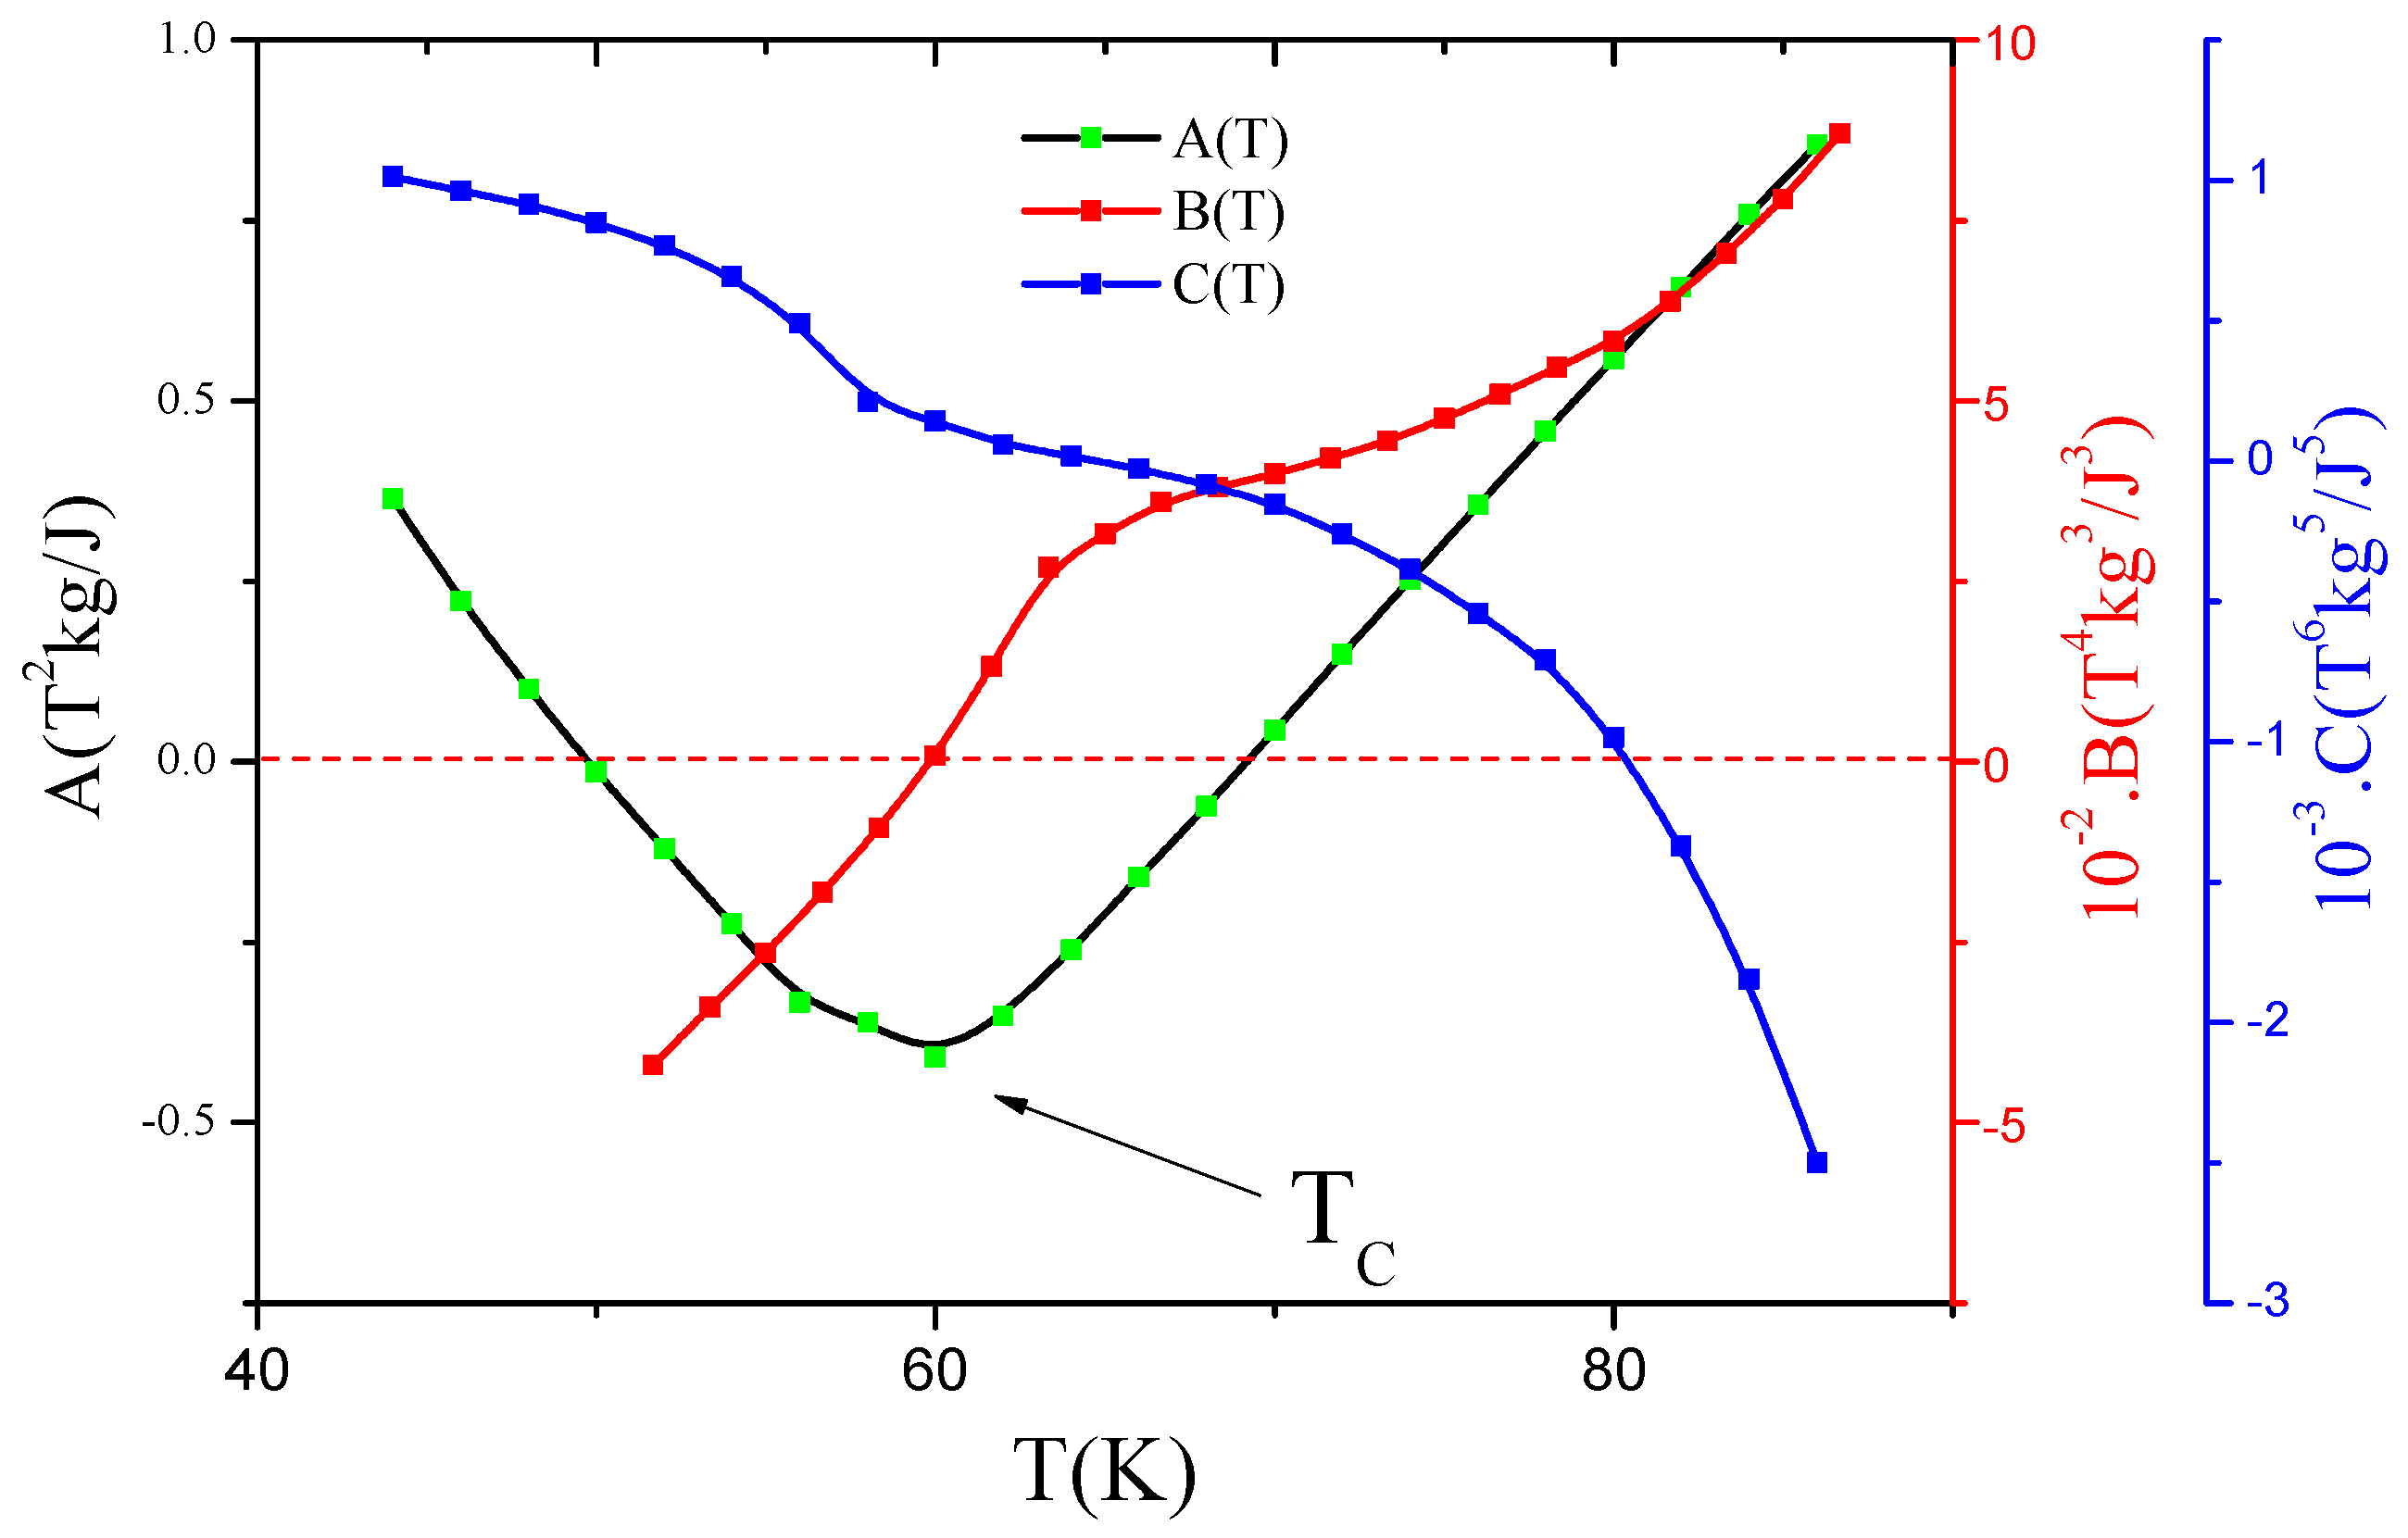
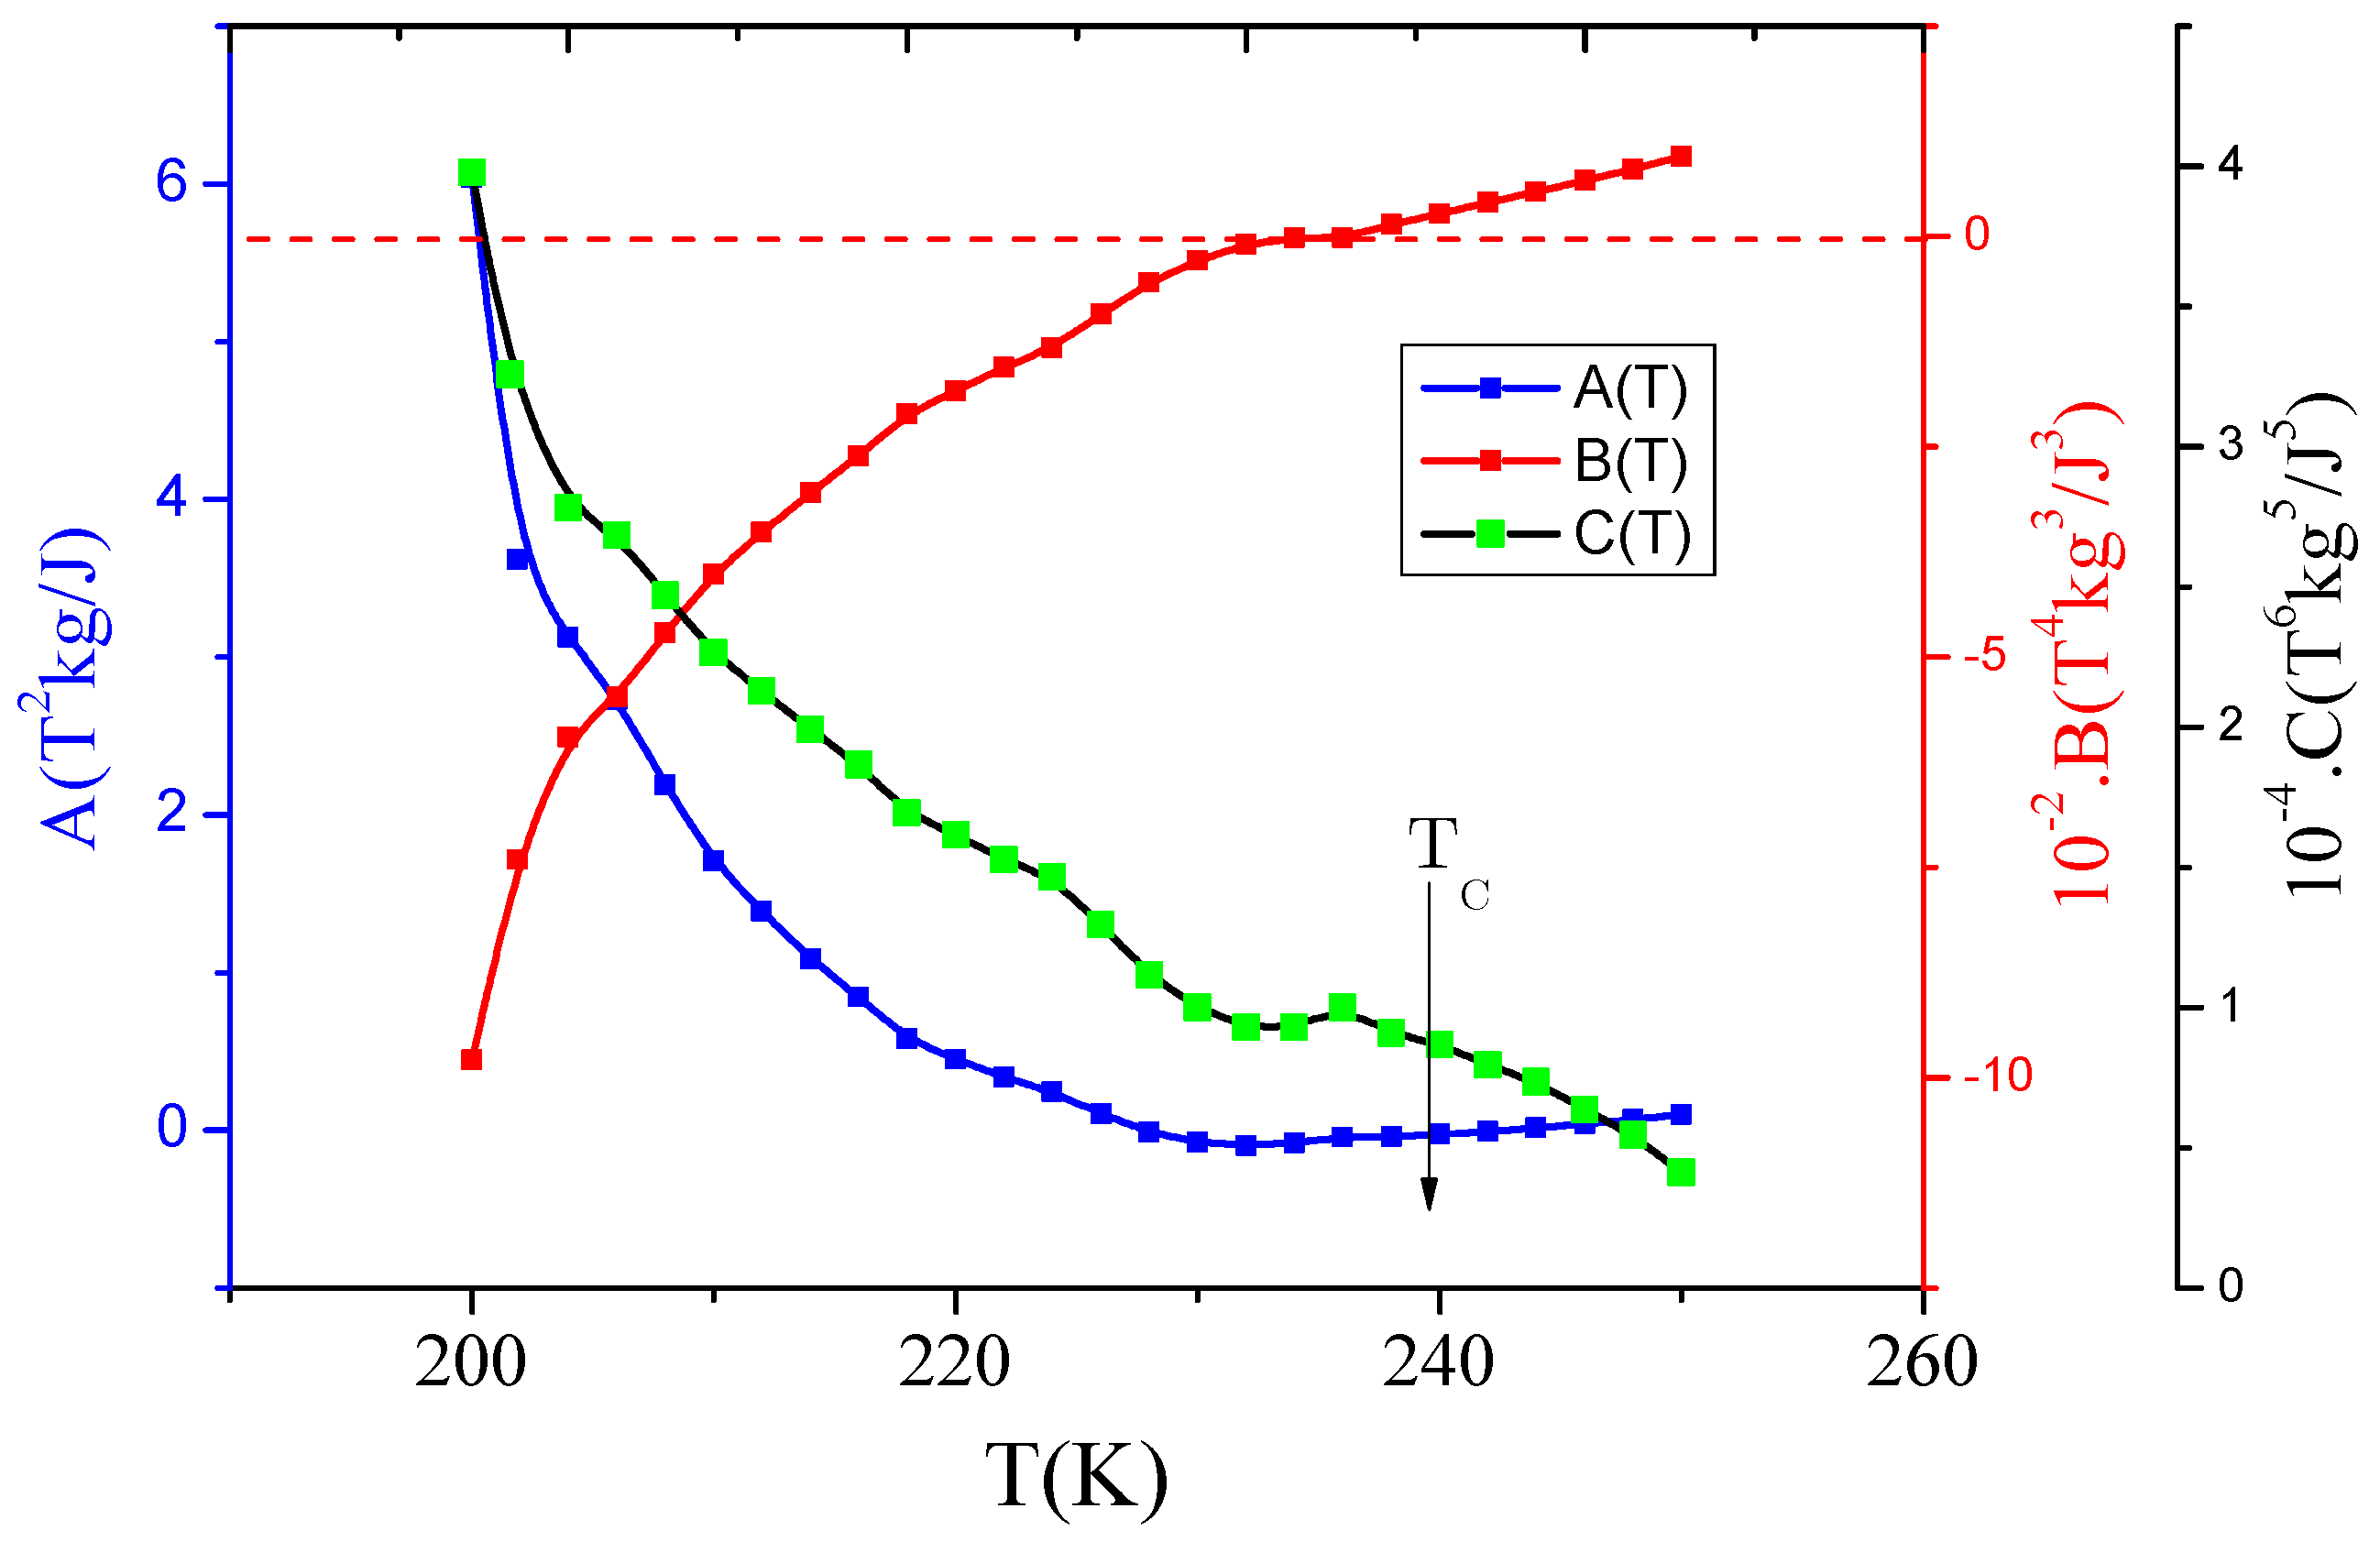
3.2. Phase Transition Nature according to Landau Model

In this section, the Landau model is developed to confirm the nature of the phase transition. The order of the transition phase is determined by developing free magnetic energy depending on the temperature around T C , neglecting the very high power terms of magnetization. As a result, free energy F depending on the total magnetization may be developed in the form of
F = 1 2 A ( T ) M 2 + 1 4 B ( T ) M 4 + 1 6 C ( T ) M 6 μ 0 M H
Applying the equilibrium condition for free energy,
d F d M = 0 ,
we obtain
μ 0 H = a ( T ) M + b ( T ) M 3 + c ( T ) M 5
The coefficients A ( T ) , B ( T ) , and C ( T ) are the Landau parameters determined by fitting μ 0 H as a function of the magnetization M with equilibrium condition equation. A ( T ) and C ( T ) are always positive (Figure 7 and Figure 8). From A ( T ) , we can determine the T C value that corresponds to its minimum. However, B ( T ) can be positive, zero, or negative; the sign of B ( T ) can indicate if the magnetic transition is first-order phase transition or second-order one. Indeed, if b ( T C ) 0 , the magnetic transition is a second-order transition phase; otherwise, the magnetic transition is a first-order transition phase. (Figure 7 and Figure 8) show Landau coefficient plotted against temperature. For SmNi 3 x Fe x (x = 0.8), b ( T C ) 0 , which confirms that the magnetic transition is a second-order type.

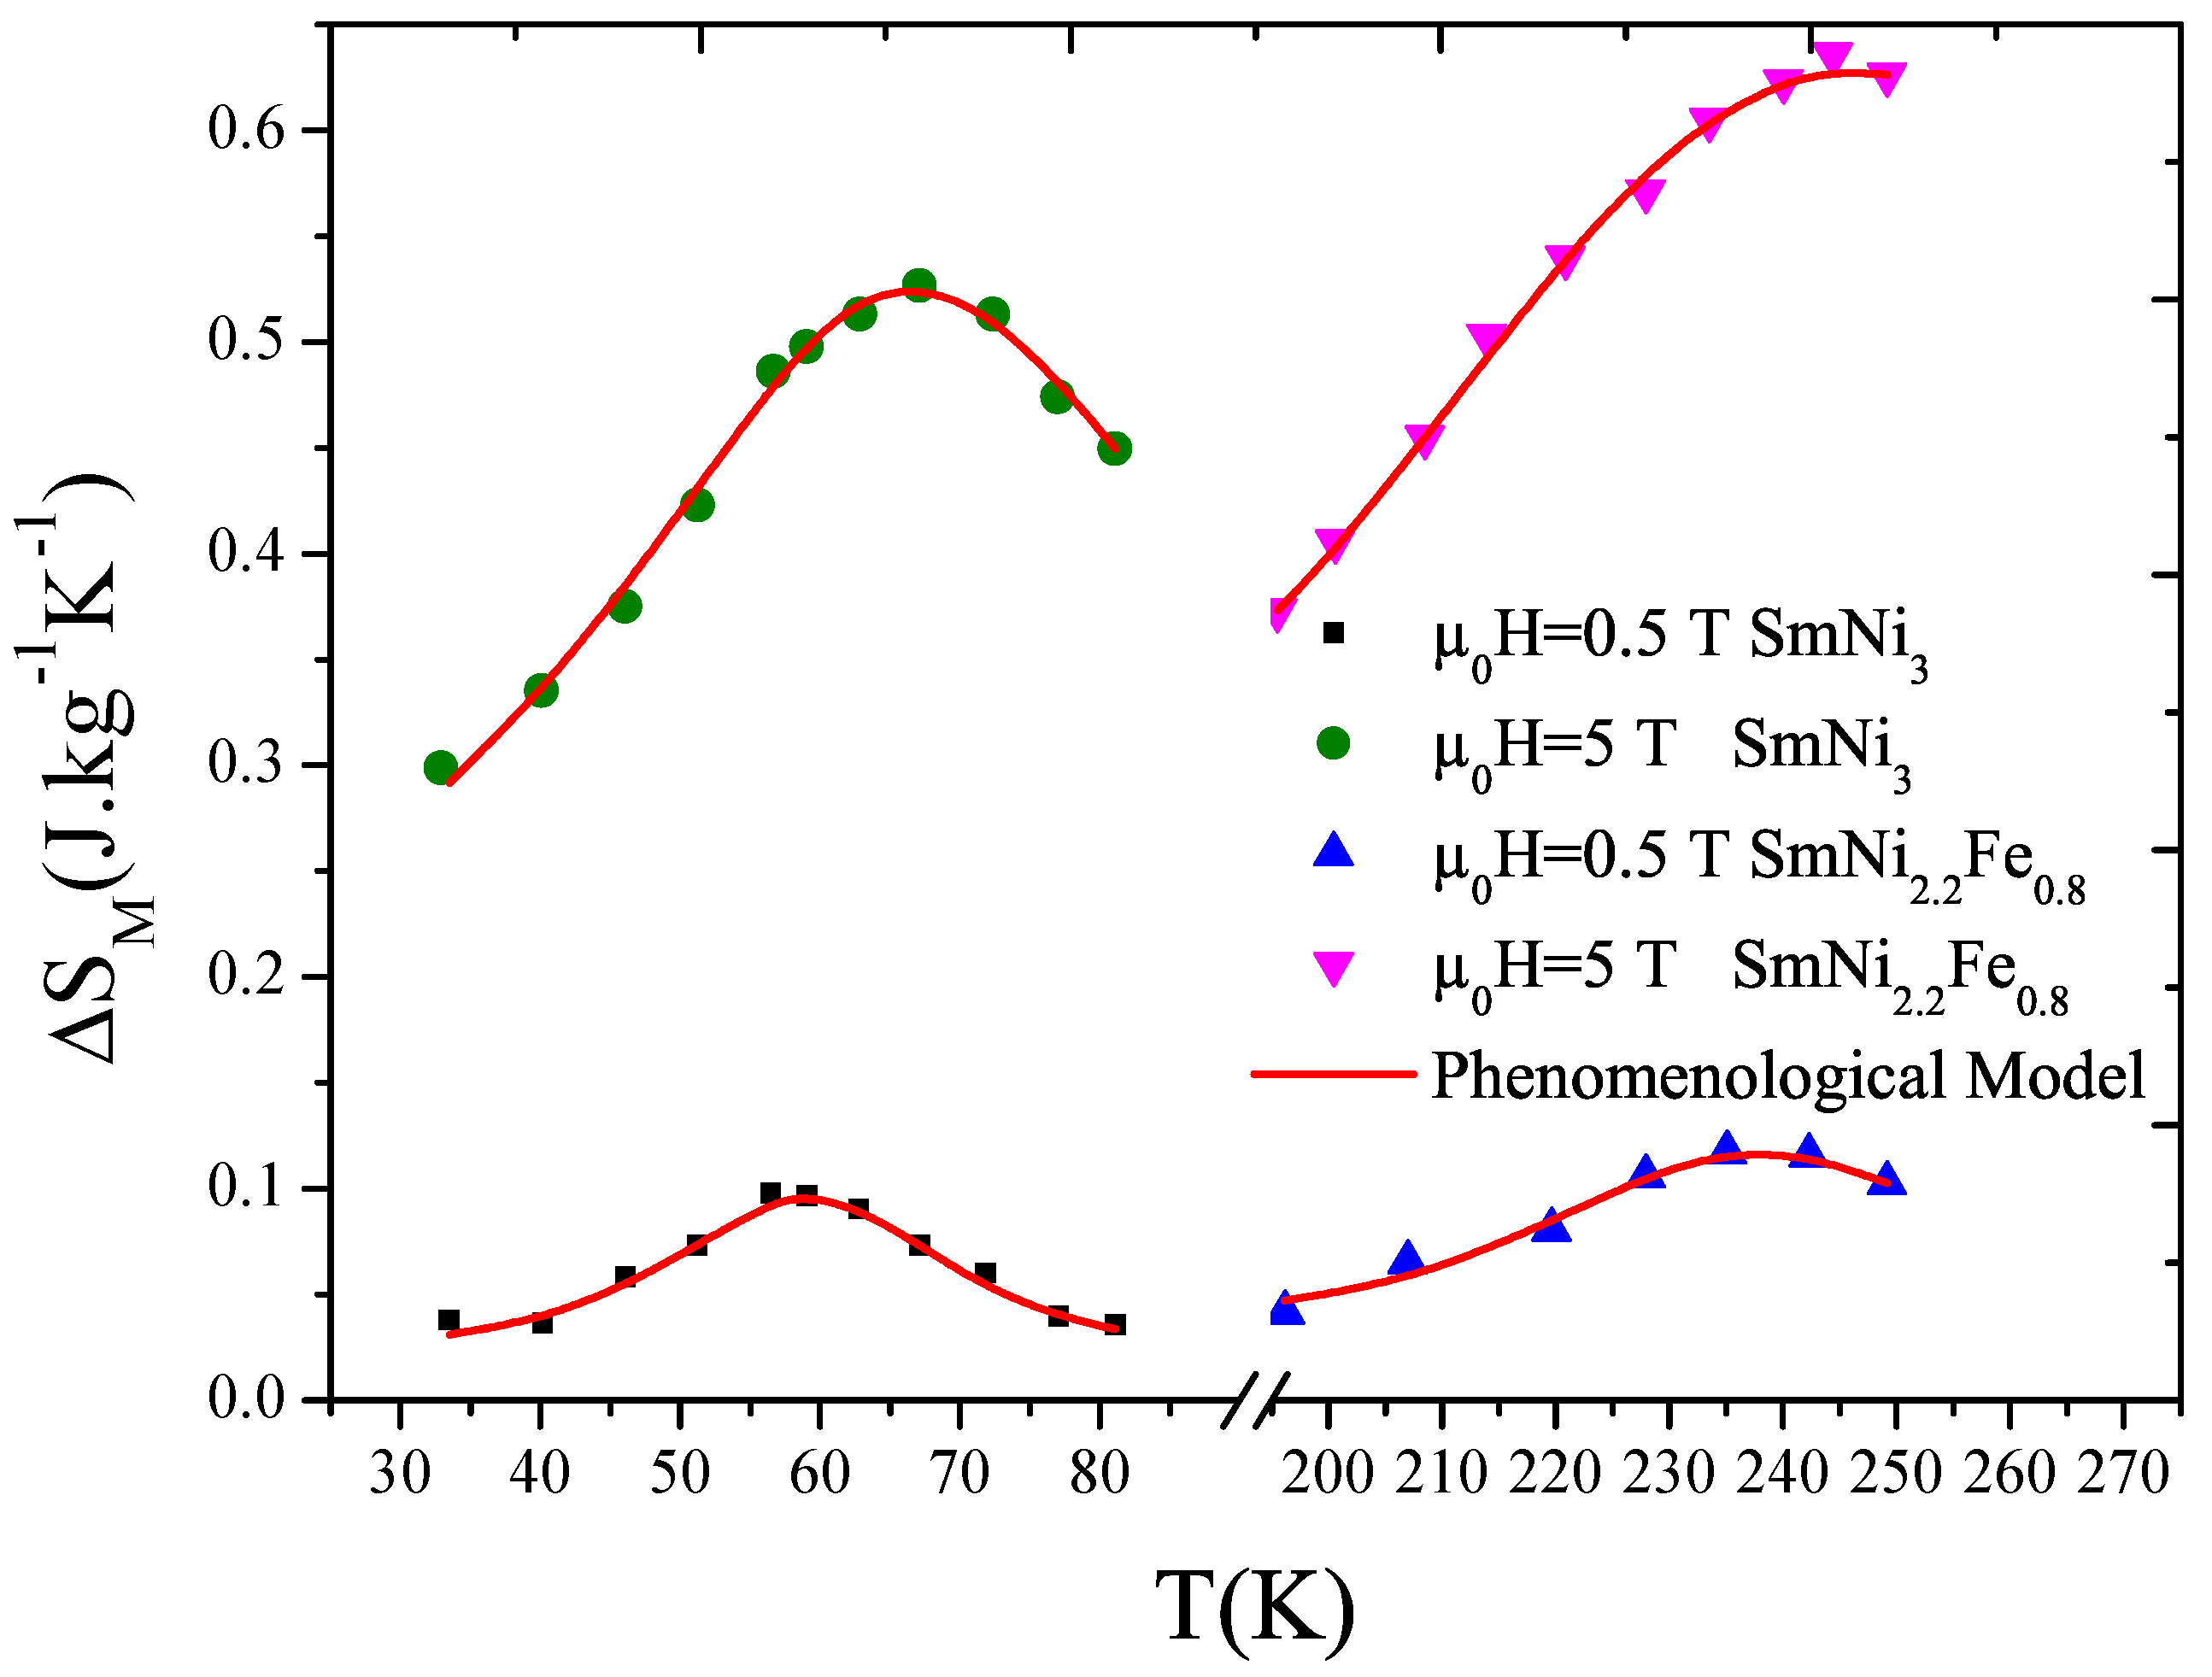
3.3. Magnetocaloric Effect

3.3.1. Phenomenological Model
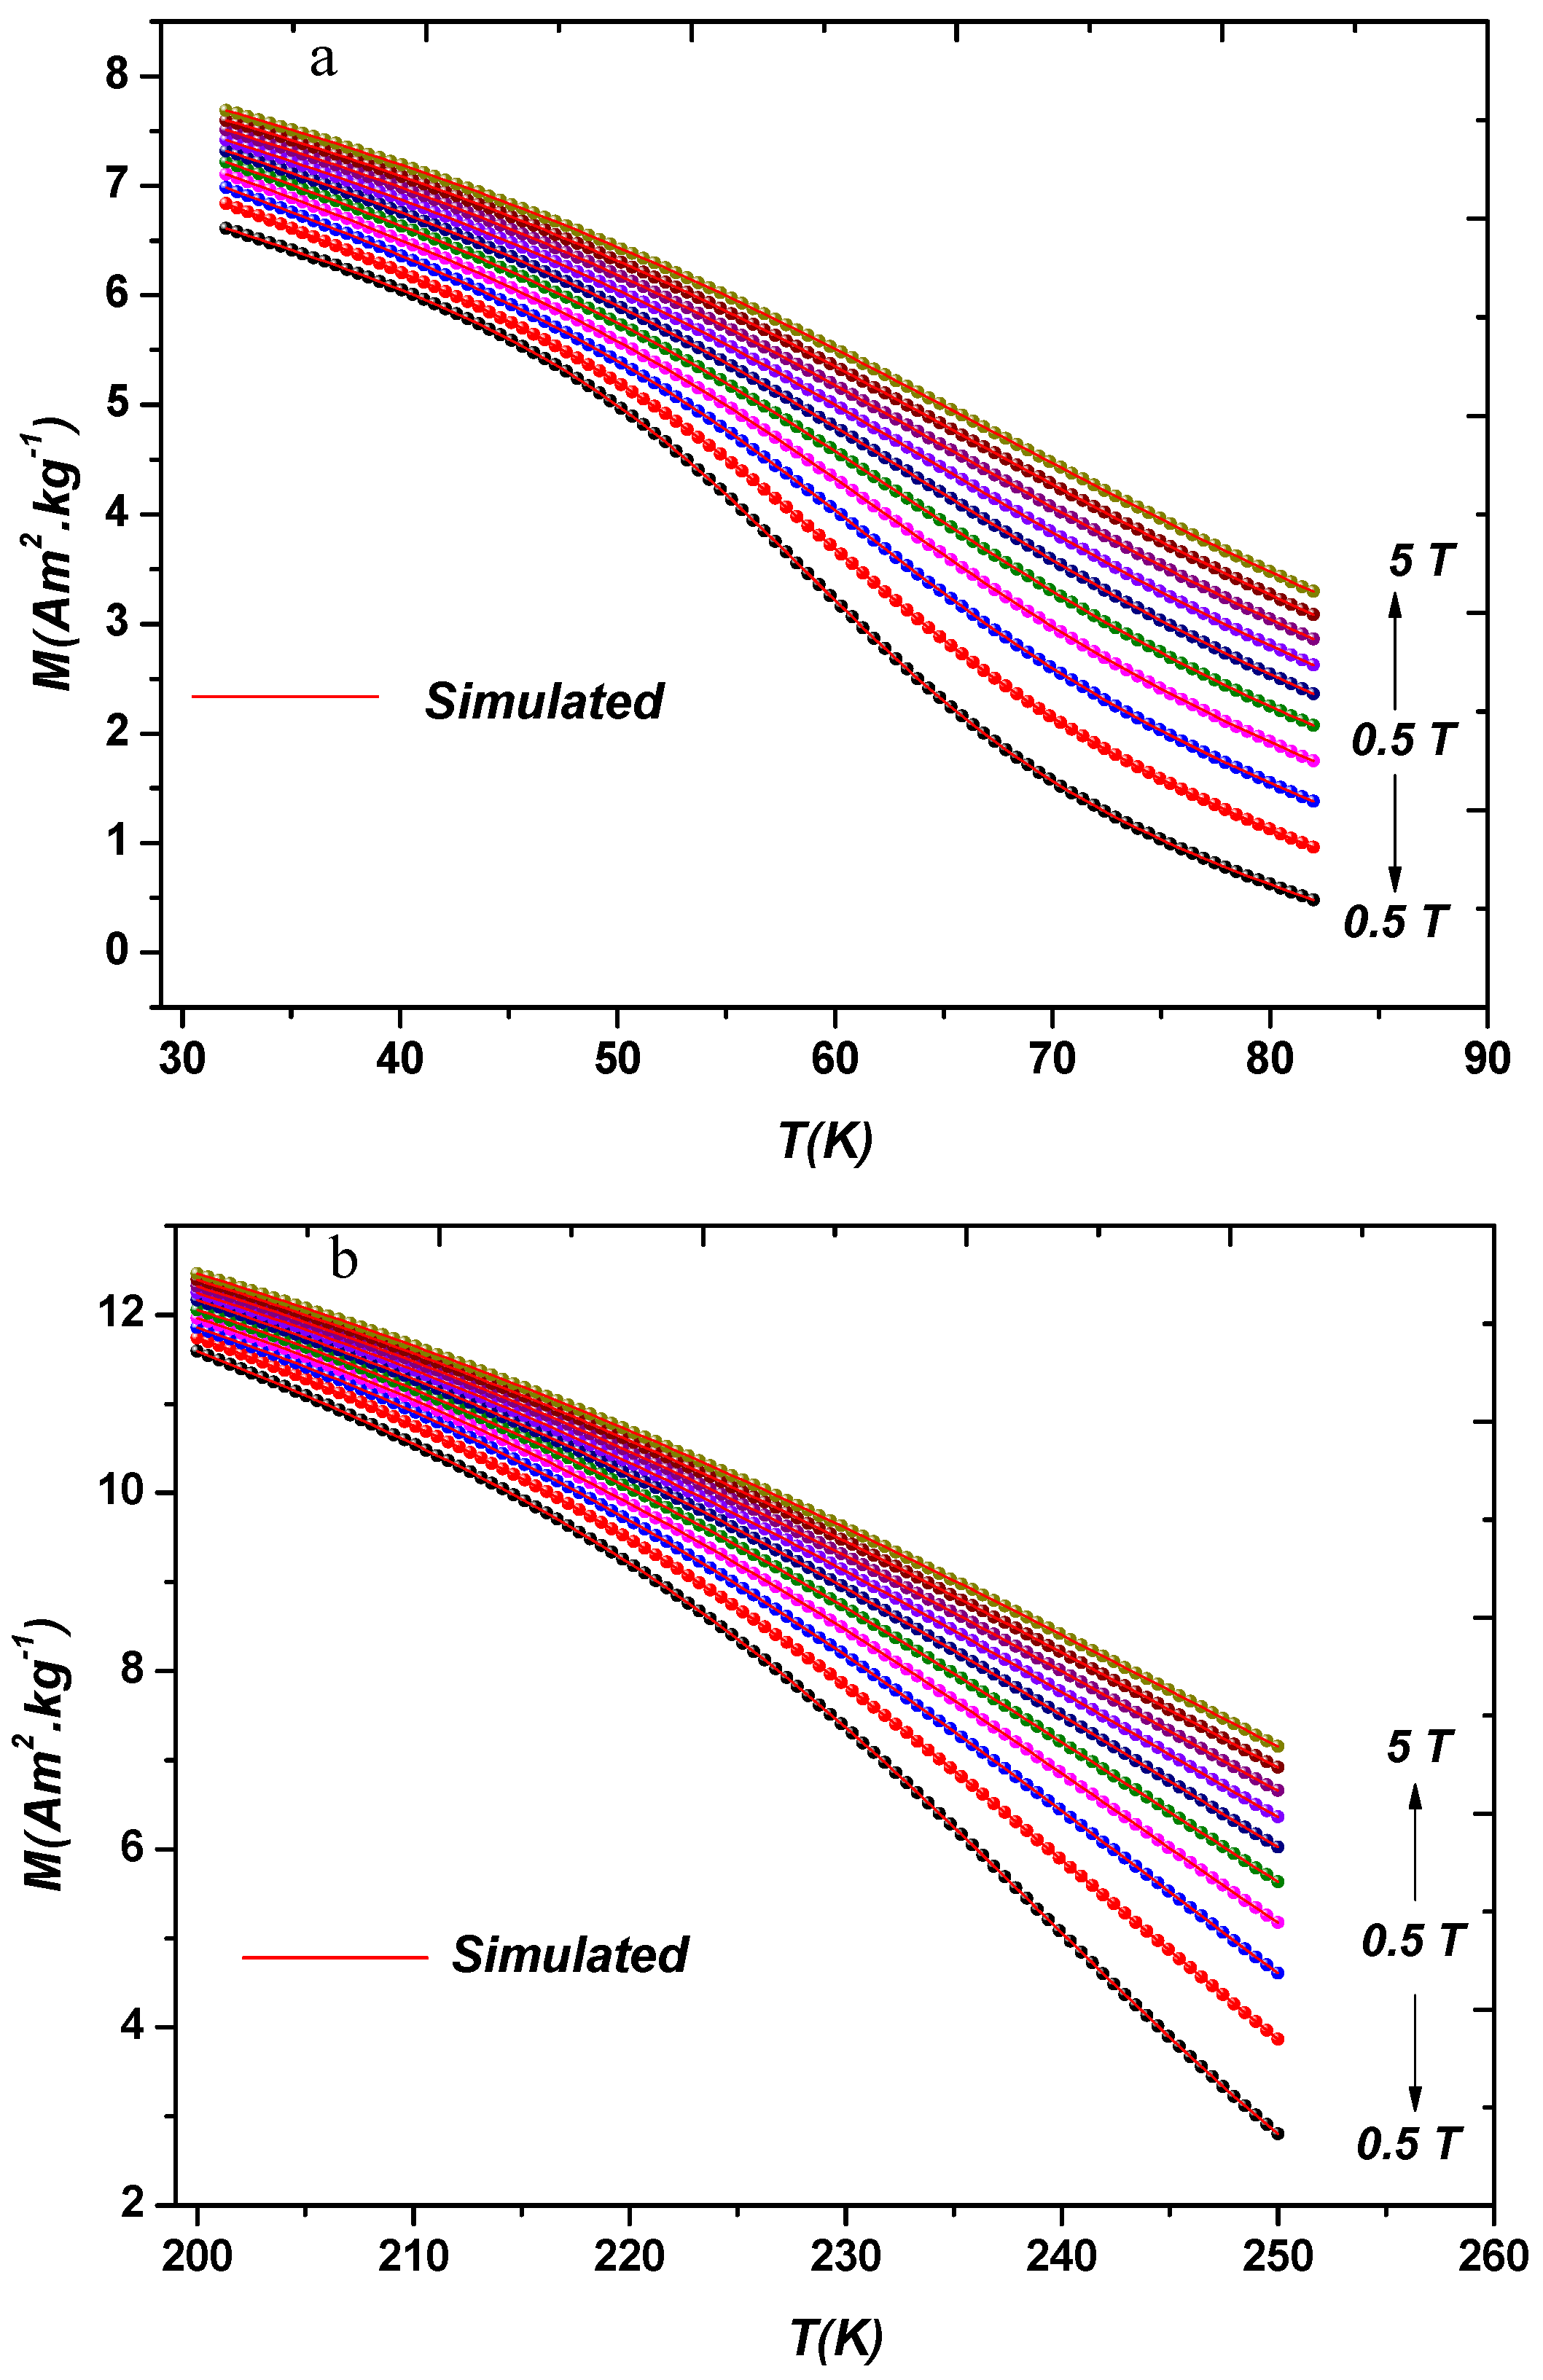
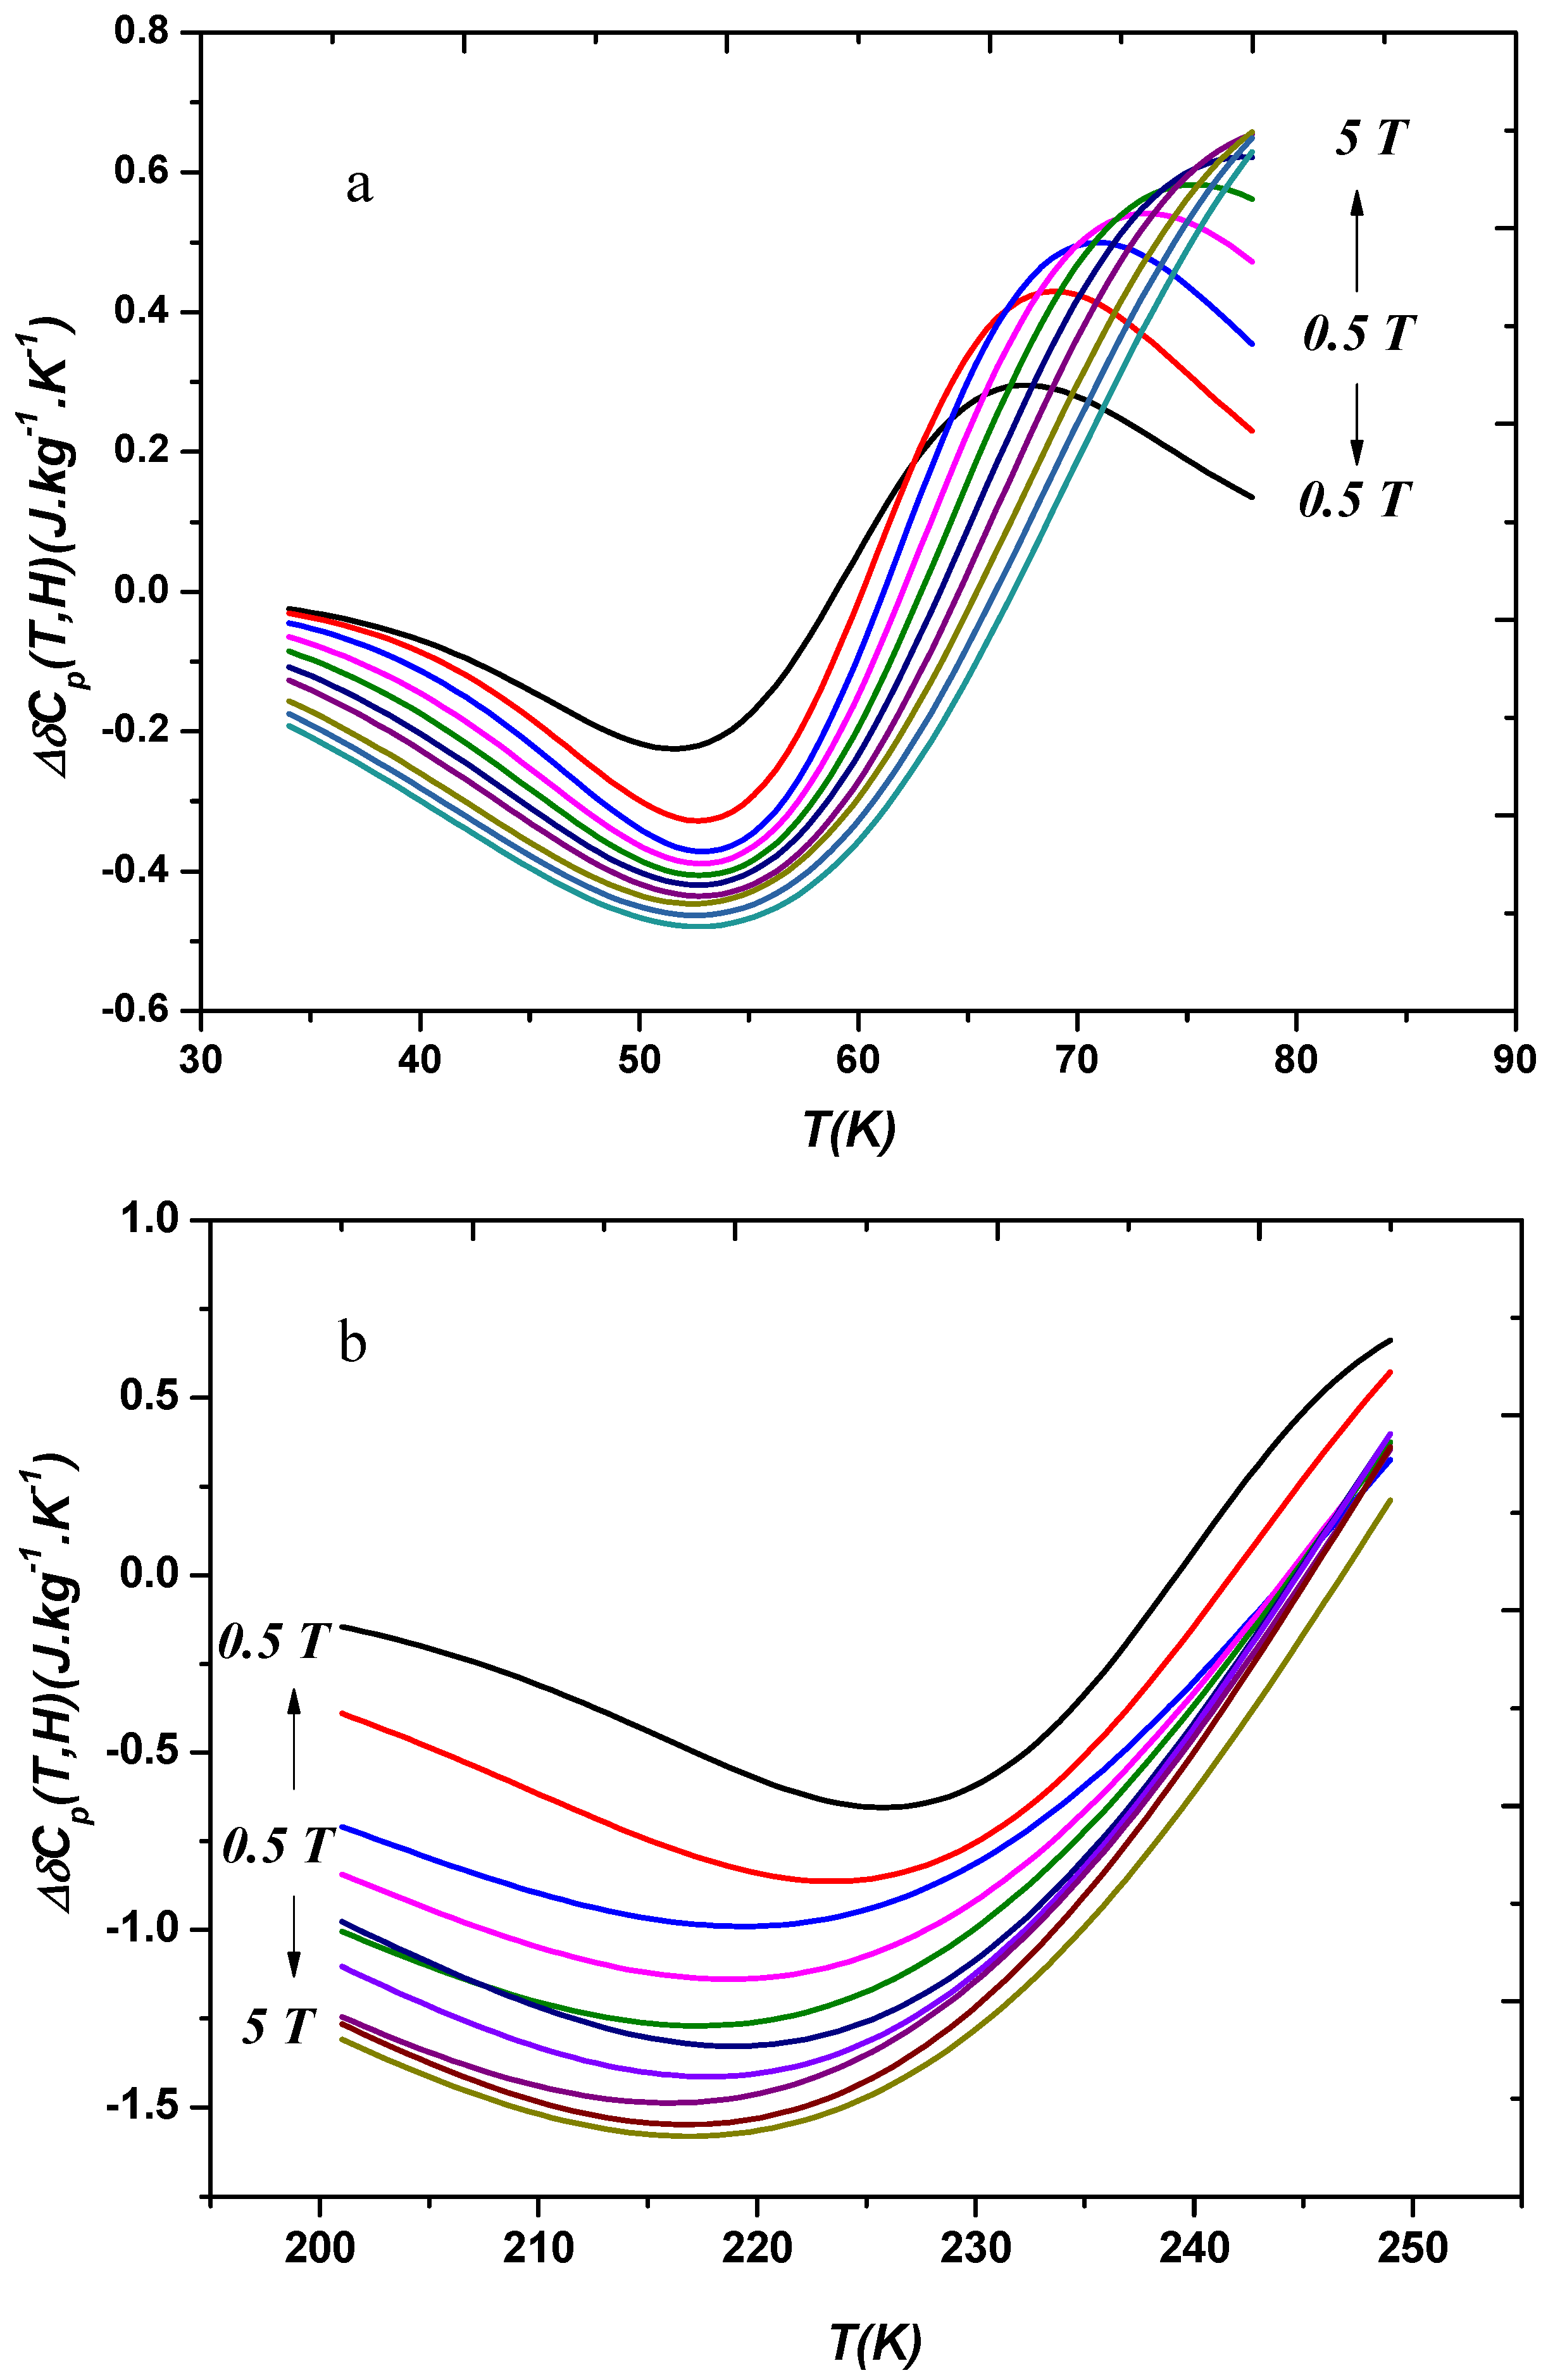
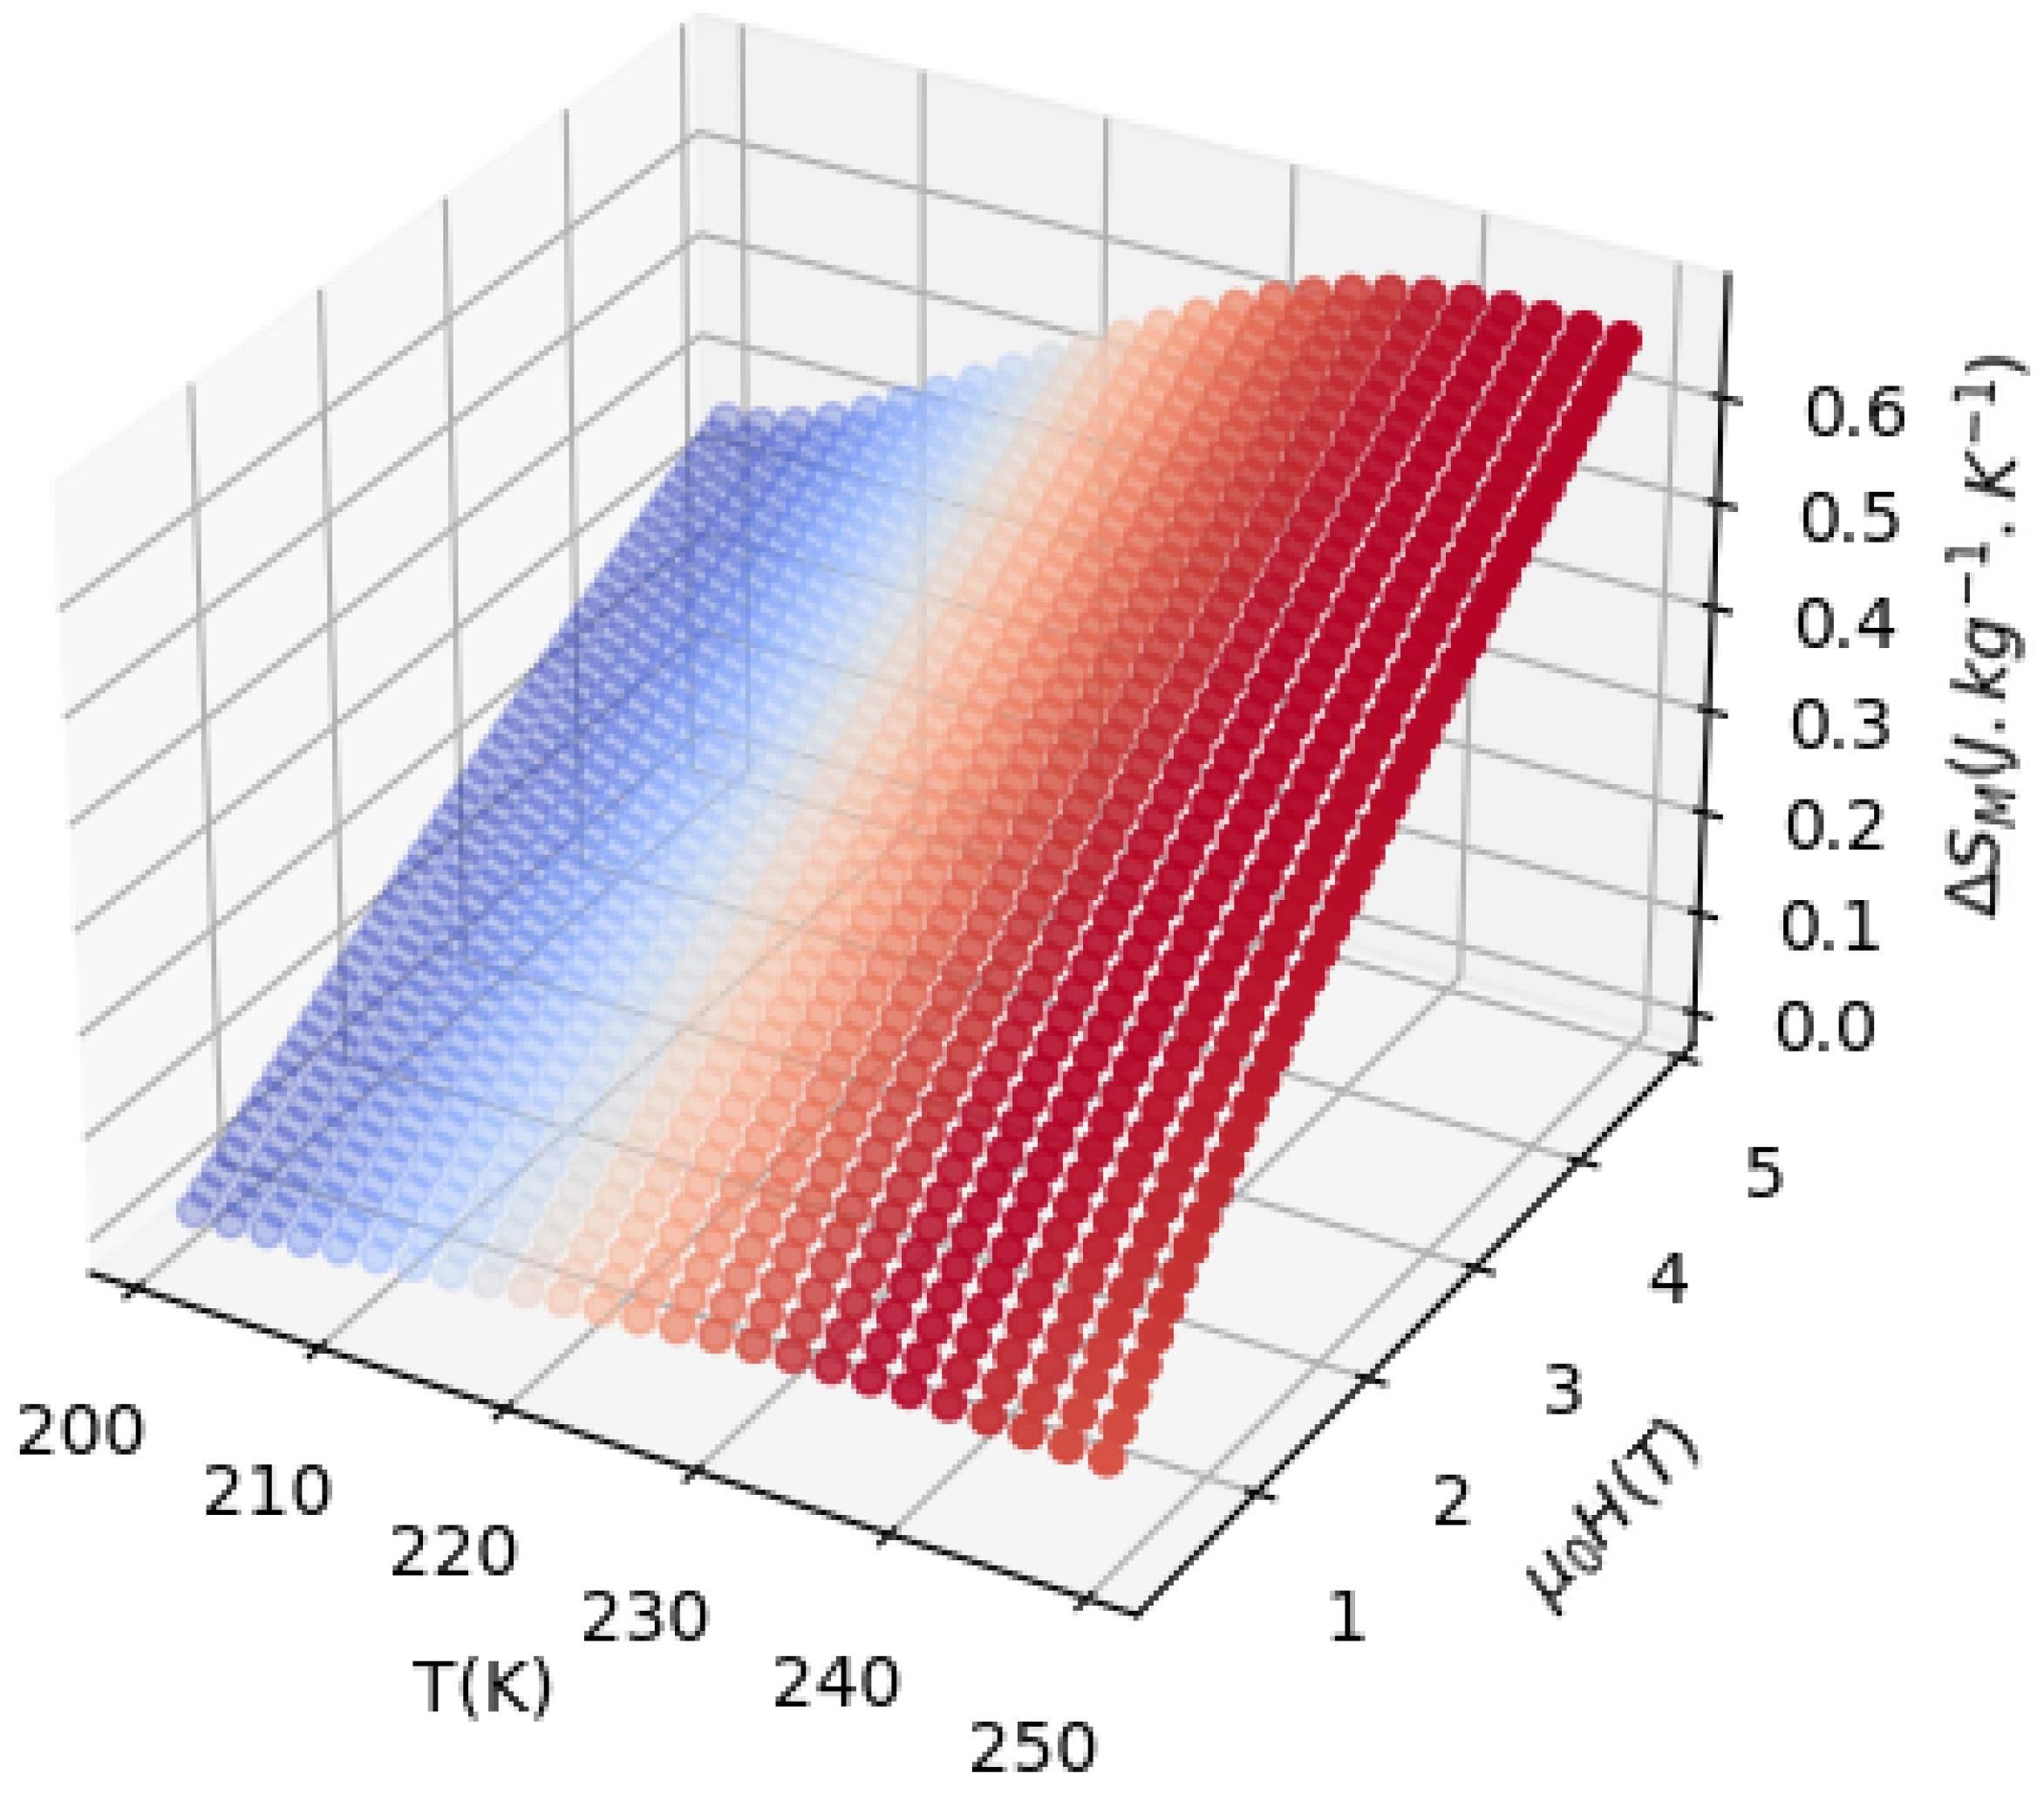
To determine the MCE in magnetic materials, SmNi 3 and SmNi 2.2 Fe 0.8 , a phenomenological model is used to simulate magnetization vs. temperature curve under the application of a magnetic field in adiabatic conditions with a reasonable fit with the experimental data; it was demonstrated by M-F theory of ferromagnetism that the dependence of magnetization on the variation of temperature and T C is presented by [33]:
M ( T ) = M S M E 2 tan h [ α ( T C T ) ] + T d M d T | T < T C + β
where M S is an initial magnetization value at the ferromagnetic–paramagnetic transition and M E is a final value of magnetization at the ferromagnetic–paramagnetic transition. The following two equations give α and β parameters:
α = 2 ( d M d T | T < T C d M d T | T C ) M S M E
β = M S + M E 2 d M d T | T < T C T C
where d M d T | T < T C represents the sensitivity of magnetization d M d T at ferromagnetic state, and d M d T | T C is magnetization sensitivity d M d T at T C . A magnetic entropy change Δ S M of a magnetic system under adiabatic magnetic field variation from 0 to final value Hmax is available by:
Δ S M = α H m a x M S M E 2 sec h 2 [ ( α ( T C T ) ) ] + ( d M d T | T < T C ) H m a x
Equation (2) shows that an observed relatively large Δ S M is a consequence of high magnetization at ferromagnetic state and rapid drop in magnetization at T = T C . Hence, the peak of the Δ S M ( Δ S M m a x ) can be calculated using Equation (2); for T = T C , Δ S M is equal to Δ S M m a x , so, it is expressed as follows:
Δ S M m a x = ( α ( M S M E ) 2 + ( d M d T | T < T C ) ) H m a x
In addition, the calculation of the half-value width of Δ S M , δ T F W H M can be performed as follows:
δ T F W H M = α 2 acsh [ ( 2 α ( M S M E ) 2 ( d M d T | T C ) + α ( M S M E ) ) 1 / 2 ]
The relative cooling power ( R C P ) is an essential parameter in the magnetocaloric application. It is related to the maximum entropy change and the full width at half-maximum in the temperature dependence of the Δ S M [34]. The following equation gives R C P :
R C P = Δ S M m a x δ T F W H M = ( α ( M S M E ) 2 + d M d T | T < T C ) × α 2 acsh [ ( 2 α ( M S M E ) 2 d M d T | T < T C + α ( M S M E ) ) 1 / 2 ] H m a x
The magnetization-related change of the specific heat is given by [21]:
Δ δ C p = T Δ S M δ T
According to this model, heat capacity change, Δ δ C p , can be expressed as
Δ δ C p = α 2 H m a x T M S M E 2 sec h 2 [ ( α ( T C T ) ) ] × tan h [ α ( T C T ) ]
From this phenomenological model, δ T F W H M , Δ S M m a x , R C P , and Δ T can be simply evaluated for SmNi 3 and SmNi 2.2 Fe 0.8 compounds under magnetic field variation.

3.3.2. Results

Figure 9 shows a good agreement between modeled and experimental magnetization variation with temperature for SmNi 3 and SmNi 2.2 Fe 0.8 . Symbols represent experimental data, and the red line corresponds to modeled magnetization.
Moreover, Figure 10 and Figure 11 show Δ S M and specific heat capacity variation with temperature, respectively. To calculate δ T F W H M , Δ S M m a x and R C P five parameters are determined from experimental variation of magnetization with temperature: M S , M E , T C , d M d T | T < T C , and d M d T | T C , as displayed in Table 1. Predicted values of maximum Δ S M , fullwidth at half-maximum, and R C P under 0.5 T for SmNi 3 and SmNi 2.2 Fe 0.8 are determined, as shown in Table 2. From Figure 10, we can easily see that the substitution of Ni atom by Fe causes an increase of Δ S M values from 0.5 J·(kg·K) 1 to 0.65 J·(kg·K) 1 for an applied magnetic field Δ μ 0 H = 5 T; this result is due to the increase of the magnetic sensitivity in the vicinity of T C and the increase of magnetization amplitude after the substitution of nickel atom by iron one, which for SmNi 3 d M d T | T C is −0.056 Am 2 ·(kg·K) 1 and for SmNi 2.2 Fe 0.8 is −0.080 Am 2 ·(kg·K) 1 .
For SmNi 3 and SmNi 2.2 Fe 0.8 , an increase of applied magnetic field change causes an increased magnetic entropies change; this is the consequence of an increase of magnetization change as a response to an increase of Δ μ 0 H . The R C P increases after the partial substitution of Ni with Fe; this result can be explained by the direct increase of δ T F W H M and Δ S M m a x .

3.3.3. Experimental Method

The change in magnetic entropy produced after the application of a magnetic field can be calculated by integrating the following Maxwell’s relation:
Δ S M = μ 0 0 H M T H d H
Here, M is the magnetization, T is the temperature, and H is the applied magnetic field. However, if discrete field changes measure the isothermal M ( H ) curves, the following expression can be used: [21]:
| Δ S M | = μ 0 i M i M i + 1 T i + 1 T i Δ H i
Here, M i and M i + 1 represent the initial magnetization at temperature T i and T i + 1 , respectively, when the magnetic field increases by Δ H i .
Figure 12 and Figure 13 illustrate the variation of the magnetic entropy around Curie temperature of SmNi 3 SmNi 2.2 Fe 0.8 , respectively, for external variation of the magnetic field between 0 and 5 T. The partial substitution of Ni with Fe increases the operating temperature that corresponds to the maximum of | Δ S M | , which is higher in SmNi 2.2 Fe 0.8 compared to the parent compound SmNi 3 . | Δ S M | increases slightly after the substitution of Ni with Fe, this is due to the increase of the amplitude and the variation of magnetization. On the other hand, it is easy to see that the full width at half-maximum of the magnetic entropy change of SmNi 2.2 Fe 0.8 is larger than SmNi 2.2 Fe 0.8 . The value of magnetic entropy change of these studied compounds is weak. Obviously, they are not suitable for the application; nevertheless, investigating them from a fundamental viewpoint is important.
Figure 14 shows a comparison between the magnetic entropy change determined with the phenomenological model and with Maxwell relation for two applied magnetic field values. One can see that the experimental and the simulated curve are in a good agreement. From this observation, we can conclude that the phenomenological model can be used to evaluate the magnetocaloric effect. The use of this model allows economizing time and cost of measurement since it is able to predict the Δ S M curve from the magnetization curve measured under a low and single value of a magnetic field.

4. Conclusions

A study of the structural, magnetic, and magnetocaloric properties has been carried out for the intermetallic compounds SmNi 3 x Fe x . X-ray diffraction at room temperature shows that this compound crystallizes in the structure of PuNi 3 type. A Rietveld refinement shows that the cell parameters increase when Fe replaces Ni. X-ray diffraction using oriented powder shows that the c-axis is the easy magnetization axis for these compounds. After substitution of Ni with Fe, the T C increases from 30 to 239 K. The reason for this increase in T C is due to the increase in the cell temperature, iron magnetic moment, and electronic effect. The phase transition study, according to the Landau model, proves that SmNi 2 x Fe x exhibits a second-order transition phase. The magnetization curves are successfully simulated. The magnetic entropy change, the maximums of magnetic entropy change, the width at half height of magnetic entropy change, and the relative cooling power are calculated, and the RCP of SmNi 2.2 Fe 0.8 is about 200% compared to the RCP value of SmNi 3 . The phenomenological model is in good agreement with the experimental method. The phenomenological model used in this study allows quick characterization of the magnetocaloric effect.

Author Contributions

H.J. and K.N.: Conceptualization, Writing—Original Draft, Writing—Review, Editing and Validation. L.B. and N.M.: Methodology, Writing—Review and Editing, Supervision, Project administration. M.J.: Investigation, Data Curation, Supervision. All authors have read and agreed to the published version of the manuscript.

Funding

This research received no external funding.

Institutional Review Board Statement

Not applicable.

Informed Consent Statement

Not applicable.

Data Availability Statement

Not applicable.

Acknowledgments

The researchers would like to thank the Deanship of Scientific Research, Qassim University for funding the publication of this project.

Conflicts of Interest

The authors declare no conflict of interest.

References

  1. Bessais, L.; Younsi, K.; Khazzan, S.; Mliki, N. X-ray and intrinsic magnetic properties of nanocrystalline Sm2 (Fe, M)17 (M = Si, Ga, Co, Cr, Zr or Mo). Intermetallics 2011, 19, 997–1004. [Google Scholar] [CrossRef]
  2. Dematteis, E.; Berti, N.; Cuevas, F.; Latroche, M.; Baricco, M. Hydrogen storage properties of Mn and Cu for Fe substitution in TiFe0.9 intermetallic compound. J. Alloys Compd. 2021, 851, 156075. [Google Scholar] [CrossRef]
  3. Iwase, K.; Mori, K. Crystal structure of intermetallic compound Y5Co19 and its hydride phases. Int. J. Hydrogen Energy 2021, 46, 9142–9150. [Google Scholar] [CrossRef]
  4. Ćwik, J.; Koshkid’ko, Y.; Nenkov, K.; Tereshina-Chitrova, E.; Kolchugina, N. Correlation between the structure and thermomagnetic properties of pseudo-binary (Tb, Er) Ni2 solid solutions. J. Alloys Compd. 2021, 859, 157870. [Google Scholar] [CrossRef]
  5. Grigoras, M.; Lostun, M.; Borza, F.; Porcescu, M.; Lupu, N. The effect of the Mo addition on the magnetic properties and phase constituents of the Ce-(FeCo)-B ribbons. Intermetallics 2022, 141, 107425. [Google Scholar] [CrossRef]
  6. Biswas, A.; Del Rose, T.; Mudryk, Y.; Ribeiro, P.; Alho, B.; de Sousa, V.; Nóbrega, E.; von Ranke, P.; Pecharsky, V. Hidden first-order phase transitions and large magnetocaloric effects in GdNi1−xCox. J. Alloys Compd. 2022, 897, 163186. [Google Scholar] [CrossRef]
  7. Zhang, Y.; Zhu, J.; Li, S.; Wang, J.; Ren, Z. Achievement of giant cryogenic refrigerant capacity in quinary rare-earths based high-entropy amorphous alloy. J Mater Sci Technol 2022, 102, 66–71. [Google Scholar] [CrossRef]
  8. Yao, K.; Xu, Y. Magnetic properties, magnetic transition and large magneto-caloric effect in the Ho0.2Er0.2Tm0.2Ni0.2Cu0.2 amorphous ribbon. Solid State Commun. 2022, 345, 114702. [Google Scholar] [CrossRef]
  9. Zhang, Y.; Zhu, J.; Li, S.; Wang, J.; Ren, Z. Magnetic properties and promising magnetocaloric performances in the antiferromagnetic GdFe2Si2 compound. Sci. China Mater 2022, 65, 1345–1352. [Google Scholar] [CrossRef]
  10. Li, L.; Yan, M. Recent progresses in exploring the rare earth based intermetallic compounds for cryogenic magnetic refrigeration. J. Alloys Compd 2020, 823, 153810. [Google Scholar] [CrossRef]
  11. Wang, Y.; Guo, D.; Wu, B.; Geng, S.; Zhang, Y. Magnetocaloric effect and refrigeration performance in RE60Co20Ni20 (RE = Ho and Er) amorphous ribbons. J. Magn. Magn. Mater. 2020, 498, 166179. [Google Scholar] [CrossRef]
  12. Jaballah, H.; Bouzidi, W.; Fersi, R.; Mliki, N.; Bessais, L. Structural, magnetic and magnetocaloric properties of (Pr, Sm)2Fe17 compound at room temperature. J. Phys. Chem. Solids 2021, 161, 110438. [Google Scholar] [CrossRef]
  13. Xu, P.; Ma, Z.; Wang, P.; Wang, H.; Li, L. Excellent cryogenic magnetocaloric performances in ferromagnetic Sr2GdNbO6 double perovskite compound. Mater. Today Phys. 2021, 20, 100470. [Google Scholar] [CrossRef]
  14. Li, L.; Xu, S.; Ye, S.; Li, Y.; Liu, G.; Huo, D.; Yan, M. Magnetic properties and excellent cryogenic magnetocaloric performances in B-site ordered RE2ZnMnO6 (RE = Gd, Dy and Ho) perovskites. Acta Mater. 2020, 194, 354–365. [Google Scholar] [CrossRef]
  15. Zhang, Y.; Wu, B.; Guo, D.; Wang, J.; Ren, Z. Magnetic properties and promising cryogenic magneto-caloric performances of Gd20Ho20Tm20Cu20Ni20 amorphous ribbons. Chin. Phys. B 2021, 30, 017501. [Google Scholar] [CrossRef]
  16. Zarkevich, N.; Zverev, V. Viable materials with a giant magnetocaloric effect. Crystals 2020, 10, 815. [Google Scholar] [CrossRef]
  17. Tishin, A.; Spichkin, Y. The Magnetocaloric Effect and Its Applications; CRC Press: Boca Raton, FL, USA, 2016; Volume 12. [Google Scholar]
  18. Jaballah, H.; Nouri, K.; Mliki, N.; Bessais, L.; Jemmali, M. Universality class change from Mean-Field to 3D-Heisenberg in magnetocaloric compounds SmNi3−xFex. Chem. Phys. Lett. 2021, 787, 139260. [Google Scholar] [CrossRef]
  19. Fan, J.; Huang, C.; Liu, H.; Yang, Y.E.; Llamazares, J.; Valdés, C.; Gorria, P.; Ma, C.; Zhu, Y.; Yang, H. Critical behavior in hexagonal Y2 Fe17: Magnetic interaction crossover from 3D to 2D Ising model. CrystEngComm 2021, 23, 3411–3418. [Google Scholar] [CrossRef]
  20. Nouri, K.; Jemmali, M.; Walha, S.; Zehani, K.; Bessais, L.; Salah, A.B. The isothermal section phase diagram of the Sm-Fe-Ni ternary system at 800 °C. J. Alloys Compd. 2016, 661, 508–515. [Google Scholar] [CrossRef]
  21. Földeàki, M.; Chahine, R.; Bose, T.K. Magnetic measurements: A powerful tool in magnetic refrigerator design. J. Appl. Phys. 1995, 77, 3528–3537. [Google Scholar] [CrossRef]
  22. Bessais, L.; Dorolti, E.; Djega-Mariadassou, C. High coercivity in nanocrystalline carbides Sm (Fe, Ga)9C. Appl. Phys. Lett. 2005, 87, 192503. [Google Scholar] [CrossRef]
  23. Khazzan, S.; Mliki, N.; Bessais, L.; Djega-Mariadassou, C. Rare-earth iron-based intermetallic compounds and their carbides: Structure and magnetic behaviors. J. Magn. Magn. Mater. 2010, 322, 224–229. [Google Scholar] [CrossRef]
  24. Bensalem, R.; Tebib, W.; Alleg, S.; Sunol, J.J.; Bessais, L.; Greneche, J.M. Magnetic properties of nanostructured Fe92P8 powder mixture. J. Alloys Compd. 2009, 471, 24–27. [Google Scholar] [CrossRef]
  25. Hamrita, A.; Slimani, Y.; Salem, M.K.B.; Hannachi, E.; Bessais, L.; Azzouz, F.B.; Salem, M.B. Superconducting properties of polycrystalline YBa2Cu3O7−d prepared by sintering of ball-milled precursor powde. Ceram. Int. 2014, 40, 1461–1470. [Google Scholar] [CrossRef]
  26. Rietveld, H. Line profiles of neutron powder-diffraction peaks for structure refinement. Acta Crystallogr. 1967, 22, 151. [Google Scholar] [CrossRef]
  27. Rietveld, H. A profile refinement method for nuclear and magnetic structures. J. Appl. Crystallogr. 1969, 2, 65. [Google Scholar] [CrossRef]
  28. Rodriguez-Carvajal, J. Recent advances in magnetic structure determination by neutron powder diffraction. Physica B 1993, 192, 55. [Google Scholar] [CrossRef]
  29. Rodriguez-Carvajal, J.; Fernandez-Diaz, M.T.; Martinez, J.L. Neutron diffraction study on structural and magnetic properties of La2NiO4. J. Phys. Condens. Matter 1991, 3, 3215. [Google Scholar] [CrossRef]
  30. Pramanik, A.K.; Banerjee, A. Phase separation and the effect of quenched disorder in Pr0.5Sr0.5MnO3. J. Phys Condens. Matter 2008, 20, 275207. [Google Scholar] [CrossRef] [Green Version]
  31. Li, Z.W.; Morrish, X.A.H. Negative exchange interactions and Curie temperatures for Sm2 Fe17 sand Sm2 Fe 17 Ny. Phys. Rev. B 1997, 55, 3670–3676. [Google Scholar] [CrossRef]
  32. Kuchin, A.G.; Platonov, S.P.; Lukoyanov, A.V.; Volegov, A.S.; Gaviko, V.S.; Mukhachev, R.D.; Yakovleva, M.Y. Remarkable increase of Curie temperature in doped GdFeSi compound. Intermetallics 2021, 133, 107183. [Google Scholar] [CrossRef]
  33. Hamad, M.A. Theoretical work on magnetocaloric effect in La0.75Ca0.25MnO3. J. Adv. Ceram. 2012, 1, 290–295. [Google Scholar] [CrossRef] [Green Version]
  34. Fujieda, S.; Fujita, A.; Fukamichi, K. Reduction of hysteresis loss in itinerant-electron metamagnetic transition by partial substitution of Pr for La in La (FexSi1−x)13. J. Magn. Magn. Mater. 2007, 310, e1004–e1005. [Google Scholar] [CrossRef]
Figure 1. The Rietveld refinement pattern of SmNi 3 compound XRD. The red and black lines present, respectively, the calculated intensities and the experimental intensities. The green vertical bars correspond to ( h k l ) line positions (positions of Bragg peaks). The blue line shows the difference between the calculated and experimental intensities.
Crystals 12 00481 g001
Figure 2. Cell parameter a(Å) (black y-axis), c ( Å) (red y-axis), c / a (green y-axis), and V 3 ) (blue y-axis) of SmNi 3 x Fe x plotted against iron content.
Crystals 12 00481 g002
Figure 3. X-ray diffraction of free and oriented powder for SmNi 2.2 Fe 0.8 compound.
Crystals 12 00481 g003
Figure 4. Magnetization plotted against temperature for SmNi 3 (red y-axis) and SmNi 2.2 Fe 0.8 (blue y-axis).
Crystals 12 00481 g004
Figure 5. Magnetization vs. temperature for SmNi 3 under several magnetic fields.
Crystals 12 00481 g005
Figure 6. Magnetization vs. temperature for and SmNi 2.2 Fe 0.8 under several magnetic fields.
Crystals 12 00481 g006
Figure 7. Landau parameter A ( T 2 k g / J ) (black y-axis), B ( T 4 k g 3 / J 3 ) (red y-axis), and C ( T 6 k g 5 / J 5 ) (blue y-axis) plotted against temperature around the T C for SmNi 3 sample.
Crystals 12 00481 g007
Figure 8. Landau parameter A ( T 2 k g / J ) (black y-axis), B ( T 4 k g 3 / J 3 ) (red y-axis), and C ( T 6 k g 5 / J 5 ) (blue y-axis) plotted against temperature around the T C for SmNi 2.2 Fe 0.8 sample.
Crystals 12 00481 g008
Figure 9. Magnetization vs. temperature for SmNi 3 (a) and SmNi 2.2 Fe 0.8 (b) under several magnetic fields.
Crystals 12 00481 g009
Figure 10. Modeled Δ S M vs. temperature for the samples SmNi 3 (a) and SmNi 2.2 Fe 0.8 (b) at several magnetic fields.
Crystals 12 00481 g010
Figure 11. Change of the specific heat for SmNi 3 (a) and SmNi 2.2 Fe 0.8 (b) under several magnetic fields vs. temperature.
Crystals 12 00481 g011
Figure 12. Magnetic entropy change vs. temperature for SmNi 3 under several magnetic fields.
Crystals 12 00481 g012
Figure 13. Magnetic entropy change vs. temperature for and SmNi 2.2 Fe 0.8 under several magnetic fields.
Crystals 12 00481 g013
Figure 14. Comparison between theoretical and experimental magnetic entropy change plotted against temperature for SmNi 2.2 Fe 0.8 and SmNi 3 under 0.5 and 5 T.
Crystals 12 00481 g014
Table 1. Values of M S (Am 2 ·kg 1 ) , M E (Am 2 ·kg 1 ) , T C (K), d M d T | T < T C (Am 2 ·(kg·K) 1 ) , and d M d T | T C (Am 2 ·(kg·K) 1 ) determined from experimental magnetization vs. temperature are given for SmNi 3 and SmNi 2.2 Fe 0.8 at low field μ 0 H = 0.5 T.
Magnetocaloric SampleM S M E T C d M d T | T < T C d M d T | T C
SmNi 3 5.141.6960−0.06−0.2
SmNi 2.2 Fe 0.8 8.591.90239−0.08−0.24
Table 2. Δ S M m a x , δ T F W H M , R C P and (minimum-maximum) of specific heat capacity for SmNi 3 and SmNi 2.2 Fe 0.8 at low field μ 0 H = 0.5 T.
Magnetocaloric Sample Δ S M max J·(kg·K) 1 δ T FWHM K RCP J·kg 1 Δ C p , H J·(kg·K) 1
SmNi 3 0.1313.1−0.23–0.3
SmNi 2.2 Fe 0.8 0.12506−0.66–0.71
Publisher’s Note: MDPI stays neutral with regard to jurisdictional claims in published maps and institutional affiliations.

