1. Introduction
Carbon steel remains one of the most important engineering and construction materials in today’s world. Structural applications require high-strength steel grades to meet toughness and formability, such as in cables for suspension bridges, steel cords for tire reinforcement, and engineering springs for railways. These materials are commonly composed of a pearlitic microstructure characterized by alternated layers of α-iron ferrite (α-Fe) and cementite (Fe3C). The wire drawing, in combination with suitable heat treatments, allows to obtain long products with a wide range of mechanical properties, excellent dimensional control and surface finish in a continuous forming process. Pearlitic steels subjected to severe plastic deformation exhibit strength values that can reach an exceptionally high strength of almost 7 GPa with the formation of nanoscale structures, being one of the strongest structural bulk alloys currently available.
Recently, with the increasing quality requirements and in-service reliability, advances in the non-destructive evaluation have allow in situ characterization of steels through methods that rely on electromagnetic induction. It is well known that the microstructure has a strong influence on its electrical and magnetic behavior of a ferromagnetic material. Pearlite volume fraction and interlamellar spacing has been found to influence the magnetic and mechanical hardness of carbon steels [
1,
2,
3,
4,
5,
6], as well as the degree of spheroidization of pearlite [
7,
8,
9]. In addition, great correlations have been observed between the yield and ultimate tensile strength and the output signals from electromagnetic testing [
10,
11,
12,
13], also demonstrating their accurate capability for mechanical properties prediction of this type of material.
Despite the numerous works on this field, the fundamentals evidence that allow relating microstructural variations of carbon steels to their electromagnetic behavior are rarely mentioned, especially when it comes to pearlitic steels. Clapham et al. [
14] and Thompson and Tanner [
15] have reported the effect of pearlite content on the magnetic behavior of carbon steels regarding the domain wall pinning behavior, which may be strongly pinned at cementite lamellae. By using Lorentz electron microscopy, the latter revealed that domain wall motion depends on the domain wall orientation with respect to the lamellae. Batista et al. [
16,
17,
18] have studied the domain structure behavior in spheroidite structures with globular cementite in a ferrite matrix by magnetic force microscopy. Domain walls were observed to anchor at precipitates during magnetization processes and bend between two cementite particles before overcoming the pinning sites at higher fields, which generates a Barkhausen jump. Moreover, they have also found that cementite has its own domain structure, whose configuration was observed to be influenced by their size, shape, and crystallographic orientation [
18]. By saturation magnetization and coercivity measurements, Wurster et al. [
19] described the magnetic softening of severely drawn pearlitic wires, which behave similarly to pure iron with cementite being dissolved. The influence of heat treatment and deformation processes on the electrical conductivity has been largely studied for electrical steels, copper wires, and other metals [
20,
21]. Nevertheless, the works are scarcer concerning the electrical properties evolution of non-alloyed steels, among them the study of Klein et al. [
22] on the influence of diffusion processes on the thermal and electrical conductivity of heat-treated carbon steels.
Considering the context and the issues hitherto introduced, this work seeks broader investigate the interactions between microstructural characteristics and conductivity and magnetism phenomena of carbon steels and particularly of pearlitic steels, expanding the knowledge necessary to enlarge the potential of non-destructive testing for quality assurance applications. A certain number of microstructural parameters have been identified based on the literature review, and a precise study program was defined for investigating the fundamental effects of crystal structure, phase composition and morphology on physical properties of carbon steel wires.
2. Materials and Methods
The samples examined in this study were obtained from AISI 1000 series plain carbon steel wire rods, with carbon content varying from 0.03 to 0.78 wt. % C, the chemical compositions of which are given in
Table 1.
For investigating the effect of microstructural characteristics, notably, the influence of carbon content and of phase morphology on the electrical and magnetic properties of carbon steel wires, cold-drawn wires were submitted to different thermal treatments, according to each microstructural aspect to be studied. The obtained materials are classified in groups A, B, and C, as described below:
Group A: carbon steel wires with varying fractions of proeutectoid ferrite and pearlite, produced with different batches of steels containing from 0.03 to 0.78 wt. % C that were austenitized in an electric-powered furnace at 950 °C in an inert atmosphere for 85 s and cooled in a molten lead bath at a constant temperature of 580 °C for 35 s before final cooling at room temperature;
Group B: pearlitic steel wires with different interlamellar spacing, produced from 0.78 wt. % C steels that were austenitized at 950 °C for about 85 s, then cooling in a molten lead bath at constant transformation temperatures of 540, 560, 580, 600, 620, and 640 °C for 35 s, followed by cooling at room temperature;
Group C: eutectoid steel wires with different types of microstructure features, produced from 0.78 wt. % C steels. Fine and coarse lamellar pearlite by austenitization at 950 °C and cooling at 540 and 640 °C; spheroidite microstructures by annealing the pearlitic samples at a relatively high temperature of 700 °C in an inert-atmosphere furnace for different soaking times of 8, 24, and 72 h, and cooled in air; martensite by austenitization in an oven at 950 °C for 85 s and subsequent quench in a water bath at 25 °C; and, finally, tempered martensite by high temperature tempering of the martensitic samples in a molten lead bath at 580 °C for 35 s. The samples were air-cooled after the transformation end.
The main microstructural aspects of the steel wires were evaluated by metallographic analysis using optical (Zeiss Axioplan 2) and field-emission scanning electron (FE-SEM, JEOL JSM-7200F) microscopes. Average prior-austenite grain sizes (PAGS) were calculated from quenched samples of each steel grade using the intercept method (ASTM E112), and phase volume fractions of the heat-treated samples hereto described were estimated by phase-contrast image analysis from optical micrographs. The evaluation of the mean values of true interlamellar spacing of pearlite (ILS) was carried out from FE-SEM observations according to Underwood’s method, and precipitate sizes of spheroidite determined by the interception procedure. The mechanical properties were measured via standard tensile tests (ASTM E8) using a Zwick Roell test machine, and Vickers microhardness measurements carried out on the cross-section of polished samples in Buehler and Zwick Roell ZHµ machines.
The effects of microstructure on the electrical responses of the various materials were investigated through resistivity measurements down to 2 K using the AC transport (ACT) option of the Physical Properties Measuring System (PPMS) from Quantum Design. The test leads for the four-probe setup were contacted by silver paste to rod-shaped specimens with 2 mm diameter and 1 cm length. The measuring current was 5 mA. Further resistivity measurements were performed in the specimens by the four-point probe method in a micro-ohmmeter, under a controlled temperature in a Binder stove at 35 °C. The current was set to 1 A. The resistivity values were calculated based on the measured resistance of each circuit and the specimen’s dimensions. Each sample was measured quasi-statically at a stabilized temperature, repeated numerous times to improve measurement accuracy.
The bulk macroscopic magnetic properties were characterized by magnetic hysteresis measurements using an experimental set-up built with an electromagnet connected to an alternating current voltage source. The rod-shaped samples of 4 mm in diameter and 2.5 cm in length were placed between the electromagnet poles. The close circuit was traversed by a constant current that magnetized the specimens along their axial direction under field strengths ranging from ±15 kA.m−1. The magnetic measurements were carried out at a low excitation frequency of 0.5 Hz to reduce energy losses due to the macroscopic eddy currents induced in the ferromagnetic materials. The induced magnetization was measured by the pick-up coil surrounding the samples. Four adjacent Hall probes were positioned at different positions perpendicular to the sample surface with a support stand for measuring the tangential field strength at different positions in the air. Based on the continuity principle of the tangential field at an interface, it was possible to estimate the local magnetic excitation at the surface of a material. Hence, the magnetic flux density was recorded as a function of the calculated excitation field at the surface of the tested specimens. The system was degaussed before and after testing by an alternating current with a decreasing amplitude in time to avoid possible remanent magnetization within the specimens or the electromagnet, which would disturb the experiment. The magnetic properties of the various materials were calculated from the obtained hysteresis loops.
In addition, magnetic force microscopy (MFM) was employed for the observation of magnetic domains in the bulk material. The measurements were carried out at room temperature using the Agilent 5500 Atomic Force Microscope equipped with a magnetic cobalt-chromium coated tip with a nominal coercivity of 32 kA.m−1 (medium). The imaging was performed on the cross sections of the 4 mm diameter samples. The samples for imaging were prepared by conventional metallographic techniques with a final preparation step using focused ion beam (FIB) milling to obtain a deformation-free surface layer. As the MFM signal contains information from both the surface topography and the magnetic state, two successive scans were performed to separate the magnetic state information. In the first scan, topography was measured in the tapping mode. Subsequently, the domain structures were imaged by mapping the magnetic forces resulting from interactions between the magnetic tip and the sample surface in the lift mode at 100 nm from the surface.
3. Results and Discussion
3.1. Effect of Carbon Content and Pearlite Interlamellar Spacing on the Electrical and Magnetic Behavior of Carbon Steel Wires
3.1.1. Microstructure and Mechanical Properties
Ultra-low carbon steel with 0.03 wt. %C was used to produce a fully ferritic microstructure with grains of about hundred microns. Hypoeutectoid steels with the composition ranging from 0.20 to 0.65 wt. %C presented ferrite-pearlite microstructures with pearlite fractions varying from 33.0 to 98.9%. Pearlite nodule sizes were observed to decrease with decreasing proeutectoid ferrite fraction. The eutectoid steel with 0.78 wt. %C exhibited a fully pearlitic microstructure. The main microstructural aspects evaluated by metallographic analysis are given in
Table 2.
The carbon content has a significant impact on the austenite grain size of the investigated samples; the prior-austenite grain size is found to decrease with increasing carbon content. Smaller PAGS contributes to faster kinetics for both proeutectoid ferrite and pearlite formation, as it promotes an increase in the austenite grain boundary area, increasing the nucleation sites. Such an increase in carbon amount produces a significant change in the volume fraction of pearlite. There is also a significant difference in the mean true interlamellar spacing among the samples, except for the medium-carbon samples. As previously mentioned, the samples were thermally treated on a fast-cooling cycle. Consequently, the ratio of proeutectoid ferrite to pearlite within hypoeutectoid steels is smaller than what would be obtained on an equilibrium transformation. The pearlite fraction increase cannot occur without a corresponding change in its composition (α + Fe
3C), usually 87.5% ferrite and 12.5% cementite. Hence, the α-phase amount in pearlite increases, which leads to a decrease in the carbon content [
23,
24], resulting in an increase in interlamellar spacing, even though transformation temperature was maintained the same.
Figure 1 shows the correlations between the main mechanical properties and the carbon concentration of the plain carbon steel samples of group A. As the pearlite volume fraction increases, the proportion of Fe
3C, which is a relatively hard phase, grows. In consequence, the strength and hardness of plain carbon steels raise accordingly. The elongation to fracture decreases linearly with increasing carbon concentration, indicating a decrease in ductility. Moreover, the PAGS and ILS refinements with carbon content also contribute to the increase in strength and ductility reduction in the steels.
As discussed, the increasing amount of carbon alters not only the PAGS and phase balance of plain carbon steels, but also the interlamellar spacing of pearlite. To study this parameter separately, fully pearlitic samples with different interlamellar spacing were produced constituting the group B.
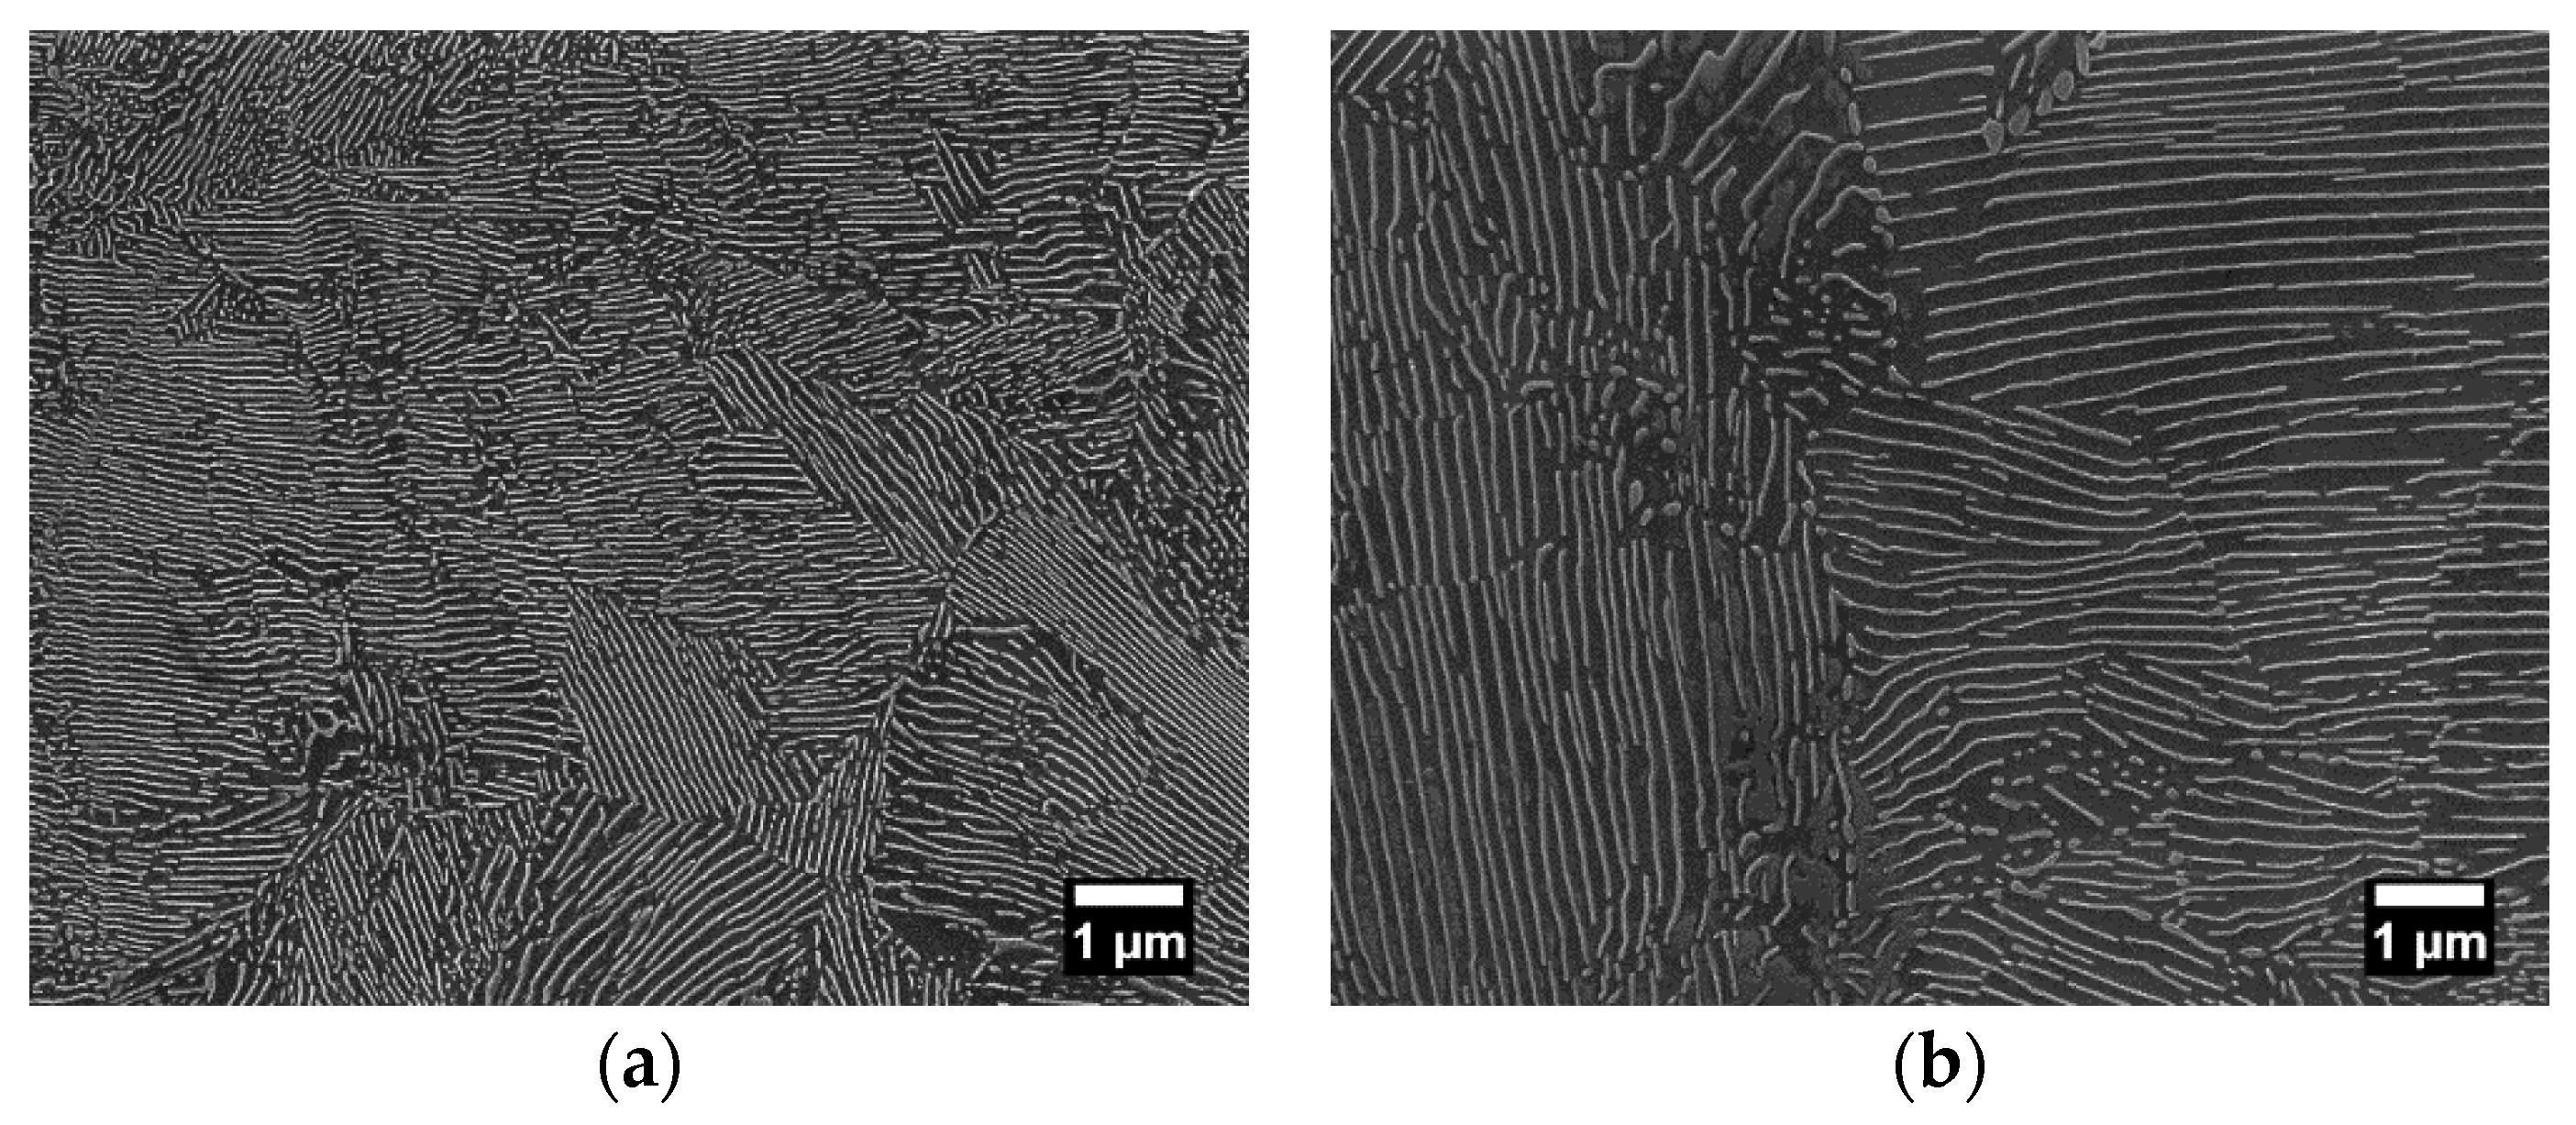
Figure 2 shows FE-SEM micrographs of the eutectoid steels with relatively fine and coarse pearlite microstructure.
Correlations between mechanical properties and the true interlamellar spacing means are shown in
Figure 3. As the spacing between the lamellae decreases, it restricts the mobility of dislocations, resulting in an increase in the yield and ultimate tensile strengths and Vickers hardness values. Additionally, the elongation to fracture decreases, indicating a ductility reduction.
3.1.2. Electrical Properties
The rod-shaped specimens were used to investigate the conductive behavior of proeutectoid ferrite-pearlite and fully pearlitic steels at temperatures ranging from 2 K up to 300 K. The results shown in
Figure 4 demonstrate a decrease in conductivity with increasing pearlite fraction and decreasing interlamellar spacing of pearlite.
At lower temperatures, the electron-phonon scattering is almost negligible, and the resistance is due to the presence of lattice defects and impurities within a material, leading to a residual resistivity that is independent of temperature. As observed, the residual resistivity of the ferrite-pearlite samples increases according to the increase in carbon content, mainly influenced by the increment of Fe
3C volume fraction with pearlite formation. The nucleation and growth of pearlite take place from the carbon redistribution from ferrite to cementite and the depletion of carbon in the ferrite matrix. Physical properties related to the electronic density of Fe
3C states have been discussed by Häglund et al. [
25], Chiou and Carter [
26], Faraoun et al. [
27], and Razumovskiy et al. [
28]. It was found that states near the Fermi level are dominated by iron d states, whereas the low-lying states are dominated by carbon s and p contributions. The absence of a band gap indicates the metallic nature of Fe
3C, comparable to pure iron and other iron carbides. The iron atoms are held together by a metallic bonding. However, the interaction between iron and the interstitial carbon atoms involves a charge transfer from Fe to C and the covalent character of the Fe–C bonding [
29,
30]. Gavriljuk et al. [
31,
32] studied the effect of interstitial atoms in iron-based solid solutions on their electron structure and properties. It was observed that interstitial carbon assists the localization of electrons at the atomic sites, which decreases the number of free s-electrons. Consequently, the electron state density at the Fermi level is reduced, and thereby, the concentration of conducting electrons in the iron lattice. This contributes to the covalent component of the interatomic bonds of Fe–C. Hence, the increase in carbon content and the subsequent formation of Fe
3C decrease the electrical conductivity of the steels. Besides the phase composition, the effect of the morphologic distribution and dimension of each phase is significant, as reported by Hasselman and Johnson [
33] and Chen and Chen [
34]. Indeed, pearlite microstructure can be compared to a metal matrix composite with a lamellar structure. The cementite layers represent effective interfacial barriers for electron and thermal conduction. As the spacing between Fe
3C lamellae decreases, the number of α-Fe
3C interfaces increases, and so, the interfacial barrier resistance. It explains the higher resistivity values of the fine lamellar pearlite compared to the coarser microstructure. Additionally, the slightly lower residual resistivity of 1035 steel in comparison with 1020 steel at the lowest temperatures might be explained by the concurrent influence of increasing pearlite volume fraction and decreasing spacing of Fe
3C lamellae.
In addition to scattering on impurities, the electron mobility is also affected by scattering on phonons, which increases with increasing lattice vibrations at rising temperatures. At finite temperatures, lattice vibrations introduce distortions to the crystal and the scattering of electrons by phonons lead to a temperature dependent resistivity component. In accordance with this scenario, the resistivity of carbon steels increases exponentially with temperature. To expand the understanding of the influence of the microstructure on the electrical properties of carbon steels, additional resistivity measurements were carried out using a four-point probe at a controlled temperature of 35 °C, corresponding to samples of groups A and B. The measurements presented in
Table 3 confirmed the results discussed previously.
Figure 5 shows the evolution of the mean resistivity values with mechanical properties. It is observed that electrical resistivity decreases with an increase in the strength and hardness and a decrease in the ductility of the studied steels, confirming the great influence of Fe
3C lamellae on the main free-paths for the displacement of dislocations, as well as for the mobility of free electrons within the material.
3.1.3. Magnetic Properties
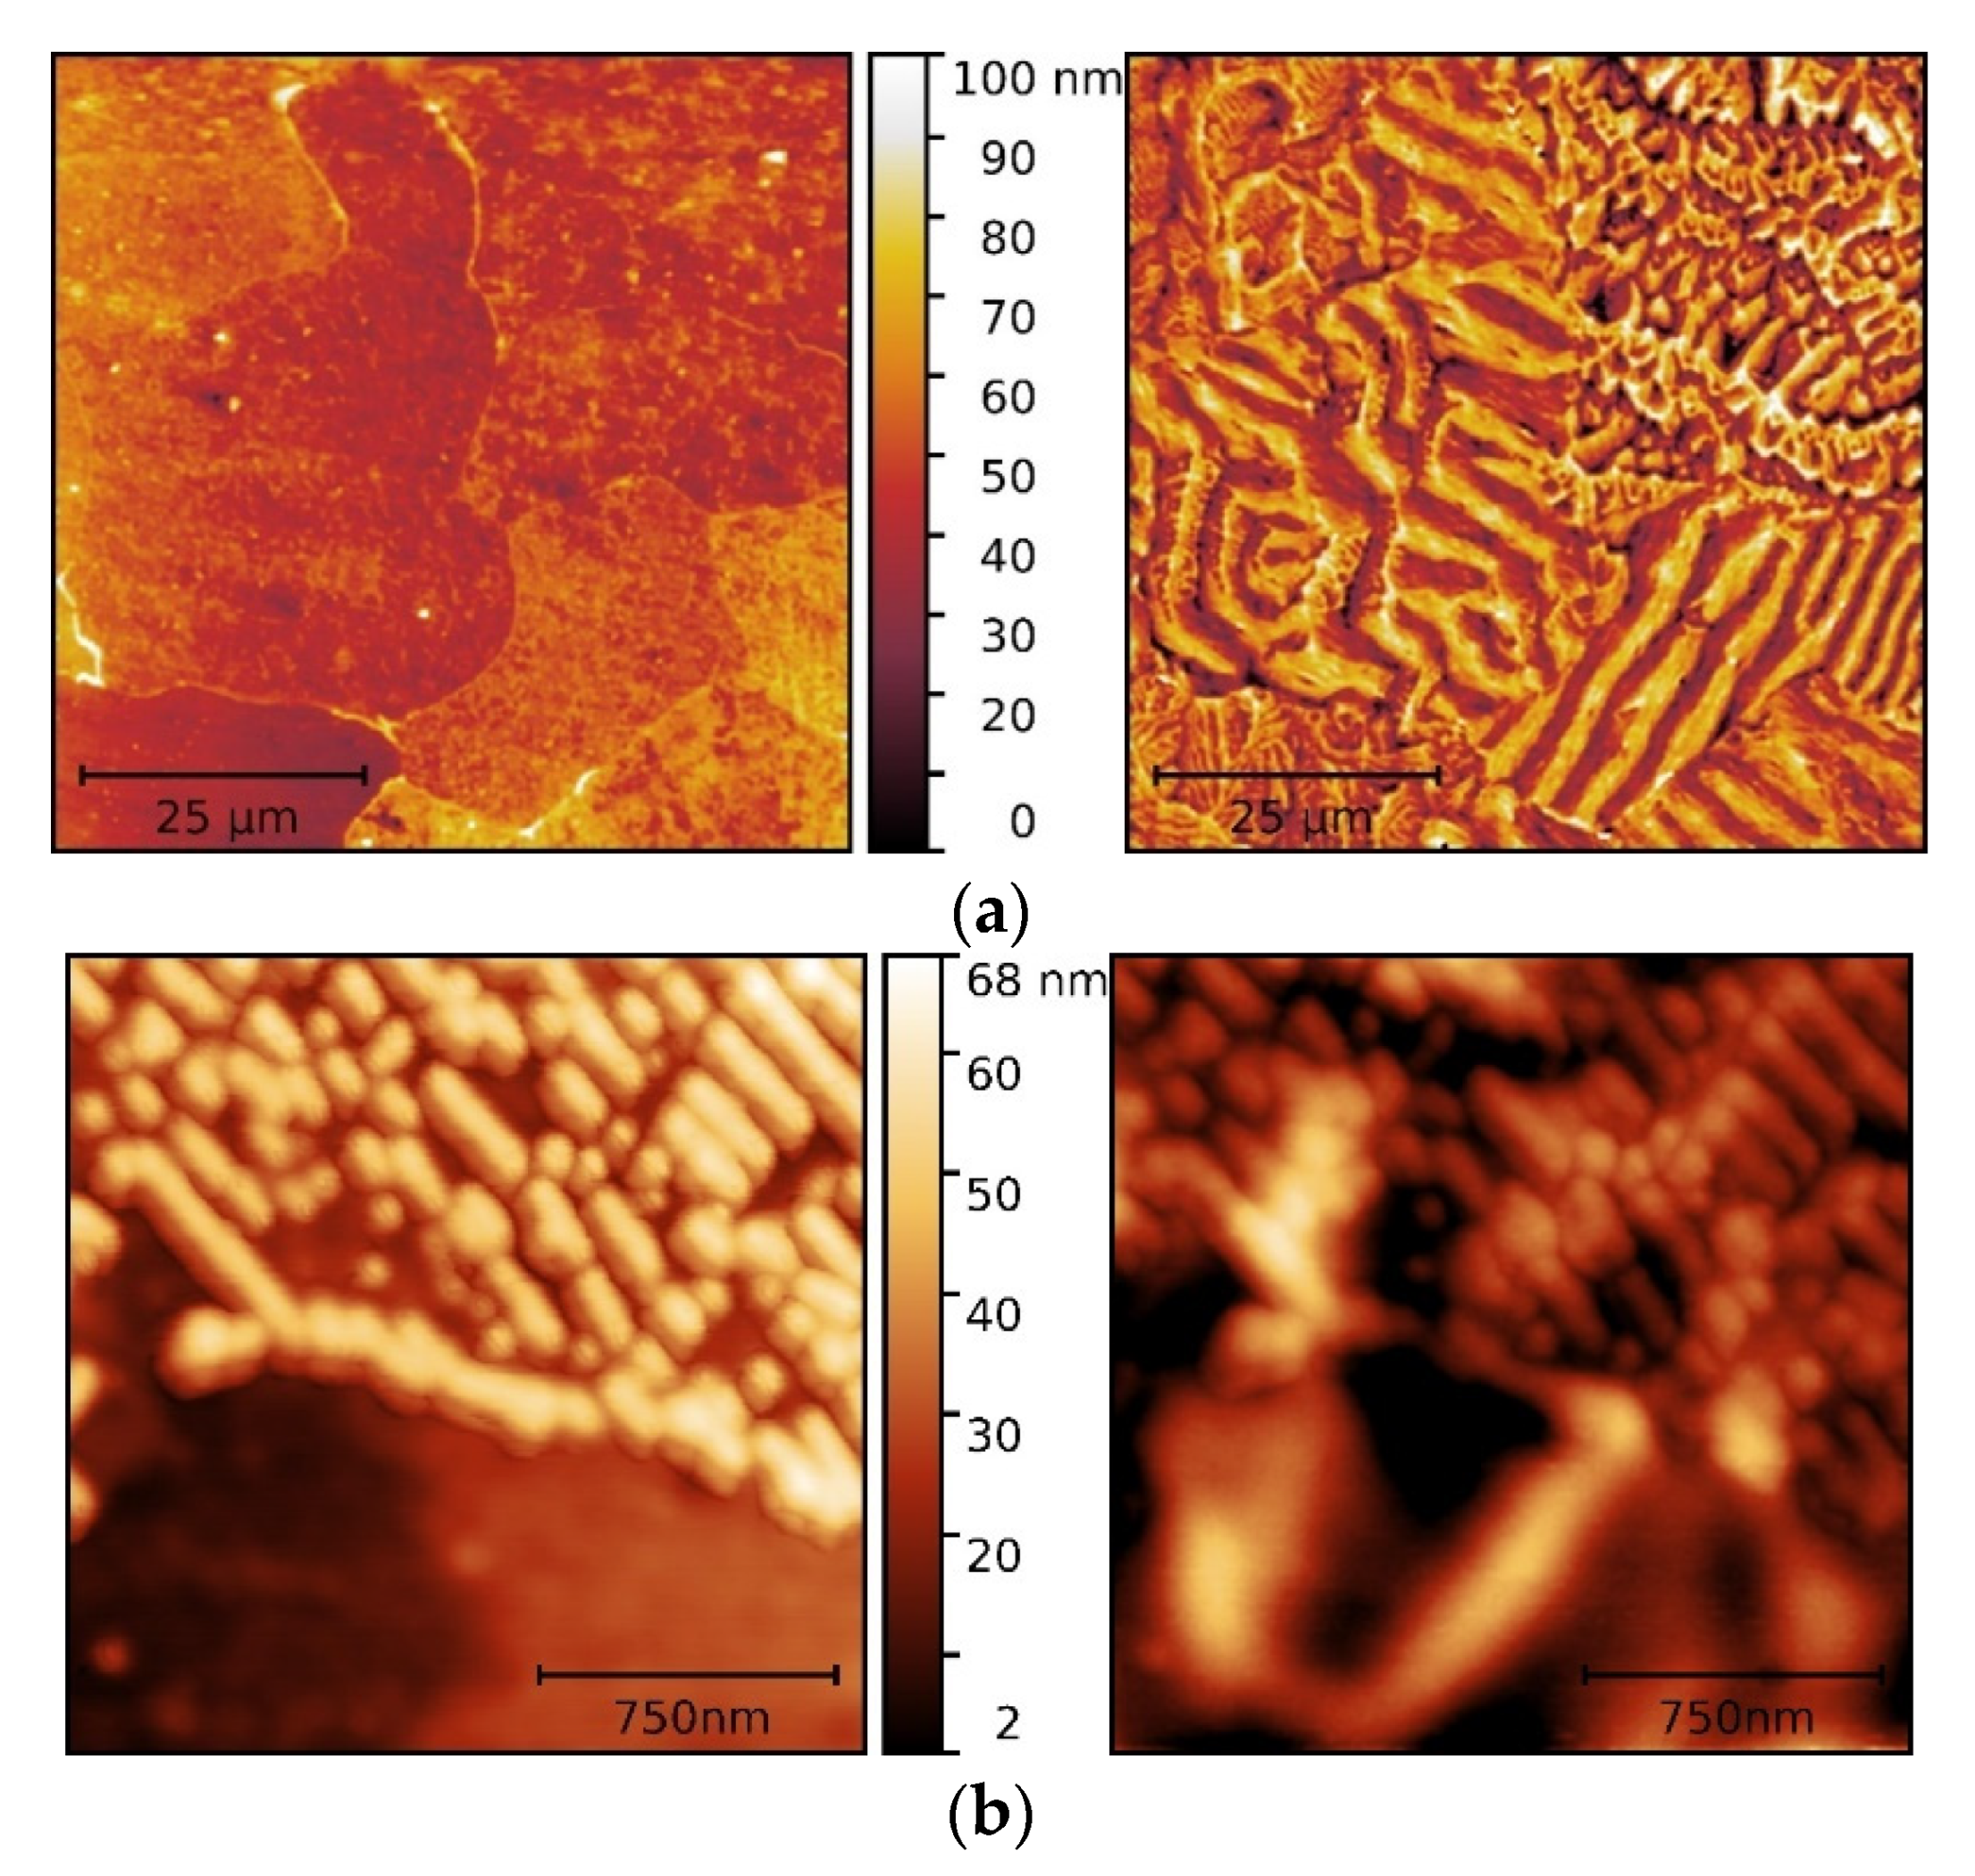
Magnetic force microscopy experiments were performed on the transverse cross-sections of samples of AISI 1000, 1035, and 1080 steel grades, the latter with fine and coarse lamellar microstructures. Topographic images and magnetic domain patterns of ferrite-pearlite steels are shown in
Figure 6. The dark and bright contrasted regions in magnetic patterns correspond, respectively, to attractive and repulsive force derivatives between the magnetized tip and local magnetic moments of the ferromagnetic samples.
In the surface domain pattern of the fully ferritic steel (
Figure 6a), magnetic domains exhibit different patterns: stripe domains within some grains, spike, and fine maze type domains in other grains. It may to be associated with misorientations between adjacent grains and wall interactions at grain boundaries. Correlations between micromagnetic structures and crystallographic orientations and internal stresses were not attempted in the present study. The domain interactions at proeutectoid ferrite and pearlite boundaries are observed with stripe domains of ferritic grain becoming a complex arrangement at the boundary (
Figure 6b). In lamellar pearlite, domains appeared to be arranged concerning the Fe
3C lamellae, extending across several lamellae. A double spike domain structure was observed at a grain boundary between two pearlite colonies with a different orientation (
Figure 6c). Ferrite exhibited larger and better-defined magnetic domain structures than in pearlite, demonstrating the pinning strength of pearlitic steels. Although cementite is ferromagnetic at room temperature, it is a relatively hard magnetic material, unlike the body-centered cubic (BCC) ferritic matrix. Thompson and Tanner [
15] observed that Fe
3C lamellae restricted the domain wall movement in pearlitic steels. Cementite has high anisotropy energy with an easy (001) direction that does not coincide with that of ferrite. Hetherington et al. [
35] pointed out that the domain configuration also depends on the domain wall orientation with respect to the lamellae. Moreover, magnetization discontinuities across the α-Fe
3C interfaces generate surface magnetic free poles, causing demagnetizing effects [
36,
37]. Hence, cementite may be considered as a magnetic inhomogeneity, such as a second-phase precipitate in the ferritic matrix, altering the magnetic behavior by increasing the pinning sites density that hampers the wall motion when an external field is applied.
In addition to MFM analysis, bulk macroscopic magnetic properties of the materials were characterized by magnetic hysteresis measurements. A summary of the bulk magnetic properties calculated from the measured hysteresis loops is given in
Table 4.
The differences in the hysteresis loops elucidates the various phase and structural states of these ferromagnetic materials, which are associated with the domain process within the material. The ferritic sample presents a low coercivity of 0.17 kA·m
−1, while the ferrite-pearlite samples with considerable pearlite amounts and fully pearlitic samples achieve values close to 1 kA·m
−1. The magnetic saturation presents decreasing values with the increase in pearlite content in the steel. The increasing Fe
3C lamellae enhances the effective number of domain wall anchorage sites within the material, also restricting the proportion of proeutectoid ferrite that can be magnetized in the easy direction [
15]. The results allow concluding that any change in the ferrite volume fraction may affect the magnetic characteristics of plain carbon steels, confirming the different magnetic domains arrangements observed in MFM patterns. On a smaller scale, the decreasing width of ferrite lamellae also contributes to the corresponding deterioration of the bulk magnetic performance of such materials. Fully pearlitic samples with coarse and fine lamellar structures present coercive forces of 0.93 and 1.28 kA·m
−1, respectively. No significant saturation magnetization changes are observed, since the phase balance is not altered.
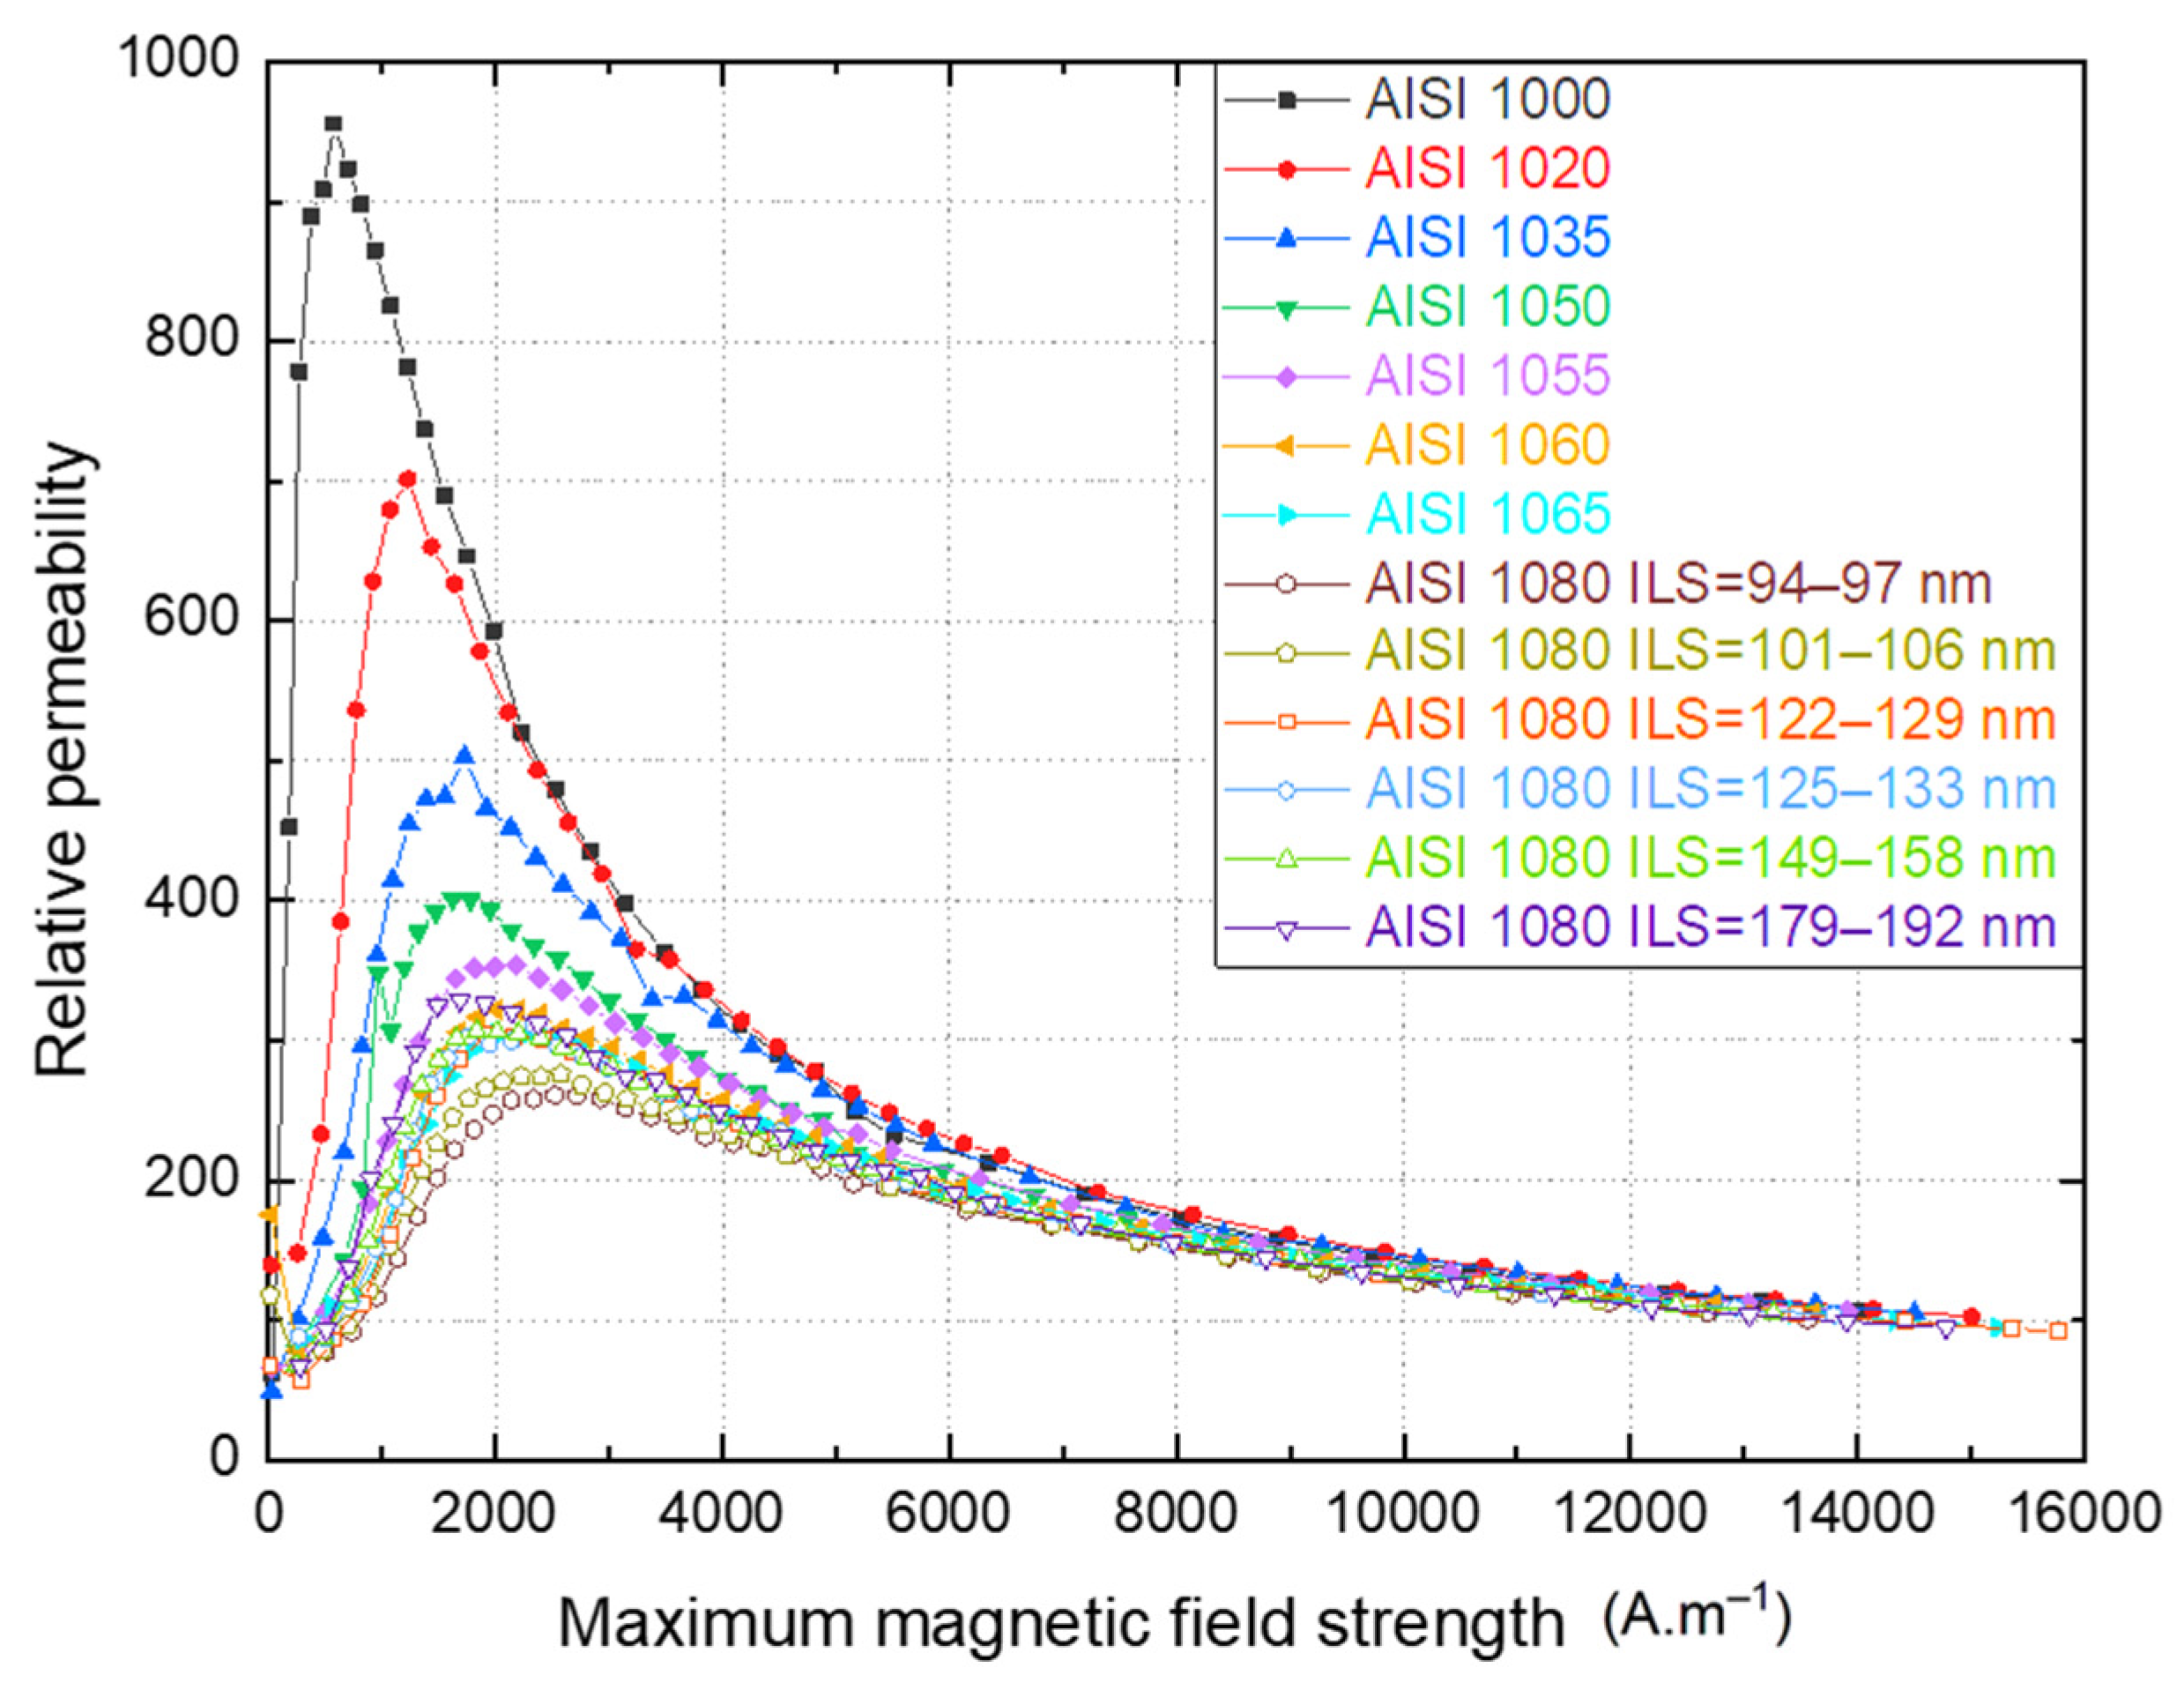
Figure 7 shows the relative permeability as a function of the maximum magnetic field strength of each hysteresis cycle for the various materials. The values attained in this investigation are consonant with those reported in the literature [
13,
38,
39,
40].
Figure 8 shows the good correlations between magnetic coercivity and maximum relative permeability, with the mechanical behavior of carbon steels. The lattice defects that contribute to the strengthening of steels configure anchorage sites for the domain wall pinning and, hence, make these materials magnetically harder [
41].
3.2. Effect of Phase Morphology on the Electrical and Magnetic Behavior of Carbon Steel Wires
3.2.1. Microstructure and Mechanical Properties
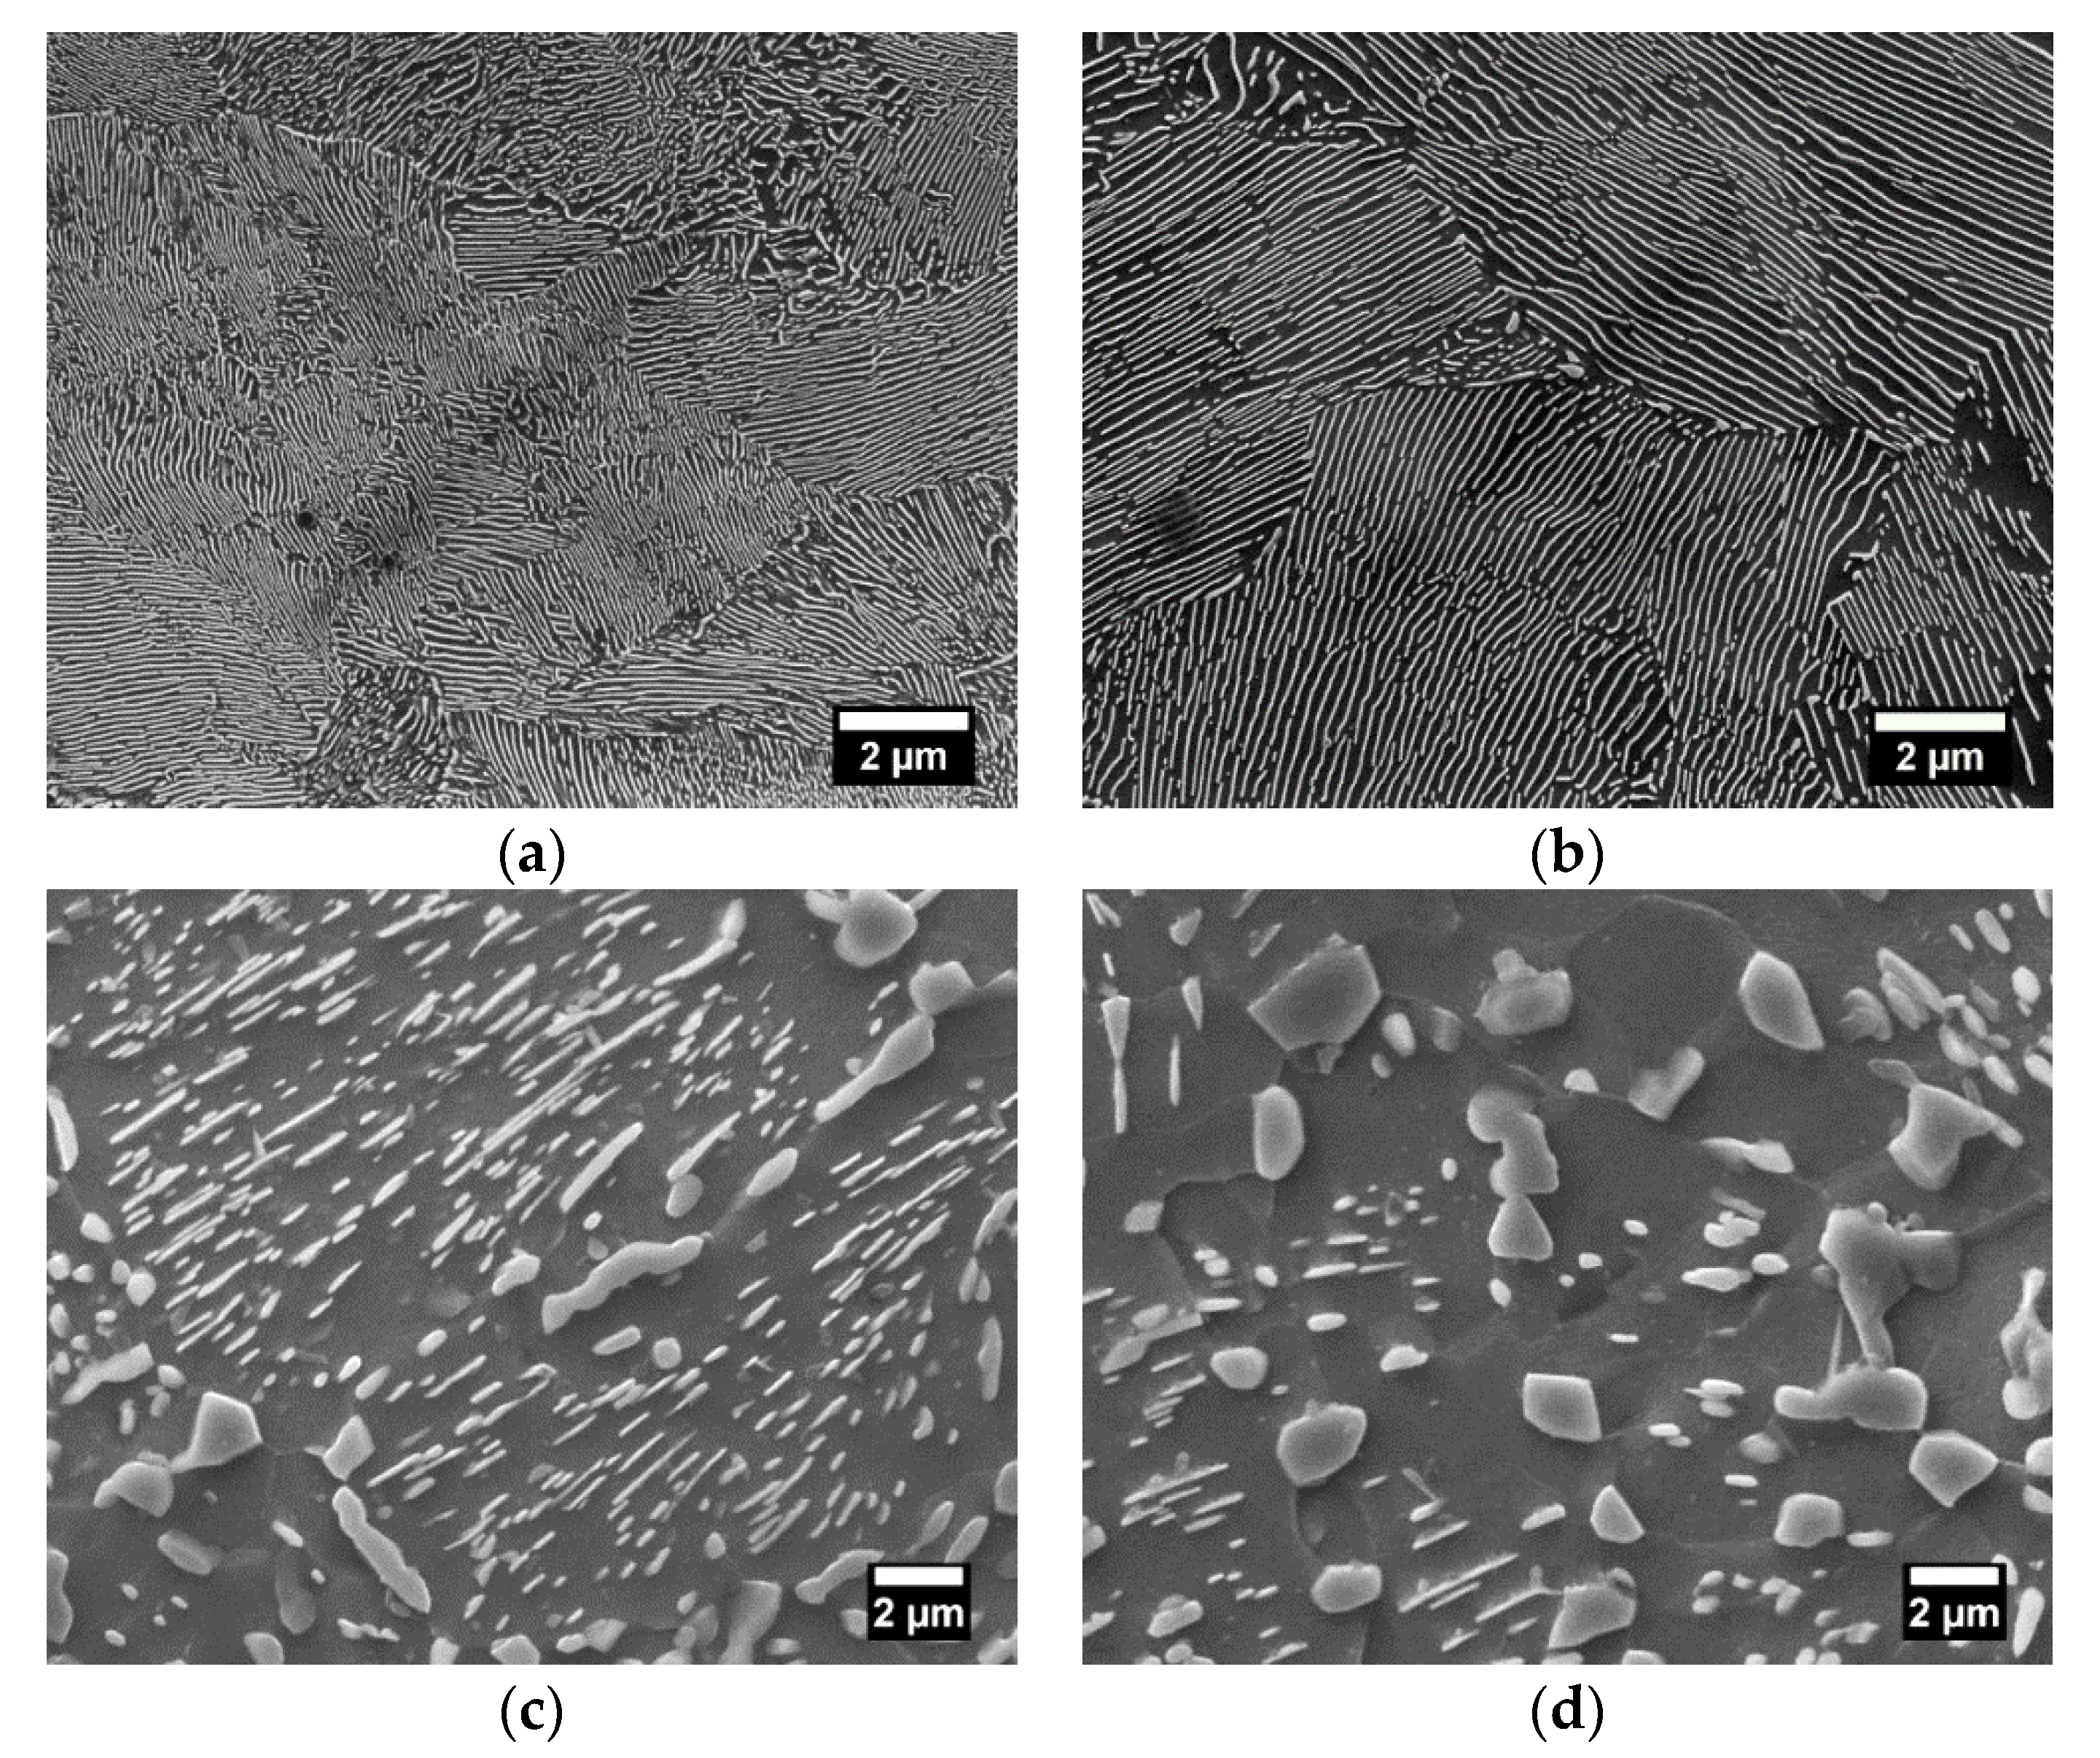
The various microstructures of group C produced from eutectoid steel wires are shown in the FE-SEM micrographs of
Figure 9.
As described in the previous section, the fine lamellar pearlite (
Figure 9a) is characterized by relatively thin distances between the Fe
3C lamellae included in the 95% confidence interval of 94 and 97 nm, and the interlamellar spacing of the coarser microstructure (
Figure 9b), whose mean true interlamellar spacing increased by a factor of 2, is between 179 and 192 nm. The obtained microstructures (
Figure 9c,d) are mainly composed of spherically shaped cementite precipitates in the ferrite matrix at different stages of coarsening due to the different soaking times, as described in the
Table 5. In the martensite structure (
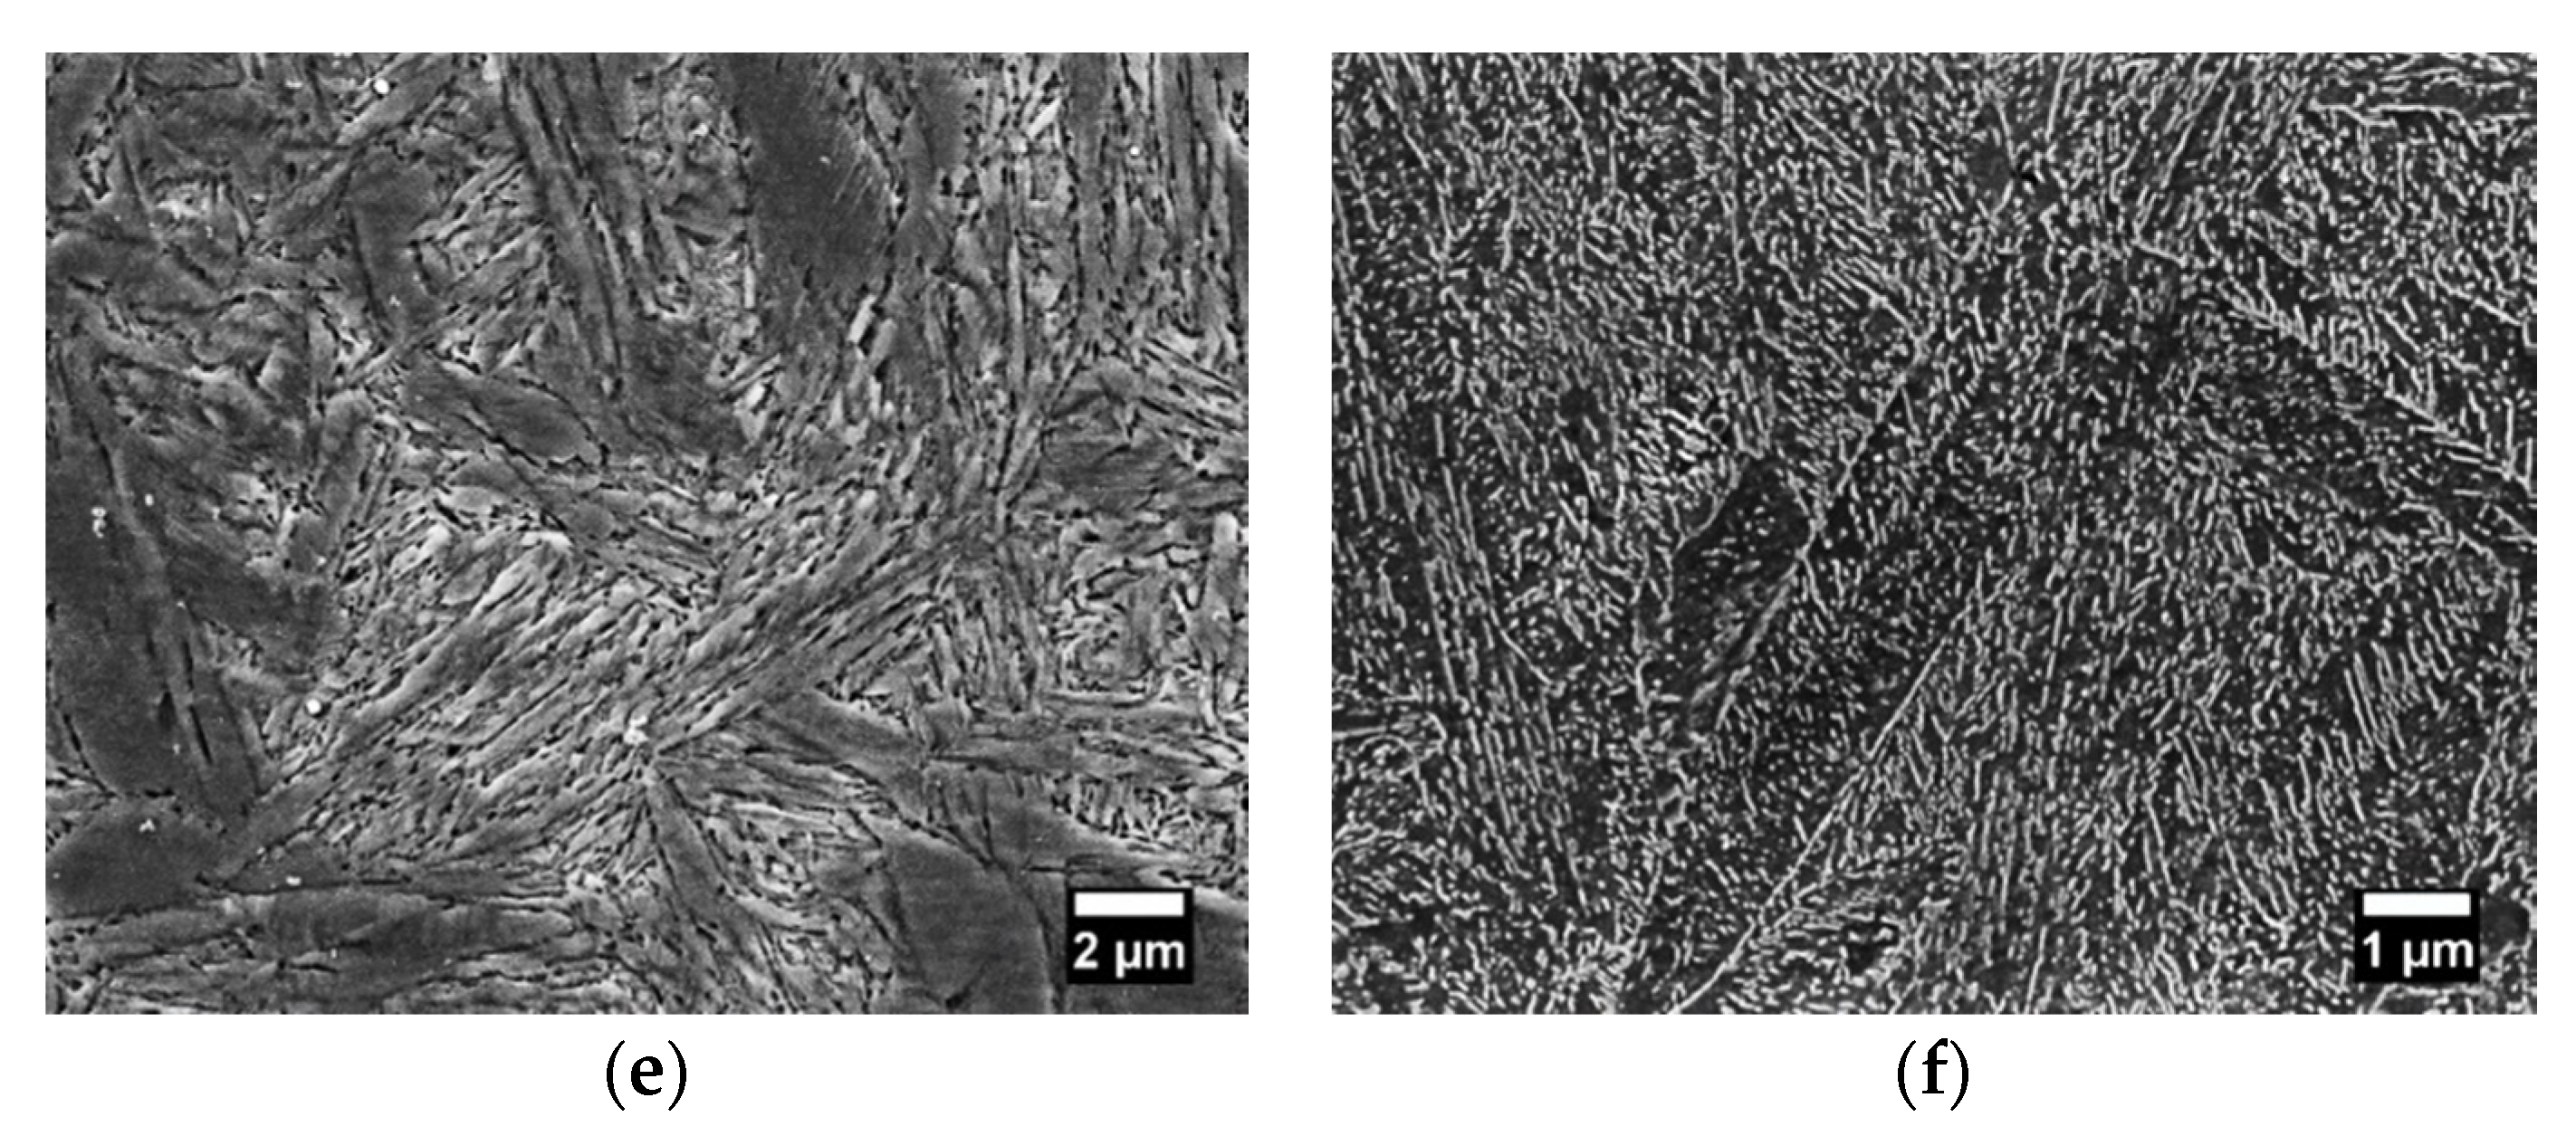
Figure 9e), the austenite grain gives rise to fine packets with approximately the same habit plane, and each packet contains fine blocks, which are subdivided into laths of the same orientation. The tempered martensite microstructure (
Figure 9f) obtained by tempering treatment consists of very fine dispersed cementite particles in a matrix of ferrite.
The mechanical properties evaluated by tensile tests and Vickers hardness measurements are represented in
Table 6. The data related to the tensile test could not be obtained for the martensitic samples due to the brittleness of such microstructure.
Both fine and coarse pearlite present higher strength and hardness values than the spheroidite microstructures due to their plate-shaped lamellar morphology. At shorter annealing times, spherical particles start to develop, but the Fe3C plate-shaped lamellae are still present. In further stages of spheroidizing, the high densities of very fine particles dissolve in the matrix simultaneously with the coarser precipitates grow, favoring the interfacial energy reduction. The tensile and yield strengths, as well as Vickers hardness values, decrease with increasing precipitates size, whereas the ductility was observed to increase. The spheroidized samples presented the most ductile and softest condition between the studied steels, which is directly associated with the relatively coarse Fe3C precipitates dispersed in the continuous ductile ferritic matrix.
Martensite was formed through a displacive transformation that involved the deformation of the austenite lattice without any diffusion of carbon atoms, generating a body-centered tetragonal structure (BCT) with interstitial carbon in solid solution. The shear mechanisms and volume expansion accompanying the austenitic transformation introduce a high density of dislocations within martensite crystals. Therefore, this complex structure presents a high Vickers hardness value, indicating its very high strength. The strength and toughness are strongly related to packet and block sizes, which mainly depend on the carbon content and the prior-austenite grain size, estimated between 35–38 µm, as presented in the previous section. The tempered martensite is less hard and brittle than martensite. At the tempering stage, the high dislocation density has considerably decreased and the high strength of this microstructure is achieved by precipitation hardening due to the very fine Fe3C particles formed in the resulted microstructure.
3.2.2. Electrical Properties
The electrical resistivity measurements carried out at a controlled temperature of 35 °C are given in
Table 7.
Figure 10 shows the electrical resistivity evolution as a function of the Vickers hardness values of the materials. In this study, Vickers hardness is given as an indicator of the microstructure evolution and correspondent mechanical property variations.
Resistivity is observed to increase in the order of the spheroidite, coarser and fine pearlite, tempered martensite, and martensite microstructures. These results are explained by the variation of the total interfacial area between ferrite and cementite phases within the material, which alters the frequency of electron scattering events, affecting its mobility. In the spheroidized microstructures, the cementite precipitates in the form of spherical particles in a ferritic matrix resulting in a decrease in α-Fe3C interfaces and a conductive increase, contrary to the cementite lamellae configuration of pearlite. The very fine dispersed precipitates formed in the tempered martensite significantly increase scattering events, reducing the conductivity of these microstructures.
The notable differences in the electrical behavior of the martensitic microstructure can be first explained by the tetragonal lattice of martensite. The interstitial atoms of carbon trapped in iron solid solution during quenching strongly influence the density of the free electrons in the crystal structure. In addition, the needle-like microstructure and the high density of dislocations present in the distorted lattice of martensite difficult the electron mobility. All these factors may explain the poor electrical conductivity of martensite compared to the other microstructures formed in an iron BCC lattice [
42].
3.2.3. Magnetic Properties
Table 8 presents the main magnetic properties determined from the hysteresis measurements.
The magnetic relative permeability increases in the order of the martensite, fine and coarse pearlite, tempered martensite, and spheroidite, as shown in
Figure 11.
Figure 12 indicates the correlations between magnetic properties and Vickers hardness number. As observed, the coercivity and hysteresis losses increase for the mechanically harder microstructures, whereas the maximum relative permeability decrease. Remanent and saturation magnetization does not appear to vary considerably, however, for the martensitic steel, while the magnetic saturation decreases markedly. Similar relations were found by Jiles et al. [
38], Byeon et al. [
39], and Saquet et al. [
43,
44], who have investigated the magnetic behavior of several steel microstructures.
Spheroidized microstructures exhibit lower coercivity between 0.5 and 0.7 kA.m−1 and higher relative permeability values than pearlite, which suggests that spheroidal cementite particles have a weaker pinning effect than continuous lamellae. Moreover, tempered martensite presented a higher coercivity and lower relative permeability than spheroidite, which indicates that the finely dispersed precipitates in the ferrite matrix are more efficient anchorage sites of domain walls than relatively large spherical precipitates. The morphology of tempered martensite is likely to favor precipitation hardening and, in the same way, it contributes to the increase in magnetic coercivity as observed. Cementite lamellae become more effective at pinning as the width of ferrite decreases, increasing the number of α-Fe3C interfaces. Fine lamellar pearlite exhibits worse magnetic properties than coarse microstructures.
The tetragonality of the martensitic lattice structure strongly affects their electromagnetic behavior. The very low relative permeability of such a fine and complex needle-like microstructure is associated with the restricted domain wall mobility during magnetization. The high density of dislocations induces stress fields around dislocation lines that act as obstacles to the motion of domain walls within the material [
39,
43]. The wall movement is small in volume and represents a little increase in the overall magnetization. The magnetization process consists predominantly of domain wall rotations. Indeed, high coercive field strengths of about 3.2 kA.m
−1 are necessary to reorient the domains in a more favored direction to the applied field and overcome magnetostatic and magnetoelastic energies. Since the domain wall energy is important, the domain structure rearrangement is very limited, and extra magnetostatic energy is introduced to the system. The magnetocrystalline energy is associated with the high shape anisotropy of martensite, in which magnetic domains segregated strictly along specific crystallographic shear planes of a BCT unit cell. As well as magnetocrystalline energy, the magnetoelastic energy depends on the deformations of the crystal lattice.
The observed decrease in magnetic saturation seems to be proportional to the volume fraction of the ferromagnetic phase. The value of the saturation magnetization 1.35 T corresponds to the martensitic phase. As previously discussed, the ferrite phase has 1.95 T and ferrite-pearlite steels presented saturation values ranging from 1.70 to 1.90 T, which points out the increase in the orthorhombic Fe3C phase with increasing carbon concentration. The different types of microstructures produced from eutectoid steels and composed of a BCC α-Fe matrix present close saturation magnetization values, since no variation in phase composition occurred.
The magnetic microstructure of spheroidite tends to become closer to the ferritic configuration, with domain wall anchored at cementite precipitates [
16,
17,
18,
39,
43,
44]. MFM observations conducted in the present study have shown that the magnetic microstructure of pearlite does not possess a simple sub-lamellar structure, as the α-Fe lamellae are too narrow. The pearlite domain configuration has also been observed by TEM and Lorentz microscopy [
14,
15,
35]. The magnetic domain arrangement in pearlite depends on the domain wall orientation with respect to the Fe
3C lamellae, lying perpendicular or parallel to it. Domain configuration in martensite and tempered martensite microstructures of steels does not seem to be well explored. Based on the work of Beale et al. [
45], the martensitic domain structure is characterized by very fine single magnetic domains contained within the thin laths. The magnetization direction within each mono-domain, perpendicular or parallel to the lath, depends on the predominant magnetostatic and magnetoelastic energy of the system [
44].
4. Conclusions
Plain carbon steel wires with various microstructures and strengths were subjected to electrical and magnetic measurements for the investigation of the influence of microstructural characteristics, notably the chemical composition and the phase morphology of the materials. It is possible to summarize the relevant observations:
The electrical and magnetic behavior of AISI 1000 steel series have been demonstrated to highly depend on their thermo-mechanical history. Electrical conductivity and magnetic permeability are observed to increase in the order of martensite, tempered martensite, pearlite, proeutectoid ferrite-pearlite, spheroidite, and ferrite microstructures.
These properties are mainly related to the variations in carbon concentration within the steels, as well as to the changes in morphology, size, and distribution of the cementite phase within the α-ferrite matrix. Moreover, the crystal lattice structure is the determinant for defining mechanical and physical properties of carbon steels.
As the macroscopic electromagnetic behavior of steels results from individual contributions of microstructural elements that are often intrinsically related to one another, a careful interpretation of both electrical and magnetic responses is critical for a proper application of non-destructive methods for quality assurance and process monitoring of carbon steel wires.
5. Patents
A patent application partially related to this research work was filed on 21 June 2021, with nr. EP21180597.3 (assignee Bekaert NV, not published yet).
Author Contributions
Conceptualization, I.M.O.A.C., C.M. and J.-B.V.; methodology, I.M.O.A.C., M.B., I.B. and A.B.; software, I.M.O.A.C.; validation, C.M. and J.-B.V.; formal analysis, I.M.O.A.C.; investigation, I.M.O.A.C.; resources, C.M. and J.-B.V.; data curation, I.M.O.A.C.; writing—original draft preparation, I.M.O.A.C.; writing—review and editing, I.M.O.A.C., M.B., A.B., C.M. and J.-B.V.; visualization, I.M.O.A.C.; supervision, C.M. and J.-B.V.; project administration, C.M. and J.-B.V.; funding acquisition, C.M. All authors have read and agreed to the published version of the manuscript.
Funding
This research was co-funded by the Vlaanderen Agentschap Innoveren & Ondernemen–VLAIO under the industrial research and innovation program of the Flemish governmental organization in Belgium (HBC.2016.0818–ACTW).
Data Availability Statement
The data presented in this study are available on request from the corresponding authors due to ongoing research activities.
Acknowledgments
The authors gratefully acknowledge Slavomír Gabáni and Gabriel Pristáš from the Institute of Experimental Physics of the Slovak Academy of Sciences in Kosice, Slovakia for their expertise in the resistivity measurements that greatly improved this research. The preparation of this paper has been overshadowed by Ivan Batko’s death in 2019. Most of the main ideas were worked out together and the authors have done their best to complete them. In sorrow, this work is dedicated to his memory.
Conflicts of Interest
The authors declare no conflict of interest. The funders had no role in the design of the study; in the collection, analyses, or interpretation of data; in the writing of the manuscript, or in the decision to publish the results.
References
- Hao, X.J.; Yin, W.; Strangwood, M.; Peyton, A.J.; Morris, P.F.; Davis, C.L. Characterization of decarburization of steels using a multifrequency electromagnetic sensor: Experiment and modeling. Metall. Mater. Trans. A 2009, 40, 745–756. [Google Scholar] [CrossRef]
- Ghanei, S.; Kashefi, M.; Mazinani, M. Comparative study of eddy current and Barkhausen noise nondestructive testing methods in microstructural examination of ferrite–martensite dual-phase steel. J. Magn. Magn. Mater. 2014, 356, 103–110. [Google Scholar] [CrossRef]
- Rumiche, F.; Indacochea, J.E.; Wang, M.L. Assessment of the effect of microstructure on the magnetic behavior of structural carbon steels using an electromagnetic sensor. J. Mater. Eng. Perform. 2008, 17, 586–593. [Google Scholar] [CrossRef]
- Konoplyuk, S. Estimation of pearlite fraction in ductile cast irons by eddy current method. NDT E Int. 2010, 43, 360–364. [Google Scholar] [CrossRef]
- Zhou, L.; Liu, J.; Hao, X.J.; Strangwood, M.; Peyton, A.J.; Davis, C.L. Quantification of the phase fraction in steel using an electromagnetic sensor. NDTE Int. 2014, 67, 31–35. [Google Scholar] [CrossRef]
- Balamurugan, S.; Bhattacharyya, T.; Gudhae, D.; Zhou, L.; Davis, C.L.; Peyton, A.J.; Chandra, S. Prediction of interlamellar pearlite spacing of tyre bead wires after patenting using electromagnetic techniques. Insight Non-Destr. Test. Cond. Monit. 2013, 55, 132–135. [Google Scholar] [CrossRef]
- Mansoor, M.; Ejaz, N. Prediction of in-service microstructural degradation of A106 steel using eddy current technique. Mater. Charact. 2009, 60, 1591–1596. [Google Scholar] [CrossRef]
- Davut, K.; Gur, C.H. Monitoring the microstructural evolution in spheroidized steels by magnetic Barkhausen noise measurements. J. Nondestruct. Eval. 2010, 29, 241–247. [Google Scholar] [CrossRef]
- Mohapatra, J.N.; Kamada, Y. Magnetic hysteresis loop as a tool for the evaluation of spheroidization of cementite in pearlitic steels. J. Mater. Eng. Perform. 2015, 24, 1551–1557. [Google Scholar] [CrossRef]
- Konoplyuk, S.; Abe, T.; Uchimoto, T.; Takagi, T.; Kurosawa, M. Characterization of ductile cast iron by eddy current method. NDT E Int. 2005, 38, 623–626. [Google Scholar] [CrossRef]
- Gorkunov, E.S.; Grachev, S.V.; Smirnov, S.V.; Somova, V.M.; Zadvorkin, S.M.; Kar’kina, L.E. Relation of physical–mechanical properties to the structural condition of severely deformed patented carbon steels at drawing. Russ. J. Nondestruct. Test. 2005, 41, 65–79. [Google Scholar] [CrossRef]
- Kahrobaee, S.; Kashefi, M. Hardness profile plotting using multi-frequency multi-output electromagnetic sensor. NDTE Int. 2011, 44, 335–338. [Google Scholar] [CrossRef]
- Ghanei, S.; Kashefi, M.; Mazinani, M. Eddy current nondestructive evaluation of dual phase steel. Mater. Des. 2013, 50, 491–496. [Google Scholar] [CrossRef]
- Clapham, L.; Jagadish, C.; Atherton, D.L. The influence of pearlite on Barkhausen noise generation in plain carbon steels. Acta Metall. Mater. 1991, 39, 1555–1562. [Google Scholar] [CrossRef]
- Thompson, S.M.; Tanner, B.K. The magnetic properties of pearlitic steels as a function of carbon content. J. Magn. Magn. Mater. 1993, 123, 283–298. [Google Scholar] [CrossRef]
- Batista, L.; Rabe, U.; Hirsekorn, S. Magnetic micro- and nanostructures of unalloyed steels: Domain wall interactions with cementite precipitates observed by MFM. NDTE Int. 2013, 57, 58–68. [Google Scholar] [CrossRef]
- Batista, L.; Rabe, U.; Altpeter, I.; Hirsekorn, S.; Dobmann, G. On the mechanism of nondestructive evaluation of cementite content in steels using a combination of magnetic Barkhausen noise and magnetic force microscopy techniques. J. Magn. Magn. Mater. 2014, 354, 248–256. [Google Scholar] [CrossRef]
- Batista, L.; Rabe, U.; Hirsekorn, S. Determination of the easy axes of small ferromagnetic precipitates in a bulk material by combined magnetic force microscopy and electron backscatter diffraction techniques. Ultramicroscopy 2014, 146, 17–26. [Google Scholar] [CrossRef]
- Wurster, S.; Stückler, M.; Weissitsch, L.; Krenn, H.; Hohenwarter, A.; Pippan, R.; Bachmaier, A. Soft magnetic properties of ultra-strong and nanocrystalline pearlitic wires. Nanomaterials 2022, 12, 23. [Google Scholar] [CrossRef]
- Yang, Y.; Nie, J.; Mao, Q.; Zhao, Y. Improving the combination of electrical conductivity and tensile strength of Al 1070 by rotary swaging deformation. Results Phys. 2019, 13, 102236. [Google Scholar] [CrossRef]
- Luo, X.M.; Song, Z.M.; Li, M.L.; Wang, Q.; Zhang, G.P. Microstructural evolution and service performance of cold-drawn pure aluminum conductor wires. J. Mater. Sci. Technol. 2017, 33, 1039–1043. [Google Scholar] [CrossRef]
- Klein, S.; Roncery, L.M.; Walter, M.; Weber, S.; Theisen, W. Diffusion processes during cementite precipitation and their impact on electrical and thermal conductivity of a heat-treatable steel. J. Mater. Sci. 2017, 52, 375–390. [Google Scholar] [CrossRef]
- Abbaschian, R.; Abbaschian, L.; Reed-Hill, R.E. Physical Metallurgy Principles, 4th ed.; Cengage Learning: Stamford, CT, USA, 2009. [Google Scholar]
- Bae, C.M.; Lee, C.S.; Nam, W.J. Effect of carbon content on mechanical properties of fully pearlitic steels. Mater. Sci. Technol. 2002, 18, 1317–1321. [Google Scholar] [CrossRef]
- Häglund, J.; Grimvall, G. Electronic structure, X-ray photoemission spectra, and transport properties of Fe3C (cementite). Phys. Rev. B 1991, 44, 2914–2919. [Google Scholar] [CrossRef] [PubMed]
- Chiou, W.C., Jr.; Carter, E.A. Structure and stability of Fe3C-cementite surfaces from first principles. Surf. Sci. 2003, 530, 87–100. [Google Scholar] [CrossRef]
- Faraoun, H.I.; Zhang, Y.D.; Esling, C.; Aourag, H. Crystalline, electronic, and magnetic structures of θ-Fe3C, χ-Fe5C2, and η-Fe2C from first principle calculation. J. Appl. Phys. 2006, 99, 093508. [Google Scholar] [CrossRef]
- Razumovskiy, V.I.; Ghosh, G. A first-principles study of cementite (Fe3C) and its alloyed counterparts: Structural properties, stability, and electronic structure. Comput. Mater. Sci. 2015, 110, 169–181. [Google Scholar] [CrossRef] [Green Version]
- Cottrell, A.H. A theory of cementite. Mater. Sci. Technol. 1993, 9, 277–280. [Google Scholar] [CrossRef]
- Jiang, C.; Srinivasan, S.G.; Caro, A.; Maloy, S.A. Structural, elastic, and electronic properties of Fe3C from first principles. J. Appl. Phys. 2008, 103, 043502. [Google Scholar] [CrossRef] [Green Version]
- Shanina, B.D.; Gavriljuk, V.G. Effect of carbon and nitrogen on electronic structure of steel. Steel Grips 2004, 2, 45–52. [Google Scholar]
- Gavriljuk, V.G.; Shivanyuk, V.N.; Shanina, B.D. Change in the electron structure caused by C, N and H atoms in iron and its effect on their interaction with dislocations. Acta Mater. 2005, 53, 5017–5024. [Google Scholar] [CrossRef]
- Hasselman, D.P.H.; Johnson, L.F. Effective thermal conductivity of composites with interfacial thermal barrier resistance. J. Compos. Mater. 1987, 21, 508–515. [Google Scholar] [CrossRef]
- Chen, J.K.; Chen, S.F. Thermal conductivity of an in-situ metal matrix composite—Cast iron. In Metal, Ceramic and Polymeric Composites for Various Uses, 1st ed.; Cuppoletti, J., Ed.; IntechOpen: London, UK, 2011; pp. 211–224. [Google Scholar]
- Hetherington, M.G.; Jakubovics, J.P.; Szpunar, J.A.; Tanner, B.K. High-voltage Lorentz electron-microscopy studies of domain-structures and magnetization processes in pearlitic steels. Philos. Mag. B 1987, 56, 561–577. [Google Scholar] [CrossRef]
- Néel, M.L. Nouvelle théorie du champ coercitif. Physica 1949, 15, 225–234. [Google Scholar] [CrossRef]
- Abuthahir, J.; Kumar, A. Magnetic force microscopy studies in bulk polycrystalline iron. J. Magn. Magn. Mater. 2018, 448, 107–116. [Google Scholar] [CrossRef]
- Jiles, D.C. Magnetic properties and microstructure of AISI 1000 series carbon steels. J. Phys. D Appl. Phys. 1988, 21, 1186–1195. [Google Scholar] [CrossRef]
- Byeon, J.W.; Kwun, S.I. Magnetic evaluation of microstructures and strength of eutectoid steel. Mater. Trans. 2003, 44, 2184–2190. [Google Scholar] [CrossRef] [Green Version]
- Tanner, B.K.; Szpunar, J.A.; Willcock, S.N.M.; Morgan, L.L.; Mundell, P.A. Magnetic and metallurgical properties of high-tensile steels. J. Mater. Sci. 1988, 23, 4534–4540. [Google Scholar] [CrossRef]
- Rose, R.M.; Shepard, L.A.; Wulff, J. The Structure ad Properties of Materials Volume IV: Electronic Properties, 1st ed.; John Wiley & Sons Inc.: New York, NY, USA, 1966. [Google Scholar]
- Sandomirskii, S.G. Structural and phase sensitivity of the maximum differential magnetic susceptibility of steel. Russ. Metall. 2016, 7, 619–624. [Google Scholar] [CrossRef]
- Saquet, O.; Chicois, J.; Vincent, A. Barkhausen noise from plain carbon steels: Analysis of the influence of microstructure. Mater. Sci. Eng. A 1999, 269, 73–82. [Google Scholar] [CrossRef]
- Saquet, O. Caractérisation des Aciers par Bruit Barkhausen (Interaction Microstructure Cristalline/Microstructure Magnétique): Optimisation de la Mise en Œuvre Pour un Développement Industriel: Application au Contrôle des Traitements Superficiels. Ph.D. Thesis, Institut National des Sciences Appliquées de Lyon, Villeurbanne, France, 1997. [Google Scholar]
- Beale, A.D.; Jakubovics, J.P.; Hetherington, M.G.; Scruby, C.B.; Lewis, B.A.; Davies, K.J. TEM studies of domains and micromagnetic processes in structural steels. J. Magn. Magn. Mater. 1992, 104, 365–367. [Google Scholar] [CrossRef]
Figure 1.
Correlations of tensile properties and Vickers hardness with carbon content of the plain carbon steels of group A.
Figure 1.
Correlations of tensile properties and Vickers hardness with carbon content of the plain carbon steels of group A.
Figure 2.
FE-SEM images showing fine and coarse lamellar pearlite microstructures of the AISI 1080 steel patented at, respectively, (a) 540 °C and (b) 640 °C.
Figure 2.
FE-SEM images showing fine and coarse lamellar pearlite microstructures of the AISI 1080 steel patented at, respectively, (a) 540 °C and (b) 640 °C.
Figure 3.
Correlations of tensile properties and Vickers hardness with interlamellar spacing of fully pearlitic steels of group B.
Figure 3.
Correlations of tensile properties and Vickers hardness with interlamellar spacing of fully pearlitic steels of group B.
Figure 4.
Temperature dependence of electrical resistivity of ferrite-pearlite samples (top); in detail, the temperature regions from 2 to 35 K (bottom left) and from 250 to 300 K (bottom right).
Figure 4.
Temperature dependence of electrical resistivity of ferrite-pearlite samples (top); in detail, the temperature regions from 2 to 35 K (bottom left) and from 250 to 300 K (bottom right).
Figure 5.
Correlations between electrical resistivity and yield strength (top left), ultimate tensile strength (bottom left), Vickers hardness (top right) and elongation to fracture (bottom right) including data obtained from carbon steels of groups A and B.
Figure 5.
Correlations between electrical resistivity and yield strength (top left), ultimate tensile strength (bottom left), Vickers hardness (top right) and elongation to fracture (bottom right) including data obtained from carbon steels of groups A and B.
Figure 6.
MFM observations of the topography (left) and magnetic domain patterns (right) of (a) fully ferritic; (b) proeutectoid ferrite-pearlite; and (c) fully pearlitic steel samples.
Figure 6.
MFM observations of the topography (left) and magnetic domain patterns (right) of (a) fully ferritic; (b) proeutectoid ferrite-pearlite; and (c) fully pearlitic steel samples.
Figure 7.
Variation of the relative permeability as a function of the maximum magnetic field strength of carbon steels of groups A and B.
Figure 7.
Variation of the relative permeability as a function of the maximum magnetic field strength of carbon steels of groups A and B.
Figure 8.
Correlations between (a) coercivity and (b) maximum relative permeability with the tensile properties and Vickers hardness of carbon steels of groups A and B.
Figure 8.
Correlations between (a) coercivity and (b) maximum relative permeability with the tensile properties and Vickers hardness of carbon steels of groups A and B.
Figure 9.
FE-SEM images of (a) fine and (b) coarse lamellar pearlite; (c,d) spheroidite at different stages of spheroidization; (e) martensite; (f) tempered martensite microstructures obtained from AISI 1080 steels.
Figure 9.
FE-SEM images of (a) fine and (b) coarse lamellar pearlite; (c,d) spheroidite at different stages of spheroidization; (e) martensite; (f) tempered martensite microstructures obtained from AISI 1080 steels.
Figure 10.
Correlation between resistivity measurements and Vickers hardness of the AISI 1080 steels heat-treated at different conditions, where FP = fine pearlite; CP = coarse pearlite; S8/S24/S72 = spheroidite annealed for 8, 24, and 72 h, respectively; M = martensite; and TM = tempered martensite microstructures.
Figure 11.
Relative permeability in the function of the maximum magnetic field strength obtained for the eutectoid steels of group C.
Figure 11.
Relative permeability in the function of the maximum magnetic field strength obtained for the eutectoid steels of group C.
Figure 12.
Relations between Vickers hardness and the main magnetic properties (coercivity, remanence, hysteresis loss, saturation, and maximum relative permeability) of the various microstructures of group C.
Figure 12.
Relations between Vickers hardness and the main magnetic properties (coercivity, remanence, hysteresis loss, saturation, and maximum relative permeability) of the various microstructures of group C.
Table 1.
Chemical composition of the AISI 1000 series plain carbon steels (wt. %).
Table 1.
Chemical composition of the AISI 1000 series plain carbon steels (wt. %).
| AISI 1 | C | Mn | Si | Cr | Ni | P | S | Fe |
|---|
| 1000 | 0.033 | 0.150 | 0.014 | 0.023 | 0.022 | 0.006 | 0.014 | Balance |
| 1020 | 0.201 | 0.726 | 0.215 | 0.019 | 0.015 | 0.013 | 0.011 | Balance |
| 1035 | 0.346 | 0.607 | 0.209 | 0.015 | 0.015 | 0.015 | 0.010 | Balance |
| 1050 | 0.498 | 0.590 | 0.208 | 0.018 | 0.020 | 0.013 | 0.005 | Balance |
| 1055 | 0.520 | 0.607 | 0.210 | 0.016 | 0.015 | 0.015 | 0.005 | Balance |
| 1060 | 0.583 | 0.607 | 0.189 | 0.009 | 0.013 | 0.009 | 0.008 | Balance |
| 1065 | 0.647 | 0.613 | 0.183 | 0.014 | 0.014 | 0.017 | 0.014 | Balance |
| 1080 | 0.776 | 0.587 | 0.235 | 0.020 | 0.020 | 0.014 | 0.009 | Balance |
Table 2.
Average prior-austenite grain size, pearlite volume fraction and true interlamellar spacing values of samples of group A.
Table 2.
Average prior-austenite grain size, pearlite volume fraction and true interlamellar spacing values of samples of group A.
| AISI-Group A | Prior-Austenite Grain Size (µm) | Pearlite Volume Fraction (%) | True Interlamellar Spacing (nm) |
|---|
| Mean | 95% Confidence Interval Bounds | Mean | 95% Confidence Interval Bounds | Mean | 95% Confidence Interval Bounds |
|---|
| 1000–ferrite | 91.3 ± 20.6 | 87.7–95.0 | 0.00 ± 0.00 | 0.00–0.00 | - | - |
| 1020–ferrite-pearlite | 73.6 ± 9.0 | 61.1–86.2 | 33.03 ± 6.56 | 31.03–35.02 | 213 ± 50 | 205–220 |
| 1035–ferrite-pearlite | 66.6 ± 1.2 | 64.9–68.2 | 78.28 ± 2.36 | 76.97–79.59 | 196 ± 27 | 192–201 |
| 1050–ferrite-pearlite | 60.5 ± 6.2 | 52.1–69.2 | 94.70 ± 0.69 | 94.26–95.14 | 157 ± 20 | 154–160 |
| 1055–ferrite-pearlite | 59.6 ± 4.9 | 50.7–68.5 | 95.79 ± 0.68 | 95.10–96.18 | 153 ± 22 | 150–156 |
| 1060–ferrite-pearlite | 48.7 ± 2.5 | 45.2–52.1 | 98.07 ± 0.51 | 97.73–98.41 | 146 ± 13 | 143–148 |
| 1065–ferrite-pearlite | 31.1 ± 3.0 | 30.1–32.2 | 98.91 ± 0.31 | 98.71–99.11 | 159 ± 30 | 154–164 |
| 1080–pearlite | 37.1 ± 4.1 | 35.3–38.2 | 99.92 ± 0.08 | 99.87–99.98 | 126 ± 20 | 122–129 |
Table 3.
Electrical resistivity measurements of samples of groups A and B carried out at 35 °C.
Table 3.
Electrical resistivity measurements of samples of groups A and B carried out at 35 °C.
| AISI-Group A | Electrical Resistivity (µohm.cm) |
| 1000–Ferrite | 11.97 ± 0.03 |
| 1020–Ferrite-pearlite | 19.19 ± 0.02 |
| 1035–Ferrite-pearlite | 19.46 ± 0.01 |
| 1050–Ferrite-pearlite | 20.71 ± 0.00 |
| 1055–Ferrite-pearlite | 21.02 ± 0.02 |
| 1060–Ferrite-pearlite | 21.31 ± 0.03 |
| 1065–Ferrite-pearlite | 21.84 ± 0.02 |
| 1080–Pearlite | 22.48 ± 0.01 |
| AISI-Group B | Electrical Resistivity (µohm.cm) |
| 1080–Pearlite (ILS = 94–97 nm) | 22.74 ± 0.02 |
| 1080–Pearlite (ILS = 101–106 nm) | 22.61 ± 0.01 |
| 1080–Pearlite (ILS = 122–129 nm) | 22.48 ± 0.01 |
| 1080–Pearlite (ILS = 125–133 nm) | 22.41 ± 0.04 |
| 1080–Pearlite (ILS = 149–158 nm) | 22.37 ± 0.05 |
| 1080–Pearlite (ILS = 179–192 nm) | 22.27 ± 0.02 |
Table 4.
Magnetic properties of the AISI 1000 series steels corresponding to group A and B.
Table 4.
Magnetic properties of the AISI 1000 series steels corresponding to group A and B.
| AISI-Group A | Coercivity (A·m−1) | Remanence (T) | Hysteresis Loss (W·kg−1) | Magnetic
Saturation (T) | Maximum Relative Permeability |
| 1000–ferrite | 171 ± 3 | 0.32 ± 0.01 | 0.03 ± 0.01 | 1.95 ± 0.00 | 941 ± 10 |
| 1020–ferrite-pearlite | 731 ± 2 | 1.06 ± 0.01 | 0.24 ± 0.23 | 1.93 ± 0.00 | 698 ± 3 |
| 1035–ferrite-pearlite | 841 ± 9 | 0.91 ± 0.01 | 0.29 ± 0.07 | 1.91 ± 0.00 | 493 ± 9 |
| 1050–ferrite-pearlite | 996 ± 1 | 0.84 ± 0.00 | 0.32 ± 0.04 | 1.83 ± 0.00 | 399 ± 3 |
| 1055–ferrite-pearlite | 963 ± 8 | 0.76 ± 0.00 | 0.32 ± 0.12 | 1.85 ± 0.00 | 355 ± 1 |
| 1060–ferrite-pearlite | 1008 ± 1 | 0.72 ± 0.00 | 0.33 ± 0.00 | 1.79 ± 0.00 | 324 ± 2 |
| 1065–ferrite-pearlite | 1030 ± 3 | 0.70 ± 0.00 | 0.33 ± 0.14 | 1.81 ± 0.00 | 305 ± 2 |
| 1080–pearlite | 1188 ± 3 | 0.71 ± 0.01 | 0.36 ± 0.05 | 1.71 ± 0.00 | 303 ± 2 |
| AISI-Group B | Coercivity (A·m−1) | Remanence (T) | Hysteresis Loss (W·kg−1) | Magnetic
Saturation (T) | Maximum Relative Permeability |
| 1080–ILS = 94–97 nm | 1279 ± 25 | 0.74 ± 0.03 | 0.38 ± 0.15 | 1.71 ± 0.00 | 264 ± 3 |
| 1080–ILS = 101–106 nm | 1206 ± 11 | 0.75 ± 0.00 | 0.36 ± 0.10 | 1.71 ± 0.00 | 276 ± 1 |
| 1080–ILS = 122–129 nm | 1188 ± 3 | 0.71 ± 0.00 | 0.36 ± 0.05 | 1.78 ± 0.00 | 304 ± 2 |
| 1080–ILS = 125–133 nm | 1122 ± 7 | 0.76 ± 0.02 | 0.35 ± 0.03 | 1.77 ± 0.02 | 306 ± 1 |
| 1080–ILS = 149–158 nm | 1058 ± 3 | 0.73 ± 0.00 | 0.34 ± 0.02 | 1.76 ± 0.00 | 310 ± 4 |
| 1080–ILS = 179–192 nm | 935 ± 5 | 0.68 ± 0.00 | 0.29 ± 0.13 | 1.75 ± 0.00 | 329 ± 1 |
Table 5.
Mean size of spheroidized precipitates of samples annealed at different soaking times.
Table 5.
Mean size of spheroidized precipitates of samples annealed at different soaking times.
| AISI | Annealing Temperature (°C) | Annealing Time (h) | Cementite Precipitate Size (µm) |
|---|
| Mean | Standard
Deviation | 95% Confidence Interval |
|---|
| Lower Bound | Upper Bound |
|---|
| 1080 | 700 | 8 | 0.74 | 0.42 | 0.66 | 0.82 |
| 1080 | 700 | 24 | 1.10 | 0.76 | 0.94 | 1.25 |
| 1080 | 700 | 72 | 1.57 | 0.80 | 1.41 | 1.73 |
Table 6.
Mechanical properties of the various microstructures of group C obtained from AISI 1080 steels.
Table 6.
Mechanical properties of the various microstructures of group C obtained from AISI 1080 steels.
| AISI-Group C | Sample Name | Yield Strength (MPa) | Ultimate
Tensile Strength (MPa) | Elongation (%) | Reduction in Area (%) | Vickers Hardness
Number (HV) |
|---|
1080–Fine pearlite
(ILS = 94–97 nm) | FP | 857 ± 5 | 1252 ± 2 | 8.1 ± 0.9 | 53.1 ± 0.6 | 374 ± 12 |
1080–Coarse pearlite
(ILS = 179–192 nm) | CP | 598 ± 2 | 1045 ± 1 | 10.9 ± 0.9 | 50.4 ± 0.9 | 322 ± 17 |
1080–Spheroidite
(PFe3C = 0.66–0.83 µm) | S8 | 385 ± 1 | 641 ± 1 | 15.9 ± 1.2 | 60.0 ± 0.9 | 197 ± 7 |
1080–Spheroidite
(PFe3C = 0.94–1.25 µm) | S24 | 349 ± 1 | 571 ± 1 | 12.9 ± 2.1 | 60.5 ± 0.3 | 184 ± 4 |
1080–Spheroidite
(PFe3C = 1.41–1.73 µm) | S72 | 306 ± 2 | 504 ± 1 | 16.4 ± 1.3 | 62.6 ± 0.5 | 181 ± 5 |
| 1080–Martensite | M | - | - | - | - | 794 ± 10 |
| 1080–Tempered martensite | TM | 1190 ± 3 | 1390 ± 2 | 5.2 ± 0.7 | 44.3 ± 1 | 351 ± 11 |
Table 7.
Electrical resistivity measurements of AISI 1080 steels of group C performed at a controlled temperature of 35 °C.
Table 7.
Electrical resistivity measurements of AISI 1080 steels of group C performed at a controlled temperature of 35 °C.
| AISI-Group C | Electrical Resistivity (µohm.cm) |
|---|
| 1080–Fine pearlite (ILS = 94–97 nm) | 22.74 ± 0.02 |
| 1080–Coarse pearlite (ILS = 179–192 nm) | 22.28 ± 0.02 |
| 1080–Spheroidite (PFe3C = 0.66–0.83 µm) | 19.96 ± 0.02 |
| 1080–Spheroidite (PFe3C = 0.94–1.25 µm) | 19.77 ± 0.01 |
| 1080–Spheroidite (PFe3C = 1.41–1.73 µm) | 19.57 ± 0.02 |
| 1080–Martensite | 33.34 ± 0.01 |
| 1080–Tempered martensite | 22.11 ± 0.01 |
Table 8.
Magnetic properties of the various microstructures of group C obtained from AISI 1080 steels.
Table 8.
Magnetic properties of the various microstructures of group C obtained from AISI 1080 steels.
| AISI-Group C | Coercivity (A.m−1) | Remanence (T) | Hysteresis Loss (W.kg−1) | Magnetic
Saturation (T) | Maximum Relative Permeability |
|---|
1080–Fine pearlite
(ILS = 94–97 nm) | 1279 ± 25 | 0.74 ± 0.03 | 0.38 ± 0.14 | 1.71 ± 0.00 | 264 ± 3 |
1080–Coarse pearlite
(ILS = 179–192 nm) | 935 ± 5 | 0.68 ± 0.00 | 0.29 ± 0.13 | 1.75 ± 0.00 | 328 ± 1 |
1080–Spheroidite
(PFe3C = 0.66–0.83 µm) | 673 ± 6 | 0.91 ± 0.00 | 0.24 ± 0.06 | 1.66 ± 0.00 | 535 ± 11 |
1080–Spheroidite
(PFe3C = 0.94–1.25 µm) | 609 ± 8 | 0.84 ± 0.00 | 0.21 ± 0.05 | 1.71 ± 0.01 | 549 ± 1 |
1080–Spheroidite
(PFe3C = 1.41–1.73 µm) | 561 ± 10 | 0.94 ± 0.00 | 0.21 ± 0.01 | 1.78 ± 0.00 | 730 ± 7 |
| 1080–Martensite | 3231 ± 18 | 0.70 ± 0.00 | 0.73 ± 0.09 | 1.35 ± 0.00 | 111 ± 1 |
| 1080–Tempered martensite | 1502 ± 5 | 1.14 ± 0.00 | 0.54 ± 0.03 | 1.83 ± 0.01 | 359 ± 2 |
| Publisher’s Note: MDPI stays neutral with regard to jurisdictional claims in published maps and institutional affiliations. |
© 2022 by the authors. Licensee MDPI, Basel, Switzerland. This article is an open access article distributed under the terms and conditions of the Creative Commons Attribution (CC BY) license (https://creativecommons.org/licenses/by/4.0/).


 ,
, 


