Article

Defect Structure and Upconversion Luminescence Properties of LiNbO3 Highly Doped Congruent In:Yb:Ho:LiNbO3 Crystals

MIIT Key Laboratory of Critical Materials Technology for New Energy Conversion and Storage, School of Chemistry and Chemical Engineering & State Key Laboratory of Urban Water Resource and Environment & Key Laboratory of Micro-Systems and Micro-Structures, Ministry of Education, Harbin Institute of Technology, Harbin 150001, China
*
Author to whom correspondence should be addressed.
Crystals 2022, 12(5), 710; https://doi.org/10.3390/cryst12050710
Submission received: 31 March 2022 / Revised: 11 May 2022 / Accepted: 13 May 2022 / Published: 17 May 2022
(This article belongs to the Section Inorganic Crystalline Materials)

Abstract

:
Congruent In:Yb:Ho: LiNbO 3 crystals with different In 3 + concentrations have been grown by Czochralski method. Red and green upconversion emissions were observed under 980 nm excitation at room temperature. The effect of In 3 + on the upconversion luminescence was studied in association with the defect structure caused by In 3 + doping. Infrared transmission spectra indicate a clear shift of the OH absorption peak along with an increase of doped In 3 + concentrations, owing to the occupation of I n L i 2 + blow the threshold concentration (3%) that suppresses the N b L i 4 + defects, and the occupation of I n N b 2 and I n L i 2 + above the threshold. Moreover, In 3 + induced upconversion luminescence intensity changes were observed to be consistent with the measured lifetime and the OH group content changes, manifesting the highest upconversion luminescence at In 3 + concentration of 1 mol%. Mechanistic investigations indicated that both the green (at 548 nm) and the red (666 nm) emissions involve two-photon processes, being ascribed to two sequential energy transfers from to the excited Yb 3 + ions to the Ho 3 + ions. These results suggests that In:Yb:Ho: LiNbO 3 crystals provide opportunities for strong short wavelength up conversion lasers and related laser devices.

1. Introduction

Lithium niobite ( LiNbO 3 ) crystals possess excellent electro-optic (EO), acousto-optic (AO) and nonlinear optical properties, finding many applications in optical waveguides, piezoelectric sensors, optical modulators, and non-linear lasers [1,2,3,4,5]. Importantly, the LiNbO 3 also holds good promise as the host material to incorporate lanthanide dopants to produce down-shifting luminescence such as 1.5 μ m from trivalent erbium ( Er 3 + ) for telecommunications waveguide amplifier applications or upconversion luminescence from rare earth ions such as neodymium ( Nd 3 + ) and Er 3 + ions for potential upconversion laser applications [6,7,8,9]. This is because LiNbO 3 has relatively low cutoff phonon energy that can minimize nonradiative losses in the intermediate states of lanthanides and have low symmetry crystal field surrounding lanthanides that favors their luminescence.
Trivalent holmium ( Ho 3 + ) ions, commonly known as a kind of active ions of laser crystals, possess a ladder-like energy level structures that are beneficial to produce upconversion luminescence. This enables Ho: LiNbO 3 crystal to combine the nonlinear optical properties of LiNbO 3 crystal and the upconversion luminescence properties of Ho 3 + , intriguing for both fundamental research as well as many optoelectronic applications. Moreover, a study of the transition characteristics of Ho 3 + in the LiNbO 3 crystal can provide important spectroscopy parameters to guide the design of the waveguide amplifier and waveguide upconversion laser [7,8,9]. On the other hand, trivalent ytterbium ( Yb 3 + ) are typically known to be the most effective sensitizing agent for a number of lanthanide activators (e.g., Tm 3 + , Er 3 + , and Ho 3 + ) to produce upconversion, this is because Yb 3 + ions have larger absorption cross-sections (about one order of magnitude higher), and possess only two energy levels with energy spacing matching that of energy level of Ho 3 + ions. This sensitizing effect hundreds of times higher upconversion luminous efficiency [10,11]. Moreover, the absorption peak of Yb 3 + matches the commercial InGaAs diode laser output at 980 nm, facilitating the implementation of light excitation. As a consequence, Yb 3 + was adopted here as the sensitizing agent in the Yb:Ho: LiNbO 3 crystal to improve the upconversion luminous efficiency.
The applications of Ho: LiNbO 3 and Yb:Ho: LiNbO 3 are severely limited by the photodamage effect when exposed to high laser irradiance. photodamage resistance ability. Fortunately, doping the impurities ions, such as Mg 2 + [12], Zn 2 + [13], In 3 + [14], Sc 3 + , Zr 4 + , Hf 4 + and so on, with photodamage resistance ability can alleviate this problem. Among these impurity cations, In 3 + has the lowest threshold concentration among these cations, about 3.0 mol%, compared with Mg 2 + : 5 mol% and Zn 2 + : 6.5 mol%. Besides, Along the improvement of resistance to photodamage, doping these impurity ions can possibly later the local environment of doped lanthanide as well as the trap structure of the crystal, thus impacting the lanthanide upconverion luminescence.
Here, we have grown a set of congruent In:Yb:Ho: LiNbO 3 crystals with a set of In dopants while maintaining identical concentrations of Yb and Ho, and measured their infrared transmission spectra to investigate the movement mechanism of the OH absorption peak induced by In 3 + . Moreover, the upconversion emission spectra were acquired and analyzed under continuous-wave laser excitation at ∼980 nm. The involved upconversion luminescence mechanisms were discussed.

2. Experiment

2.1. Growth of the In:Yb:Ho:LiNbO3 Crystal

Congruent In:Yb:Ho: LiNbO 3 crystals were grown by Czochralski method, which incorporated four different mole fractions of In 2 O 3 (0, 0.5%, 1.5% and 1.75%), and 0.25% Yb 2 O 3 and 0.25% Ho 2 O 3 . These four crystals were marked as IYH1, IYH2, IYH3 and IYH4 (see Table 1 for details). The axial temperature gradient of the middle frequency growth furnace was 50 °C/cm, crystalline growth velocity was 1∼2.5 mm/h, crystal rotation speed was between from 14 r/min to 24 r/min. The size of the crystal growth Φ 20 × 20 mm 3 , the polarization current density was 5 mA/ cm 2 and the polarization of temperature of the crystal was 1200 °C. The crystal was cut into the crystal chips with size of 10 mm × 8 mm × 3 mm (z, x, y) from middle of the crystal and polished to the optical level. The structure of these crystals were not measured, but should be similar to that of In:Fe: LiNbO 3 in our previous work [15].

2.2. Spectroscopic Measurements

The Nicolet Avatar-370 Fourier transform infrared (FTIR) spectrometer was used to measure the transmission spectra of the four In:Yb:Ho: LiNbO 3 crystals in a spectroscopic range from 3400 cm 1 to 3700 cm 1 . Up conversion emission spectra of the In:Yb:Ho: LiNbO 3 were measured using Zolix monochromator under 980 nm excitation with an InGaAs diode laser (output 100 mW).

3. Results and Discussions

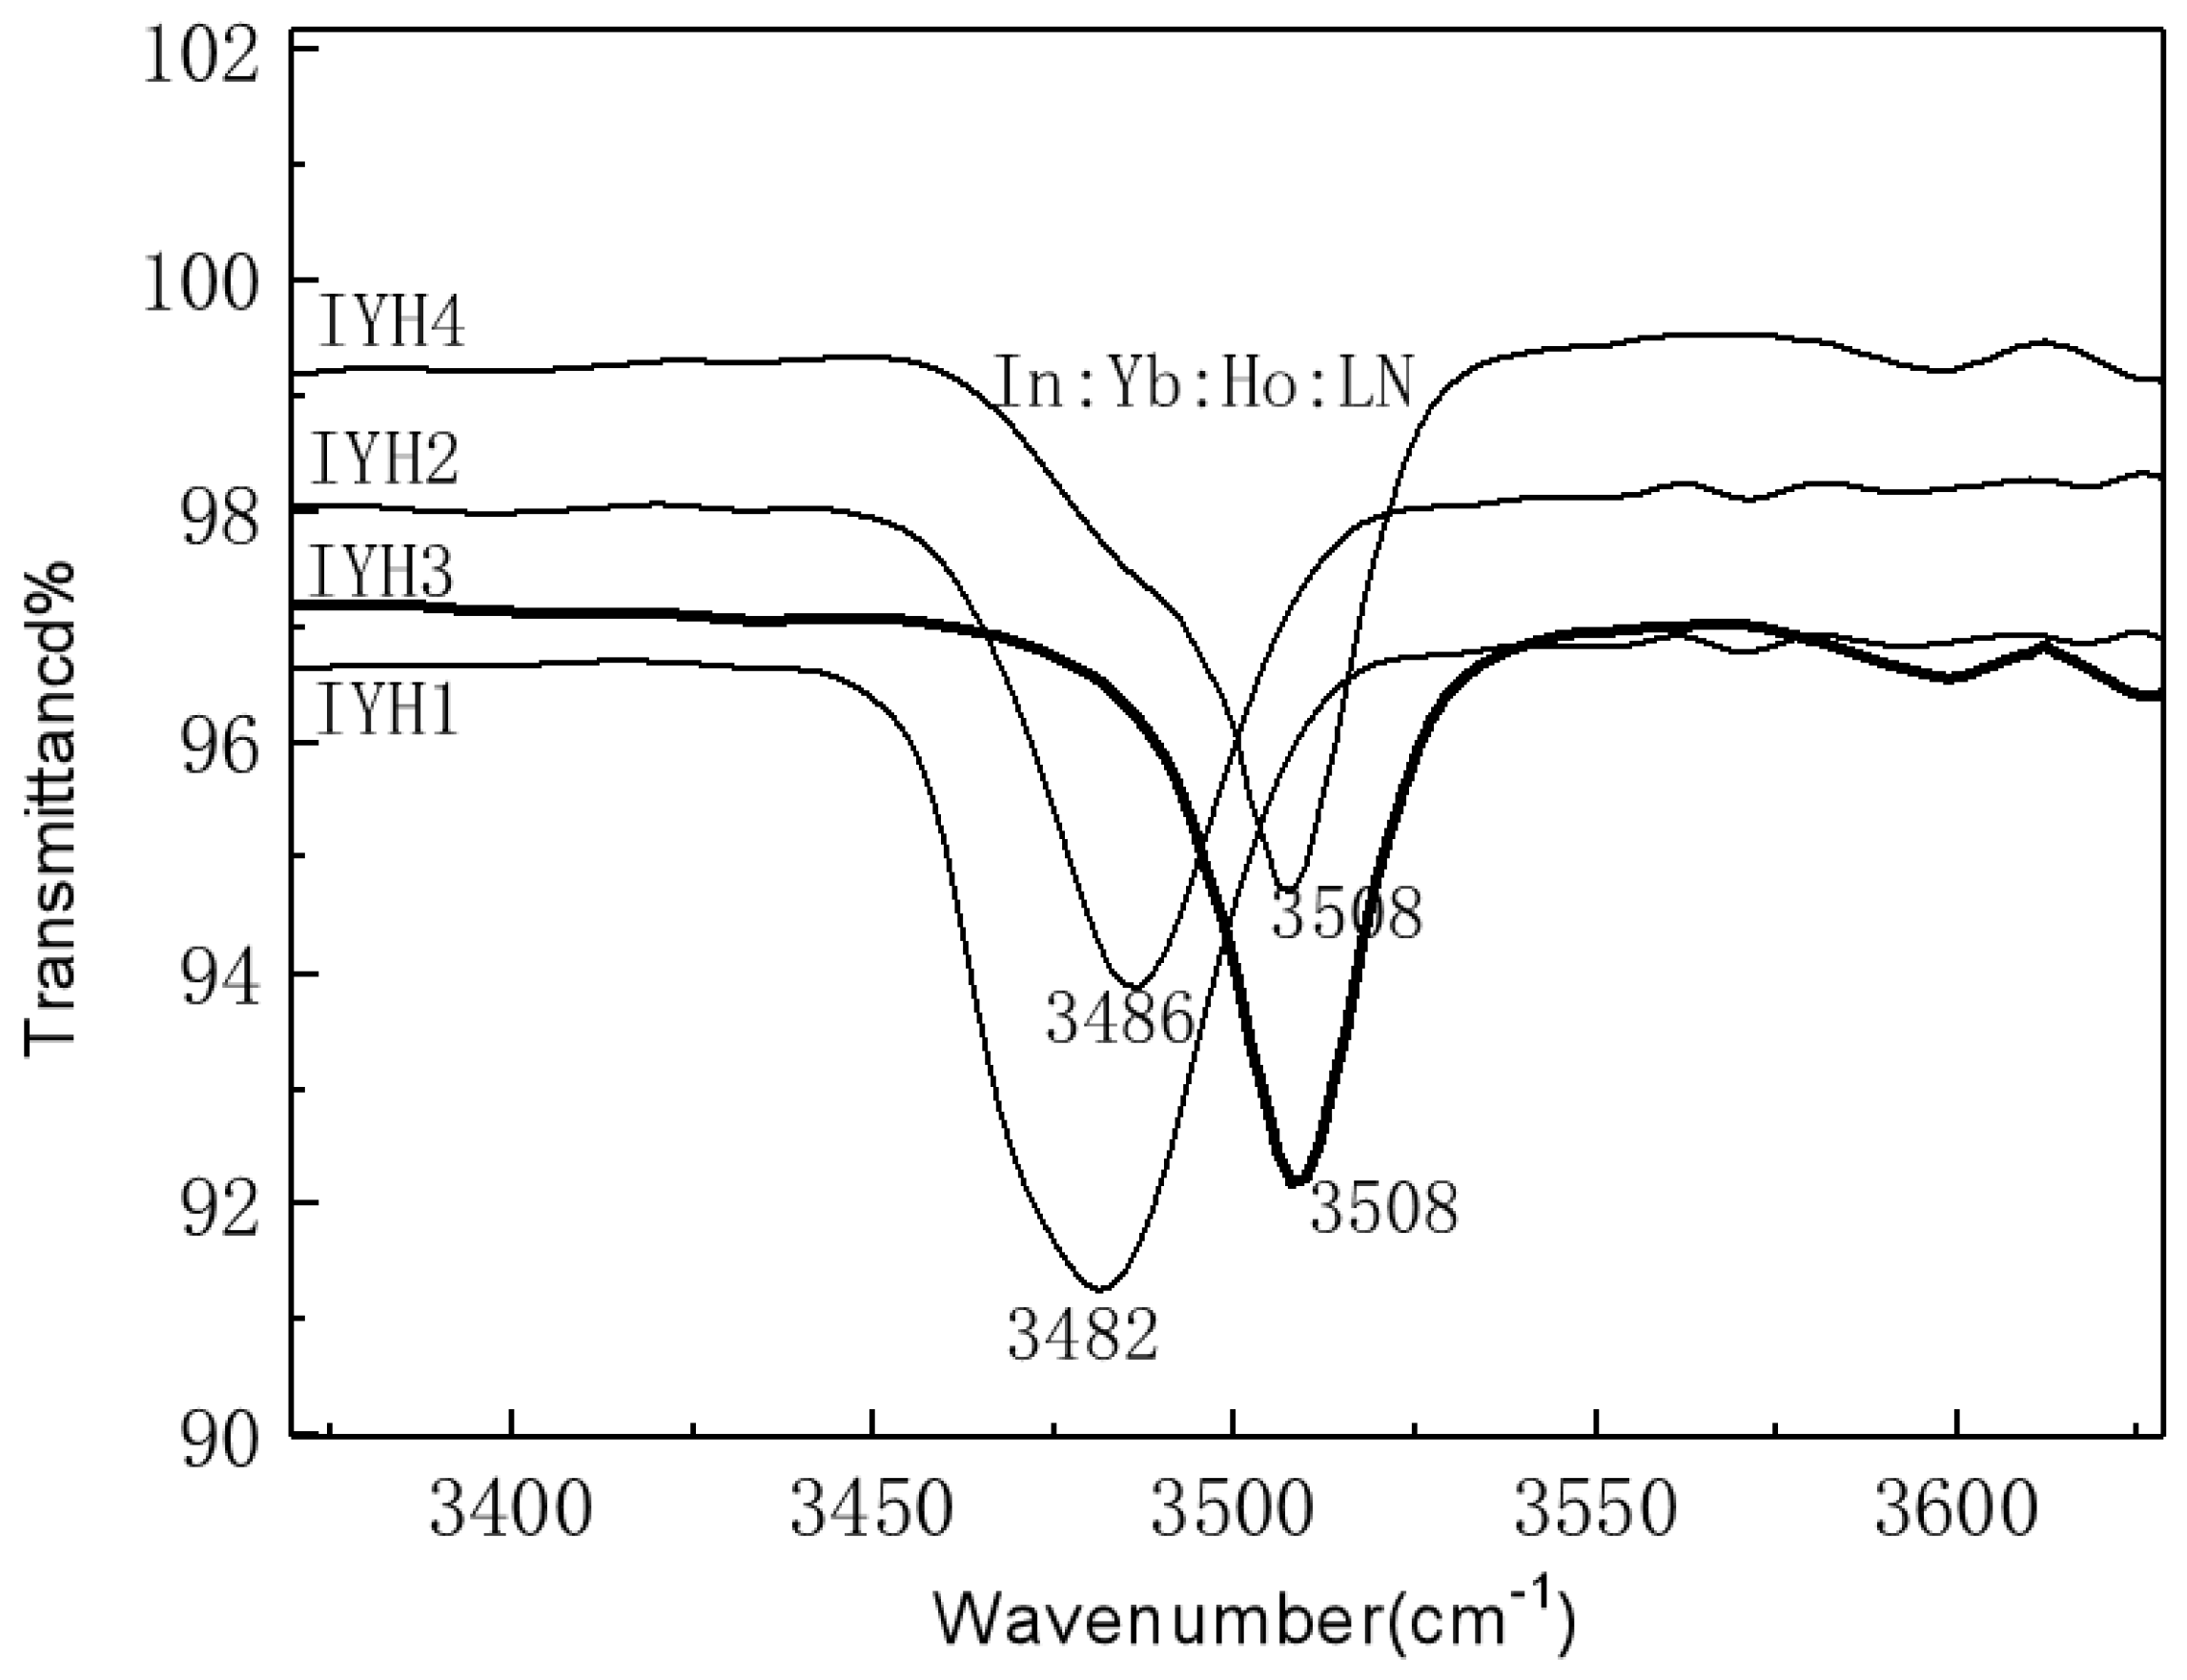
3.1. IR Transmittance Spectra Analysis

As shown in Figure 1, the OH absorption peaks were observed at 3482 cm 1 , 3486 cm 1 , 3508 cm 1 and 3508 cm 1 , corresponding to the ones in sample IYH1, IYH2, IYH3 and IYH4, respectively. OH defects formed in LiNbO 3 were reported to be due to the capture of protons by O 2 + anions [16]. It was reported that the OH absorption peak was around 3485 cm 1 when the doped concentration was below its threshold, while The OH absorption peak moved to 3508 cm 1 when the doped concentration exceeded its threshold [17]. That indicateds the threshold of In 3 + in In:0.5%Yb:0.5%Ho: LiNbO 3 crystal here is around 3 mol%. It was confirmed that H + occupies the Li site through 1 H nuclear magnetic resonance (NMR) analysis of the LiNbO 3 crystal. There are two kinds of intrinsic defects, Li vacancy V L i and antiposition Nb N b L i 4 + in congruent LiNbO 3 crystal [18]. V L i with negative charge is easy to attract H + to its lattice site, so it is regarded that the OH absorption peak of LiNbO 3 mainly reflect the vibration condition around Li vacancy V L i The OH absorption peak at 3482 cm 1 in the sample IYH1 reflects the local V L i - N b L i 4 + -OH trap group vibration. As the contents of Yb 3 + and Ho 3 + are very low compared to Li and Nb, their impact on the OH absorption peak is rather small or negligible. In the IYH2 sample, N b L i 4 + is replaced by In 3 + , forming the I n L i 2 + trap structure. This results in the reduction of V L i concentration, and thus the diminished absorption ability of H + , causing the reduction and narrowing of OH absorption peak as well as the peak shift from 3482 cm 1 to 3486 cm 1 . When the content of In equals or exceeds the threshold content (3%), the N b L i 4 + was completely replaced by In 3 + , and In 3 + begins to substitute Nb 5 + and Li + in their lattice site forming the I n N b 2 and I n L i 2 + trap structures. Because the I n N b 2 trap structure have stronger attraction to the H + relative to V L i the H + were gathered around the I n N b 2 trap structure, the OH absorption peak at this time mainly reflects the vibration condition around OH , i.e., I n N b 2 -OH- I n L i 2 + resulting in the shift of absorption peak from 3486 to 3508 cm 1 in the samples of IYH3 and IYH4. In summary, when the concentration of In 3 + under the threshold, In 3 + , Yb 3 + and Ho 3 + occupy the Li site, while, when it exceeds the threshold, In 3 + occupies the Li and Nb site, Yb 3 + and Ho 3 + occupies both Li site [19].

3.2. Up Conversion Process of In:Yb:Ho:LiNbO3

Under the pumping of 980 nm diode laser with a power of 100 mW, the upconversion emission spectra of In:Yb:Ho: LiNbO 3 were measured and shown in Figure 2a. As one can see, there are two emission peaks; the green one centered at 548 nm correspondings to the radiative transition of Ho 3 + from 5 S 2 to 5 I 8 , while the red one centered at 666 nm arises from the 5 F 5 to 5 I 8 transition. The intensity of the green band is obviously stronger than the red band. The overall upconversion emission intensity varies with the doping concentrations of In 3 + ; The luminescence of the IYH2 sample is stronger than that of IYH1, this may be because of the reduced concentration of OH group, which can efficiently depopulate the excited state of Yb 3 + , decreased. When the In 3 + exceeds the threshold concentration, the emission intensities of IYH3 and IYH4 diminishes, even lower than that of IYH1. One possible reason is due to the increased vibration group energy of OH in IYH3 and IYH4 (3508 cm 1 ) than in IYH1 (3482 cm 1 ), the other possible reason is due to the formation of the I n N b 2 and I n L i 2 + trap structures that can quenches upconversion luminescence or decreases the Yb 3 + sensitization effect of Ho 3 + . In summary, when the doped In 3 + concentration is below the threshold (3 mol%), the upconversion emission increases with In 3 + dopant concentration, while drops after exceeding the threshold concentration [20,21]. The insets show four solid fluorescence decay curves and measured fluorescence lifetime. The fluorescence decay curves of the 5 S 2 5 I 8 transition in In/Er/Yb: LiNbO 3 crystals were measured and shown in the Figure 2b. These decay curves can be fitted by a single exponential function, evaluating the fluorescence lifetime to be 5.68 ms, 5.64 ms, 5.53 ms, and 5.23 ms for IYH2, IYH1, IYH3, and IYH4 crystals, respectively. The trend of lifetime change is inconsistent with the alteration of upconversion luminescence intensity, as well as with the change of the OH groups in these samples. The achieved results in In:Yb:Ho: LiNbO 3 clearly indicate that the important role of impurity doping of In on the Yb 3 + /Ho 3 + upconversion luminescence, manifesting an optimal In3+concentration of 1 mol% for the highest upconversion luminescence. Similar results were observed in Zn impurity doping on Yb 3 + /Er 3 + luminescence in Zn:Yb:Er: LiNbO 3 crystals [13,22] and Er 3 + luminescence in Zn: Er: LiNbO 3 crystals [21], indicating that impurity doping might produce pronounced effect on upconversion luminescence.

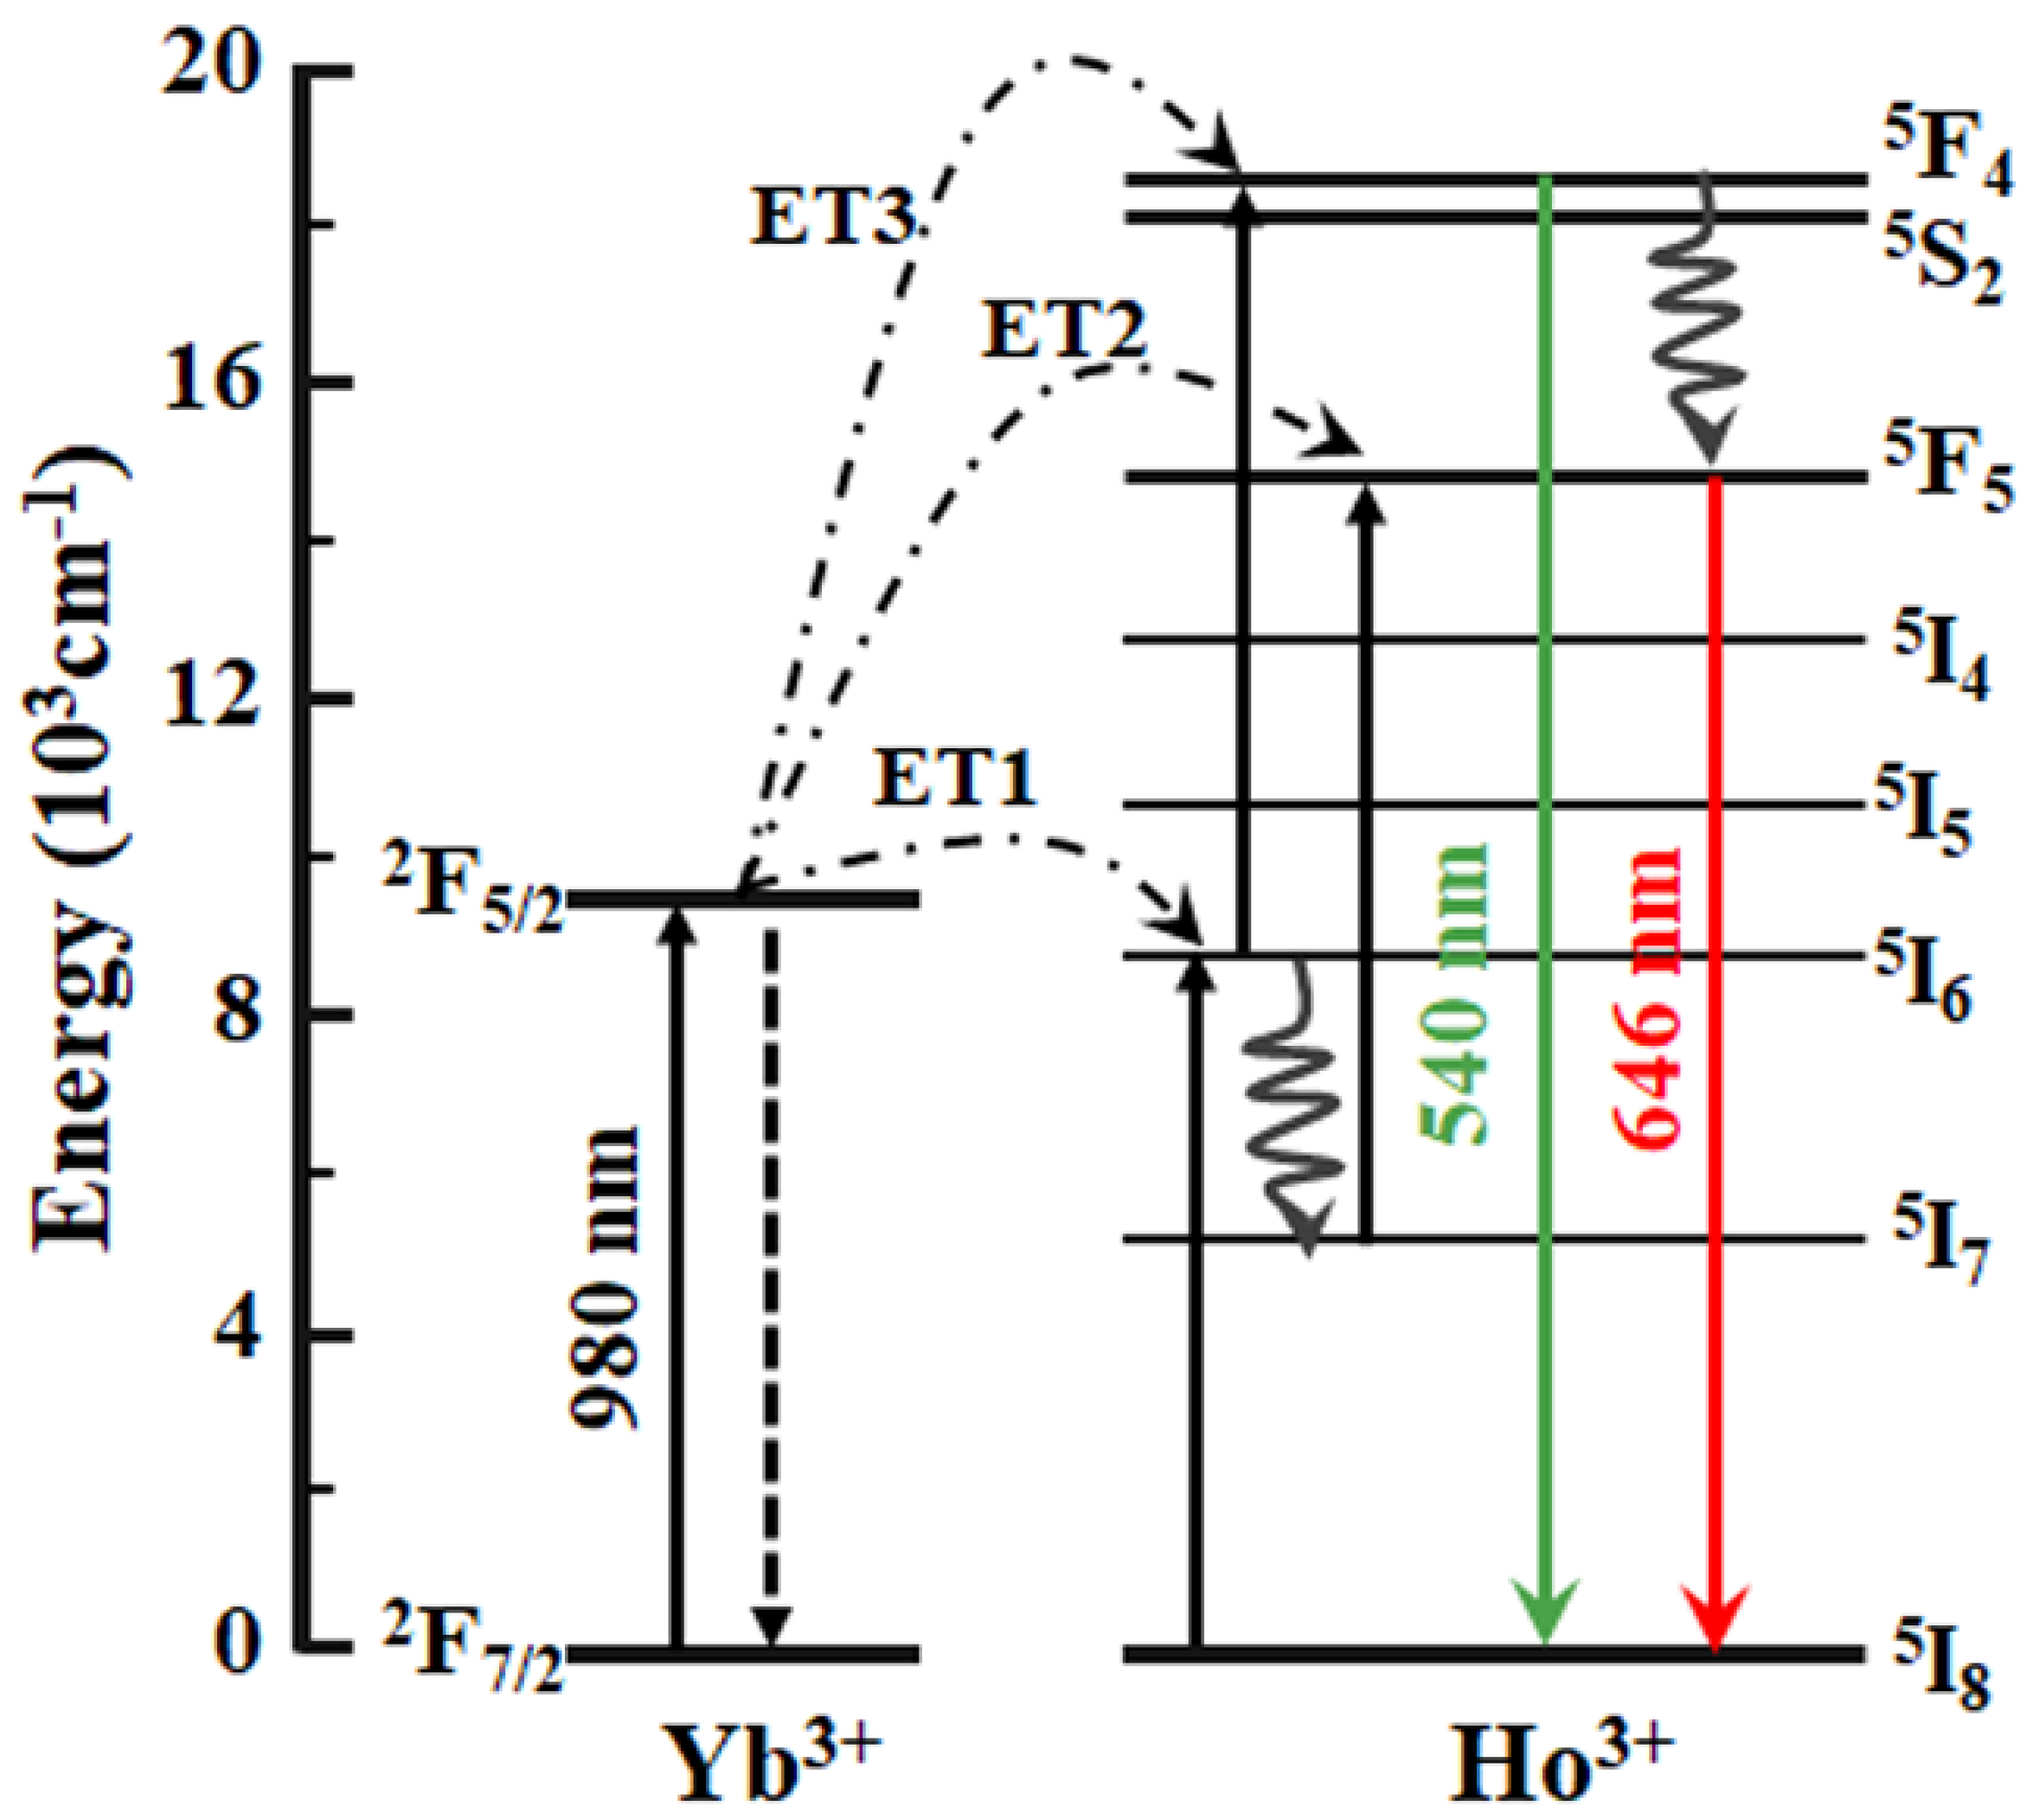
3.3. Mechanism of Upconversion Emissions

Before proposing the mechanism of upconversion emission in the In:Yb:Ho: LiNbO 3 crystal, it should be determined how many photons were involved to produce the upconversion emissions. In the process of upconversion, the lower energy photons can be converted into the higher energy photos, through sequential absorption of several photons. The relationship between the upconversion fluorescence intensity and the intensity of laser pump power can be written as
I p n
where n is the number of photons needed to produce the upconversion; From the Equation (1), another relation was obtained as
LnI = nLnP + C
As one can see, the number of photons needed in the upconversion can be calculated from the double logarithmic relationship between the intensity of laser pumping source and the intensity of upconversion emission. The slope of the linear fitting indicates the involved number of photons. A double logarithmic plotting of the intensities of the green emission at 548 nm ( 5 S 2 5 I 8 ) and of the red emission at 666 nm ( 5 F 5 5 I 8 ) against laser pumping power is shown in Figure 3. The slope of these two linear fittings are 1.95 (548 nm) and 2.03 (666 nm),respectively; both of them are around 2, indicating that both the green and the red upconversion fluorescence emissions involve two-photon processes.
The possible upconversion luminescence mechanism of the In:Yb:Ho: LiNbO 3 is depicted in Figure 4 and can be described as follows [22]: under the pumping of the 980 nm laser, the electrons of Yb 3 + in the ground state were promoted from the ground state 2 F 7 / 2 to the excited state 2 F 5 / 2 . At the same time electrons of Ho 3 + ions in the ground state can also be excited from 5 I 8 to 5 I 6 through ground state absorption (GSA); however, due to the large energy difference between the photon energy and the energy gap (around 5000 cm 1 ), this process is inefficient. Alternatively, electrons at the energy level of 5 I 6 state can be populated by energy transfer from Yb 3 + (ET1: Yb 3 + : 2 F 5 / 2 + Ho 3 + : 5 I 8 Yb 3 + : 2 F 7 / 2 + Ho 3 + : 5 I 6 ). After that, electrons of the 5 I 6 were promoted further to the 5 S 2 state through another energy from Yb 3 + ions (ET2: Yb 3 + : 2 F 5 / 2 + Ho 3 + : 5 I 6 Yb 3 + : 2 F 7 / 2 + Ho 3 + : 5 S 2 ). The electrons at the 5 S 2 state return to the ground state and emit the photons at around 548 nm ( the green emission band). Multiphonon relaxations from the 5 S 2 state can populate the 5 F 5 state. In addition, multiphonon relaxation from the 5 I 6 sate can populate the 5 I 7 stat, from which electrons can be promoted to the 5 F 5 state by energy transfer from Yb 3 + ions (ET3: Yb 3 + : 2 F 5 / 2 + Ho 3 + : 5 I 7 Yb 3 + : F 7 / 2 + Ho 3 + : 5 F 5 ) Radiative decay from 5 F 5 state to the ground state results in the 666 nm emission (the red emission band) [23].

4. Conclusions

To summarize, four congruent In:Yb:Ho: LiNbO 3 crystals have been grown using Czochralski method with identical amounts of Yb and Ho but varying amount of In concentrations. A clear shift of the OH absorption peak was observed when increasing the doped In 3 + concentrations, owing to the occupation of blow the threshold concentration that suppress es the N b L i 4 + defects, and the occupation of I n N b 2 and I n L i 2 + above the threshold. Moreover, measured upconversion luminescence intensities were dependent on the doped In 3 + concentrations, and were consistent with the measured lifetime and the OH group content changes, indicating the important role of In 3 + occupation sites. An optimal In 3 + concentration of 1 mol% was identified to achieve for the highest upconversion luminescence here. Mechanistic investigations indicated a two-photon upconversion process for both the green and the red upconversion emission bands, involving two sequential energy transfer from to the excited Yb 3 + ions to the Ho 3 + ions. The observed upconversion luminescence in In:Yb:Ho: LiNbO 3 crystals have important implications for potential uses in strong short wavelength upconversion lasers and related laser devices.

Author Contributions

Conceptualization, L.X. and Y.X.; methodology, Y.X.; software, G.C.; validation, L.X., Y.X. and G.C.; formal analysis, L.X.; investigation, L.X.; resources, G.C.; data curation, Y.X.; writing—original draft preparation, L.X.; writing—review and editing, G.C.; visualization, G.C.; supervision, Y.X.; project administration, L.X.; funding acquisition, G.C. All authors have read and agreed to the published version of the manuscript.

Funding

This research was funded by the National Natural Science Foundation of China (51972084 and 51672061) and the Open Fund of the State Key Laboratory of Integrated Optoelectronics (IOSKL2019KF04), the State Key Laboratory of Urban Water Resource and Environment (Harbin Institute of Technology) (No. 2020DX10), the Young Scientist Workshop (Harbin Institute of Technology) (AUGA5710094420), and the Fundamental Research Funds for the Central Universities, China (AUGA5710052614).

Institutional Review Board Statement

Studies not involving humans or animals.

Informed Consent Statement

The study did not involve humans.

Data Availability Statement

Not applicable.

Acknowledgments

The authors would like to thank Xu Wusheng for his revision of the English style of the paper.

Conflicts of Interest

The authors declare no conflict of interest. The funders had no role in the design of the study; in the collection, analyses, or interpretation of data; in the writing of the manuscript, or in the decision to publish the results.

References

  1. Eyring, L.; Gschneidner, K.A.; Lander, G.H. Handbook on the Physics and Chemistry of Rare Earths. 2001. Available online: https://www.elsevier.com/books/handbook-on-the-physics-and-chemistry-of-rare-earths/eyring/978-0-444-50762-4 (accessed on 10 February 2022).
  2. Bhatt, R.; Kar, S.; Bartwal, K.S.; Wadhawan, V.K. The effect of Cr doping on optical and photoluminescence properties of LiNbO3 crystals. Solid State Commun. 2003, 127, 457–462. [Google Scholar] [CrossRef]
  3. Ryba-Romanowski, W.; Golab, S.; Dominiak-Dzik, G.; Solarz, P.; Lukasiewicz, T. Conversion of infrared radiation into red emission in YVO4:Yb,Ho. Appl. Phys. Lett. 2001, 79, 3026–3028. [Google Scholar] [CrossRef]
  4. Qiu, J.; Shojiya, M.; Kawamoto, Y. Sensitized Ho3+ up-conversion luminescence in Nd3+-Yb3+-Ho3+ co-doped ZrF4-based glass. J. Appl. Phys. 1999, 86, 909–913. [Google Scholar] [CrossRef]
  5. Auzel, F. Upconversion and anti-Stokes processes with f and d ions in solids. Cheminform 2004, 35, 139. [Google Scholar] [CrossRef]
  6. Chen, G.; Yang, L.; Chao, X.; Hao, S.; Qiu, H.; Liang, S.; Xu, Y.; Yang, C. Generation of 1.5 μm emission through an upconversion-mediated looping mechanism in Er3+/Sc3+-codoped LiNbO3 single crystal. Opt. Lett. 2012, 37, 1268. [Google Scholar] [CrossRef]
  7. Rodenas, A.; Garcia, J.; Jaque, D.; Torchia, G.A.; Mendez, C.; Arias, I.; Roso, L.; Agullo-Rueda, F. Optical investigation of femtosecond laser induced microstress in neodymium doped lithium niobate crystals. J. Appl. Phys. 2006, 100, 1695. [Google Scholar] [CrossRef]
  8. Jaque, D.; Chen, F.; Tan, Y. Scanning confocal fluorescence imaging and micro-Raman investigations of oxygen implanted channel waveguides in Nd:MgO:LiNbO3. Appl. Phys. Lett. 2008, 92, 253. [Google Scholar] [CrossRef]
  9. Rodenas, A.; Maestro, L.M.; Ramirez, M.O.; Torchia, G.A.; Jaque, D. Anisotropic lattice changes in femtosecond laser inscribed Nd3+:MgO:LiNbO3 optical waveguides. J. Appl. Phys. 2009, 106, 013110. [Google Scholar] [CrossRef]
  10. Gouveianeto, A.S.; Bueno, L.A.; Do Nascimento, R.F.; Da Silva, E.A.; Da Costa, E.B.; Do Nascimento, V.B. White light generation by frequency upconversion in Tm3+/Ho3+/Yb3+-codoped fluorolead germanate glass. Appl. Phys. Lett. 2007, 91, 091114. [Google Scholar] [CrossRef]
  11. Hewes, R.A. Multiphoton excitation and efficiency in the Yb3+-R.E.3+ (Ho3+, Er3+, Tm3+) systems. J. Lumin. 1970, 1, 778–796. [Google Scholar] [CrossRef]
  12. Zhen, X.H.; Li, H.T.; Sun, Z.J.; Ye, S.J.; Zhao, L.C.; Xu, Y.H. Defect structure and optical damage resistance of Mg:Mn:Fe:LiNbO3 crystals. J. Phys. D Appl. Phys. 2004, 37, 634. [Google Scholar] [CrossRef]
  13. Fan, Y.; Xia, S.; Yu, Z.; Zheng, W.; Sun, F. Defect structure and increased photorefractive damage resistance of ZnO highly doped congruent LiNbO3:Ho:Yb single crystals. Opt. Commun. 2013, 291, 313–316. [Google Scholar] [CrossRef]
  14. Xu, Z.; Xu, S.; Jian, Z.; Liu, X.; Xu, Y. Growth and photorefractive properties of In:Fe:LiNbO3 crystals with various [Li]/[Nb] ratios. J. Cryst. Growth 2005, 280, 227–233. [Google Scholar] [CrossRef]
  15. Kong, Y.; Xu, J.; Zhang, W.; Zhang, G. The site occupation of protons in lithium niobate crystals. J. Phys. Chem. Solids 2000, 61, 1331–1335. [Google Scholar] [CrossRef]
  16. Herrington, J.R.; Dischler, B.; Räuber, A.; Schneider, J. An optical study of the stretching absorption band near 3 microns from OH-defects in LiNbO3. Solid State Commun. 1973, 12, 351–354. [Google Scholar] [CrossRef]
  17. Kong, Y.; Deng, J.; Zhang, W.; Wen, J.; Zhang, G.; Wang, H. OH absorption spectra in doped lithium niobate crystals. Phys. Lett. A 1994, 196, 128–132. [Google Scholar] [CrossRef]
  18. Abrahams, S.C.; Marsh, P. Defect structure dependence on composition in lithium niobate. Acta Crystallogr. Sect. B 1986, 42, 61–68. [Google Scholar] [CrossRef]
  19. Chao, X.; Chun-Lei, Z.; Li, D.; Xue-Song, L.; Lei, X.; Yu-Heng, X. OH- absorption and nonvolatile holographic storage properties in Mg:Ru:Fe:LiNbO3 crystal as a function of Mg concentration. Chin. Phys. B 2013, 22, 054203. [Google Scholar] [CrossRef]
  20. Xing, L.; Wu, X.; Wang, R.; Xu, W.; Qian, Y. Upconversion white-light emission in Ho3+/Yb3+/Tm3+ tridoped LiNbO3 single crystal. Opt. Lett. 2012, 37, 3537–3539. [Google Scholar] [CrossRef]
  21. Qian, Y.; Rui, W.; Xing, L.; Xu, Y.; Yang, C.; Liu, X. Influence of Zn2+ ions concentration on the optical properties of Zn/Er:LiNbO3 crystals. Cryst. Res. Technol. 2011, 46, 1137–1142. [Google Scholar] [CrossRef]
  22. Qian, Y.; Wang, R.; Chao, X.; Wu, X.; Xing, L.; Xu, Y. Optical spectroscopy and laser parameters of Zn2+/Er3+/Yb3+-tridoped LiNbO3 crystal. J. Lumin. 2012, 132, 1976–1981. [Google Scholar] [CrossRef]
  23. Li, A.H.; Zheng, Z.R.; Lu, Q.; Sun, L.; Lu, T.Q. Sensitized holmium upconversion emission in LiNbO3 triply doped with Ho3+, Yb3+, and Nd3+. J. Appl. Phys. 2008, 104, 061108. [Google Scholar] [CrossRef]
Figure 1. IR transmittance spectra of In:Yb:Ho: LiNbO 3 crystals.
Crystals 12 00710 g001
Figure 2. Upconversion emission spectra (a) and 550 nm fluorescence decay curves (b) of In:Yb:Ho: LiNbO 3 crystals under 980 nm excitation.
Crystals 12 00710 g002
Figure 3. Double logarithmic plot of the pumping power dependence of upconversion luminescence intensities (for the green emission at 548 nm, and the red emission at 666 nm) in In:Yb:Ho: LiNbO 3 .
Crystals 12 00710 g003
Figure 4. Energy level diagrams of the In:Yb:Ho: LiNbO 3 crystal and the possibly occurring upconversion mechanism.
Crystals 12 00710 g004
Table 1. Composition of In:Yb:Ho: LiNbO 3 crystals.
Sample In 2 O 3 (mol%) Yb 2 O 3 (mol%) Ho 2 O 3 (mol%)[Li/Nb]ratioName
IYH100.250.250.946Yb(0.5%):Ho(0.5%): LiNbO 3
IYH20.50.250.250.946In(1%):Yb(0.5%):Ho(0.5%): LiNbO 3
IYH31.50.250.250.946In(3%):Yb(0.5%):Ho(0.5%): LiNbO 3
IYH41.750.250.250.946In(3.5%):Yb(0.5%):Ho(0.5%): LiNbO 3
Publisher’s Note: MDPI stays neutral with regard to jurisdictional claims in published maps and institutional affiliations.

