
In Situ Measurement Method Based on Edge Detection and Superpixel for Crystallization Imaging at High-Solid Concentrations

Abstract
:1. Introduction
2. Experimental Setup
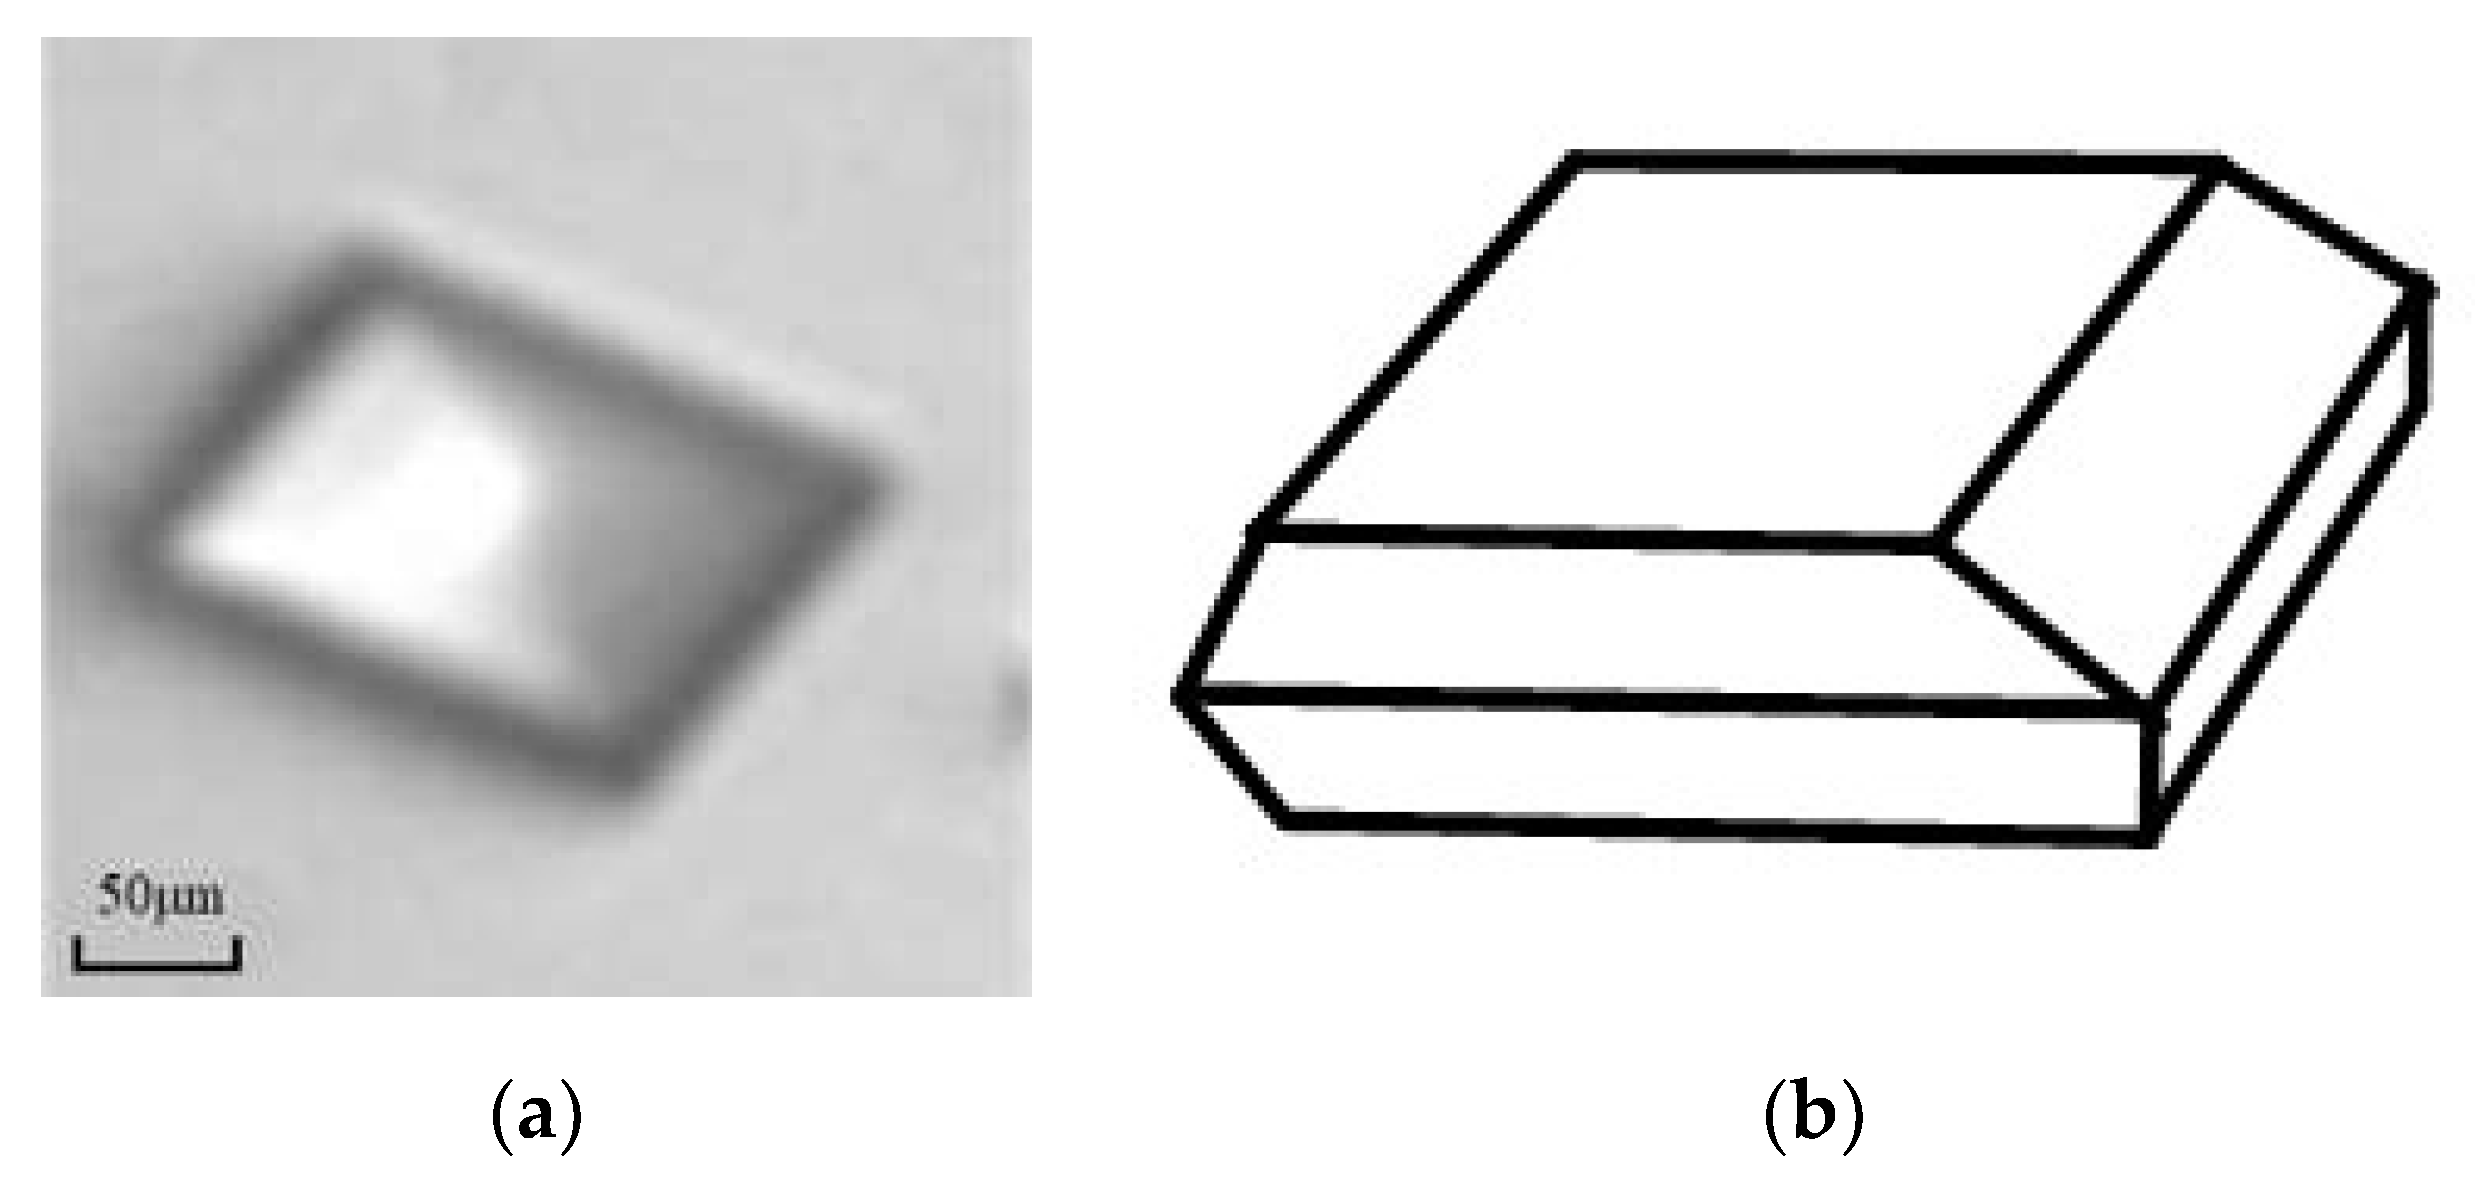
2.1. Material
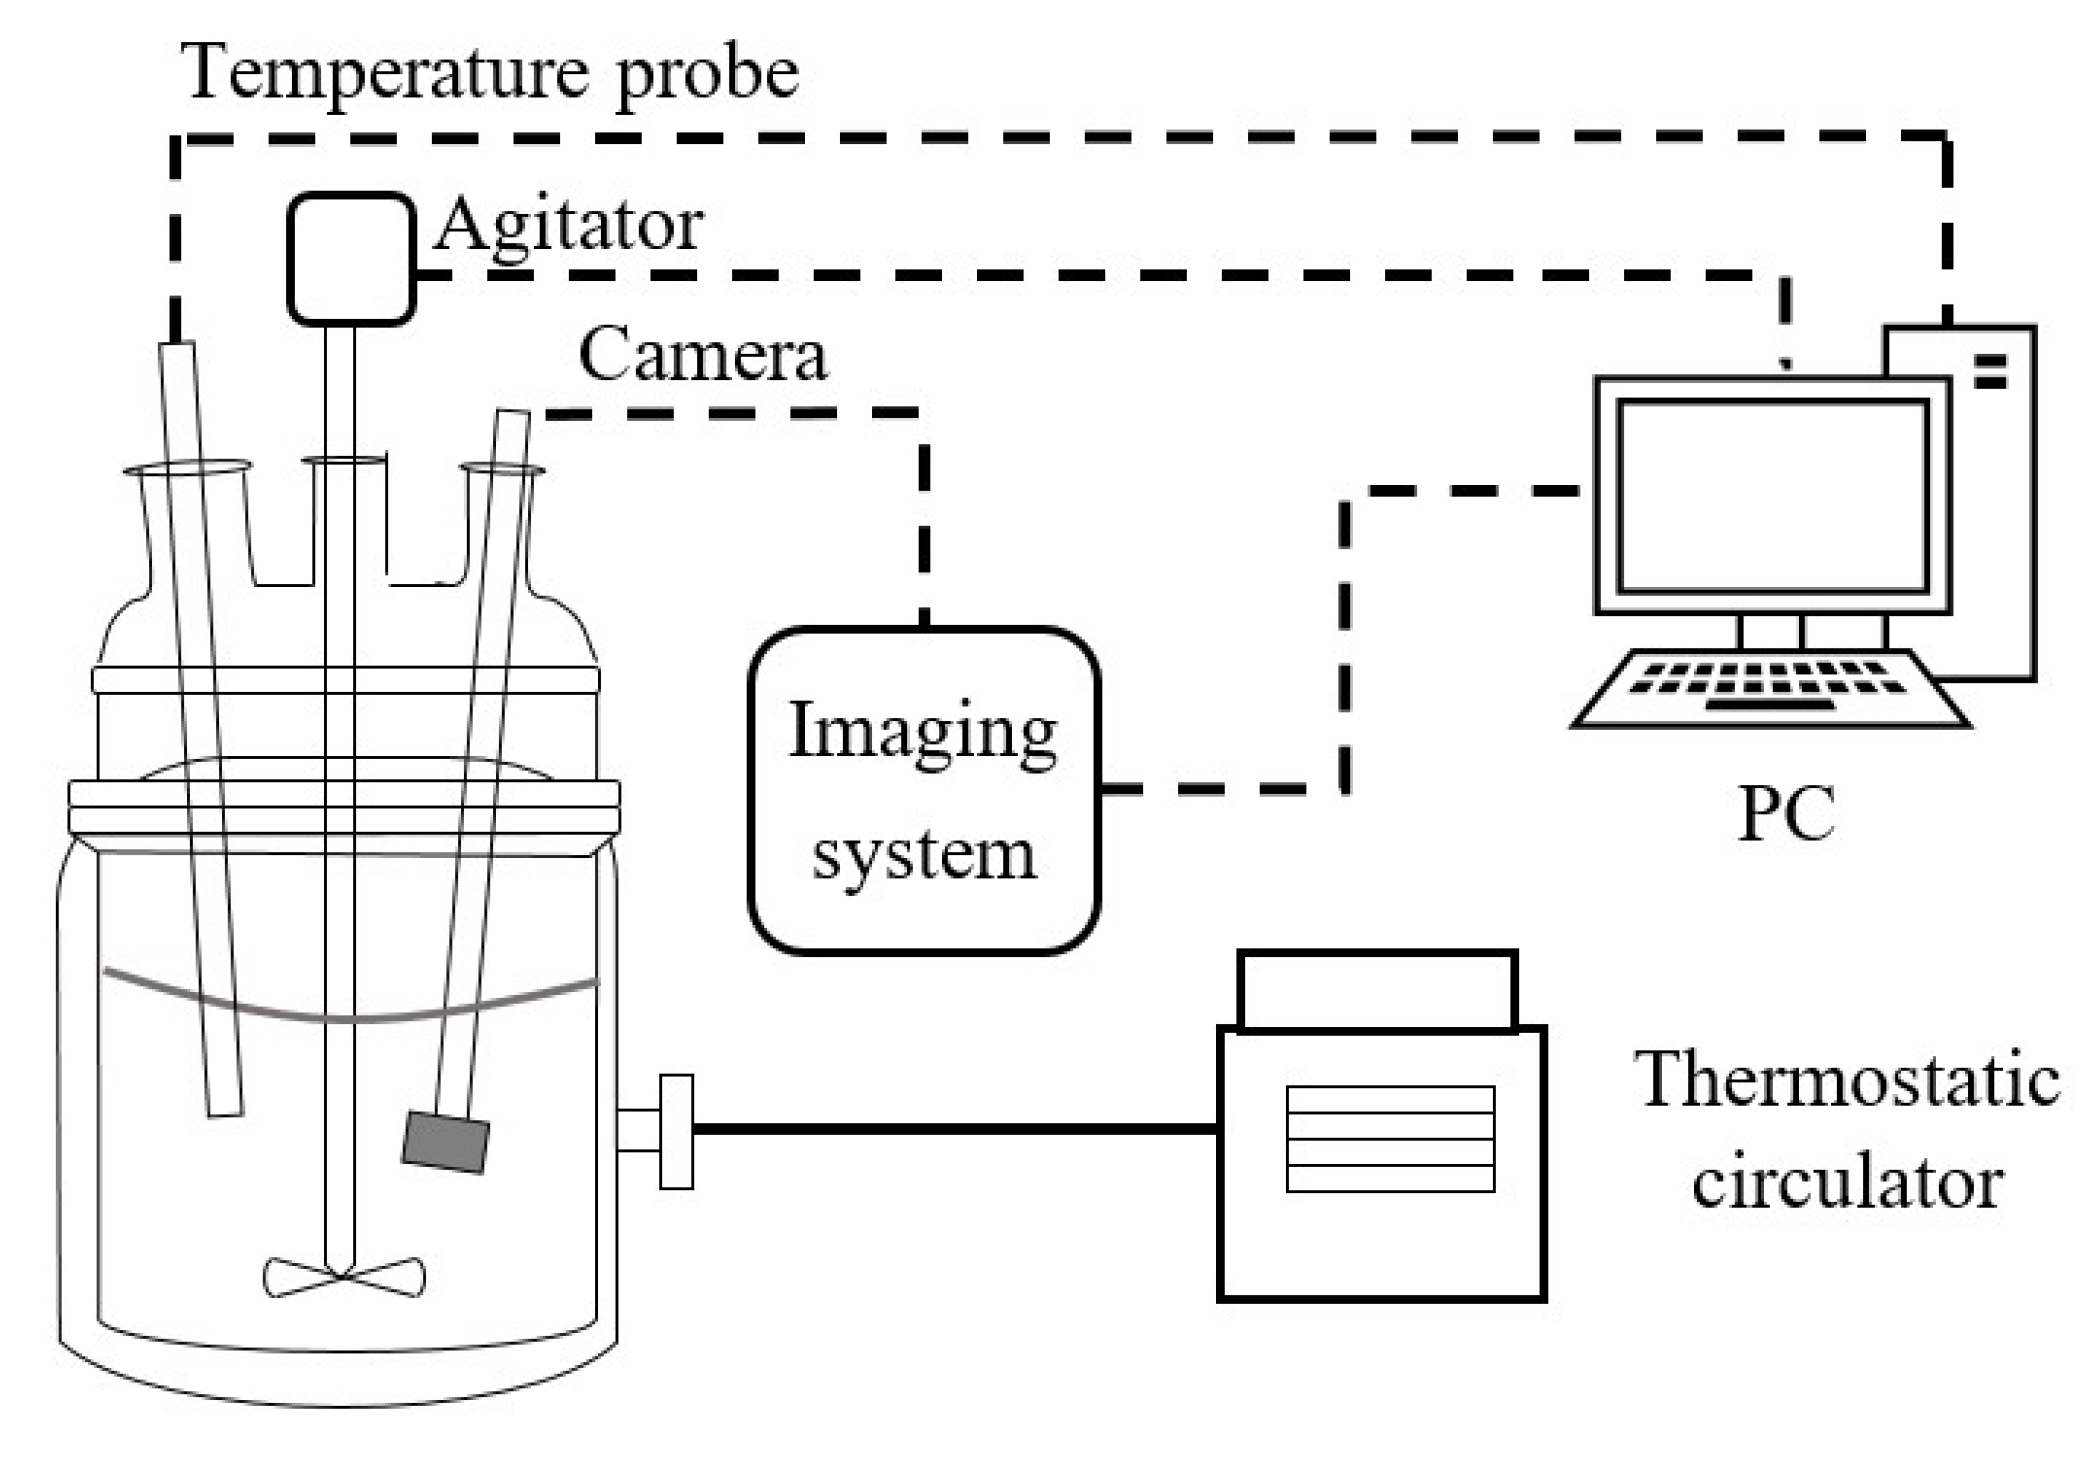
2.2. Experimental Setup
3. Crystal Image Processing
3.1. Image Filtering
3.2. Improved Canny Segmentation
3.3. Improved SLIC Superpixel Segmentation
3.4. Image Fusion
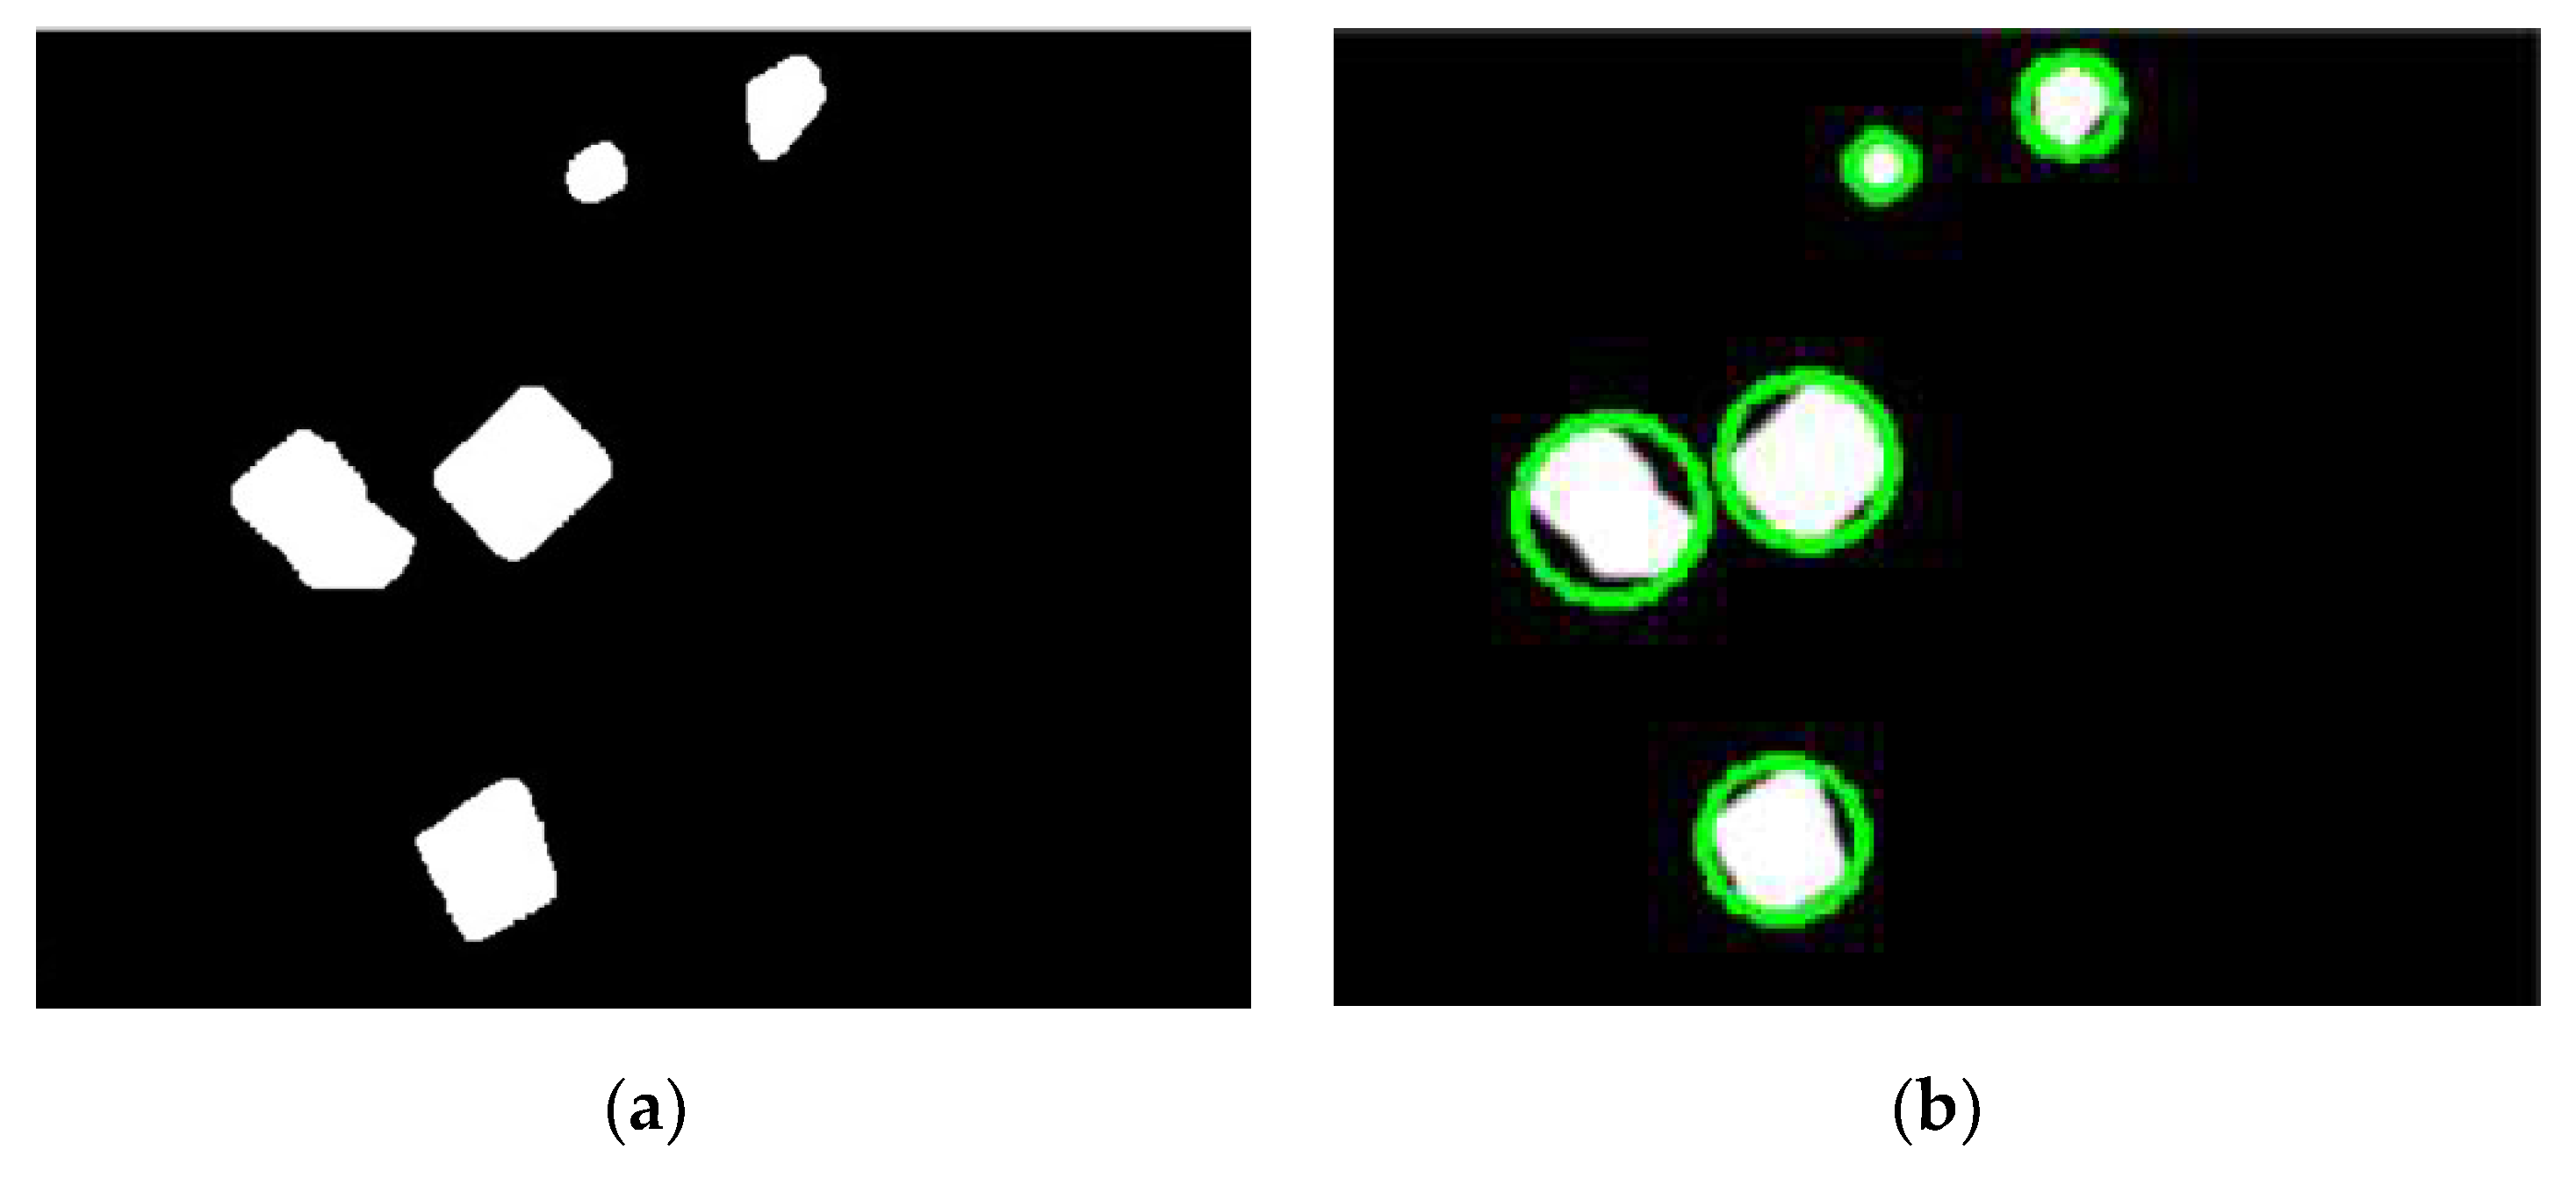
4. Size Measurement Method
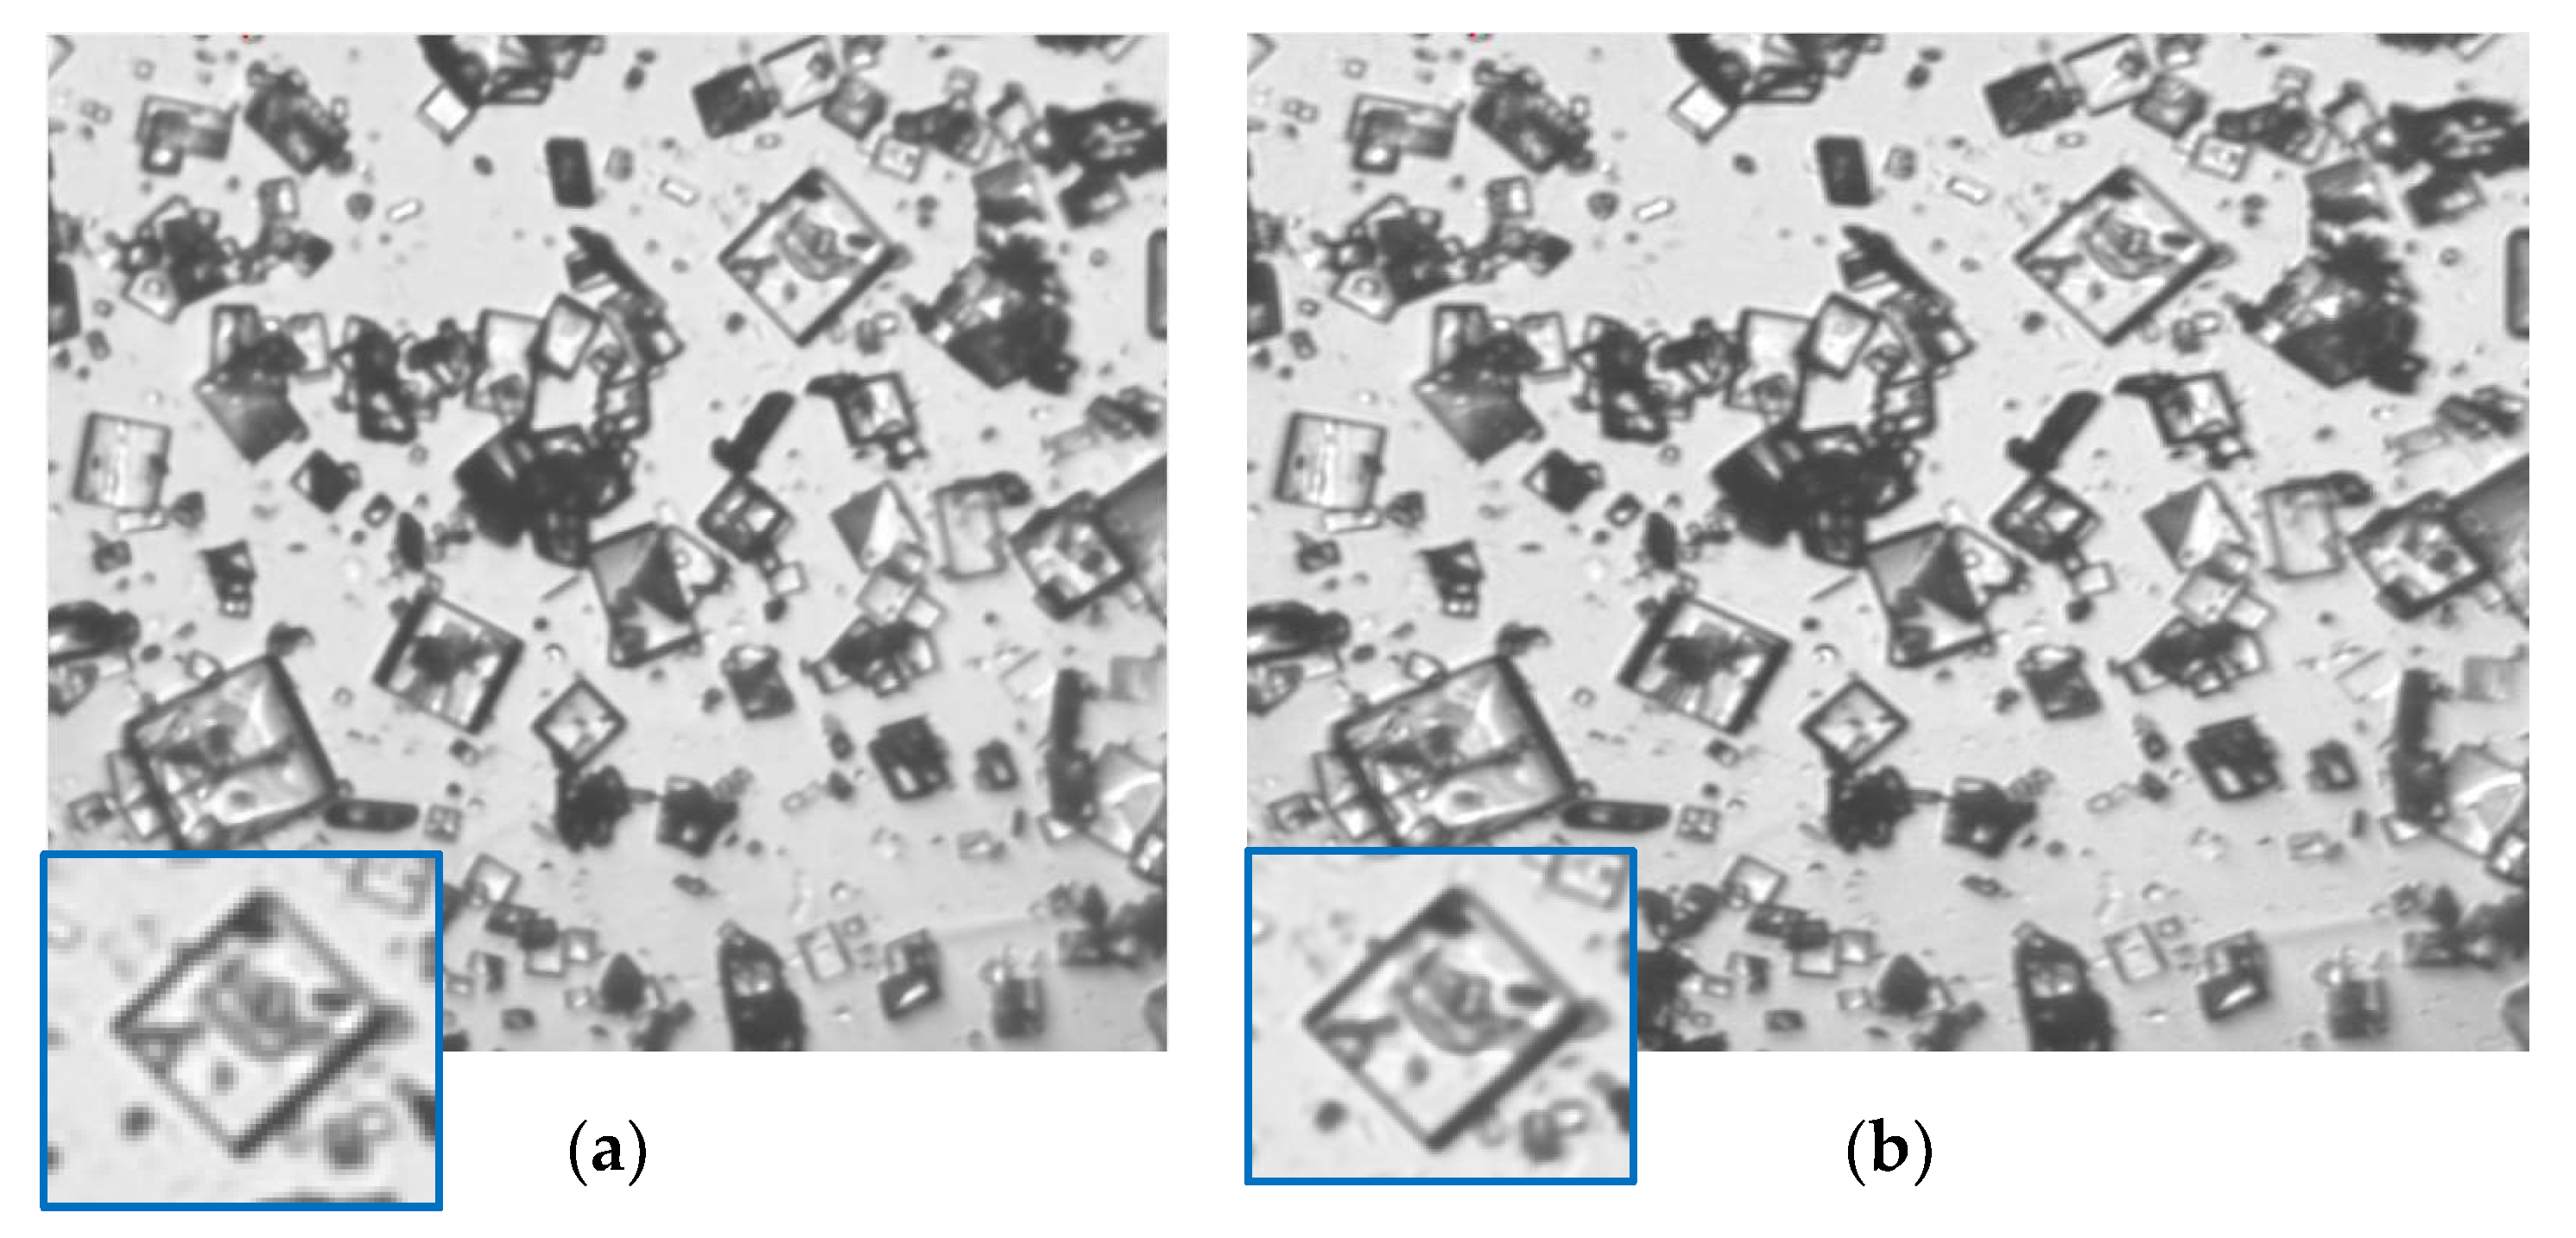
5. Experimental Results
6. Conclusions
Author Contributions
Funding
Institutional Review Board Statement
Informed Consent Statement
Data Availability Statement
Conflicts of Interest
References
- Zhang, F.; Du, K.; Guo, L.; Huo, Y.; He, K.; Shan, B. Progress, problems, and potential of technology for measuring solution concentration in crystallization processes. Measurement 2021, 187, 110328. [Google Scholar] [CrossRef]
- Borsos, Á.; Szilágyi, B.; Agachi, P.; Nagy, Z.K. Real-Time Image Processing Based Online Feedback Control System for Cooling Batch Crystallization. Org. Process. Res. Dev. 2017, 21, 511–519. [Google Scholar] [CrossRef] [Green Version]
- Gao, Y.; Zhang, T.; Ma, Y.; Xue, F.; Gao, Z.; Hou, B.; Gong, J. Application of PAT-Based Feedback Control Approaches in Pharmaceutical Crystallization. Crystals 2021, 11, 221. [Google Scholar] [CrossRef]
- Gan, C.; Wang, L.; Xiao, S.; Zhu, Y. Feedback Control of Crystal Size Distribution for Cooling Batch Crystallization Using Deep Learning-Based Image Analysis. Crystals 2022, 12, 570. [Google Scholar] [CrossRef]
- Wang, X.Z.; Roberts, K.J.; Ma, C. Crystal growth measurement using 2D and 3D imaging and the perspectives for shape control. Chem. Eng. Sci. 2008, 63, 1173–1184. [Google Scholar] [CrossRef]
- Cardona, J.; Ferreira, C.; McGinty, J.; Hamilton, A.; Agimelen, O.; Cleary, A.; Atkinson, R.; Michie, C.; Marshall, S.; Chen, Y.-C. Image analysis framework with focus evaluation for in situ characterisation of particle size and shape attributes. Chem. Eng. Sci. 2018, 191, 208–231. [Google Scholar] [CrossRef]
- Liao, C.-W.; Yu, J.-H.; Tarng, Y.-S. On-line full scan inspection of particle size and shape using digital image processing. Particuology 2010, 8, 286–292. [Google Scholar] [CrossRef]
- Huo, Y.; Zhang, F. In-Situ Detection of Micro Crystals During Cooling Crystallization Based on Deep Image Super-Resolution Reconstruction. IEEE Access 2021, 9, 31618–31626. [Google Scholar] [CrossRef]
- Zhou, Y.; Lakshminarayanan, S.; Srinivasan, R. Optimization of image processing parameters for large sets of in-process video microscopy images acquired from batch crystallization processes: Integration of uniform design and simplex search. Chemom. Intell. Lab. Syst. 2011, 107, 290–302. [Google Scholar] [CrossRef]
- Salami, H.; McDonald, M.A.; Bommarius, A.S.; Rousseau, R.W.; Grover, M.A. In Situ Imaging Combined with Deep Learning for Crystallization Process Monitoring: Application to Cephalexin Production. Org. Process Res. Dev. 2021, 25, 1670–1679. [Google Scholar] [CrossRef]
- Huo, Y.; Liu, T.; Liu, H.; Ma, C.Y.; Wang, X.Z. In-situ crystal morphology identification using imaging analysis with application to the L-glutamic acid crystallization. Chem. Eng. Sci. 2016, 148, 126–139. [Google Scholar] [CrossRef]
- Lu, Z.M.; Zhu, F.C.; Gao, X.Y.; Chen, B.C.; Gao, Z.G. In-situ particle segmentation approach based on average background modeling and graph-cut for the monitoring of l -glutamic acid crystallization. Chemom. Intell. Lab. Syst. 2018, 178, 11–23. [Google Scholar] [CrossRef]
- Zhang, R.; Ma, C.Y.; Liu, J.J.; Wang, X.Z. On-line measurement of the real size and shape of crystals in stirred tank crystalliser using non-invasive stereo vision imaging. Chem. Eng. Sci. 2015, 137, 9–21. [Google Scholar] [CrossRef]
- Wilkinson, M.J.; Jennings, K.H.; Hardy, M. Non-invasive video imaging for interrogating pharmaceutical crystallization processes. Microsc. Microanal. 2000, 6, 996–997. [Google Scholar] [CrossRef]
- De Anda, J.C.; Wang, X.; Roberts, K. Multi-scale segmentation image analysis for the in-process monitoring of particle shape with batch crystallisers. Chem. Eng. Sci. 2005, 60, 1053–1065. [Google Scholar] [CrossRef]
- Lins, J.; Heisel, S.; Wohlgemuth, K. Quantification of internal crystal defects using image analysis. Powder Technol. 2021, 377, 733–738. [Google Scholar] [CrossRef]
- Zhang, B.; Abbas, A.; Romagnoli, J. Multi-resolution fuzzy clustering approach for image-based particle characterization for particle systems. Chemom. Intell. Lab. Syst. 2011, 107, 155–164. [Google Scholar] [CrossRef]
- Gao, Z.; Wu, Y.; Bao, Y.; Gong, J.; Wang, J.; Rohani, S. Image Analysis for In-line Measurement of Multidimensional Size, Shape, and Polymorphic Transformation of l-Glutamic Acid Using Deep Learning-Based Image Segmentation and Classification. Cryst. Growth Des. 2018, 18, 4275–4281. [Google Scholar] [CrossRef]
- Larsen, P.; Rawlings, J.; Ferrier, N. An algorithm for analyzing noisy, in situ images of high-aspect-ratio crystals to monitor particle size distribution. Chem. Eng. Sci. 2006, 61, 5236–5248. [Google Scholar] [CrossRef]
- Ferreira, A.; Faria, N.; Rocha, F.; Teixeira, J. Using an Online Image Analysis Technique to Characterize Sucrose Crystal Morphology during a Crystallization Run. Ind. Eng. Chem. Res. 2011, 50, 6990–7002. [Google Scholar] [CrossRef] [Green Version]
- Zou, K.; Liu, T.; Huo, Y.; Zhang, F.; Ni, X. Image Analysis for In-Situ Detection of Agglomeration for Needle-Like Crystals. In Proceedings of the 2017 36th Chinese Control Conference, Dalian, China, 26–28 July 2017; pp. 11515–11520. [Google Scholar]
- De Anda, J.C.; Wang, X.; Lai, X.; Roberts, K. Classifying organic crystals via in-process image analysis and the use of monitoring charts to follow polymorphic and morphological changes. J. Process. Control. 2005, 15, 785–797. [Google Scholar] [CrossRef]
- Achanta, R.; Shaji, A.; Smith, K.; Lucchi, A.; Fua, P.; SüSstrunk, S. Slic superpixels compared to state-of-the-art superpixel methods. IEEE Trans. Pattern Anal. Mach. Intell. 2012, 34, 2274–2282. [Google Scholar] [CrossRef] [PubMed] [Green Version]
- Tomasi, C.; Manduchi, R. Bilateral filtering for gray and color images. In Proceedings of the Sixth International Conference on Computer Vision, Bombay, India, 7 January 1998; pp. 839–846. [Google Scholar]
- Gonzales, R.C.; Woods, R.E.; Eddins, S.L. Digital Image Processing Using Matlab; Pearson Prentice Hall: Upper Saddle River, NJ, USA, 2004. [Google Scholar]
- Gadelmawla, E. A vision system for surface roughness characterization using the gray level co-occurrence matrix. NDT E Int. 2004, 37, 577–588. [Google Scholar] [CrossRef]
- Skyum, S. A simple algorithm for computing the smallest enclosing circle. Inf. Process. Lett. 1991, 37, 121–125. [Google Scholar] [CrossRef]
- Huo, Y.; Guan, D. Size measurement and prediction for L-glutamic acid crystal growth during stirred crystallization based on imaging analysis. Math. Biosci. Eng. 2021, 18, 1864–1878. [Google Scholar] [CrossRef] [PubMed]
- Liu, T.; Huo, Y.; Ma, C.Y.; Wang, X.Z. Sparsity-based image monitoring of crystal size distribution during crystallization. J. Cryst. Growth 2017, 469, 160–167. [Google Scholar] [CrossRef]
- Winkler, S.; Pierre, V. Computing isotropic local contrast from oriented pyramid decompositions. In Proceedings of the International Conference on Image Processing, Kobe, Japan, 24–28 October 1999; pp. 420–424. [Google Scholar]


Publisher’s Note: MDPI stays neutral with regard to jurisdictional claims in published maps and institutional affiliations. |
© 2022 by the authors. Licensee MDPI, Basel, Switzerland. This article is an open access article distributed under the terms and conditions of the Creative Commons Attribution (CC BY) license (https://creativecommons.org/licenses/by/4.0/).
Share and Cite
Huo, Y.; Guan, D.; Li, X. In Situ Measurement Method Based on Edge Detection and Superpixel for Crystallization Imaging at High-Solid Concentrations. Crystals 2022, 12, 730. https://doi.org/10.3390/cryst12050730
Huo Y, Guan D, Li X. In Situ Measurement Method Based on Edge Detection and Superpixel for Crystallization Imaging at High-Solid Concentrations. Crystals. 2022; 12(5):730. https://doi.org/10.3390/cryst12050730
Chicago/Turabian StyleHuo, Yan, Diyuan Guan, and Xin Li. 2022. "In Situ Measurement Method Based on Edge Detection and Superpixel for Crystallization Imaging at High-Solid Concentrations" Crystals 12, no. 5: 730. https://doi.org/10.3390/cryst12050730