Article

Ceramic Ti/TiO2/AuNP Film with 1-D Nanostructures for Selfstanding Supercapacitor Electrodes

1
Department of Physics, College of Science, King Faisal University, P.O. Box 400, Al-Ahsa 31982, Saudi Arabia
2
Physics Department, Faculty of Science, Assiut University, Assiut 71516, Egypt
3
Physics Department, Faculty of Science, University of Tabuk, Tabuk 71491, Saudi Arabia
4
Department of Physics, School of Engineering, University of Petroleum & Energy Studies, Dehradun 248007, India
5
Egyptian Petroleum Research Institute, Cairo 11727, Egypt
6
Department of Physics, College of Science, Jouf University, Al-Jouf, Sakaka 72388, Saudi Arabia
7
Metallurgy & Material Science Tests (MMST) Lab, Department of Physics, Faculty of Science, South Valley University, Qena 83523, Egypt
8
Department of physics, College of Sciences and Art at ArRass, Qassim University, ArRass 51921, Saudi Arabia
*
Author to whom correspondence should be addressed.
Crystals 2022, 12(6), 791; https://doi.org/10.3390/cryst12060791
Submission received: 12 April 2022 / Revised: 14 May 2022 / Accepted: 17 May 2022 / Published: 31 May 2022
(This article belongs to the Section Inorganic Crystalline Materials)

Abstract

:
Herein we have fabricated AuTiO2 from a one-dimensional (1D) nanocomposite by the simple oxidation method of the Ti sheet for supercapacitor applications. We intended on fabricating a microlayer extended into the sheet body to form a selfstanding electrode. Raman spectra and XRD patterns confirmed the formation of the rutile phase of the TiO2 bulk, and FESEM confirmed the growth of the 1D nanostructure made of Au/TiO2, where the Au nanoparticles reside on the tip of the TiO2 nanorods. The growth of 1D TiO2 by this method is supported by a growth mechanism during the oxidation process. Three electrodes were fabricated based on pure and doped TiO2. These electrodes were used as a selfstanding supercapacitor electrode. The Au-doped TiO2 exhibited a great improvement in the electrochemical performance at low Au concentrations, whereas the excessive Au concentration on the TiO2 surface exhibited a negative effect on the capacitance value. The highest areal capacitance of 72 mFcm−2 at a current density of 5 µAcm−2 was recorded for TiO2 doped with a low Au concentration. The mechanism of the electrochemical reaction was proposed based on Nyquist and Bode plots. The obtained results point out that the effect of Au on the TiO2 surface makes Au/TiO2 ceramic electrodes a promising material as selfstanding energy storage electrodes.

1. Introduction

Energy storage devices have high commanded considerable attention in this century, and the demand is increasing day by day for high-capacity storage and economical devices [1,2,3,4,5,6,7]. This demand is reasonable as capacitors for electronic components and energy storage have become necessities in portable devices. It is therefore very important to develop different electrode systems for use in different devices. Not only that, but the simplification and ease of manufacturing methods are often a requirement, in addition to the low cost of these products to make this technology available in wide applications. In addition, the use of environmentally friendly materials is also an important factor, along with environmental safety factors.
The nanostructures of different materials are suitable for storing the greatest amount of energy and have the great attention of researchers [8,9,10,11]. But in most cases, these materials need an external support electrode. Therefore, producing standalone electrodes without the need for external support is a requirement for this type of device [6,7]. Due to their physical and chemical properties, metal oxides enjoy much attention in many applications [7,12,13,14,15,16,17,18]. The use of titanium oxide nanomaterials has proven to be an advantage in energy storage devices [19,20,21], but it needs an external substrate to support it. The use of titanium sheets for the formation of titanium oxide is perhaps not new, but for the titanium oxide formed directly and in the form of 1D standalone nanostructures electrode it is useful. It is also known that the use of noble metals may improve the growth of nanotitanium oxide on the surface of titanium with its strong adhesion with titanium, and thus the ceramic nanostructure can be formed [22].
The performance rate of the oxide nanostructures is limited due to the intrinsically weak electrical conductivity. By improving the properties of some of the binary compounds of the oxide materials, their performance toward the electrochemical was improved [1,23,24,25,26,27]. To reduce the charge transfer resistance, the use of conductive compounds, such as Au and Ag, in the electrodes of the metal oxide capacitors led to an increase in the electrochemical performance rate. For example, Qu et al. [23] and Kim [24] used Au NPs and nickel oxide to form gold-doped nickel oxide and used it as a supercapacitor electrode, which showed an improvement in its electrochemical performance. Nevertheless, most oxide-based supercapacitors have been used in a powder form, with the addition of graphite powder. In addition, these products need a nickel foam on which to be a base electrode. The preparation of the oxide powder is usually processed through chemical synthesis methods and various steps of preparation. Therefore, the preparation of the oxides simply and directly is in more demand, especially if the oxide is prepared in nanoscale and selfstanding electrodes for supercapacitor applications. Therefore, the direct oxidation of the metal sheet through which the oxides can be prepared is considered a simple method. However, most oxides produced by this method are in the form of bulk. However, by using a noble catalyst, such as Au, Ag, or Pd on the surface of the metal during the preparation, 1D nanostructures might be formed.
In this paper, a Ti sheet is used as the source for the TiO2 nanostructure process. A layer of HAuCl4xH2O was deposited on the Ti sheet surface before the process of oxidation to stimulate the 1D nanostructure growth. This paper aims to fabricate TiO2 nanostructure films with areal thicknesses for supercapacitor applications. The active layer of thin-film electrodes (TFEs), with a thickness of micrometers, will be investigated in the field of supercapacitors (SCs). The thin film layer will be fabricated by direct method with a selfstanding Ti/TiO2 ceramic electrode. In other words, the electrodes do not need any external support substrate. This allows us to use a small area for fabricating a supercapacitor at a low cost. Finally, this paper addresses a method for fabricating TiO2 electrodes doped with nanoadditive materials and produced on a large scale with low cost and friendly SCs. The distinctive structures of the thin film of the uniform layer may ensure the rapid electrochemical process for charging–discharging, making it possible for miniaturized and portable devices. The fabricating devices are characterized by FSESM, Raman spectroscopy, and the electrochemical workstation.

2. Materials and Methods

For TiO2 nanostructure preparation, a Ti sheet (Nilaco, Tokyo, Japan) of 99.95% purity and 100 µm in thickness was used. Three pieces of Ti with 1.0 cm2 in the area were well ultrasonication for cleaning. A solution of gold (III) chloride hydrate (HAuCl4xH2O) (Sigma-Aldrich, St. Louis, USA) was prepared in advance with a concentration of 50 µM (120 µg/10 mL). The first Ti piece was kept pure, the second was coated with 50 µL (0.6 µg) of HAuCl4xH2O solution, and the third one was coated with 100 µL (1.2 µg) of HAuCl4xH2O. The three samples were later called Pure TiO2, Au1/TiO2, and Au2/TiO2, respectively. The samples were placed in a furnace in ambient air inside an alumina boat, and then the furnace was heated up to 750 °C within 50 min and maintained for 3.0 h before it was left to cool down to room temperature.
The film morphologies were characterized by field emission scanning electron microscopy [FE-SEM, Model JEOL JMS-7000 operating at 15 kV, Tokyo, Japan]. XRD analysis was investigated by an X-ray diffractometer (Philips Type PW 1710, Eindhoven, Netherlands), and the CuKα radiation was recorded from 20–70° with a scanning rate of 0.06°/s. The structure phase of the prepared films was investigated by Raman confocal microscope (LabRAM-HR800, Butte, MT, USA) attached with a charge-coupled detector (CCD). Laser of He–Cd with a 442 nm-wavelength and 20 mW output power was used. The Raman spectra were carried out in a backscattering configuration at room temperature with a 0.8 cm−1 spectral resolution.
The working electrodes were prepared directly by etching one side of the Ti sheet to remove the oxide layer, whereas the other side at which the 1D TiO2 grew was left. The cell contained a counter electrode of Pt foil, a reference electrode of saturated calomel electrode, and an electrolyte of 3.0 M KOH solution. The areal capacitance was calculated in the discharge measurements by the formula:
C = I   Δ t A   Δ V
where I, Δt, A, and ΔV are the discharging current density, the discharging time, the area of the active materials, and the width of the potential window, respectively. The electrochemical impedance spectra were collected from the frequency of 0.01 Hz to 1.0 MHz. The active area of the electrode material was about 2 × 2 mm2. The SCs measurements were performed by using the CorrTest electrochemical workstation system. Cyclic Voltammetry (CV) curves were measured at various voltage sweep rates. Galvanostatic charge–discharge (GCD) curves were also measured at variant current densities. The electrodes of three samples were also tested under 5000 cycles of the charging–discharging cycle for cycling stability.

3. Results

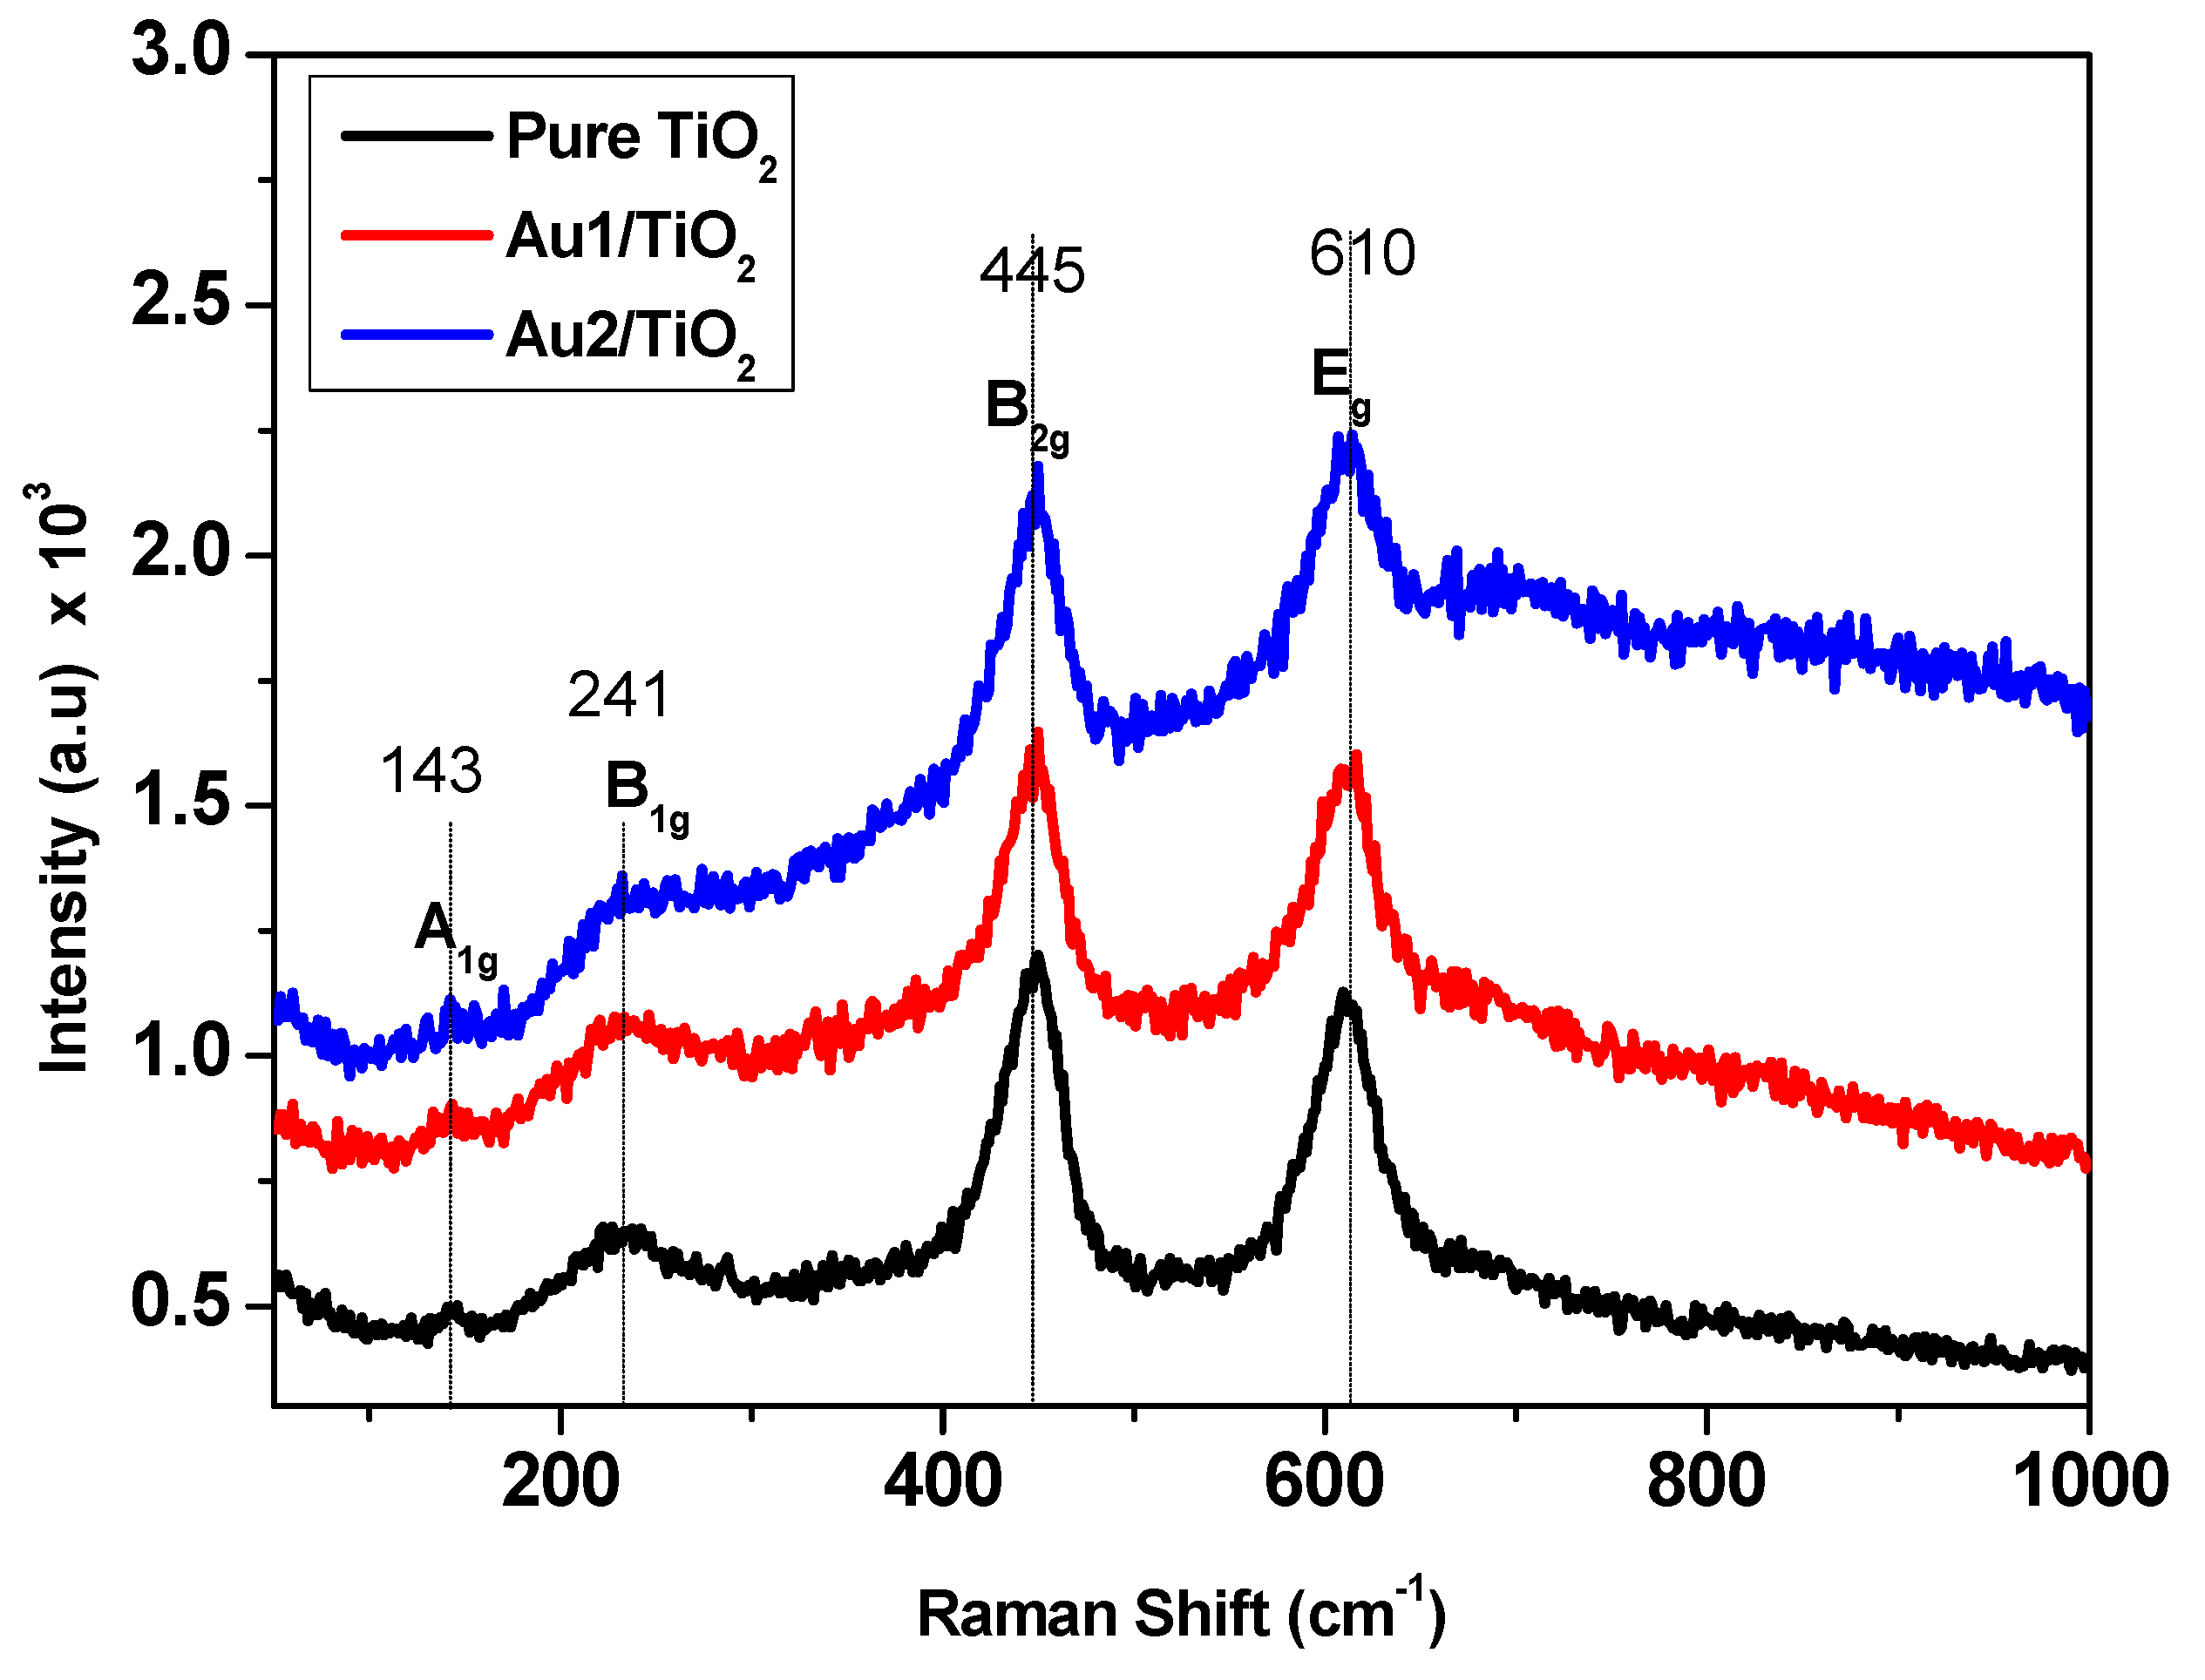
3.1. Au/TiO2 Nanorod Characterizations

Figure 1 shows the Raman spectra of the prepared three samples. There are many crystalline phases of titanium dioxide (TiO2), and the most known phases are rutile with tetragonal, anatase with the tetragonal, and the difficult-to-prepare phase of brookite, which has an orthorhombic structure. Two very common phases are anatase and rutile. The rutile phase fits D4h crystal classification and has two equivalent units for the crystal unit cell. Rutile TiO2 has four active Raman modes (A1g + B1g + B2g + Eg) [28,29]. In principle, it is simple to distinguish the rutile phase via Raman spectra. The Raman spectra of prepared films of TiO2 are shown in Figure 1. The correlation method predicted that the spectrum of rutile consisted of four bands, as reported in [28]. The peaks of this observed phase at 143, 445, and 610 cm−1 are designated to B1g, Eg, and A1g symmetry types, respectively [30]. However, the 241 cm−1 wideband is assigned to second-order or two-photon Raman scattering. The concentration of gold nanoparticles may affect the amplitude of the observed spectra, as shown in Figure 1.
The nanostructures of Au/TiO2 were further investigated by FESEM, as shown in Figure 2. FESEM images of low and high magnification are shown in this Figure. Figure 2a shows the sample surface of pure titania, where the topography of the surface is shown. It seems that after the oxidation process, the surface became rough and not smooth, but there was no growth of any nanostructures. In the case of adding gold in an amount of 50 μL, the growth of one-dimensional nanostructures was formed, as shown in Figure 2b. It was noted that gold stimulated the growth of these one-dimensional nanostructures. In other words, the gold helped to pull up the oxidized titanium, and the gold nanoparticles (AuNPs) resided on the tip. The diameter of the rod-shaped nanostructures is about 50 nm, and the length is in the order of a few microns. The size of the AuNPs on top of titania is ~75 nm. With the doubled amount of gold (100 µL) on the surface, we found that this percentage of gold stimulated the growth of one-dimensional structures as well, but it turns out that the percentage of gold doubled the size of the nanorod to 116 nm, but the length was within the same limits as the second sample. The size of the gold particle on the tip also became larger, about 185 nm. Therefore, we found that the size of the gold on the tip, as well as the diameter of the nanostructures, depended on the amount of gold deposited on the surface. Figure 2d shows a cross-sectional image of the third sample, showing that the nanostructures only grew on the side where the gold catalyst was located. The thickness of this growth was within 5 µm, and it was also clear that the titania was still formed below this thickness within 5 µm, as well.
The X-ray diffraction charts of the as-prepared sample are shown in Figure 3. The polycrystalline structure of pure TiO2 and Au/TiO2 was observed here. The analysis indicated the formation of the rutile phase for pure TiO2 and Au-doped TiO2 corresponding to JCPDS-21-1272. The most intense diffraction lines are (101) and (211), respectively. Figure 3 compares the three samples, where the intensity of pure TiO2 has a larger intensity than Au/TiO2. We can ascribe the reduction in intensity to the formation of the 1D nanostructure for Au/TiO2. The difference between Au1/TiO2 and Au2/TiO2 is due to the difference in crystallite size since the size of the nanorods for Au2/TiO2 is double that of Au1/TiO2. Thus, the possibility of diffraction intensity for 1D nanostructure is less than that of a flat surface of pure TiO2. This confirms that Au deposited on the surface boosts the growth of TiO2 nanorods. The intensities of the diffraction line of (110) and (211) are comparable to each other. This was observed for the two samples doped with gold. Moreover, there is a growth for the plane of (110) and (310) for the Au-doped TiO2 compared to the pure sample. The average crystallite size calculated for the most intensive peaks was 44, 27, and 42 nm for pure TiO2, Au1/TiO2, and Au2/TiO2, respectively. The change in the growth directions and microstructure of the fabricated composites may influence their physical properties.

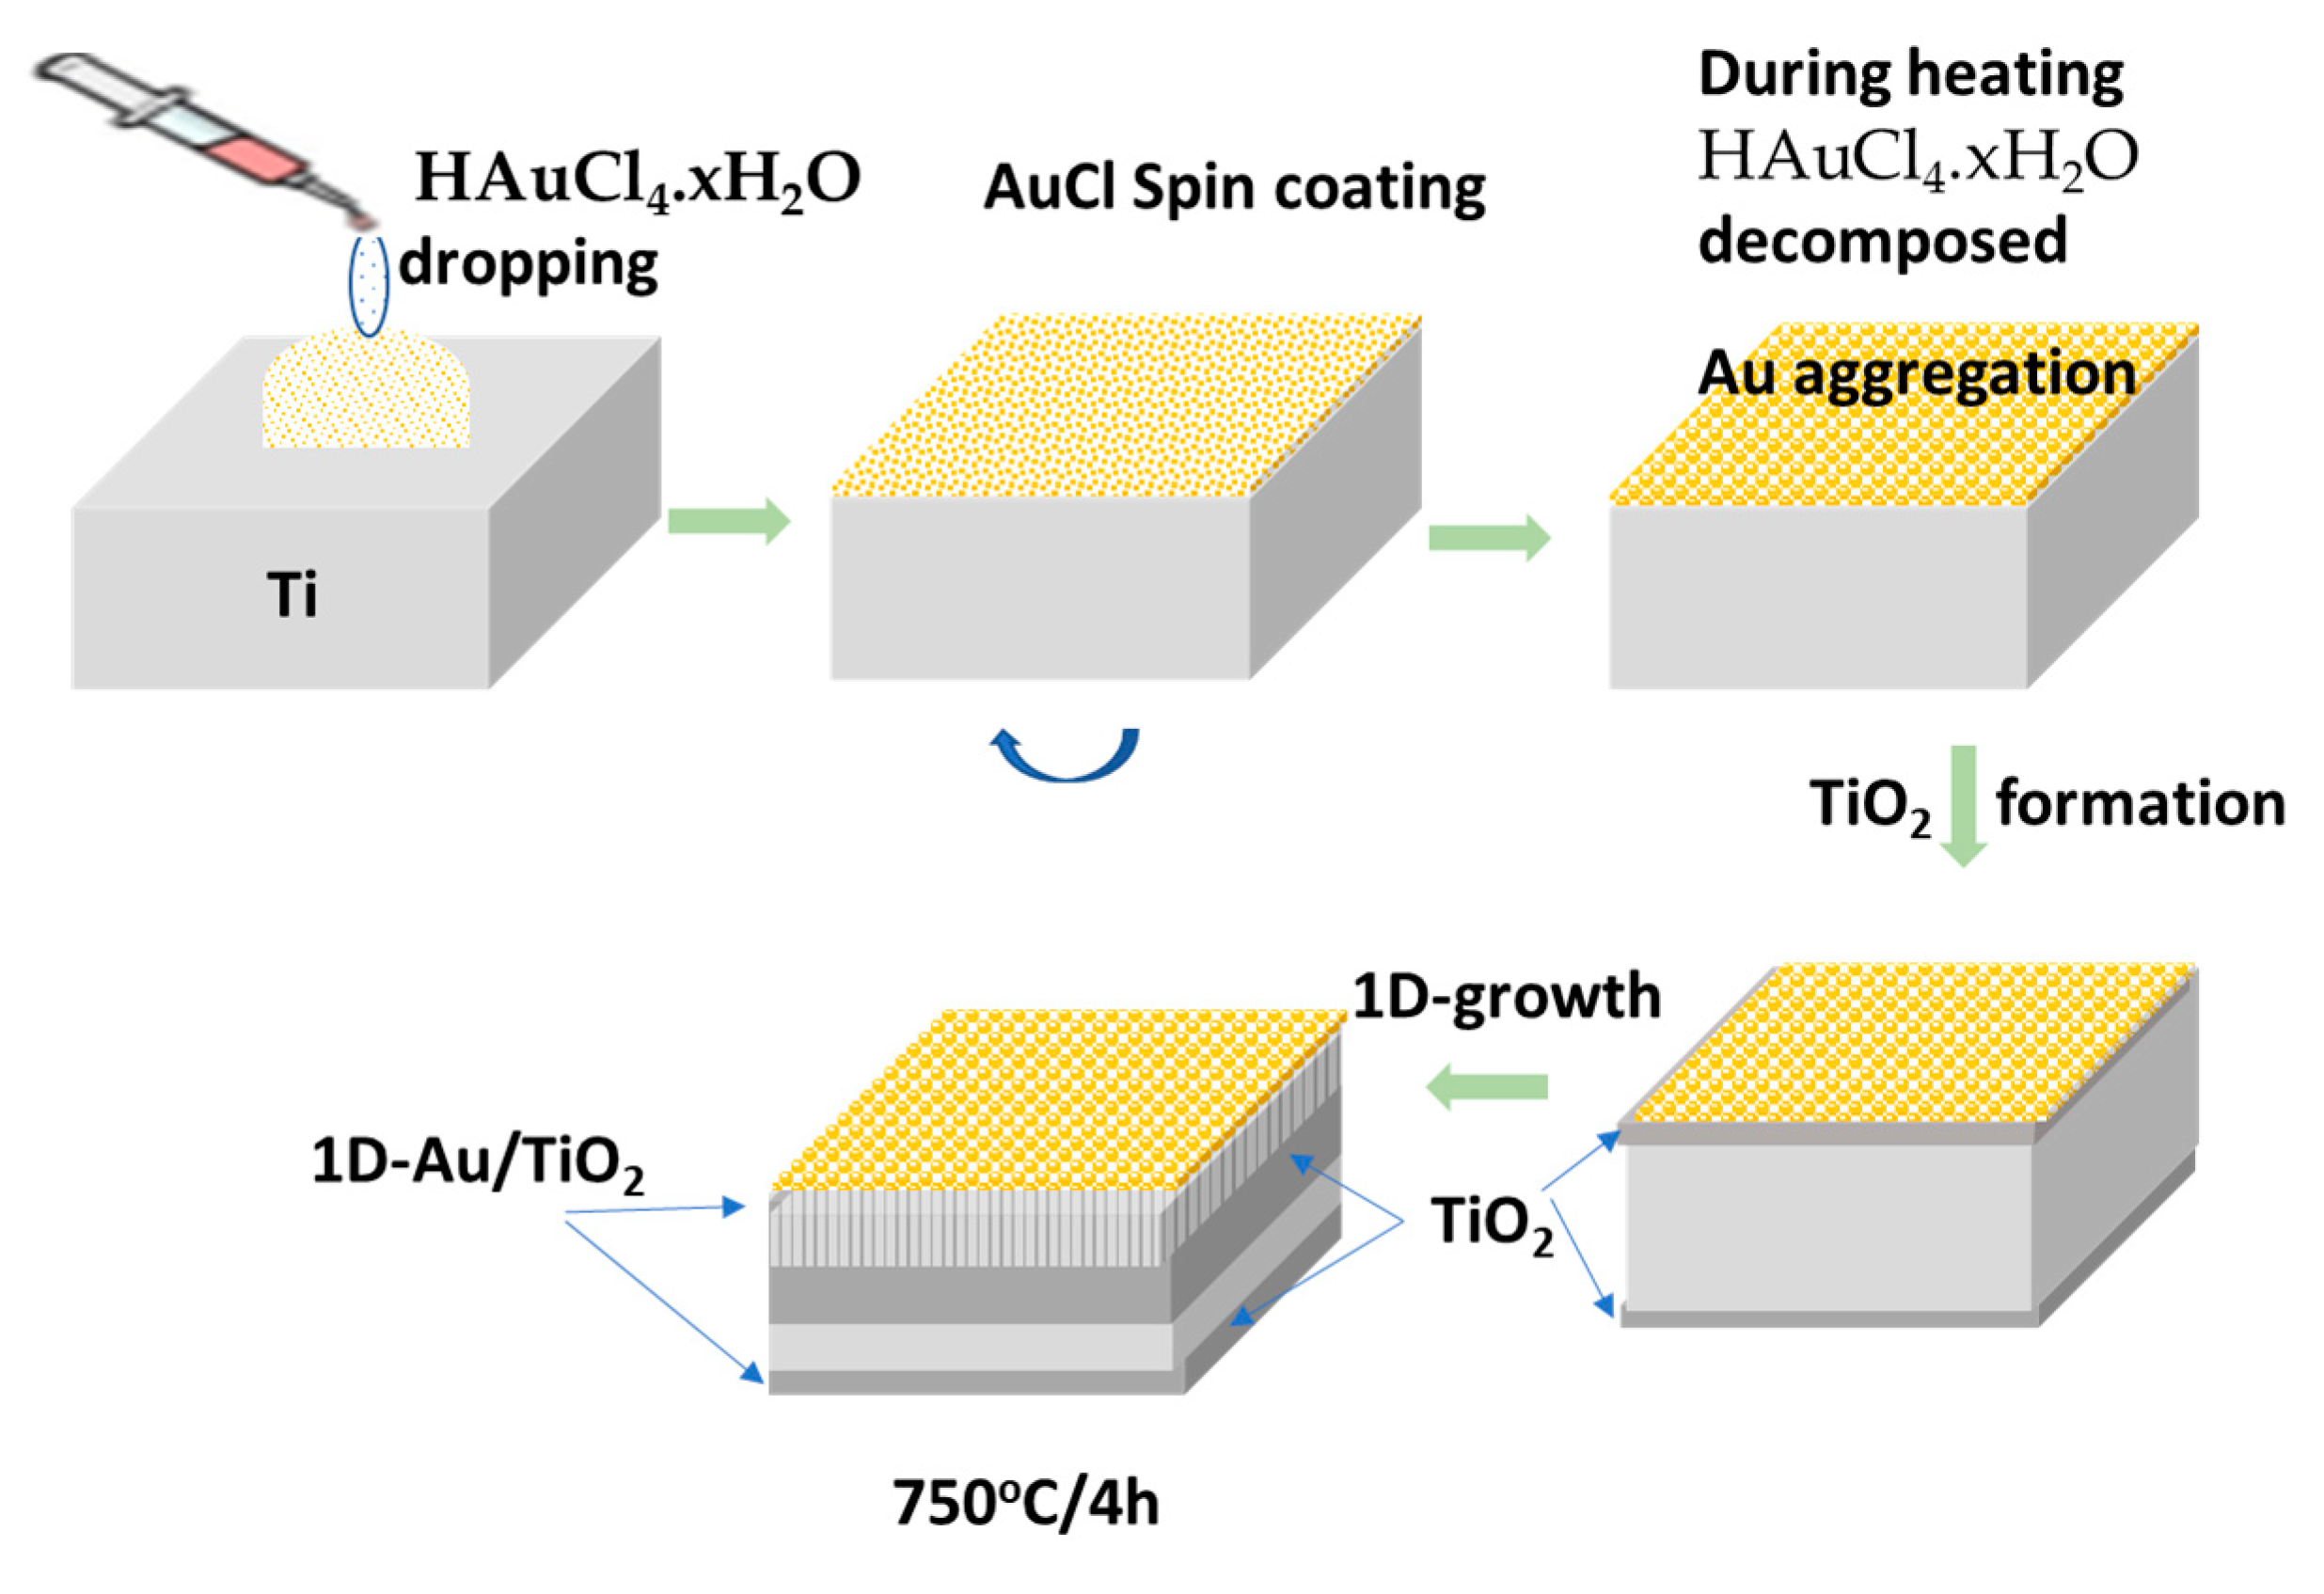
3.2. Au/TiO2 Nanorod Growth Mechanism

The growth mechanism of one-dimensional nanostructures is illustrated in Figure 4. The HAuCl4xH2O was coated in a thin layer by spin coater on the surface of the Ti sheet. When the HAuCl4xH2O molecules were exposed to high temperatures, they decomposed, and Au atoms aggregated and formed, which stuck to the Ti surface. At the same time, the Ti sheet started to be oxidized. The gold droplets may prefer to leave the surface up, which can pull up the titanium atoms that have been oxidized by heating in a partially oxygenated atmosphere. Therefore, Au acts as a catalyst for the growth of nanostructures, resulting in the formation of one-dimensional Au/TiO2 nanorods. It is clear from the FESEM images that gold particles resided on the tips of the nanorods. Figure 3 shows the preparation steps and growth mechanisms of Au-doped TiO2. FESEM images show that the growth of nanorods is about 5.0 µm on the surface planted deeply into 5.0 µm TiO2 bonded to the sheet. Therefore, it is expected that the oxidation process progressively expanded inside the sheet beneath the nanorods. The expansion of the oxide region inside the bulk made the nanorods strongly planted or rooted into the bulk and adhered well with it, constructing ceramic nanostructures. During the thermal oxidation process, HAuCl4xH2O was gradually decomposed at 100 to 350 °C to obtain Au, and the Ti sheet also may react with these decomposed elements forming TiCl 2 as one step [31,32]. The decomposition process can be explained:
HAuCl 4 .3 H 2 O   < 100   ° C   HAuCl 4 + 3 H 2 O
HAuCl 4   130 180   ° C   AuCl 3 + HCl
2 AuCl 3   180 250   ° C   2 AuCl + Cl 2
2 AuCl   250 350   ° C   2 Au + Cl 2
Ti + 2 HCl   ~ 180   TiCl 2 + H 2
TiCl 2 + O 2   ~ 750   TiO 2 + Cl 2

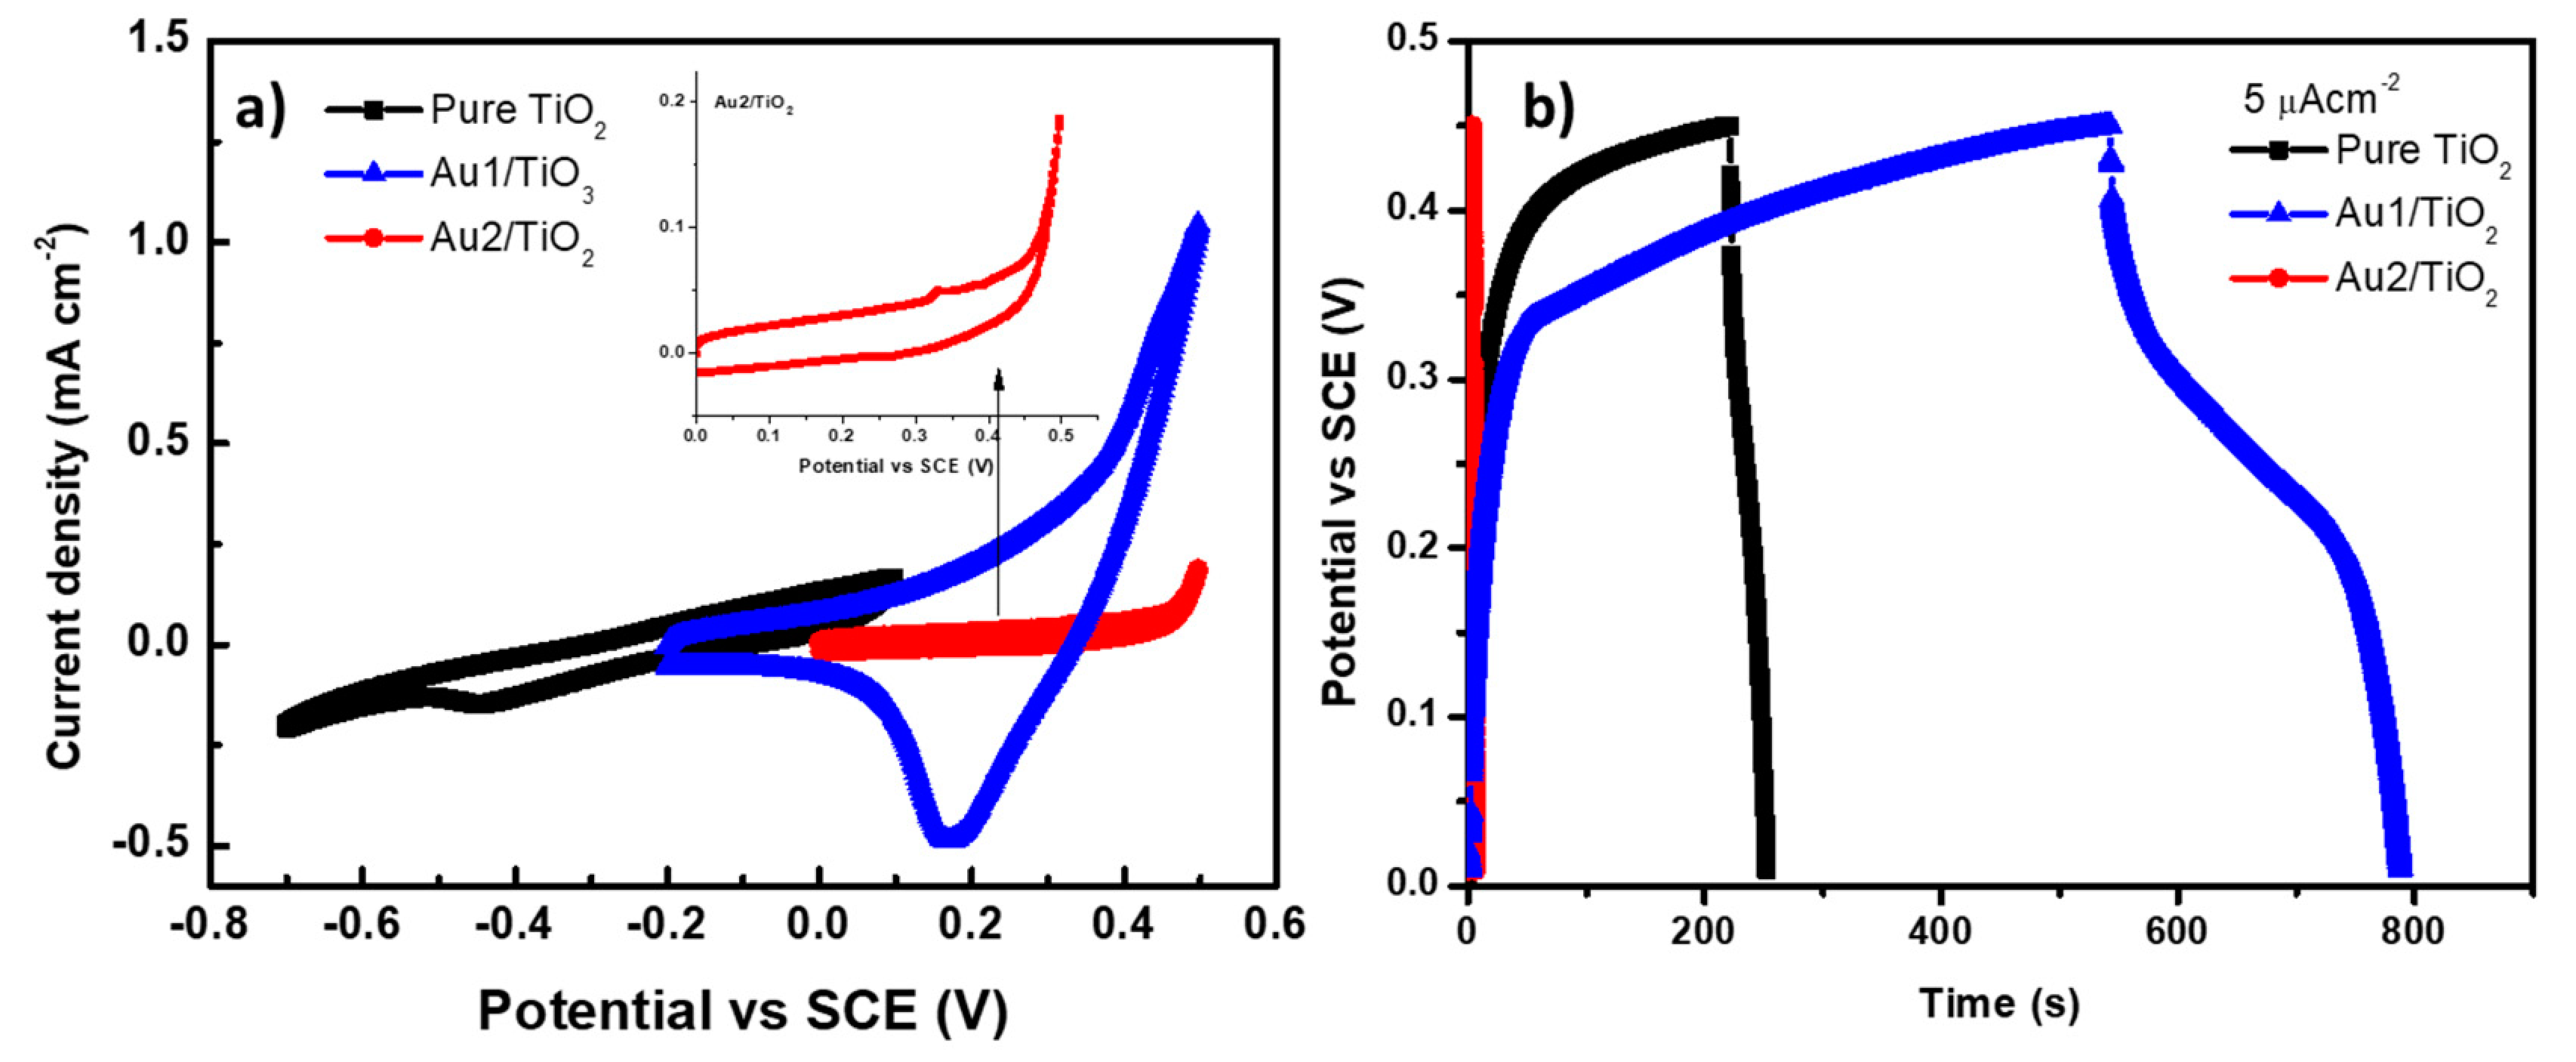
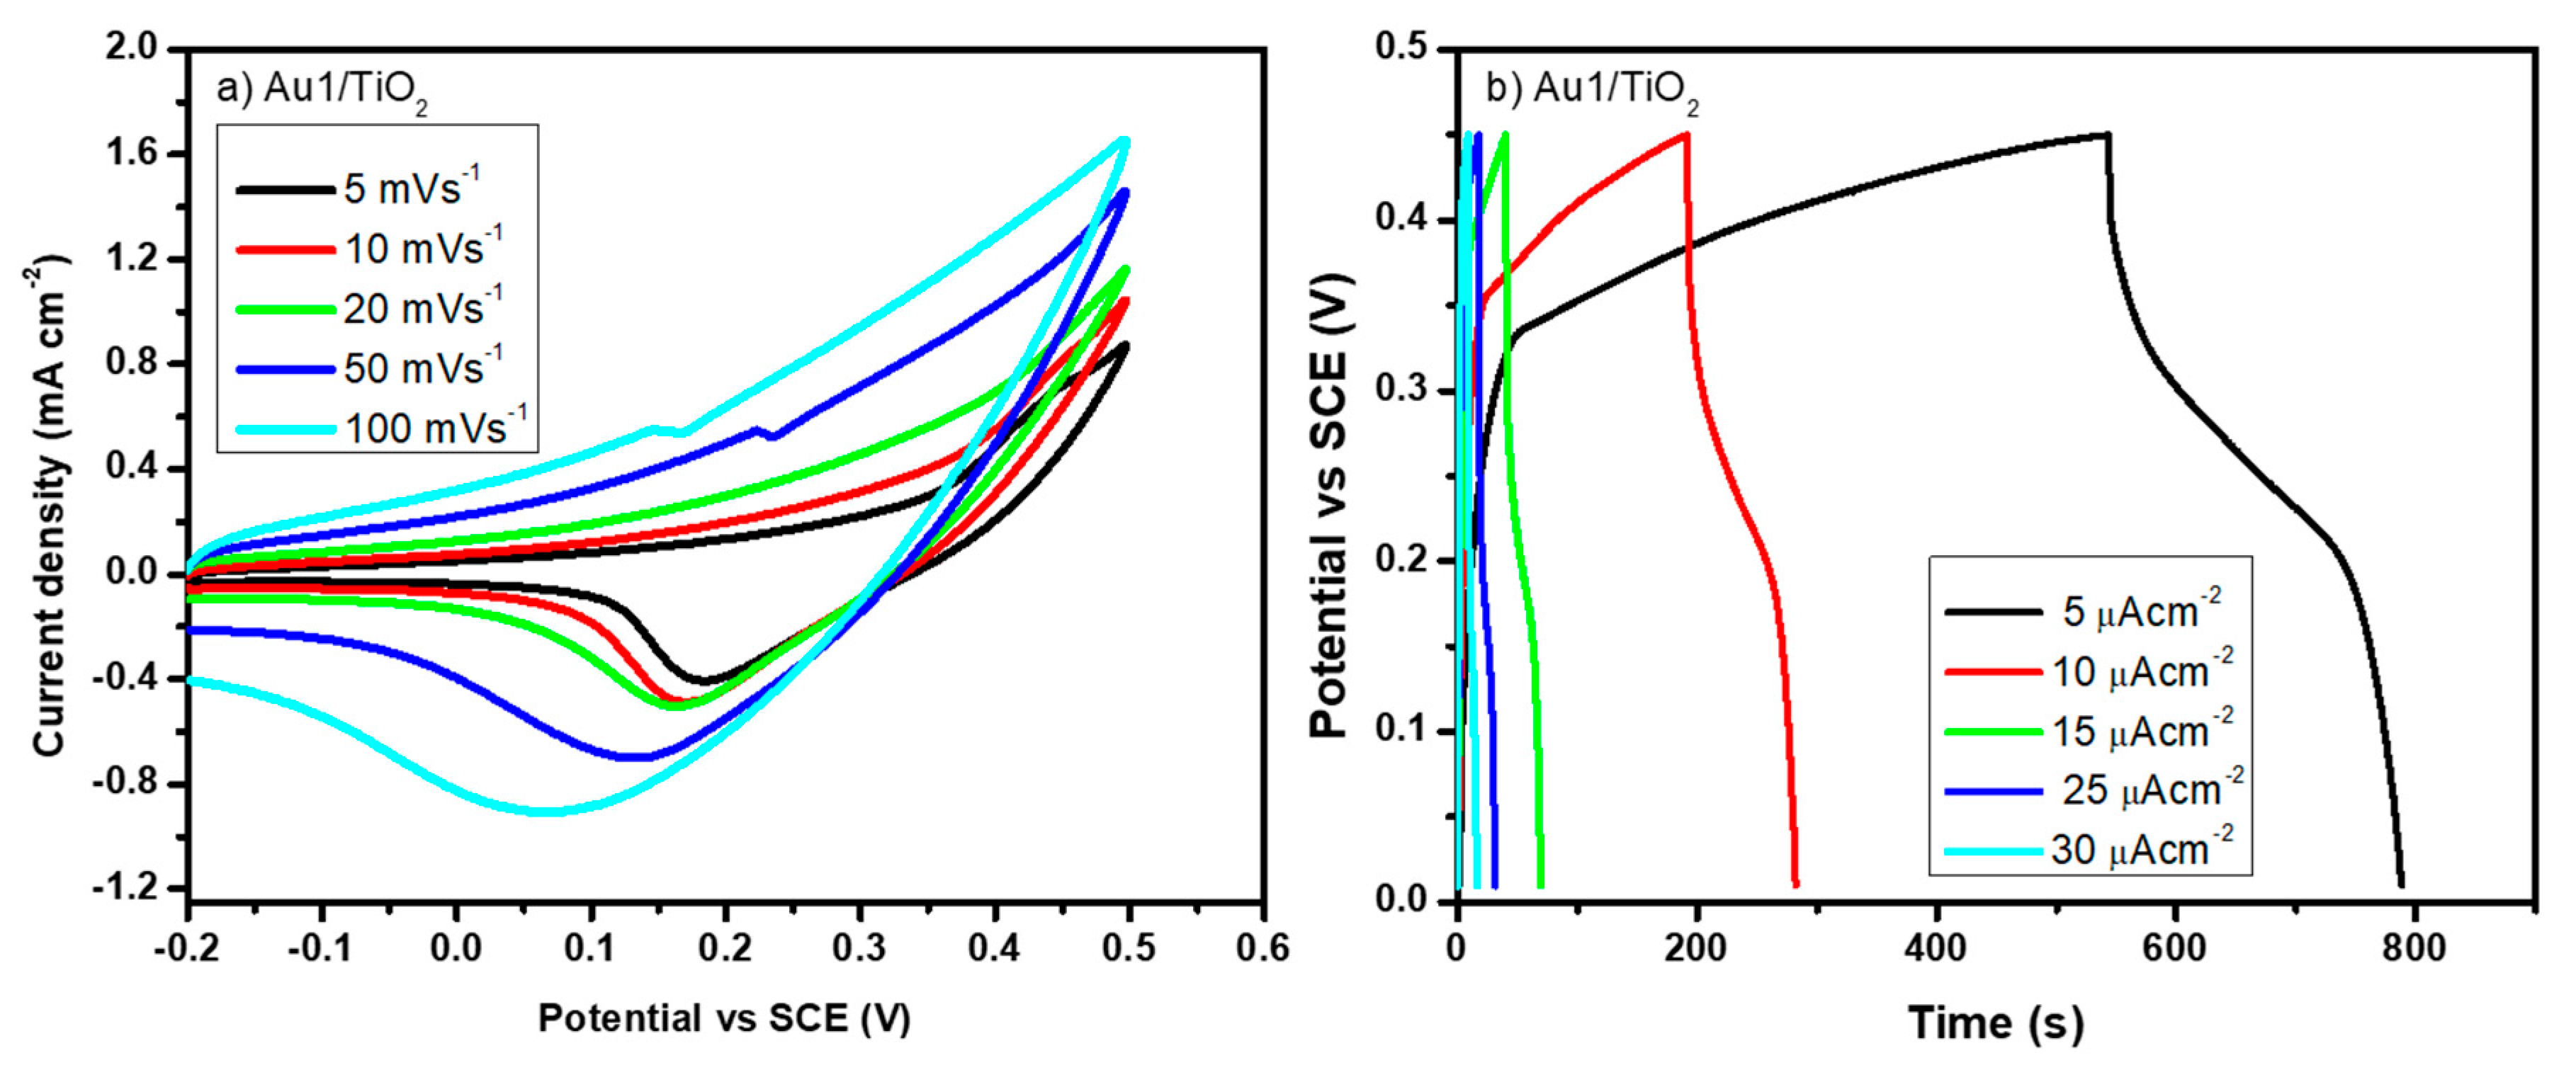
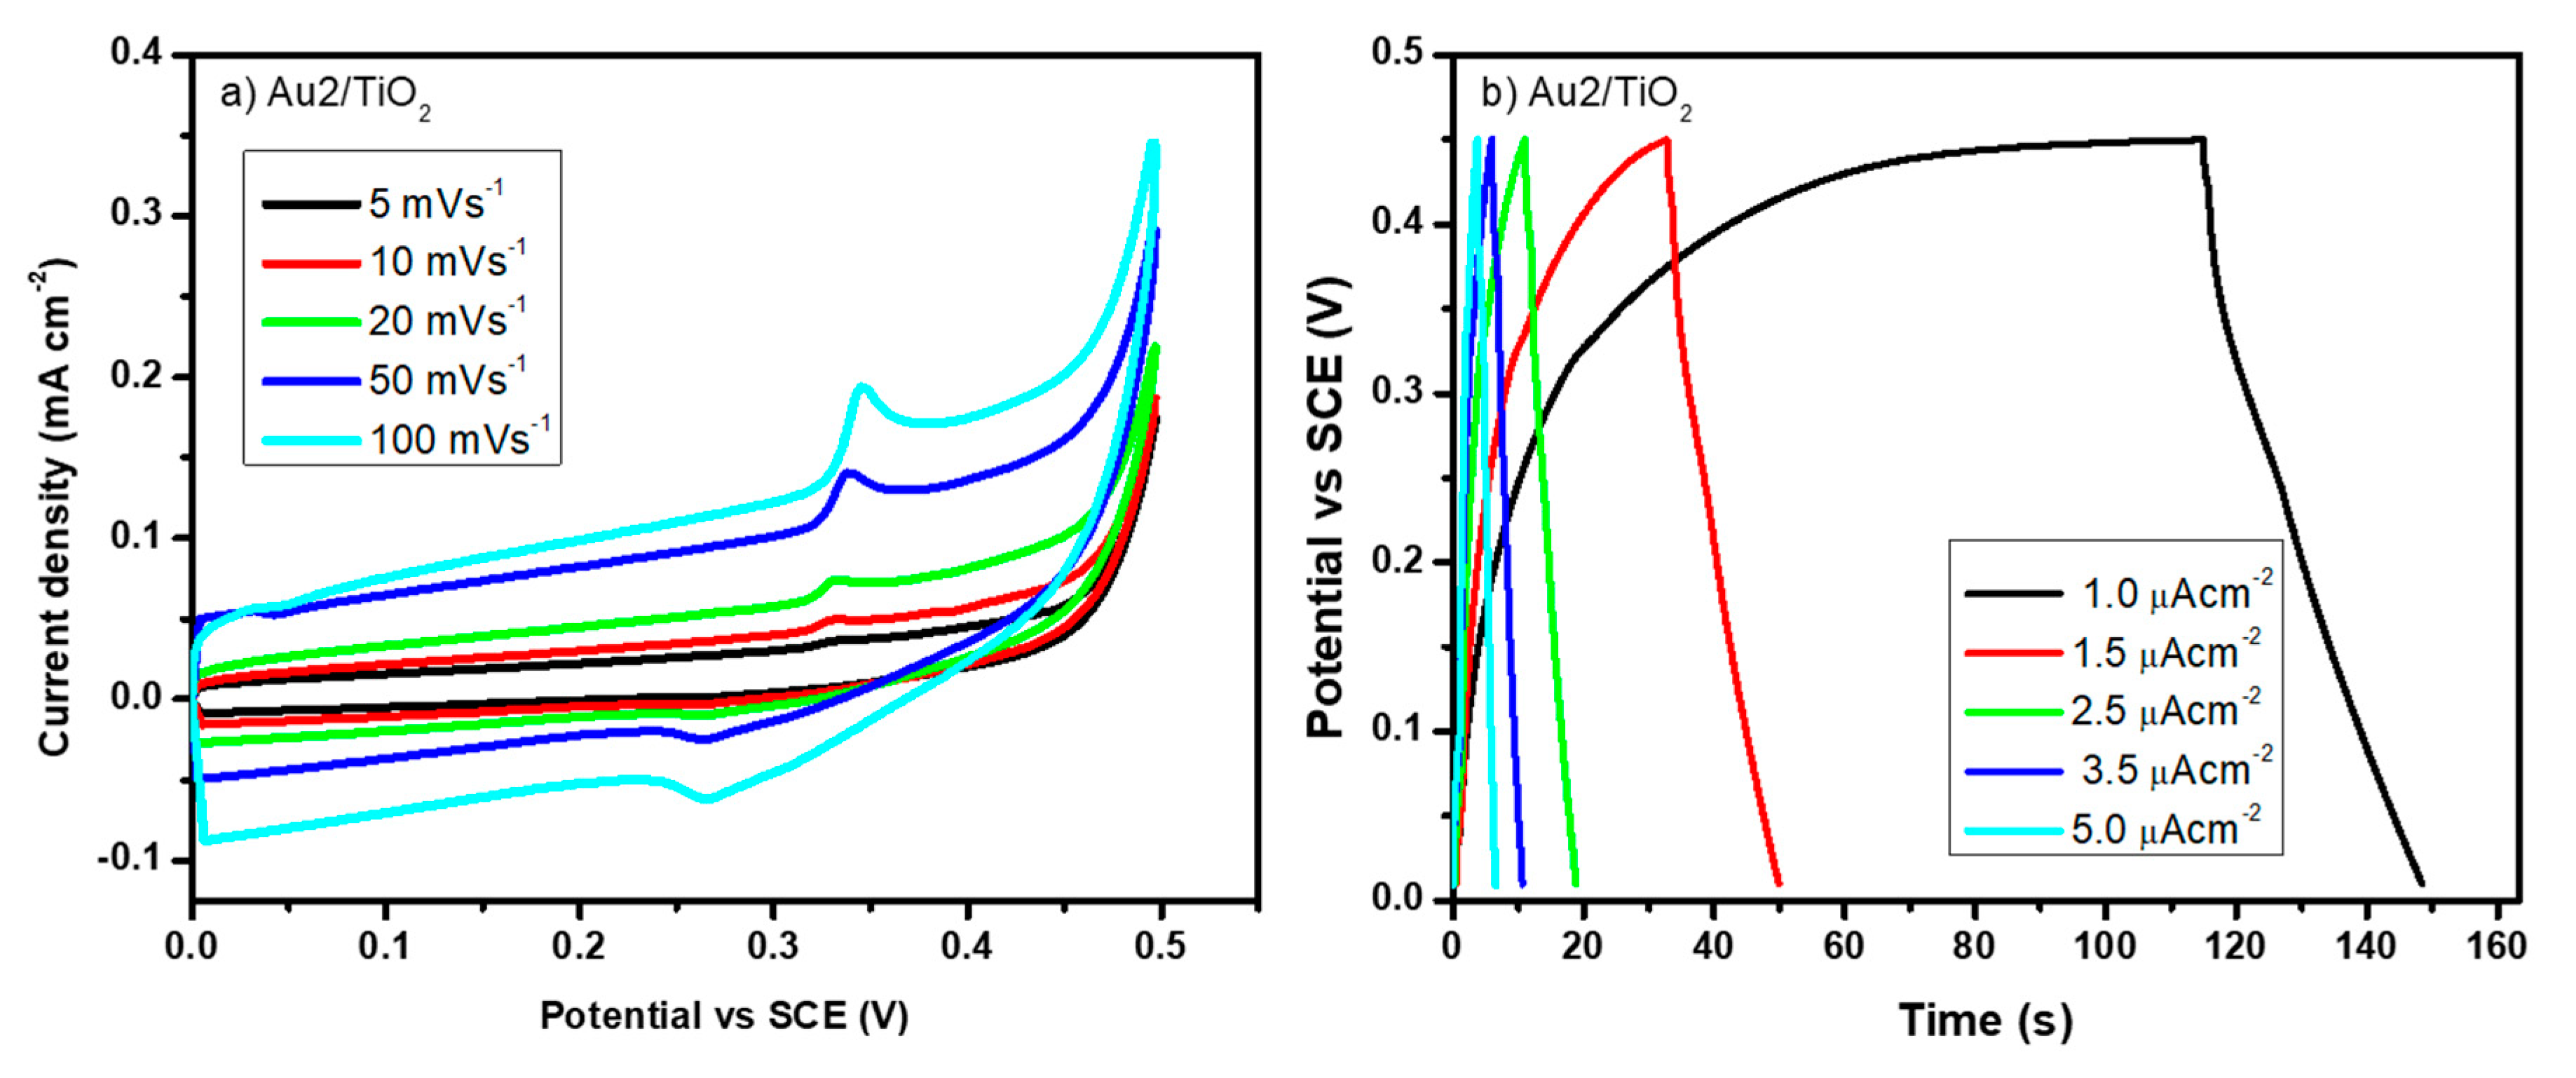
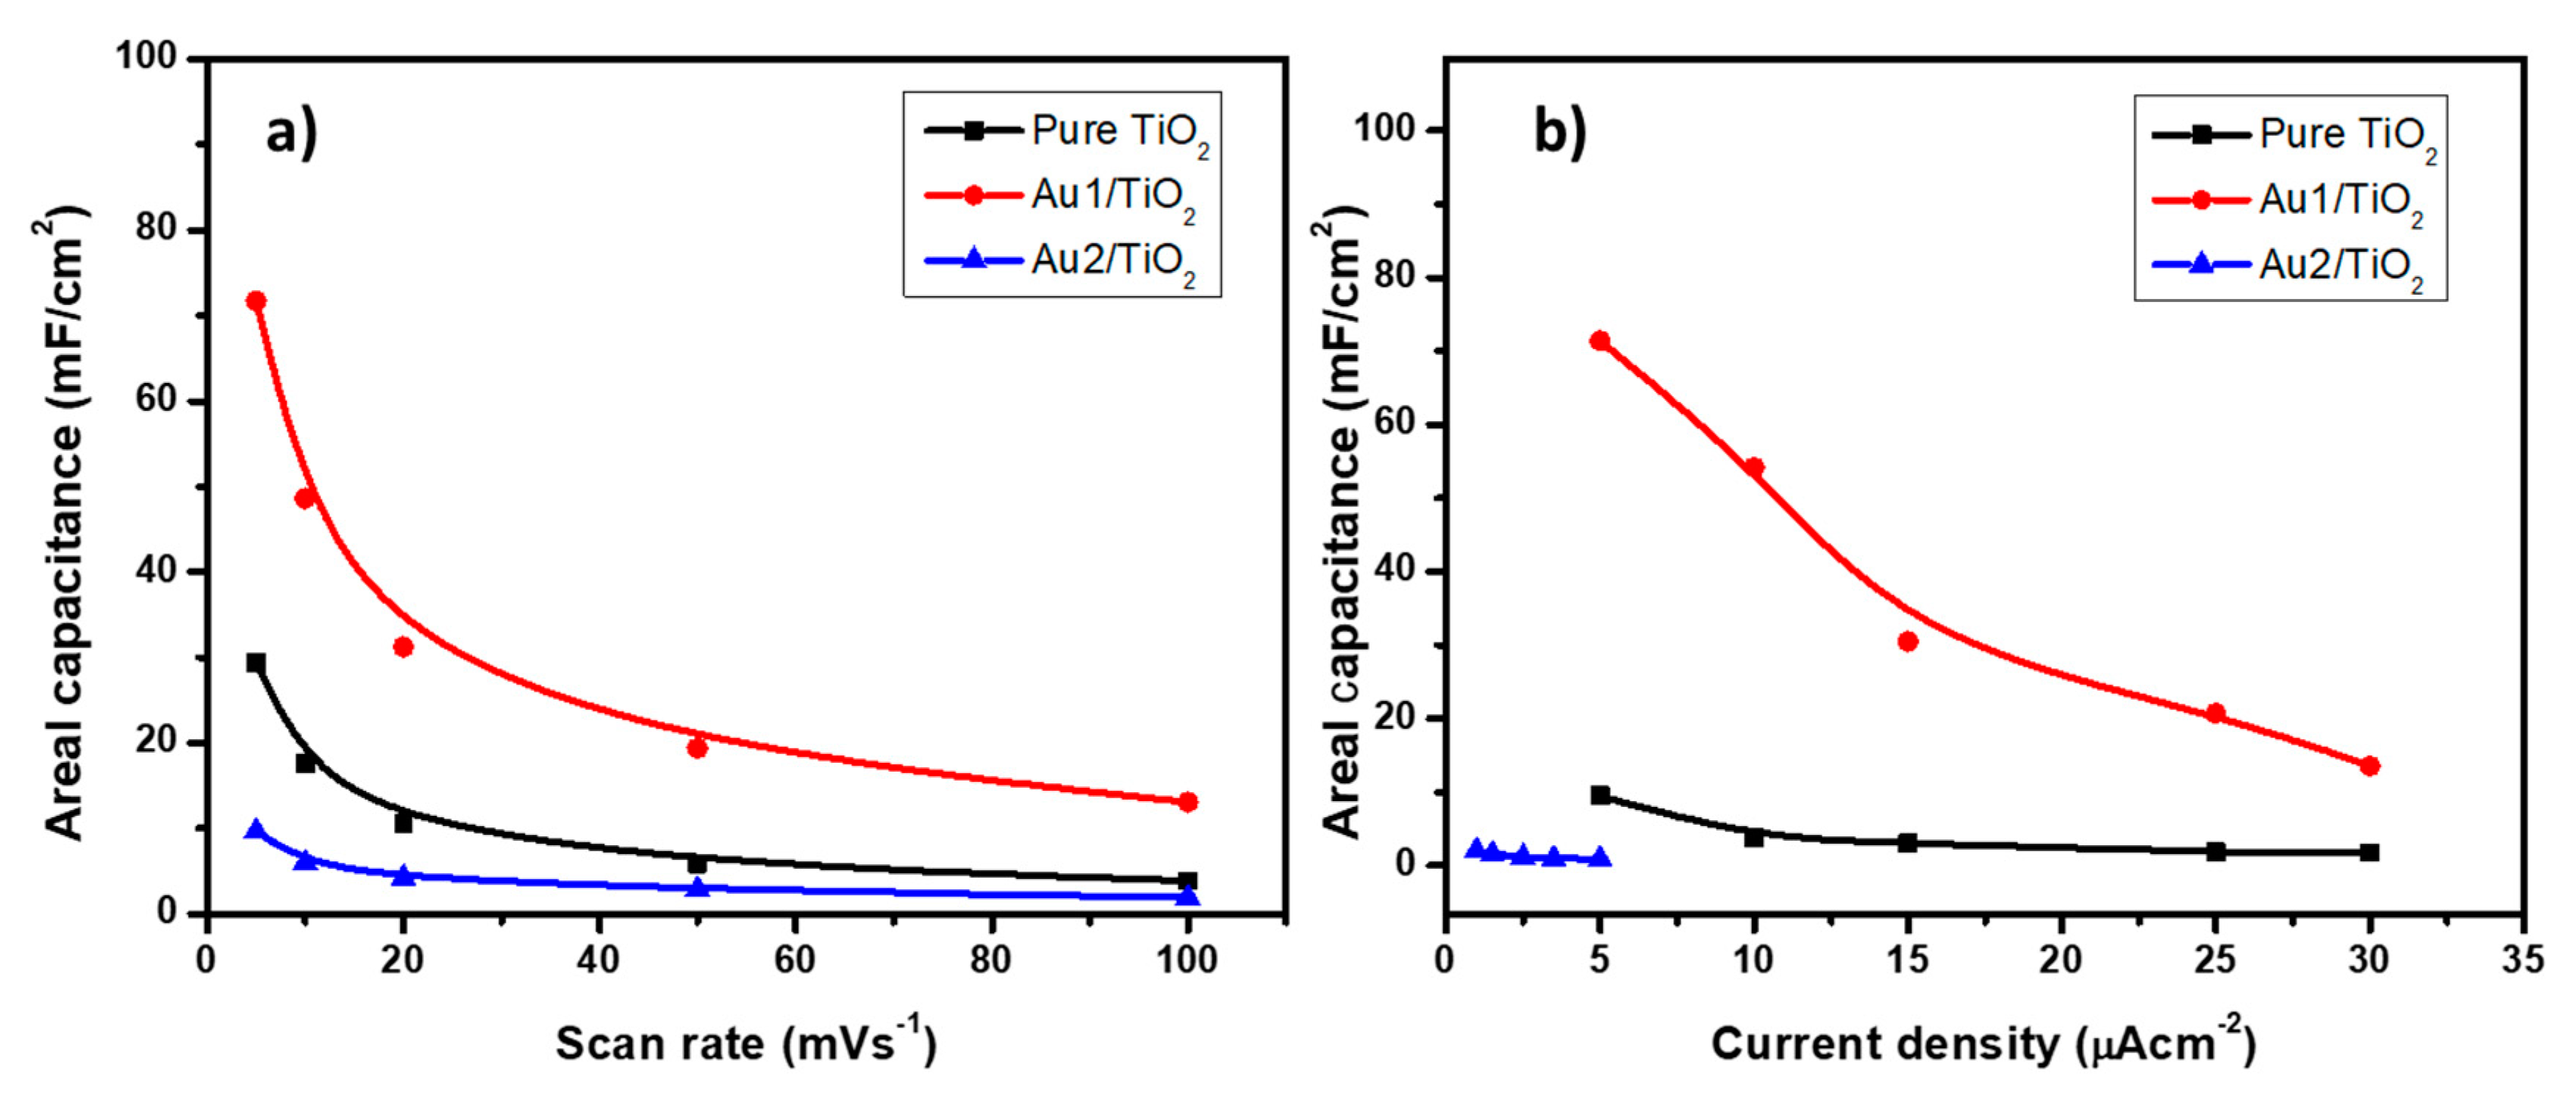
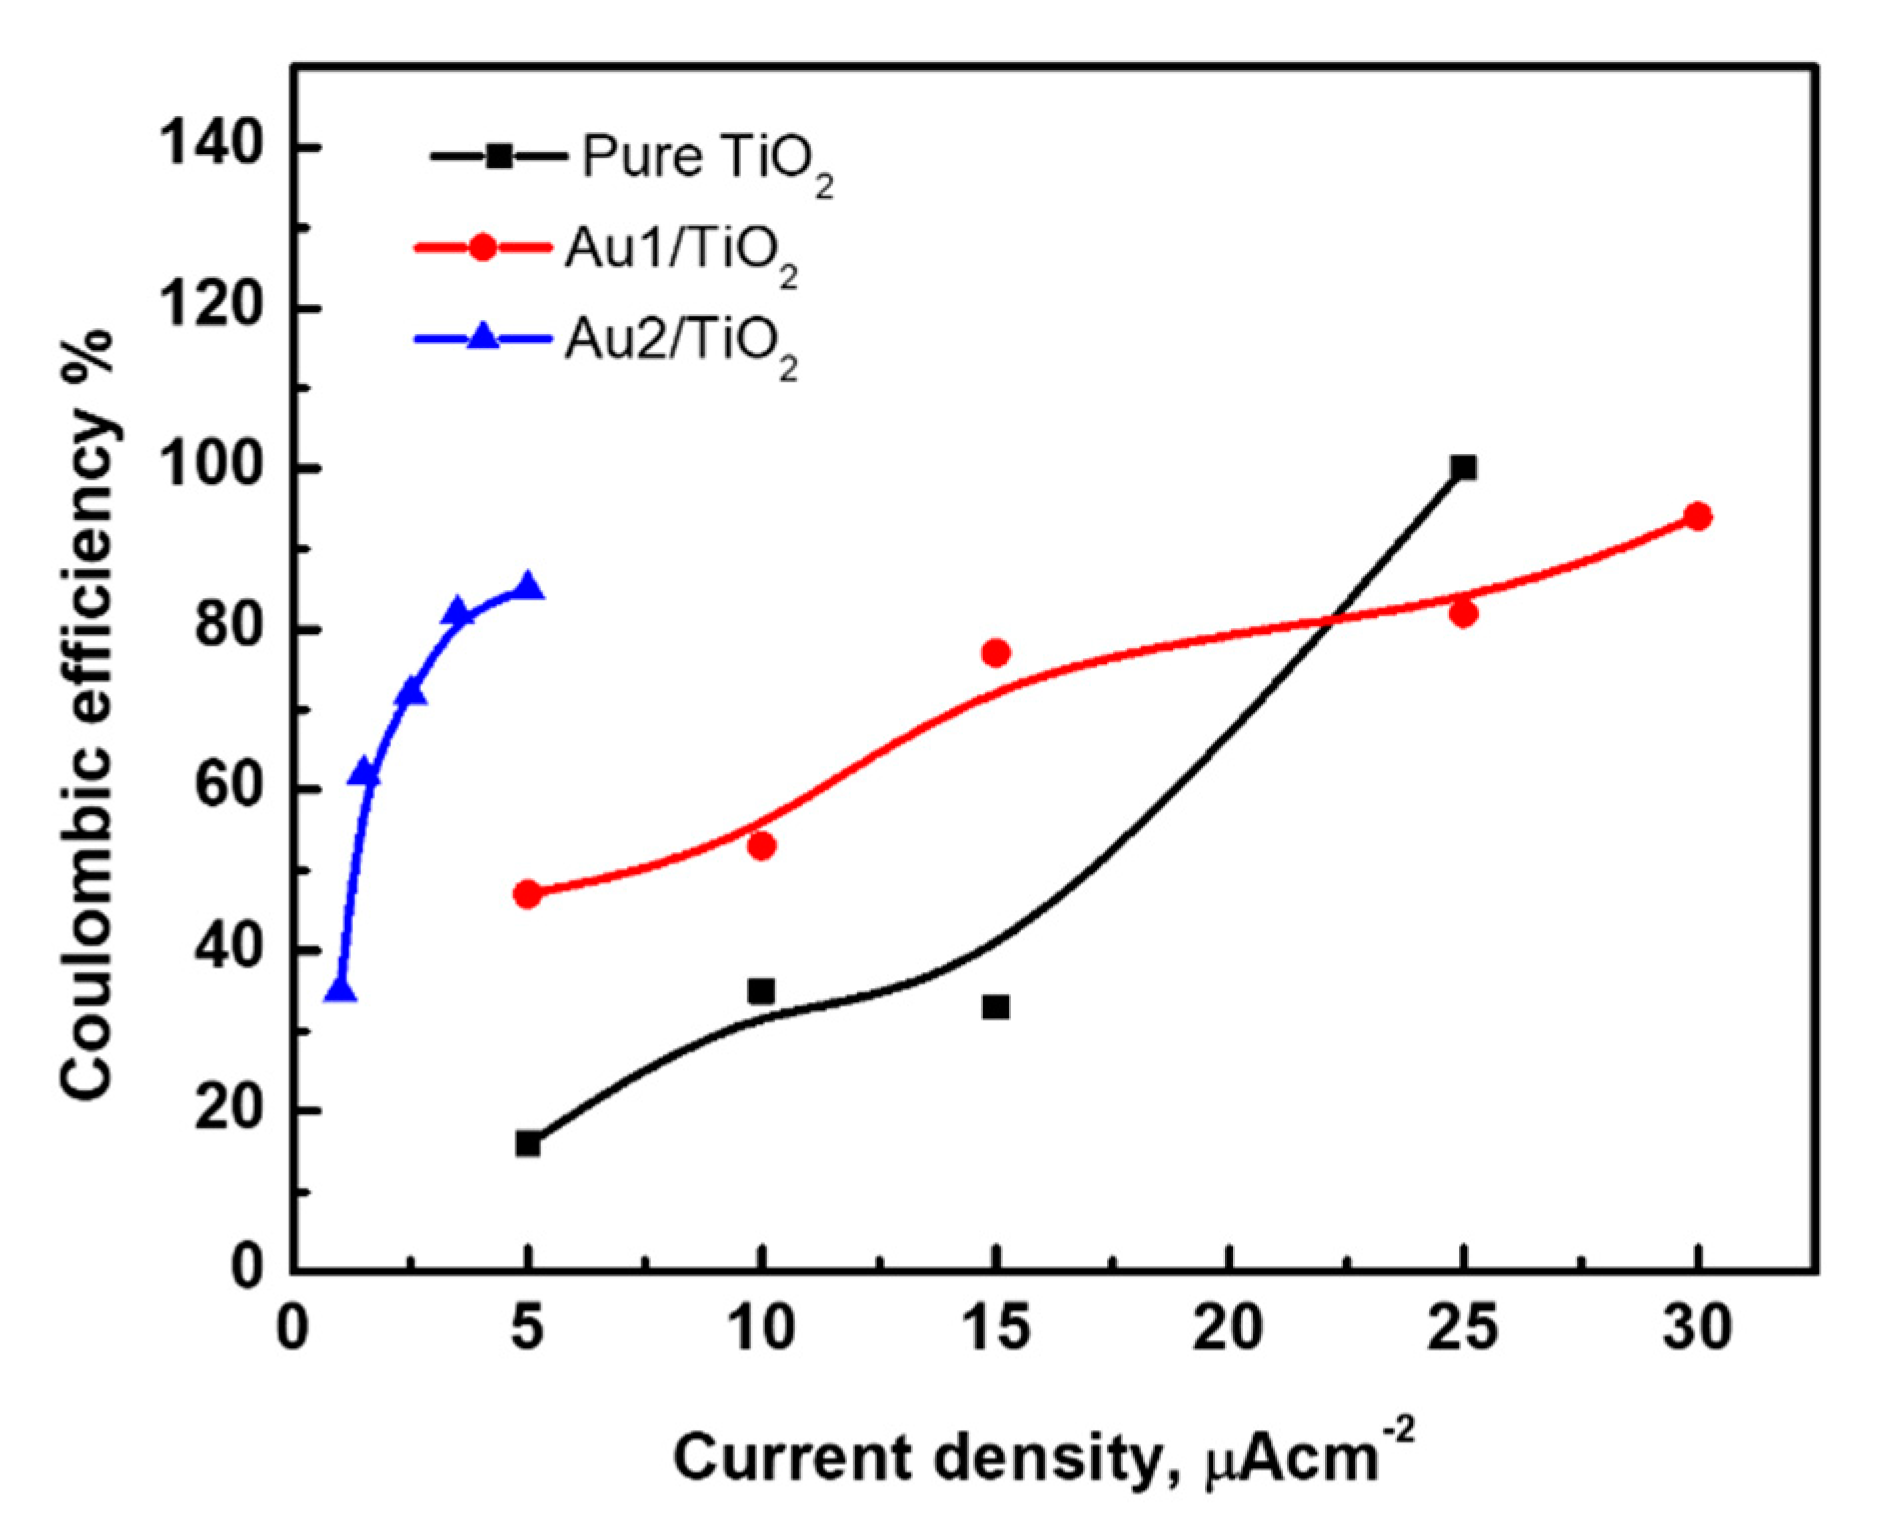
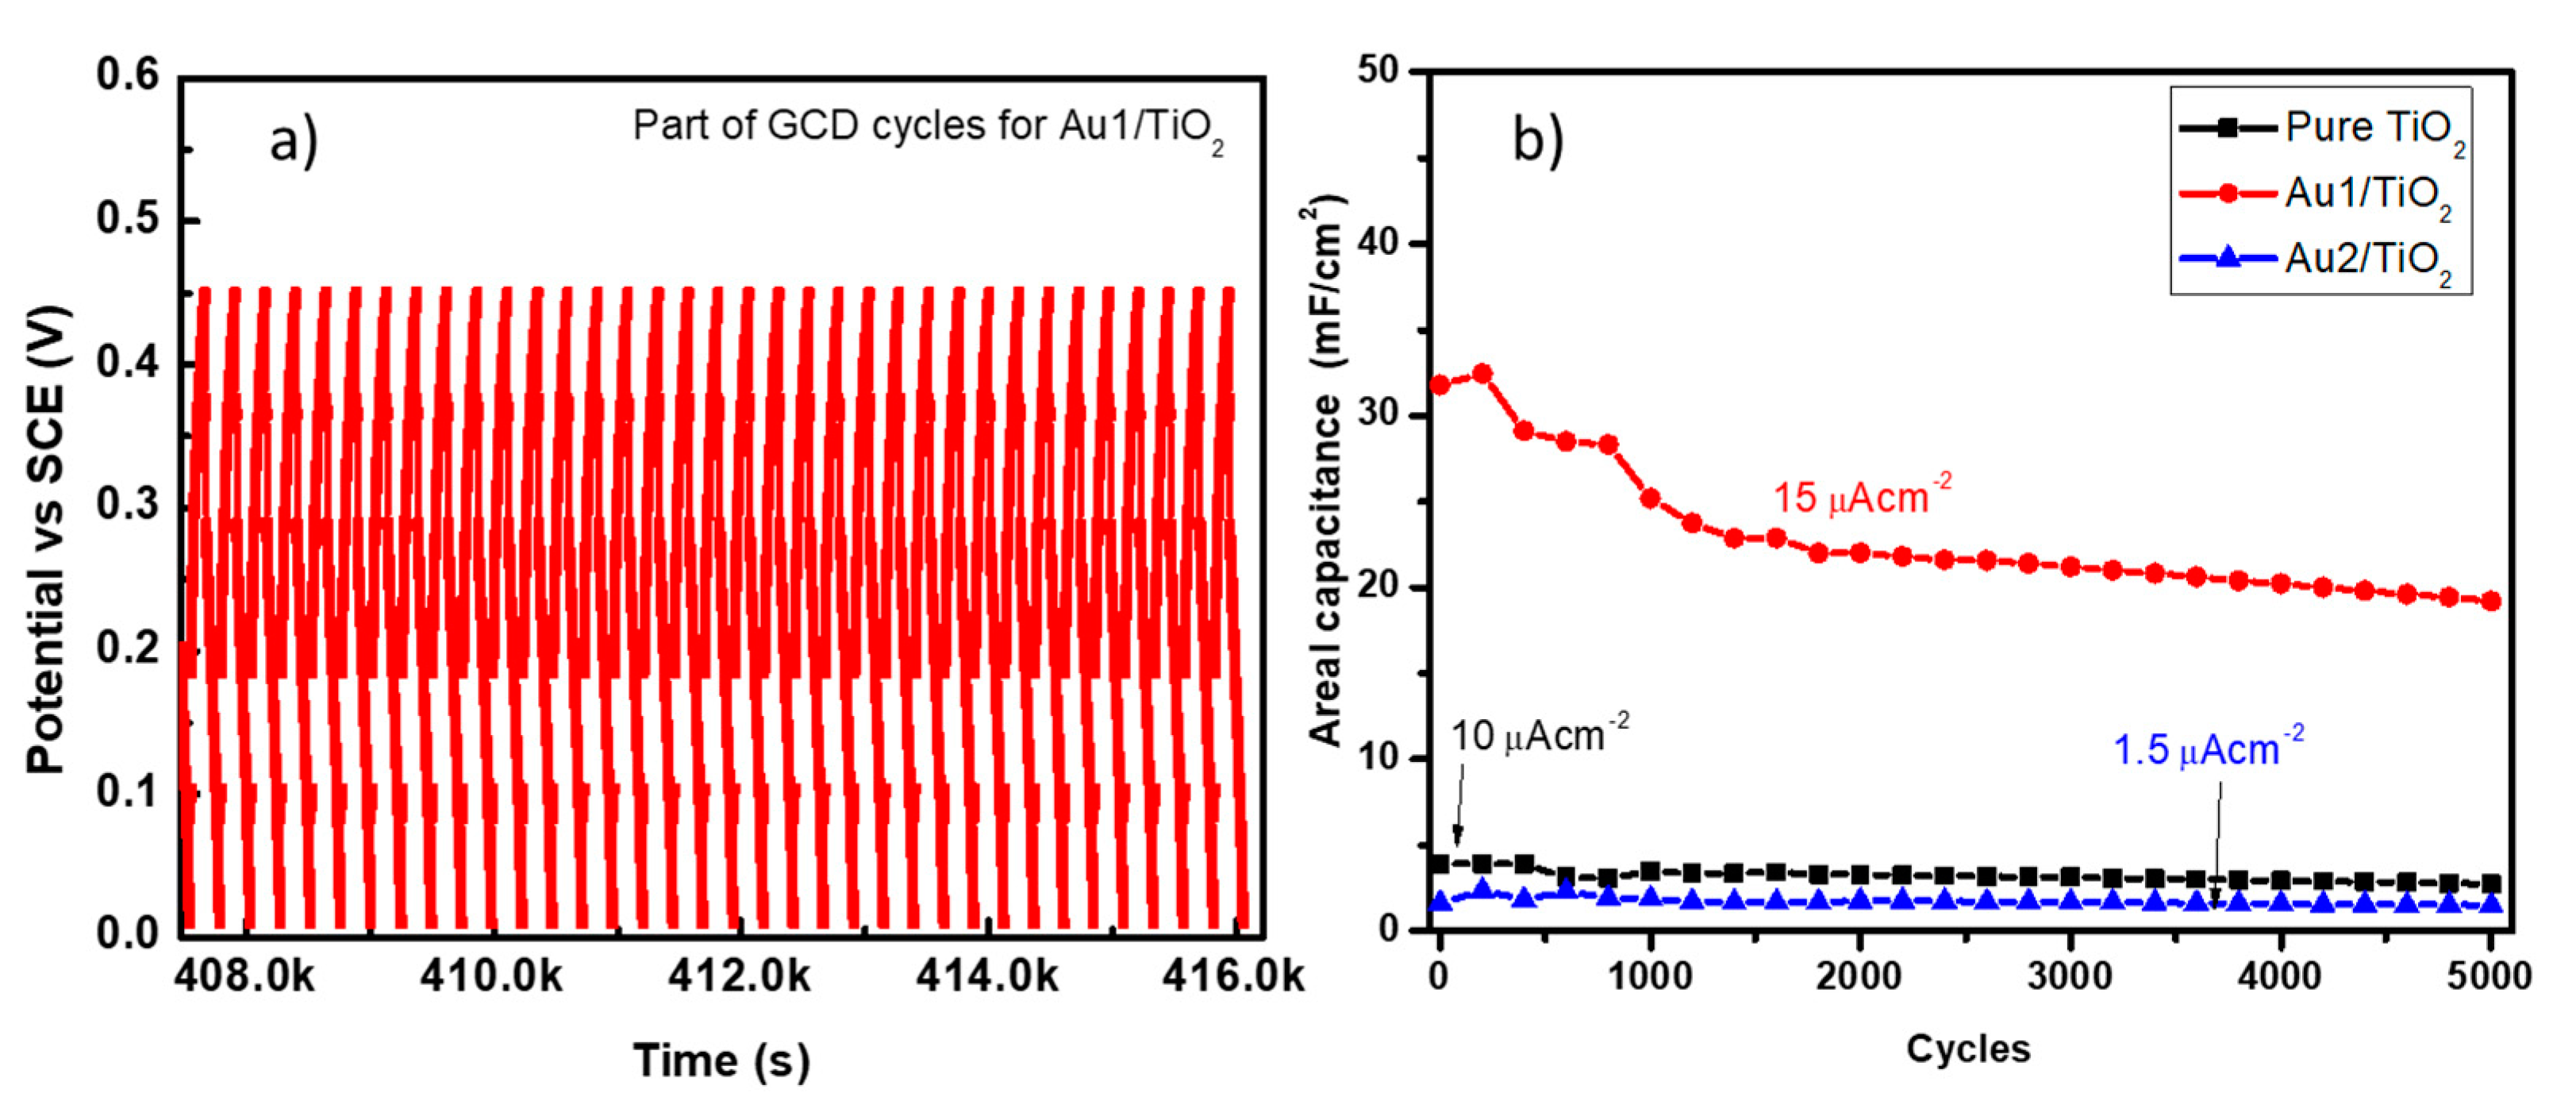
3.3. Au/TiO2 Electrochemical Characterizations

For the evaluation of the potential application for Au/TiO2 as supercapacitors, the electrochemical properties were examined. The CV curves of these three electrodes are shown in Figure 5a at a scanning rate of 50 mVs−1. The electrodes exhibited weak redox peaks except for the Au1/TiO2 electrodes, referring to the pseudocapacitor properties. It is shown that the region included in the CV curve for Au1/TiO2 was much larger compared to the others. Roy et al. [27] obtained similar behavior when they used bare Au NPs and Au-TiO2. They compared the mass activity of Au NPs and Au-TiO2 and found that the oxidation peak of Au-TiO2 was shifted and estimated to be 1.45 times higher for Au-TiO2 than that of the bare Au NPs. Thus, the difference in the oxidation potential is due to the difference in the electrode materials, that is, TiO2 of Au/TiO2. The areal capacitance is directly proportional to the area that encloses the charging and discharging CV curves. The GCD curves for the electrodes are shown in Figure 5b. The GCD curves were measured at 5 µAcm−2. The discharge time of the Au1/TiO2 electrode was about 280 s, which was much longer than the pure TiO2 and Au2/TiO2 electrodes. The Au2/TiO2 exhibited a much shorter time, whereas the pure TiO2 electrode exhibited a long time compared to Au2/TiO2. Both the charging and discharging times for Au2/TiO2 were very fast, which may be ascribed to the density of Au nanoadditives on the surface of the TiO2.
For more details, the CV curves of these electrodes at different voltage sweep rates are shown in Figure 6, Figure 7 and Figure 8. When the voltage sweep rate changed from 5.0 to 100 mVs−1, the redox peaks significantly appeared. It may exhibit a rapid redox reaction with the electrolyte, especially for the Au2/TiO2 sample. The redox peaks for pure and Au1/TiO2 electrodes are broader compared to Au2/TiO2 electrodes. The GCD curves of the electrodes at various current densities are shown in Figure 6b, Figure 7b and Figure 8b. For pure TiO2 and Au1/TiO2, the current density was changed from 5.0 to 30.0 µAcm−2, showing fast charging–discharging with increasing current density. For the Au2/TiO2 electrodes, the suitable current density was 1.0 to 5.0 µAcm−2. This behavior for the latter electrode may be due to the wide distribution of Au nanoparticles on the surface of the electrodes. The discharge time was between 30 to 1.0 s and 260 to 7.5 s corresponding to a current density of 5.0 and 30 µAcm−2 for pure TiO2 and Au1/TiO2, respectively. However, it was 30 to 2.8 s for the Au2/TiO2 electrodes corresponding to 1.0 to 5.0 µAcm−2.
The areal capacitance as a function of the scan rate is shown in Figure 9a. The capacitance of the Au1/TiO2 electrode was 72, 48, 32, 20, and 14 mFcm−2 corresponding to the voltage sweep rates of 5, 10, 20, 50, and 100 mVs−1, respectively. The electrode of pure TiO2 has 31 mF.cm−2 at a slow rate of 5 mVs−1, which is a low value compared to the Au1/TiO2 electrode. The excessive concentration of gold on the surface reduced the areal capacitance of TiO2, as exhibited for the Au2/TiO2 electrode. For a further understanding of the behavior of the areal capacitance of the fabricated three electrodes, the capacitance was calculated as a function of the current density. Figure 9b shows the areal capacitance as a function of current density. The Au1/TiO2 electrode exhibited a higher capacitance, which decreased gradually with an increasing current density. Pure TiO2 showed a lower value compared to the Au1/TiO2. Au2/TiO2 showed the lowest value of the areal capacitance, although the current densities were very low compared to the current used for pure and Au1/TiO2 electrodes. According to a previous report [33,34], we guessed that the low gold loading of Au1/TiO2 could accumulate more charges, thereby increasing the areal capacitance. However, the higher Au loading of Au2/TiO2 provided a fast conduction path for electron transfer, resulting in lower charge accumulation and areal capacitance. Qu et al. [23] and Kim [24] reported that Au-doped metal oxide electrode materials exhibited high areal capacitance. Ni(OH)2 coated on gold nanoparticles, reported by Kim, showed an obvious enhancement of 41% capacitance value. It was also reported that gold nanoparticles enhanced the electrochemical performance of PANI and Co3O4 [25,35]. Tan et al. [26] found that the high concentration of gold has a negative influence on the areal capacitance of NiO, which showed an improvement in electrochemical performance at a lower gold concentration. Also, gold nanoparticles have been combined with MWCNT electrode materials to enhance conductivity, which showed lower Au loading and displayed higher areal capacitance thus demonstrating that being decorated with gold nanoparticles with a smaller size is more effective in enhancing the capacitance of the composite [33]. The Coulombic efficiency (CE) is affected by charge–discharge current rates, where the CE is the ratio between charge and discharge capacity (Qdischarging/Qcharging). Thus, we calculated the CE for the three samples as shown in Figure 10. The CE was about 47% and reached 94% for the Au1/TiO2 electrode, while it was 16% and reached 100% (when the charging time was 1.1 s and discharging time was 1.1 s) for pure TiO2 when the current density changed from 5 up to 25 µAcm−2. However, it was 35% at 1.0 µAcm−2 and reached up to 85% at 5 µAcm−2 for the Au2/TiO2 electrode.
The cycling stability of the electrodes is an important parameter to show the readers. Figure 11a shows part of the cyclic GCD curves. Figure 11b includes the cycling curves for the three electrodes. The cycling curves were performed at 15, 10, and 1.5 µAcm−2 for Au1/TiO, pure TiO2, and Au2/TiO2 electrodes, respectively. The diversity of the charging–discharging current densities is due to the diversity in the performance of these three electrodes, as shown in Figure 9b. The areal capacitance was calculated every 100 cycles for all electrodes. After 5000 GCD cycles, the retention percentage was 71%, 63%, and 65% for the pure TiO2, Au1/TiO2, and Au2/TiO2 electrodes, respectively. Considering the data obtained in Figure 11, the areal capacitance of the electrode is mostly stable. The present result of Au2/TiO2 at 15 5 µAcm−2 is compared with the previously published literature, as listed in Table 1.
For a better understanding of their ion and electron transfer performances, the electrical impedance spectroscopy (EIS) Nyquist plots of these electrodes were measured and shown in Figure 12a. The electrochemical processes correlated with the electrolytes, the interface and the redox reactions were simulated as an equivalent electric circuit composed of electrical components by using Zview software. The experimental and simulated impedance spectra show a simplified Randall equivalent circuit of an electrochemical system. The impedance measurements were modeled by a Nyquist plot, where Z’ and Z” are real and imaginary impedances, respectively. The Z’ represents the values of solution resistance (Rs), electron transfer resistance (Rct), and real Warburg impedance (Wo-R) [42]. The Warburg impedance exhibits the redox species diffusion in the electrode [43]. It is known that Zw is the Warburg impedance that models slow diffusion processes. Warburg impedance is a frequency-dependent element. It has magnitude and phase components. The finite-length Warburg element terminates in an open circuit. At very low frequencies, the Z’ approaches Wo-R, and Z” continue to increase, similar to the behavior of a capacitor. The semicircle in the high-frequency range is well-shown for the Au1/TiO2 electrode, weak for pure TiO2, and it disappeared for Au2/TiO2. Thus, the Rct is not well-defined for Au2/TiO2. The Warburg impedance is the highest dominator in the Au2/TiO2 electrodes. The computed values of Rct, Rs, and Wo-R are listed in Table 2. An alternative way to convey the impedance results is a Bode plot [42,43]. Compared to the Nyquist plot, the Bode plot is very popular in the engineering community to express well the EIS results. The Bode plot involves logarithmic plots of impedance magnitude and frequency, as shown in Figure 12b. It is known that impedance (Z) expresses a component resistance to DC and AC. It is defined as a complex number (Z = R + jXC; XC = 1/ωC, where ω is the angular frequency, and C is the capacitance). The impedance is equal to the resistance (Z’) if the resistor is ideal (the real part of the impedance is the resistance) where the imaginary part is zero. In such a case, the impedance is not affected by the applied frequency. The impedance is equal to the XC in the case of the ideal capacitor, indicating a decrease in the reactance while raising the frequency. Figure 12b confirms this behavior, where Rct was well-observed for pure TiO2 and the Au1/TiO2 electrodes but was not observed for the Au2/TiO2 electrodes. Thus, we can conclude that the EIS circuit proposed in Figure 12c is applicable for the former two electrodes; however, it is applicable for the latter without only Rct. CDL, and Rs are well defined in the Bode plots.

4. Conclusions

In summary, ceramic Au/TiO2 made of one-dimensional (1D) nanocomposite was rationally designed and successfully fabricated by the direct oxidation method of the TiO2 sheet. Raman spectroscopy and FESEM confirmed the growth of the rutile phase and 1D nanostructure of TiO2 bulk. The growth of 1D TiO2 by this method is supported by a growth mechanism during the oxidation process. One-dimensional nanostructures were used as a standalone supercapacitor electrode. The electrochemical process was explained in terms of the Nyquist plots and the Bode plots, as well. TiO2 doped with Au nanoparticles exhibited greatly improved electrochemical performance at low Au concentrations. The highest areal capacitance of 72 mFcm−2 at a current density of 5 µAcm−2 was recorded for TiO2 doped with a low Au concentration. However, the excessive Au concentration on the TiO2 surface exhibited a negative effect on the capacitance value. The Bode plots gave a visualization for the electrochemical reactions, and the EIS circuit components connected based on these electrodes. The Warburg impedance is the highest dominator in the Au2/TiO2 electrodes. The computed values of Rct and Rs were estimated. After 5000 cycles, the capacitance retained 71%, 63%, and 65% for the pure TiO2, Au1/TiO2, and Au2/TiO2 electrodes, respectively. The synergistic effect of Au doping on the TiO2 surface makes Au/TiO2 a promising nanocomposite material for standalone energy storage electrodes.

Author Contributions

Conceptualization, N.M.S.; methodology, F.A. and N.M.S.; software, F.A.; validation, M.R., S.K., and O.S.; formal analysis, H.M.K. and A.F.A.-N.; investigation, M.E. and M.R.; resources, A.F.A.-N.; data curation, N.M.S.; writing—original draft preparation, N.M.S.; writing—review and editing, M.E. and A.Z.M.; visualization, A.Z.M.; supervision, N.M.S.; project administration, N.M.S.; funding acquisition, N.M.S. All authors have read and agreed to the published version of the manuscript.

Funding

This work was supported through the Annual Funding track by the Deanship of Scientific Research, Vice Presidency for Graduate Studies and Scientific Research, King Faisal University, Saudi Arabia [Project No. AN000131].

Institutional Review Board Statement

Not applicable.

Informed Consent Statement

Not applicable.

Data Availability Statement

Data are available up on request.

Acknowledgments

The authors thank the DSR at King Faisal University for financial and technical support.

Conflicts of Interest

The authors declare no conflict of interest.

References

  1. Funabashi, T. Energy Storage System—An overview|ScienceDirect Topics. 2016. Available online: https://www.sciencedirect.com/topics/materials-science/supercapacitor-energy-storage-system (accessed on 13 March 2022).
  2. Niu, H.; Zhou, H.; Lin, T. Electrospun carbon nanofibers as electrode materials for supercapacitor applications. In Electrospun Polymers and Composites; Woodhead Publishing: Sawston, UK, 2021; pp. 641–688. [Google Scholar] [CrossRef]
  3. Adil, M.; Abdelkareem, M.A.; Sayed, E.T.; Rodriguez, C.; Ramadan, M.; Olabi, A.-G. Progress of Metal Chalcogenides in Supercapacitors. In Encyclopedia of Smart Materials; Elsevier: Amsterdam, The Netherlands, 2022; pp. 424–433. [Google Scholar] [CrossRef]
  4. Maitra, A.; Bera, S.; Halder, L.; Khatua, B.B. Advanced functional materials and devices for energy conversion and storage applications. In Sustainable Materials and Green Processing for Energy Conversion; Elsevier: Amsterdam, The Netherlands, 2022; pp. 43–96. [Google Scholar] [CrossRef]
  5. De, S.; Acharya, S.; Sahoo, S.; Nayak, G.C. Present status of biomass-derived carbon-based composites for supercapacitor application. In Nanostructured, Functional, and Flexible Materials for Energy Conversion and Storage Systems; Elsevier: Amsterdam, The Netherlands, 2020; pp. 373–415. [Google Scholar] [CrossRef]
  6. El-Shafei, M.H.; Hassanin, A.H.; Shaalan, N.M.; Sharshar, T.; El-Moneim, A.A. Free-standing interconnected carbon nanofiber electrodes: New structural designs for supercapacitor application. Nanotechnology 2020, 31, 185403. [Google Scholar] [CrossRef]
  7. El-Deen, A.G.; El-Shafei, M.H.; Hessein, A.; Hassanin, A.H.; Shaalan, N.M.; El-Moneim, A.A. High-performance asymmetric supercapacitor based hierarchical NiCo2 O4 @ carbon nanofibers//Activated multichannel carbon nanofibers. Nanotechnology 2020, 31, 365404. [Google Scholar] [CrossRef]
  8. Wang, T.; Chen, H.C.; Yu, F.; Zhao, X.S.; Wang, H. Boosting the cycling stability of transition metal compounds-based supercapacitors. Energy Storage Mater. 2019, 16, 545–557. [Google Scholar] [CrossRef] [Green Version]
  9. Pal, N. Nanoporous metal oxide composite materials: A journey from the past, present to future. Adv. Colloid Interface Sci. 2020, 280, 102156. [Google Scholar] [CrossRef]
  10. Tiwari, A.P.; Chhetri, K.; Kim, H.; Ji, S.; Chae, S.-H.; Kim, T.; Kim, H.Y. Self-assembled polypyrrole hierarchical porous networks as the cathode and porous three dimensional carbonaceous networks as the anode materials for asymmetric supercapacitor. J. Energy Storage 2021, 33, 102080. [Google Scholar] [CrossRef]
  11. Chhetri, K.; Tiwari, A.P.; Dahal, B.; Ojha, G.P.; Mukhiya, T.; Lee, M.; Kim, T.; Chae, S.-H.; Muthurasu, A.; Kim, H.Y. A ZIF-8-derived nanoporous carbon nanocomposite wrapped with Co3O4-polyaniline as an efficient electrode material for an asymmetric supercapacitor. J. Electroanal. Chem. 2020, 856, 113670. [Google Scholar] [CrossRef]
  12. Shaalan, N.M.; Hanafy, T.A.; Rashad, M. Dual optical properties of NiO-doped PVA nanocomposite films. Opt. Mater. 2021, 119, 111325. [Google Scholar] [CrossRef]
  13. Shaalan, N.M.; Hamad, D.; Aljaafari, A.; Abdel-Latief, A.Y.; Abdel-Rahim, M.A. Preparation and Characterization of Developed CuxSn1−xO2 Nanocomposite and Its Promising Methane Gas Sensing Properties. Sensors 2019, 19, 2257. [Google Scholar] [CrossRef] [Green Version]
  14. Shaalan, N.M.; Morsy, A.E.A.; Abdel-Rahim, M.A.; Rashad, M. Simple preparation of Ni/CuO nanocomposites with superior sensing activity toward the detection of methane gas. Appl. Phys. A Mater. Sci. Process 2021, 127, 455. [Google Scholar] [CrossRef]
  15. Deshmukh, P.R.; Lokhande, C.D. SILAR deposited TiO2 thin film for supercapacitor application. AIP Conf. Proc. 2013, 1536, 787–788. [Google Scholar] [CrossRef]
  16. Naeem, F.; Naeem, S.; Zhao, Y.; Wang, D.; Zhang, J.; Mei, Y.F.; Huang, G. TiO2 Nanomembranes Fabricated by Atomic Layer Deposition for Supercapacitor Electrode with Enhanced Capacitance. Nanoscale Res. Lett. 2019, 14, 92. [Google Scholar] [CrossRef] [PubMed]
  17. Han, C.; Xu, X.; Mu, H.; Tian, Q.; Li, Q.; Liu, Y.; Zhang, X.; Zhao, Z.; Su, X. Construction of hierarchical sea urchin-like manganese substituted nickel cobaltite@tricobalt tetraoxide core-shell microspheres on nickel foam as binder-free electrodes for high performance supercapacitors. J. Colloid Interface Sci. 2021, 596, 89–99. [Google Scholar] [CrossRef] [PubMed]
  18. Mu, H.; Su, X.; Zhao, Z.; Han, C.; Wang, Z.; Zhao, P. Facile synthesis of Ni0.5Mn0.5Co2O4 nanoflowers as high-performance electrode material for supercapacitors. J. Am. Ceram. Soc. 2019, 102, 6893–6903. [Google Scholar] [CrossRef]
  19. Iqbal, M.; Saykar, N.G.; Arya, A.; Banerjee, I.; Alegaonkar, P.S.; Mahapatra, S.K. High-performance supercapacitor based on MoS2@TiO2 composite for wide range temperature application. J. Alloys Compd. 2021, 883, 160705. [Google Scholar] [CrossRef]
  20. Hodaei, A.; Dezfuli, A.S.; Naderi, H.R. A high-performance supercapacitor based on N-doped TiO2 nanoparticles. J. Mater. Sci. Mater. Electron. 2018, 29, 14596–14604. [Google Scholar] [CrossRef]
  21. Elmouwahidi, A.; Bailón-García, E.; Castelo-Quibén, J.; Pérez-Cadenas, A.F.; Maldonado-Hódar, F.J.; Carrasco-Marín, F. Carbon-TiO2 composites as high-performance supercapacitor electrodes: Synergistic effect between carbon and metal oxide phases. J. Mater. Chem. A 2018, 6, 633–644. [Google Scholar] [CrossRef]
  22. Al Suliman, N.; Awada, C.; Alshoaibi, A.; Shaalan, N.M. Simple preparation of ceramic-like materials based on 1d-agx(X=0, 5, 10, 20, 40 mm)/tio2 nanostructures and their photocatalysis performance. Crystals 2020, 10, 1024. [Google Scholar] [CrossRef]
  23. Qu, B.; Hu, L.; Chen, Y.; Li, C.; Li, Q.; Wang, Y.; Wei, W.; Chen, L.; Wang, T. Rational design of Au–NiO hierarchical structures with enhanced rate performance for supercapacitors. J. Mater. Chem. A 2013, 1, 7023–7026. [Google Scholar] [CrossRef]
  24. Kim, S.-I.; Thiyagarajan, P.; Jang, J.-H. Great improvement in pseudocapacitor properties of nickel hydroxide via simple gold deposition. Nanoscale 2014, 6, 11646–11652. [Google Scholar] [CrossRef]
  25. Tan, Y.; Liu, Y.; Kong, L.; Kang, L.; Ran, F. Supercapacitor electrode of nano-Co3O4 decorated with gold nanoparticles via in-situ reduction method. J. Power Sources 2017, 363, 1–8. [Google Scholar] [CrossRef]
  26. Tan, Y.; Li, Y.; Kong, L.; Kang, L.; Ran, F. Synthesis of ultra-small gold nanoparticles decorated onto NiO nanobelts and their high electrochemical performance. Dalt. Trans. 2018, 47, 8078–8086. [Google Scholar] [CrossRef] [PubMed]
  27. Roy, N.; Bhunia, K.; Terashima, C.; Fujishima, A.; Pradhan, D. Citrate-Capped Hybrid Au-TiO2 Nanomaterial for Facile and Enhanced Electrochemical Hydrazine Oxidation. ACS Omega 2017, 2, 1215–1221. [Google Scholar] [CrossRef] [PubMed]
  28. Tuschel, D. The Correlation Method for the Determination of Spectroscopically Active Vibrational Modes in Crystals. Spectroscopy 2015, 30, 17–22. Available online: https://www.spectroscopyonline.com/view/correlation-method-determination-spectroscopically-active-vibrational-modes-crystals (accessed on 6 April 2022).
  29. Fateley, W.G.; McDevitt, N.T.; Bentley, F.F. Infrared and Raman Selection Rules for Lattice Vibrations: The Correlation Method. Appl. Spectrosc. 1971, 25, 155–173. [Google Scholar] [CrossRef]
  30. Tompsett, G.A.; Bowmaker, G.A.; Cooney, R.P.; Metson, J.B.; Rodgers, K.A.; Seakins, J.M. The Raman spectrum of brookite, TiO2 (Pbca, Z = 8). J. Raman Spectrosc. 1995, 26, 57–62. [Google Scholar] [CrossRef]
  31. Lang, J.W.; Kong, L.B.; Wu, W.J.; Luo, Y.C.; Kang, L. Facile approach to prepare loose-packed NiO nano-flakes materials for supercapacitors. Chem. Commun. 2008, 35, 4213–4215. [Google Scholar] [CrossRef]
  32. Zhang, X.; Shi, W.; Zhu, J.; Zhao, W.; Ma, J.; Mhaisalkar, S.; Maria, T.L.; Yang, Y.; Zhang, H.; Hng, H.H.; et al. Synthesis of porous NiO nanocrystals with controllable surface area and their application as supercapacitor electrodes. Nano Res. 2010, 3, 643–652. [Google Scholar] [CrossRef] [Green Version]
  33. Chaudhari, K.N.; Chaudhari, S.; Yu, J.-S. Synthesis and supercapacitor performance of Au-nanoparticle decorated MWCNT. J. Electroanal. Chem. 2016, 761, 98–105. [Google Scholar] [CrossRef]
  34. Ma, H.; Chen, Z.; Gao, X.; Liu, W.; Zhu, H. 3D hierarchically gold-nanoparticle-decorated porous carbon for high-performance supercapacitors. Sci. Rep. 2019, 9, 17065. [Google Scholar] [CrossRef]
  35. Tan, Y.; Zhang, Y.; Kong, L.; Kang, L.; Ran, F. Nano-Au@PANI core-shell nanoparticles via in-situ polymerization as electrode for supercapacitor. J. Alloys Compd. 2017, 722, 1–7. [Google Scholar] [CrossRef]
  36. Adewinbi, S.A.; Buremoh, W.; Owoeye, V.A.; Ajayeoba, Y.A.; Salau, A.O.; Busari, H.K.; Tijani, M.A.; Taleatu, B.A. Preparation and characterization of TiO2 thin film electrode for optoelectronic and energy storage Potentials: Effects of Co incorporation. Chem. Phys. Lett. 2021, 779, 138854. [Google Scholar] [CrossRef]
  37. Achour, A.; Porto, R.L.; Soussou, M.A.; Islam, M.; Boujtita, M.; Aissa, K.A.; le Brizoual, L.; Djouadi, A.; Brousse, T. Titanium nitride films for micro-supercapacitors: Effect of surface chemistry and film morphology on the capacitance. J. Power Sources 2015, 300, 525–532. [Google Scholar] [CrossRef]
  38. El-Kady, M.F.; Strong, V.; Dubin, S.; Kaner, R.B. Laser Scribing of High-Performance and Flexible Graphene-Based Electrochemical Capacitors. Science 2012, 335, 1326–1330. [Google Scholar] [CrossRef] [Green Version]
  39. Acerce, M.; Voiry, D.; Chhowalla, M. Metallic 1T phase MoS2 nanosheets as supercapacitor electrode materials. Nat. Nanotechnol. 2015, 10, 313–318. [Google Scholar] [CrossRef] [PubMed]
  40. Zhang, P.; Zhu, F.; Wang, F.; Wang, J.; Dong, R.; Zhuang, X.; Schmidt, O.G.; Feng, X. Stimulus-Responsive Micro-Supercapacitors with Ultrahigh Energy Density and Reversible Electrochromic Window. Adv. Mater. 2017, 29, 1604491. [Google Scholar] [CrossRef] [PubMed] [Green Version]
  41. Wu, J.; Peng, J.; Yu, Z.; Zhou, Y.; Guo, Y.; Li, Z.; Lin, Y.; Ruan, K.; Wu, C.; Xie, Y. Acid-Assisted Exfoliation toward Metallic Sub-nanopore TaS2 Monolayer with High Volumetric Capacitance. J. Am. Chem. Soc. 2018, 140, 493–498. [Google Scholar] [CrossRef] [PubMed]
  42. Carminati, M.; Ferrari, G.; Bianchi, D. Impedance Spectroscopy for Biosensing: Circuits and Applications. In Handbook of Biochips; Springer: Berlin/Heidelberg, Germany, 2020; pp. 1–24. [Google Scholar] [CrossRef]
  43. Magar, H.S.; Hassan, R.Y.A.; Mulchandani, A. Electrochemical impedance spectroscopy (Eis): Principles, construction, and biosensing applications. Sensors 2021, 21, 6578. [Google Scholar] [CrossRef]
Figure 1. The Raman spectra of TiO2, Au1/TiO2, and Au2/TiO2 samples.
Crystals 12 00791 g001
Figure 2. FESEM images of Au/TiO2: (a) pure TiO2, (b) Au1/TiO2, (c) Au2/TiO2 samples, and (d) the cross-sectional image of the prepared TiO2.
Crystals 12 00791 g002
Figure 3. XRD patterns for the as-prepared pure TiO2, Au1/TiO2, and Au2/TiO2.
Crystals 12 00791 g003
Figure 4. The scheme diagram described the growth mechanism of Au/TiO2 nanostructures.
Crystals 12 00791 g004
Figure 5. (a) CV curves measured at a scan rate of 50 mVs−1 for pure TiO2, Au1/TiO2, and Au2/TiO2 samples and (b) GCD curves measured at a current density of 5 µAcm−2.
Crystals 12 00791 g005
Figure 6. (a) CV curves of pure TiO2 electrode measured at various voltage sweep rates and (b) GCD curves of pure TiO2 electrode measured at various current densities.
Crystals 12 00791 g006
Figure 7. (a) CV curves of Au1/TiO2 electrode measured at various voltage sweep rates and (b) GCD curves of Au1/TiO2 electrode measured at various current densities.
Crystals 12 00791 g007
Figure 8. (a) CV curves of Au2/TiO2 electrode measured at various voltage sweep rates and (b) GCD curves of Au2/TiO2 electrode measured at various current densities.
Crystals 12 00791 g008
Figure 9. (a) Areal capacitance versus the voltage sweep rate and (b) areal capacitance versus the current density for pure TiO2, Au1/TiO2, and Au2/TiO2 electrodes.
Crystals 12 00791 g009
Figure 10. The Coulombic efficiency (CE) calculated from the GCD curves for the three electrodes.
Crystals 12 00791 g010
Figure 11. (a) Part of the cycles of the GCD curve of Au1/TiO2 and (b) the cyclic stability for pure TiO2, Au1/TiO2, and Au2/TiO2 electrodes.
Crystals 12 00791 g011
Figure 12. (a) Nyquist plot, (b) Bode plots of the impedance magnitude of an electrochemical interface, (c) the equivalent EIS proposed circuit (fitting by Zview software), and (d) scheme of the reaction that takes place at circuit components for pure TiO2, Au1/TiO2, and Au2/TiO2 electrodes.
Crystals 12 00791 g012
Table 1. Comparison with similar thin-film electrodes, in terms of the type, selfstanding, and areal capacitance.
Sample TypeSelfstandingAreal CapacitanceRef.
Codoped TiO2
Thin film
yes 15.86 mFcm−2[36]
TiN thin film yes 12.00 mFcm−2[37]
Laser-GOyes 3.67 mFcm−2[38]
MoS2 filmyes 700 Fcm−3 (thickness 5 µm) [39]
V2O5 nanoribbons filmexfoliated graphene-based hybrid and viologen as electrode 3.92 mFcm−2[40]
TaS2 monolayeryes 508 Fcm−3 (thickness 330 nm[41]
Au/TiO2yes 32 mFcm−2 (thickness 5 µm)Present result
Table 2. The values of solution resistance (Rs) and electron transfer resistance (Rct) for the tested devices.
SampleRs (Ω)Rct (Ω)Wo1-R (Ω)
Pure TiO21039001200
Au1/TiO21420002000
Au2/TiO216/28,000
Publisher’s Note: MDPI stays neutral with regard to jurisdictional claims in published maps and institutional affiliations.

