Article

The Indentation Size Effect (ISE) of Metals

1
Faculty of Materials, Metallurgy and Recycling, Institute of Materials and Quality Engineering, Technical University of Kosice, Letna 1/9, 04200 Kosice, Slovakia
2
Department of Safety and Quality, Faculty of Mechanical Engineering, Technical University of Kosice, Letna 1/9, 04200 Kosice, Slovakia
*
Author to whom correspondence should be addressed.
Crystals 2022, 12(6), 795; https://doi.org/10.3390/cryst12060795
Submission received: 13 May 2022 / Revised: 30 May 2022 / Accepted: 30 May 2022 / Published: 2 June 2022

Abstract

:
The literature regarding the Reverse Indentation Size Effect (RISE) is scarce, the occurrence of which is assumed for plastic materials, including metals. The content of this article is to study the relationship between applied load and measured values of the Vickers micro-hardness of 19 metals with different types of lattices, measured with a Hanemann tester. The values of the load ranged between 0.09807 N (10 g) and 0.9807 N (100 g). The size and character of the Indentation Size Effect (ISE) were evaluated by Meyer’s power law (index n), Proportional Specimen Resistance (PSR), and Hays—Kendall methods. Meyer’s index n ranged between 1.65 for Mo and 2.44 for Ni. A correlation was found between the micro-hardness and Meyer’s index for metals with FCC and HCP lattices. The measured value of Vickers micro-hardness is influenced by the size and nature of the ISE. If this is not taken into account, it may be misleading. For this reason, we recommend using the “true hardness”, determined by the presented method.

1. Introduction

The micro-hardness test is often used to pre-determine the mechanical properties of a material. It differs from the Vickers (macro) hardness test only by “a very low” applied test load. The Vickers method can be used for testing metals, particularly those with extremely hard surfaces: the surface is subjected to a standard pressure for a standard length of time using a pyramid-shaped diamond with a vertex angle of 136°. The length of the indentation’s diagonal, measured under a microscope, is inversely proportional to its hardness. Especially if it is measured in the range of micro-hardness, it is necessary to pay attention to the quality preparation of the measured surface.
The micro-hardness test is used for small components, such as gears, wire, and foils. Unlike macro-hardness, the indentations are slight and can usually be tolerated on the surface of the final product. It can also be used in metallography, for example, for the determination of the hardness of small particles or thin layers, and the identification of individual phases. A new indentation technique, depth-sensing indentation, allows wider information extraction from measured data.
Westbrook and Conrad [1] addressed that “Hardness measurements are at once among the most maligned and the most magnificent of physical measurements”. They are maligned because they are often misinterpreted by the uninitiated, and magnificent because they are so efficient in generating information for the skilled practitioner. The problematic interpretation of the results of micro-hardness tests is also a consequence of the fact that the stress/strain field beneath the contact point of the indenter and tested material is crucially complicated.
The advantage of the Vickers (macro) hardness test is the fact that the measured hardness value does not depend on the applied load as the shape of the indentations is geometrically self-similar. If the tested sample is homogeneous, then it is likely that the measured hardness will be practically the same across a wide range of loads.
But, if “a very low” test load is used, the measured value (micro) hardness starts to be influenced by other factors. The term “low load” or “a very low load” is controversial. As follows from the standard ISO 6507-1 Table 4 for the micro-hardness tests, the loads (or test forces) range between 0.009807 N (1 g) and 0.9807 N (100 g), and for the low-force hardness between 1.961 N (200 g) and 29.42 N (3000 g) [2]. However, if we take into account the recommendation of the standard ISO 14577-1 [3], the loads for the micro-hardness tests are less than 2 N (~200 g), with the depth of indentation h > 0.2 μm. Or, as stated by Voyiadjis and Peters [4], the depth of indentations at “a very low load” h < 10. It follows that the limit value of “a very low load” is also the result of the hardness of the measured sample.
The study of the correlation between applied load and the measured value of the micro-hardness was carried out for metallic materials, thin films deposited by evaporation or produced plasma deposition, published by Golan et al. [5], semiconductors, organic crystals, published by Rayar and Selvarajan [6], and even brushite (CaHPO4·2H2O) occurring in kidney stones, as stated for example, which was dealt with by Ruban Kumar and Kalainathan [7].
If the range of “very low loads” and the measured values of the micro-hardness decrease with the increase of the load, a “normal” Indentation Size Effect (ISE) occurs. According to Gong et al. [8], the use of these affected values in interpretation may result in some unreliable conclusions.
Several factors influence the origin of “normal” ISE, the factors most often mentioned in the professional literature are: 1. The tester (the device for the measurement of indentation diagonals and the determination of the applied load are identified as possible sources in the works of Sangwal et al. [9], as well as Ren et al. [10]. The influence of uncertainty of automatic testers on ISE were discussed by Petrík et al. [11]). 2. Intrinsic properties of the tested material (work hardening during indentation, load to initiate plastic deformation, indentation elastic recovery, elastic resistance of the materials are mentioned as possible sources at work of Sangwal [12]). 3. Method of the production of samples (grinding, polishing). Other factors are also mentioned, such as the friction between the indenter and the sample, as mentioned by Gong et al. [8], and the impact of the lubrication, analyzed by Navrátil and Novotná [13].
It was also found that there is a “reverse” (inverse, RISE) ISE in which the measured values of the micro-hardness increase with the increase of the load, in contrast to “normal” ISE. It mostly takes place in materials in which plastic deformation is predominant. Sangwal [12] explains this phenomenon by referring to a distorted zone near the interface between the sample and indenter, effects of vibration and bluntness of the indenter, the loss of applied energy as a result of chipping of tested material around the indentation, and the generation of the cracks.
According to information in the literature, “normal” ISE occurs mainly in brittle materials. However, the literature regarding reverse ISE (RISE) is scarce. Its occurrence is assumed, as explained by Sangwal et al. [9], for plastic materials, therefore, most metals and alloys.
The purpose of this article is to measure the micro-hardness of various metals under different loads and subsequently to determine the type and size of the ISE, if any.

2. Materials and Methods

As the tested materials were used metals with a purity greater than 99.5% (technically pure metal), as well as cleaner metals (electrolytic, for analysis, for semiconductors). The metals used as a sample, their purity, and the crystal system lattice (FCC—face-centered cubic, BCC body-centered cubic, HCP—hexagonal close-packed, RH rhombohedral, and TCB tetragonal body-centered) have been listed in Table 1. A total of 32 samples were used. In some cases, if more independent samples of the same metal were available, for example with different purity, their micro-hardness was also measured (Cu, five samples, samples, 1 to 4 differ in the crystallographic orientation of the grains; Al and Co, three samples; Ni, Mo, Cr, Fe, Cd, and Co, two samples).
The samples were cut with a water-cooled diamond saw embedded in the resin (dentacryl) and ground with water-cooled silicon papers in sequences 80, 220, 240, … and 3000 ANSI/CAMI grit to the plane of the axis of the sample. The metallographic surface was mechanically polished with the water suspension of Al2O3 to a mirror finish and finally etched with a suitable etching agent (for example water solution 0.5% HF for aluminum, 2% nital for iron…) to make hard intermetallic phases, grain boundaries, or discontinuities visible. The micro-hardness was not measured in areas where these anomalies occurred. The areas with their phases were avoided at micro-hardness measurement.
A tester Hanemann, type Mod D32, fitted to a Neophot-32 microscope with a magnification of 480× was used to measure the micro-hardness. The value of the smallest division of the device measuring the diagonals of the indentation (discrimination) of the tester is 0.000313 mm. Five CRMs (certified reference material, reference blocks) with specified hardness Hc (HV0.05) and standard uncertainty uCRM (HV0.05), listed in Table 2, were used for the calibration of the tester. The results of calibration are expressed as the repeatability rrel, the error of tester Erel, and relative expanded uncertainty of calibration Urel, all in (%).
The measurement had to be carried out in several stages due to the number of samples and the time-consuming process; the tester was calibrated at each stage. The results of the calibrations and samples whose micro-hardness was measured at the appropriate stage are shown in Table 2. Based on the calibration results, it can be concluded that the hardness tester meets the requirements of the standard ISO 6507-2 [14], except for the uncertainty of calibrations of No. 2, 3, 6, 11, and 14. Since even in these cases, the requirements of the error and repeatability of the tester were met and the limit of uncertainty in the standard is only expressed in general, these calibrations were accepted as satisfactory as well.
The same operator measured all samples on the metallographic surface according to the standard ISO 6507-1 [2]. Applied loads P ranged between 0.09807 N (10 g) and 0.9807 N (100 g) with a 0.09807 N (10 g) step with five indentations (trials) at each load. The load duration (dwell) time was 15 s. The result was a “cluster” of 50 indentions for each sample.
The mean of micro-hardness of individual “clusters” HV and its standard deviation HV SD are in Table 2, as well as environmental conditions (temperature and relative humidity) of measurement. The micro-hardness measurements at selected loads (0.09807N, 0.19614 N, 0.49035 N, and 0.9807 N) are in Table 3. The values of relative expanded uncertainty Urel (at load 0.49035 N, coverage factor k = 2) were calculated according to ISO 6507-2 [14] and are listed in Table 3. Its value is overestimated by the used CRM (iron with Hc = 195 HV0.05) with a hardness significantly higher than the hardness of the measured samples in the case of “soft” metals (Pb, Sn, and Bi). Therefore, these values of uncertainty should only be considered indicative. In the case of Pb, at loads above 0.58842 N, the diagonals of the indentations were so large that they could not be measured by the micro-hardness tester. Another method had to be used.
Statistical outliers were detected by Grubbs’ test (significance level α = 0.05). Their presence would indicate that the measurement process is out of statistical control. The normality was detected by Anderson—Darling test (files with p > 0.05 can be considered to have a normal distribution). The normality and the outliers were determined for files involving values of one “cluster”, calculated p-values, and the number of the outliers have been listed in Table 1. As a consequence, characterization by an average value or variance is not adequate if the distribution is other than normal. It is more suitable, as recommended by, for example, Fabík et al. [15], to use numerical characteristics which facilitate data interpretation in terms of non-parametric values, such as the mode, median, or other quantiles. Since about half of the files had a normal distribution, the average hardness (arithmetic mean) was taken into account in the paper.
The statistical significance of the load influence on the micro-hardness values and therefore predisposed to the ISE was evaluated using one-factor (one-way) ANOVA (Analysis of the Variability). If the p-value (p-value in the ultimate column in Table 3) is above 0.05, the load has no statistically significant effect on the values of the micro-hardness and the emergence of ISE is unlikely. After evaluation by this method, it can be said that the ISE should not only occur with sample no. 20 (tantalum Ta with n = 1.9098, but this cannot be considered neutral). The α (%) value is the proportion of variability that can be explained by the load change.
As expected, the type of metal has a significant effect on micro-hardness. According to one factor ANOVA, p-value is 1.6e-195 and α (%) = 97.1%.

3. Results

As demonstrated by Ren et al. [10], Meyer’s Power Law, or Proportional Specimen Resistance model (PSR), describes ISE quantitatively.
Meyer’s Law is an easier way:
P =   Ad n
The parameters n and A are determined by an exponential curve fitting to the indentation diagonal d (mm) versus applied load P (N) or n and Aln from a straight-line graph of ln (d) versus ln (P). Meyer’s index n related to the “work-hardening index” is the slope, and coefficient Aln is the y-intercept of the line. This relationship was derived for the ball indenter, as stated by Sargent [16], but it has become common practice to apply Tabor’s interpretation of the strain-hardening by pyramidal indenter and to derive a “work-hardening index”. The index n < 2 for “normal” ISE, and n > 2 for reverse ISE. If n = 2 the micro-hardness independent of the load is given by Kick’s Law. The values of n and Aln are in Table 4.
Table 4. The parameters of the ISE.
Sample No.MetalnAmocAlna1a2c0c1c2WA1a1/a2c1/c2
1Cu2.089469.296.1510.154347.9−0.21213.689154.90.020338.60.00040.0884
2Cu2.171653.726.483−0.817395.9−0.26216.123148.50.008369.9−0.00210.1086
3Cu1.995406.876.0090.326404.9−0.0765.801318.20.012404.30.00080.0182
4Cu2.157686.266.531−1.096439.5−0.1267.618304.1−0.007415.6−0.00250.0251
5Cu2.1101017.006.925−1.149728.6−0.0866.609571.5−0.007697.8−0.00160.0116
6Al2.039204.455.320−0.503192.50.100−5.341244.3−0.019190.1−0.0026−0.0219
7Al2.182226.735.424−0.623147.3−0.2117.70773.30.000137.8−0.00420.1052
8Al2.112177.545.179−0.442137.9−0.1053.720101.1−0.003132.1−0.00320.0368
9Ag2.169609.786.413−2.355416.30.145−12.106562.7−0.050390.8−0.0057−0.0215
10Ni2.4415112.908.540−6.0321249.8−0.33327.805456.3−0.0411074.2−0.00480.0609
11Ni2.4365072.408.532−6.6541284.1−0.17911.862843.7−0.0571112.5−0.00520.0141
12Pb0.9483.331.2044.007−1.80.181−3.05045.00.09325.7−2.2270−0.0679
13Mo1.784528.596.2705.229956.2−0.07615.058685.90.0561066.80.00550.0220
14Mo1.646280.185.6357.706712.8−0.08818.545434.00.084869.30.01080.0427
15Cr1.770418.536.0374.924772.5−0.09315.669507.20.059863.90.00640.0309
16Cr1.95750.606.6211.387850.5−0.0769.539658.80.021868.80.00160.0145
17Fe2.2881637.407.401−3.085704.7−0.1337.877499.8−0.031639.5−0.00440.0158
18Fe2.1911077.406.982−0.927587.5−0.30122.633170.10.010548.2−0.00160.1330
19Mn1.938353.965.8690.693414.9−0.0020.797413.30.010425.60.00170.0019
20Ta1.910750.086.6201.935965.9−0.0548.172807.40.0241001.80.00200.0101
21W1.8071301.807.1724.6452641.80.129−22.3843842.30.0112910.90.0018−0.0058
22Zn1.68386.494.4603.721145.2−0.20514.77319.10.107172.40.02560.7733
23Ti1.681204.165.3195.224443.5−0.05410.434399.10.071529.30.01180.0261
24Co2.3095465.208.606−4.5611850.90.22224.761967.2−0.0221676.6−0.00250.0256
25Co2.3536925.508.843−6.0592025.9−0.23926.1911030.6−0.0231798.6−0.00300.0254
26Co1.8711089.506.9943.4101635.0−0.05111.3701367.60.0291725.00.00210.0083
27Mg1.967226.135.4211.038226.6−0.19411.70297.60.040229.50.00460.1199
28Cd1.84389.644.4961.076120.7−0.0081.416117.60.028129.90.00890.0120
29Cd1.79876.334.3351.433109.7−0.0493.47991.20.043120.50.01310.0382
30Sb1.818226.555.4232.263348.8−0.0103.070335.20.035381.30.00650.0092
31Bi1.90143.143.7640.11953.20.182−4.95483.6−0.01355.70.0022−0.0592
32Sn2.00166.124.1920.15364.2−0.1063.16945.20.01664.00.00240.0700
Gong et al. [8] demonstrated, that the PSR model of Li and Bradt (PSR) may be considered a modified form of the Hays/Kendall approach to the ISE, described by Equation (2):
P =   a 1 d +   a 2 d 2
Li et al. [17] state that according to Li and Bradt parameters a1 (N·mm−1) and a2 (N·mm−2) of (2) is related to the elastic and plastic properties of the material, respectively. According to Sangwal et al. [9], parameter a1 consists of two components: the elastic resistance of the test sample and the friction resistance developed at the interface between the indenter and the sample. The parameter a2 as state by Gong et al. [8] is related to load-independent “true hardness” (HPSR); it can be calculated by Equation (3).
H PSRa 2 = 0.1891 a 2
Equation (2) may be rearranged in the form:
P d =   a 1 +   a 2 d
The parameters a1 and a2 of Equation (4) may be obtained from the plots of P/d (N·mm−1) against d (mm).
Equation (5) can be regarded as a modified form of the PSR model.
P =   c 0 + c 1 d + c 2 d 2
The parameters c0 (N), c1 (N·mm−1), and c2 (N·mm−2) of Equation (5) may be obtained from the quadratic regressions of P (N) against d (mm). Gong et al. [8] found that parameter c0 is associated with residual surface stress in the sample and parameters c1 ≈ a1 and c2 ≈ a2 are related, respectively, to the elastic and plastic properties of the sample.
The ratio c1/c2 is a measure of the residual stress resulting from cutting, grinding, and polishing the sample. A literature survey prepared by Sangwal et al. [9] reveals the expected relationship between c0 and c1/c2, this fact confirms Figure 1. Samples No. 24 (Co) and 27 (Mg) deviate most from the line dependence. The values of parameters obtained by modified PSR are given in Table 4.
Petrík and Palfy [18] demonstrated an inverse relationship between the micro-hardness and Meyer’s index n for Fe or heat-treated steel CRMs with micro-hardness between 195 HV0.05 and 519 HV0.05. Petrík [19] presents the same dependence for heat-treated carbon steel, all with reverse ISE. Tested samples were not deformed except for the preparation of the metallographic surface. As stated by Petrík et al. [20], Meyer’s index n for undeformed aluminum alloy EN 6082 is close to 2; the increase in the degree of tensile deformation increases both the micro-hardness and the “normal” character of ISE (n < 2).
The relationship between micro-hardness average micro-hardness (of individual “clusters”) HV and Meyer’s index n for analyzed metals is weak. The increase of the index n with increasing micro-hardness of tested metals was observed for lattices FCC (Pearson’s coefficient r2 = 0.7831) and HCP (r2 = 0.6871). For the BCC lattice, the trend is the opposite, but with little correlation (r2 = −0.4850). The trends can be seen in Figure 2.
The “true hardness” by analogy to a2 can be calculated as HPSRc2 using c2 in Equation (3).
Hays and Kendall proposed that there is a minimum load W (N) required to initiate plastic deformation, i.e., for the formation of a visible indentation. In that event, the relationship between applied load P and the load W is expressed by Equation (6):
P =   W + A 1 d 2
where A1 (N·mm−2) is a parameter independent of load. As stated by Sangwal et al. [9], the values of W and A1 may be obtained from the regressions of P (N) against d2 (mm). The values of the parameters obtained by modified PSR are in Table 4. The relationship between Meyer’s index n and W can be described by a second-degree polynomial, Equation (7), with the coefficient of determination r2 = 0.78 and a strong correlation (Pearson’s coefficient r2 = −0.8704), Figure 3.
W = 0.1213 n 2 0.6438 n + 0.812
The “true hardness” by analogy to a2 can be calculated as HPSRA1 using Equation (3). The relationship between measured hardness HV0.05 and calculated values of “true hardness” (HPSR) is in Figure 4. The best correlation is for HPSRA1 (r2 = 0.9919), and the values of “true hardness” are in Table 5.

4. Discussion

Regarding Meyer’s index, n, the lowest value (0.9482) has sample No. 12 (Pb). This may be due to the aforementioned problems in measuring the indentations at higher loads for this sample. Since a low index value is characteristic of brittle materials, it is indeed unlikely that plastic Pb behaves in this way. The samples No. 3 (Cu), 6 (99.999% Al), 27 (Mg), and (Sn) behave in a neutral way (n = 2 ± 0.05). The micro-hardness is given by Kick’s Law and thus it is independent of the load. “Normal” ISE was observed in 14 samples, index n ranges between 1.948 and 1.6463. This group includes metals: Mo, Ti, Zn, Cr, Cd, W, Sb, Co, Bi, Ta, and Mn; index n decreases from Mo to Bi. There is no FCC lattice in this group, the most represented (50%) is the BCC. Sample No. 21 (W) is a sintered material.
In the literature, we can find contributions that deal with the determination of ISE in metals. Unfortunately, the authors often do not state the value of Meyer’s index n and other ISE parameters, e.g., Elmustafa et al. [21] for Al, Elmustafa and Stone [22] for Al and brass, and Atkinson [23] for Al, Cu, Fe, and brass. Another problem is the different range of applied loads, often interfering with nano-hardness, as well as different types of hardness testers.
Liu et al. [24] published the results of W (tungsten) ISE research but used Berkovich’s method of measuring micro-hardness. Low-value n was also observed in the case of sintered iron (n = 1.7588) by Blaško et al. [25]. The anomaly occurs in sample No. 26 (Co with purity 99.96%) with index n = 1.8707. The other two samples of the same material (24, 25) show a significant reverse (n = 2.3089 and 2.3534) ISE. The neutral to normal ISE reported by Sangwal et al. [9] relates to a heat-treated Co alloy. Samples 24 and 25 were prepared and measured together, while sample 26 was prepared and measured at another time. Parameters c0 (associated with residual surface stress) and c1/c2 (a measure of the residual stress, the result of machining, grinding, and polishing) of sample No. 26 on the one hand and samples 24, 25, on the other hand, differ significantly. It is possible that, in this case, the index n was influenced by the previous deformation or polishing method (polishing length, pressing force, polishing wheel humidity). “Reverse” ISE was observed in 13 samples, index n ranges between 2.0885 and 2.4405. This group includes metals: Cu, Al (99.5%), Ag, Fe, Co (samples 24, 25), and Ni; index n increases from Cu to Ni. Tabor [26] lists values of Meyer’s index which lie between 2 for fully work-hardened metals and about 2.6 for annealed metals. Experiments on commercially pure Ti have been carried out by Sanosh et al. [27]. When measuring micro-hardness by the Vickers method, they applied a load in the range of 0.98 to 9.8 N, but did not evaluate the parameters characterizing the ISE. Zhitaru et al. [28] measured ISE parameters on steel, Cu, and Al. They used the Vickers method, with the load varying from 0.1 to 2 N. They preferably monitored the effect of the lubricant on the micro-hardness values, they stated only the strain hardening coefficient of the parameters related to ISE. Meyer index values (n ≈ 2.15) for In were published by Cai et al. [29]; different crystallographic planes of Ti (n ranged between 1.520 and 1.614) were published by Şahin et al. [30]; and composite A356 + 6%FA subjected to ECAP (n ranged between 1.9112 and 2.3321), where the cast composite shows normal ISE, while samples machined with ECAP show reverse ISE-RISE, were published by Muslić et al. [31]. Karaca and Büyükakkas [32] studied ISE on Fe-Mn-Si and Co-Mn-Si superalloys at loads of 0.49 to 9.8 N by the Vickers method. In contrast to the above-mentioned cobalt alloy studied by Sangwal et al. [9], reverse ISE was found in both cases. Caution should be exercised when studying an ISE with a multiphase structure. The different phases may have different ISE characteristics. And for fine phases, it can be difficult to measure micro-hardness at higher loads to comply with ISO 6507-1 [2].
In the case of Ti, there is a marked difference between Meyer’s index n, which was found experimentally (presented in Table 4: n = 2.0007, almost without the influence of ISE), and index n presented by Şahin et al. [30] in the literature (the value of n ranged between 1.52 and 1.614). “White” β Ti was used as an experimental material, i.e., in metallic form, in both cases. The difference in the value of index n may be due to different purity: 99.5%/99.99%; crystallographic orientation: not determined/precisely defined; used hardness tester: Hanemann/Shimadzu; polishing agent: water suspension of Al2O3/diamond paste up to 1 μm; the range of loads 98–981 mN/10–50 mN; dwell time: 15 s/300 s; or other factors such as loading speed, the condition of the indentor, accuracy in the measurement of diagonals of indentations, etching of the measured surface… The reasons for possible differences between the measured values of ISE parameters and the values presented in the literature for other metals may be similar to those for tin.
The above-mentioned parameter W is a minimum load necessary to create a visible indentation. However, visible indentations (with plastic deformation) also formed with a load of 0.009807 N (1 g). This load is less than some calculated values of parameter W listed in Table 4. This phenomenon has also been observed by Petrík et al. [20] in Al samples of 99.5% purity after various tensile deformations. It would be appropriate to focus research on this problem in the future.
Unlike the (macro) hardness testers, the (indirect) calibration of micro-hardness testers is not a routinely practiced process. However, the determination of uncertainty and, therefore, the quality of the measured hardness is impossible without preceding calibration. However, uncertainty can significantly affect the type and size of ISE [11]. It is possible that “normal” and reverse ISE are simultaneously the result of the same input values if the uncertainty is taken into account (with a coverage factor k = 2, and a probability of 95.45%).
In addition to the analysis of uncertainties, when measuring the micro-hardness and the associated ISE effect, it is appropriate to determine the capability of the measurement process, as described Tošenovský and Tošenovský [33] or Klaput et al. [34]. In the past, Petrík and Palfy [18] have evaluated the mutual relationship between the competence of the measurement process and ISE. Further research on ISE metals will also focus on this direction.
The ambiguity in the measurement of small indentations, particularly if pile-up or sink-in effects are present, can lead to over- or underestimation of diagonals, as is stated by Petrík [19]. Their manual measurement is an important source of uncertainty. It is the result of several factors, including the operator’s subjective decision in determining the indentation edge, as well as his/her eye strain as a result of the prolonged measurement, as demonstrated by Petrík and Palfy [18].
In most of the measurements presented, it was not measured, and therefore the indenter velocity in the material was not taken into account. As is presented in the reference by Petrík et al. [35], it can also influence the determination of ISE parameters. Zahran et al. [36] studied the impact of Cu addition and aging conditions on the microstructure development and mechanical properties of Sn-9Zn binary eutectic alloy using X-ray diffraction and scanning electron microscopy techniques. The variations in the Vickers micro-hardness values with Cu content and aging temperature were interpreted based on the development, growth, and dissolution of formed phases. The presented neural network method for micro-hardness prediction can be used for ISE research in the future. The cutting, grinding, and polishing conditions of the samples may have been somewhat different. This fact, similar to the crystallographic orientation of grains studied by Petrík et al. [37] for Cu and by Şahin et al. [30] for Ti, can affect the size and nature of ISE.

5. Conclusions

  • The research was conducted on the metallographically polished surface of metals.
  • The influencing factors are possible errors in measuring the dimensions of the indentations and the rate of penetration of the indenter into the metal.
  • Other factors that are not measurement errors but that define the micro-hardness and, consequently, the type and size of the ISE are metal purity, possible deformation, and sample preparation method (polishing time, pressing force).
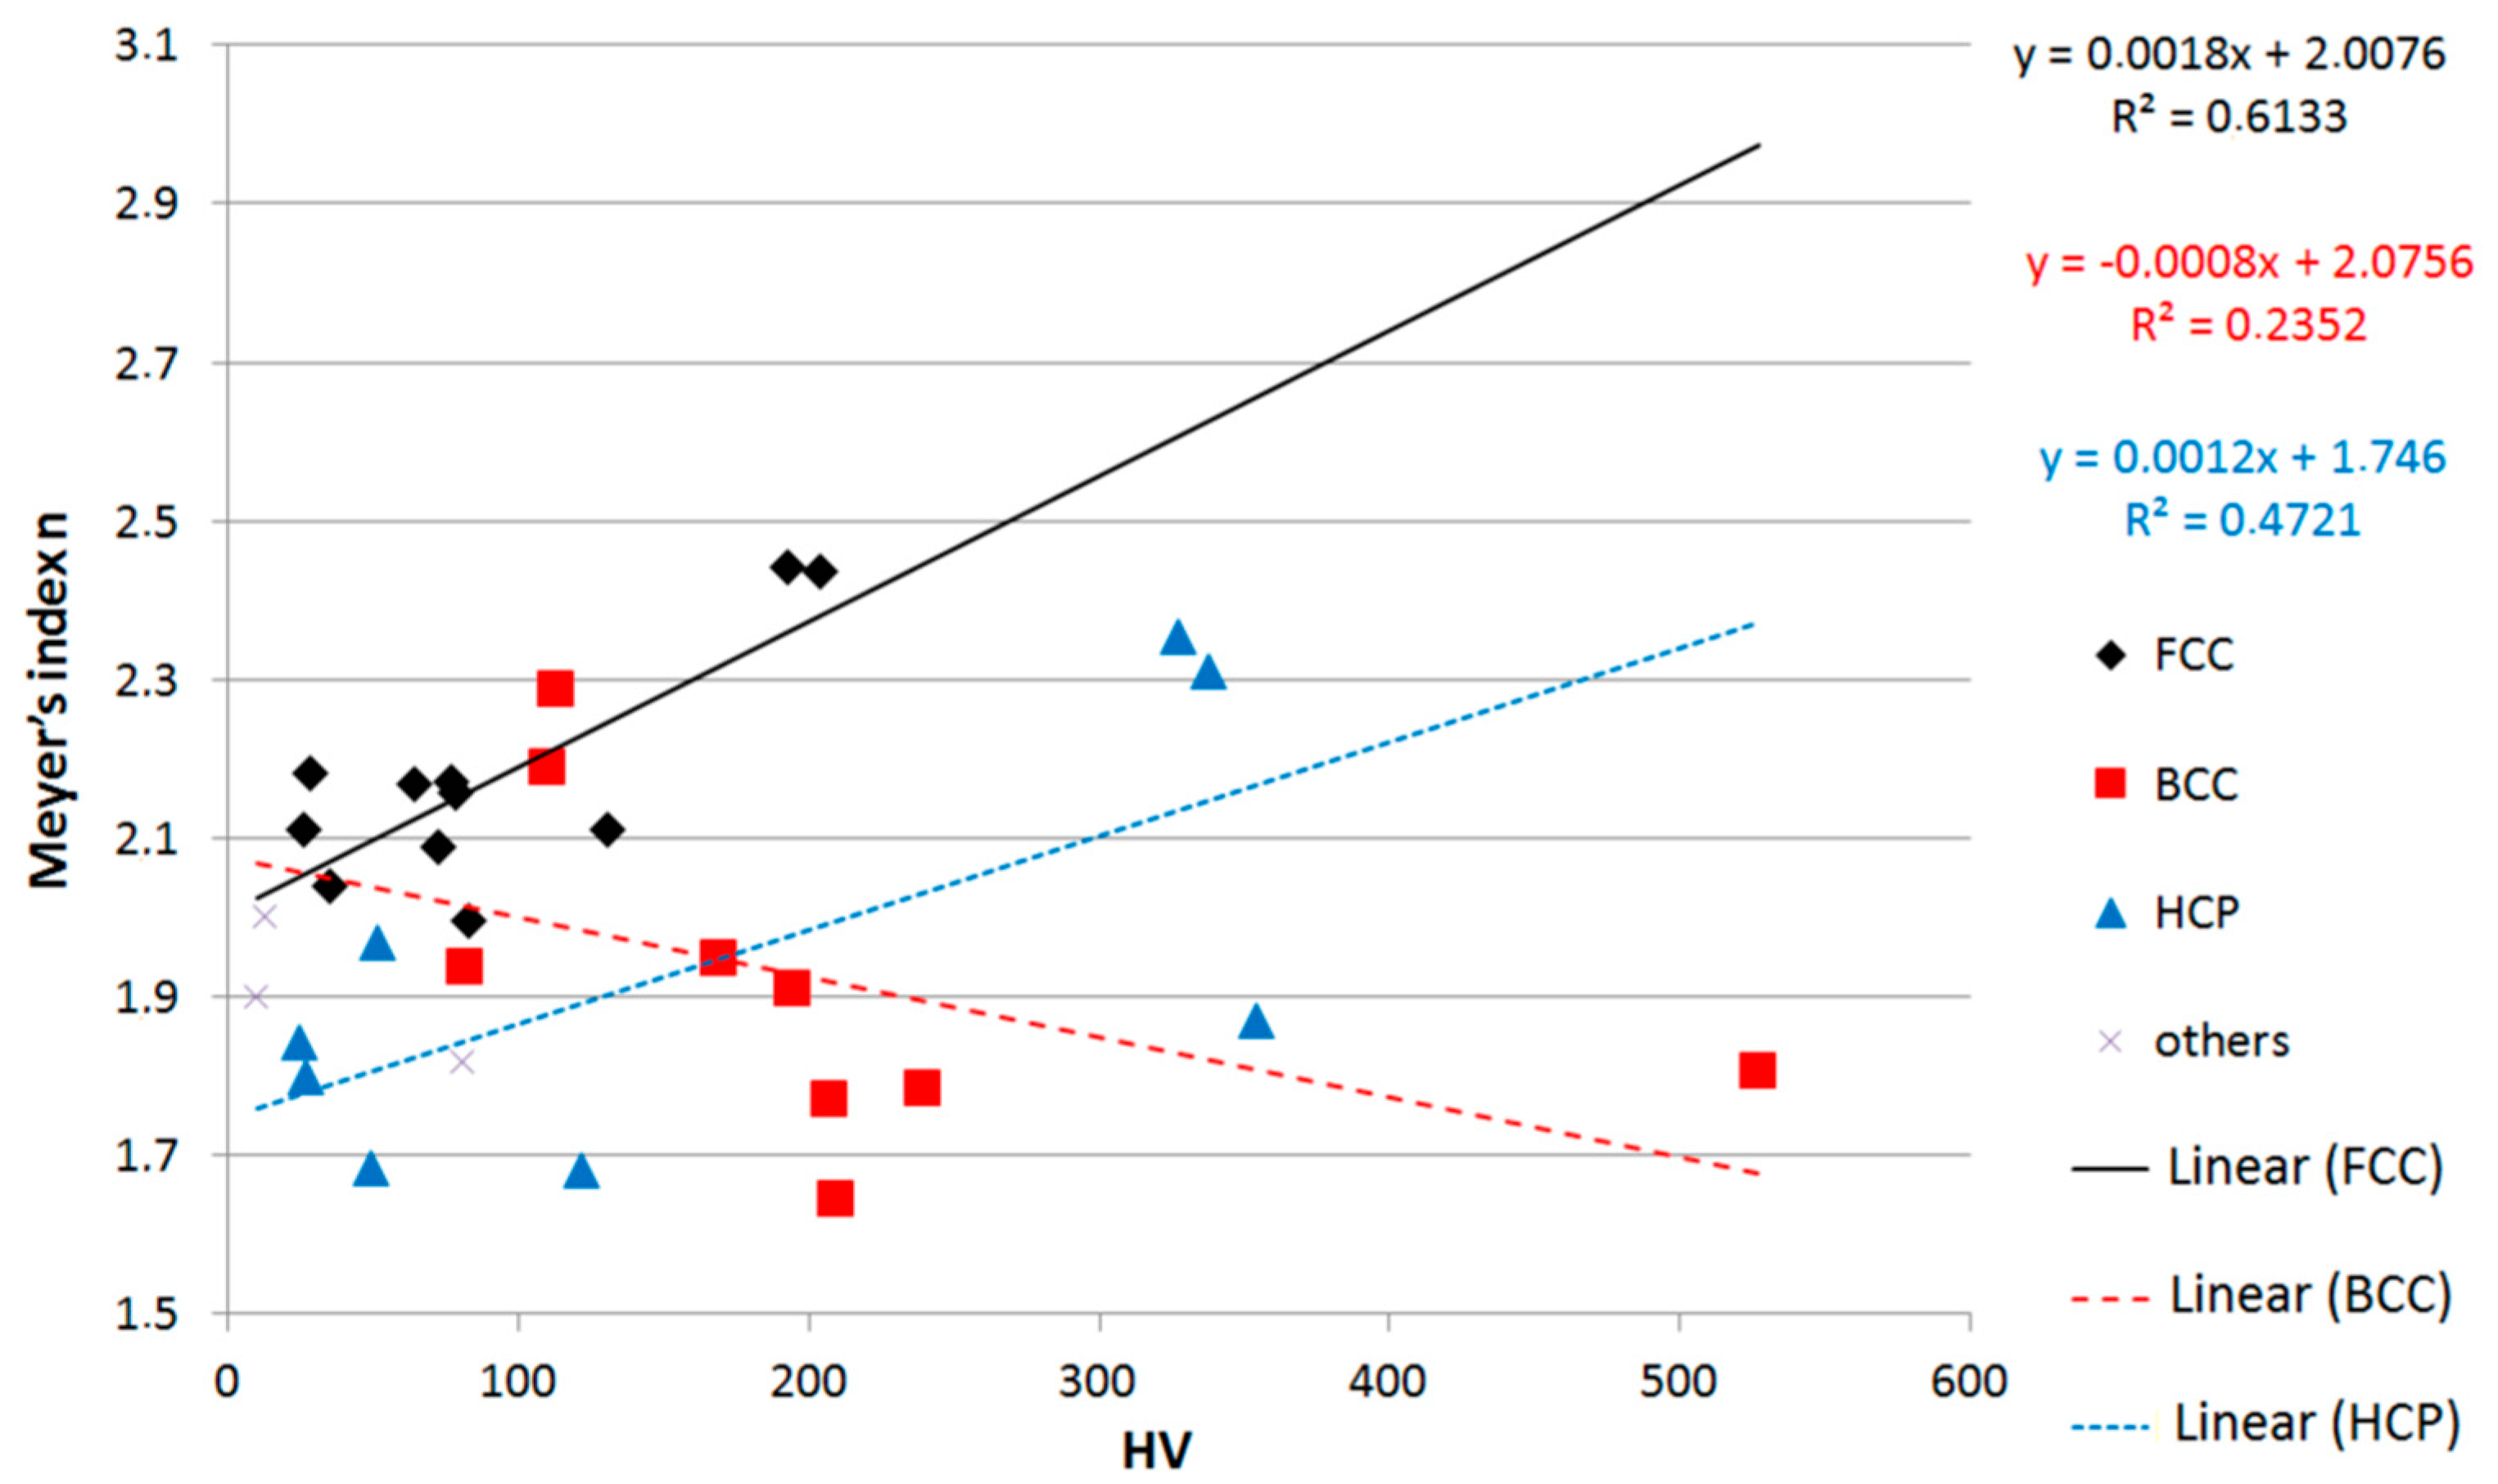
  • A correlation was found between the micro-hardness and Meyer’s index (n) for metals with lattices FCC and HCP.
  • As is apparent from the above results, the micro-hardness value is influenced by the size and nature of the ISE. If this is not taken into account, the measured micro-hardness values may be misleading. For this reason, we recommend using the above methodology to calculate the “true hardness”.

Author Contributions

Management and validation, writing and final review, P.B. and J.P.; application of statistical, and mathematical techniques, J.P. and P.B.; research and verification, M.Š. and Š.M.; development of methodology, P.B. and J.P.; data collection, P.B., P.P. and J.P. All authors have read and agreed to the published version of the manuscript.

Funding

This contribution is the result of the implementation of the following projects: KEGA No. 019TUKE-4/2020 “Application-oriented education in ISO 9001:2015 requirements implementation”.

Institutional Review Board Statement

Not applicable.

Informed Consent Statement

Not applicable.

Data Availability Statement

Not applicable.

Conflicts of Interest

The authors declare no conflict of interest.

References

  1. Westbrook, H.; Conrad, H. The Science of Hardness Testing and its Research Application; Metals Park American Society for Metals: Materials Park, OH, USA, 1973. [Google Scholar]
  2. ISO 6507-1; Metallic Materials—Vickers Hardness Test Part 1—Test Method. International Organization for Standardization ISO: Geneva, Switzerland, 2018.
  3. ISO 14577-1; Metallic Materials—Instrumented Indentation Test for Hardness and Materials Parameters Part 1—Test Method. International Organization for Standardization ISO: Geneva, Switzerland, 2015.
  4. Voyiadjis, G.Z.; Peters, R. Size Effects in Nanoindentation: An Experimental and Analytical Study. Acta Mech. 2010, 211, 131–153. [Google Scholar] [CrossRef]
  5. Golan, G.; Rabinovich, E.; Axelevitch, A.; Seidman, A.; Croitoru, N. Thin Films Indentation Size Effect In Microhardness Measurements. J. Optoelectron. Adv. Mater. 2000, 2, 317–325. Available online: http://citeseerx.ist.psu.edu/viewdoc/download?doi=10.1.1.560.9775&rep=rep1&type=pdf (accessed on 22 September 2011).
  6. Rayar, S.L.; Selvarajan, P. Structural, Mechanical, FTIR, SHG And Thermal Studies Of L-HTFA Single Crystals Grown by Solution Method. Recent Res. Sci. Technol. 2010, 2, 77–81. Available online: https://www.researchgate.net/publication/310800746_structural_mechanical_ftir_shg_and_thermal_studies_of_l-_htfa_single_crystals_grown_by_solution_method (accessed on 22 September 2011).
  7. Ruban Kumar, A.; Kalainathan, S. Effect of Magnetic Field in the Microhardness Studies on Calcium Hydrogen Phosphate Crystals. J. Phys. Chem. Solids 2010, 71, 1411–1415. [Google Scholar] [CrossRef]
  8. Gong, J.; Wu, J.; Guan, Z. Examination of the Indentation Size Effect in Low-Load Vickers Hardness Testing of Ceramics. J. Eur. Ceram. Soc. 1999, 19, 2625–2631. [Google Scholar] [CrossRef]
  9. Sangwal, K.; Surowska, B.; Błaziak, P. Analysis of the Indentation Size Effect in the Microhardness Measurement of Some Cobalt-Based Alloys. Mater. Chem. Phys. 2003, 77, 511–520. [Google Scholar] [CrossRef]
  10. Ren, X.J.; Hooper, R.M.; Griffiths, C.; Henshall, J.L. Indentation Size Effect in Ceramics: Correlation with H/E. J. Mater. Sci. Lett. 2003, 22, 1105–1106. [Google Scholar] [CrossRef]
  11. Petrík, J.; Blaško, P.; Domovcová, L.; Sedlák, R.; Guzanová, A.; Ťavodová, M.; Pribulová, A.; Futaš, P. Influence of Testers on the ISE Effect. Mater. Test. 2022, 64, 550–562. [Google Scholar] [CrossRef]
  12. Sangwal, K. On the Reverse Indentation Size Effect and Microhardness Measurement of Solids. Mater. Chem. Phys. 2000, 63, 145–152. [Google Scholar] [CrossRef]
  13. Navrátil, V.; Novotná, J. Some problems of microhardness of metals. J. Appl. Math. 2009, 2, 241–244. [Google Scholar]
  14. ISO 6507-2; Metallic Materials—Vickers Hardness Test Part 2—Verification and Calibration of Testing Machines. International Organization for Standardization ISO: Geneva, Switzerland, 2005.
  15. Fabík, R.; Halfarová, P.; Vykydal, D.; Lezhnev, S.; Klimeš, A. Analysis of results of testing of wire by reverse bending from the viewpoint of normality of the measured data. In Proceedings of the METAL 2014—23rd International Conference on Metallurgy and Materials, Brno, Czech Republic, 21–23 May 2014. [Google Scholar] [CrossRef]
  16. Sargent, P.M. Indentation Size Effect and Strain-Hardening. J. Mater. Sci. Lett. 1989, 8, 1139–1140. [Google Scholar] [CrossRef]
  17. Li, N.; Liu, L.; Zhang, M. The Role of Friction to the Indentation Size Effect in Amorphous and Crystallized Pd-Based Alloy. J. Mater. Sci. 2009, 44, 3072–3076. [Google Scholar] [CrossRef]
  18. Petrík, J.; Palfy, P. The Influence of the Load on the Hardness. Metrol. Meas. Syst. 2011, 18, 223–234. [Google Scholar] [CrossRef] [Green Version]
  19. Petrík, J. The Micro-Hardness of Heat Treated Carbon Steel. Mater. Sci. 2014, 20, 21–24. [Google Scholar] [CrossRef] [Green Version]
  20. Petrík, J.; Blaško, P.; Mihaliková, M.; Vasilňáková, A.; Mikloš, V. The Relationship between the Deformation and the Indentation Size Effect (ISE). Metall. Res. Technol. 2019, 116, 622. [Google Scholar] [CrossRef]
  21. Elmustafa, A.A.; Eastman, J.A.; Rittner, M.N.; Weertman, J.R.; Stone, D.S. Indentation Size Effect: Large Grained Aluminum versus Nanocrystalline Aluminum-Zirconium Alloys. Scr. Mater. 2000, 43, 951–955. [Google Scholar] [CrossRef]
  22. Elmustafa, A.A.; Stone, D.S. Indentation Size Effect in Polycrystalline, F.C.C. Metals. Acta Mater. 2002, 50, 3641–3650. [Google Scholar] [CrossRef]
  23. Atkinson, M. Calculation of Characteristic Macro-Hardness from Low-Load Indentation Tests. Mater. Sci. Eng. A 1995, 197, 165–169. [Google Scholar] [CrossRef]
  24. Liu, G.; Ni, S.; Song, M. Effect of Indentation Size and Grain/Sub-Grain Size on Microhardness of High Purity Tungsten. Trans. Nonferrous Met. Soc. China 2015, 25, 3240–3246. [Google Scholar] [CrossRef]
  25. Blaško, P.; Kupková, M.; Petrík, J.; Futaš, P.; Vasilňaková, A. The Indentation Size Effect of Sintered Fe/3.3 Wt-%Cu + C n H m Measured by Vickers Scale. Mater. Sci. Technol. 2020, 36, 403–408. [Google Scholar] [CrossRef]
  26. Tabor, D. The Hardness of Metals; Oxford Classic Texts in the Physical Sciences; Clarendon Press: Oxford, UK; Oxford University Press: Oxford, UK; New York, NY, USA, 2000; ISBN 978-0-19-850776-5. [Google Scholar]
  27. Sanosh, K.P.; Balakrishnan, A.; Francis, L.; Kim, T.N. Vickers and Knoop Micro-Hardness Behavior of Coarse-and Ultrafine-Grained Titanium. J. Mater. Sci. Technol. 2010, 26, 904–907. [Google Scholar] [CrossRef]
  28. Zhitaru, R.; Parshutin, V.; Paramonov, A.; Covali, A.; Agafii, V. Influence of conditions of friction indentation loading of some metals on the micro-hardness scale effect. Mold. J. Phys. Sci. 2008, 7, 438–448. [Google Scholar]
  29. Cai, X.; Yang, X.; Zhou, P. Dependence of Vickers Micro-Hardness on Applied Load in Indium. J. Mater. Sci. Lett. 1997, 16, 741–742. [Google Scholar] [CrossRef]
  30. Şahin, O.; Uzun, O.; Kölemen, U.; Uçar, N. Mechanical Characterization for β-Sn Single Crystals Using Nanoindentation Tests. Mater. Charact. 2008, 59, 427–434. [Google Scholar] [CrossRef]
  31. Muslić, M.; Orešković, L.; Rede, V.; Maksimović, V. Indentation Size Effect of Composite A356 + 6%FA Subjected to ECAP. Metals 2022, 12, 821. [Google Scholar] [CrossRef]
  32. Karaca, I.; Büyükakkas, S. Microhardness Characterization of Fe- and Co-Based Superalloys. Iran. J. Sci. Technol. Trans. Sci. 2019, 43, 1311–1319. [Google Scholar] [CrossRef]
  33. Tošenovský, J.; Tošenovský, F. Possibilities of Using Graphical and Numerical Tools in the Exposition of Process Capability Assessment Techniques. QIP J. 2019, 23, 13. [Google Scholar] [CrossRef]
  34. Klaput, P.; Vykydal, D.; Tošenovský, F.; Halfarová, P.; Plura, J. Problems of Application of Measurement System Analysis (MSA) in Metallurgical Production. Metal. Sisak Then Zagreb METABK 2016, 55, 535–537. Available online: https://www.researchgate.net/publication/298850843_Problems_of_application_of_measurement_system_analysis_MSA_in_metallurgical_production (accessed on 12 December 2017).
  35. Petrík, J.; Palfy, P.; Blaško, P.; Girmanová, L.; Havlík, M. The Indentation Size Effect (ISE) and the Speed of the Indenter Penetration into Test Piece. Manuf. Technol. 2016, 16, 771–777. [Google Scholar] [CrossRef]
  36. Zahran, H.Y.; Soliman, H.N.; Abd El-Rehim, A.F.; Habashy, D.M. Modelling the Effect of Cu Content on the Microstructure and Vickers Microhardness of Sn-9Zn Binary Eutectic Alloy Using an Artificial Neural Network. Crystals 2021, 11, 481. [Google Scholar] [CrossRef]
  37. Petrík, J.; Blaško, P.; Ďurišin, J.; Vasilňáková, A.; Guzanová, A. The Orientation of the Grains and Indentation Size Effect. Annals of Faculty Engineering Hunedoara. Int. J. Eng. 2019, 17, 69–72. Available online: http://annals.fih.upt.ro/pdf-full/2019/ANNALS-2019-3-10.pdf (accessed on 12 December 2017).
Figure 1. The relationship between c0 and c1/c2.
Crystals 12 00795 g001
Figure 2. The relationship between micro-hardness average hardness HV and Meyer’s index n.
Crystals 12 00795 g002
Figure 3. The relationship between Meyer’s index n and W, the minimum test load W (N) necessary to initiate plastic deformation.
Crystals 12 00795 g003
Figure 4. The relationship between measured hardness HV0.05 and calculated values of “true hardness” (HPSR) relationship between Meyer’s index n and W, the minimum test load W (N) necessary to initiate plastic deformation.
Crystals 12 00795 g004
Table 1. Tested metals, their purity, the crystal system lattice, ambient temperature and relative humidity of laboratory, average hardness HV, standard deviation of average hardness HV SD, normality (p-value), and outliers of the “clusters”.
Sample No.MetalPurity (%)Crystal System LatticeT (°C)RH (%)HVHV SDNormOutliers
1Cu99.99FCC22.943.266.35.10.01130
2Cu99.99FCC27.658.469.86.10.12440
3Cu99.99FCC18.173.178.53.30.34940
4Cu99.99FCC22.840.176.35.50.00060
5Cu99.97FCC20.353.2128.67.10.06410
6Al99.999FCC21.262.334.51.80.98130
7Al99.5FCC19.965.725.52.30.00020
8Al99.5FCC23.143.124.51.50.00060
9Ag99.9FCC27.857.765.95.60.00290
10Ni99.93FCC19.466.2180.926.40.00020
11Ni99.93FCC24.346.1182.125.50.00010
12Pb99.995FCC19.873.312.09.80.00000
13Mo99.9BCC19.534.7237.125.00.40800
14Mo99.9BCC18.034.3214.636.10.00270
15Cr99.9BCC17.635.2193.919.90.08300
16Cr99.9BCC18.535.0173.37.00.17840
17Fe99.9BCC25.453.6111.111.70.00050
18Fe99.9BCC27.859.9104.010.50.02450
19Mn99.9BCC19.332.983.04.30.30601
20Ta99.9BCC20.863.6202.315.80.04401
21W99.95BCC18.134.7582.468.40.05071
22Zn99.95HCP19.865.844.77.00.20450
23Ti99.5HCP20.962.9125.520.80.00140
24Co99.6HCP25.755.5316.942.60.00000
25Co99.6HCP25.051.0309.735.80.00000
26Co99.6HCP14.436.1354.628.80.35080
27Mg99.5HCP18.038.147.63.70.71520
28Cd99.96HCP19.035.026.82.20.01020
29Cd99.96HCP18.437.126.03.70.00032
30Sb99.8RH19.432.980.26.60.00550
31Bi99.5RH18.337.710.40.90.14910
32Sn99.5TBC14.436.112.50.70.14840
FCC (face centered cubic), BCC (body centered cubic), HCP (hexagonal close-packed), RH (rhombohedral), and TCB (tetragonal body centered).
Table 2. Calibrations of the tester: specified hardness Hc (HV0.05) of used CRM, measured results of calibration (rrel, Erel, Urel), samples measured after calibration (the numbers are according to Table 1), and maximal permissible values (MPV) of the parameters, obtained by calibration, which was carried out under the standard ISO 6507-2 [14].
Calibration No.Hc (HV0.05)MeasuredSample No.MPV
rrelErelUrelrrelErelUrel
11952.880.826.011, 2, 7, 8,91010
21957.00−4.6011.78391010
31953.706.5912.12491010
41958.671.6510.16591010
51952.15−0.645.456, 9, 12, 22,91010
61957.318.9616.9910, 11, 17, 1891010
71953.58−0.606.1427, 31, 3291010
81953.674.4410.3728, 30, 3191010
91951.440.214.9320, 2391010
101953.674.4410.371991010
112424.105.1811.2113, 14, 15, 16588
123273.71−0.314.9024, 25599
133273.71−0.314.9026599
143924.498.2719.912151010
155192.820.445.062151010
Table 3. The micro-hardness at selected loads, relative expanded uncertainty Urel at HV0.05, and the influence of the load on the micro-hardness expressed by p- α%.
Sample No.MetalLoad (N)Urel0.05 (%)Influence of Load—p Valueα%
0.098070.196140.490350.9807
1Cu55.065.072.063.024.01.91 × 10−1588.0
2Cu58.062.077.067.031.82.91 × 10−1484.8
3Cu79.076.083.077.023.80.00171845.8
4Cu68.070.078.077.022.93.47 × 10−1281.8
5Cu113.9125.7130.3125.922.71.75 × 10−0767.8
6Al33.035.035.036.047.40.00064458.3
7Al21.023.028.025.059.59.78 × 10−1688.1
8Al22.023.026.024.065.08.22 × 10−0972.7
9Ag62.060.064.077.025.92.17 × 10−0871.2
10Ni132.0147.0193.0182.010.04.09 × 10−2193.6
11Ni135.0147.0204.0194.010.11.35 × 10−1689.2
12Pb31.017.46.2-263.47.35 × 10−2599.3
13Mo276.8256.6238.7214.313.92.17 × 10−0974.6
14Mo281.0265.9209.2169.611.52.91 × 10−1790.0
15Cr230.2217.8207.2165.711.32.13 × 10−1992.2
16Cr172.9185.3168.9160.613.96.57 × 10−0973.0
17Fe85.0100.0113.0115.017.05.95 × 10−1383.4
18Fe81.095.0110.0102.016.41.86 × 10−1891.3
19Mn88.382.781.581.922.10.02720635.2
20Ta219.0210.0194.0190.010.80.09181829.2
21W692.9681.0527.1564.88.99.48 × 10−1075.7
22Zn55.050.049.034.033.49.99 × 10−1383.0
23Ti164.0139.0122.0105.015.09.85 × 10−1075.6
24Co424.0261.0338.0307.08.96.1 × 10−1890.8
25Co227.0265.0327.0316.08.93.3 × 10−2593.7
26Co400.0368.6354.1323.811.21.08 × 10−0559.6
27Mg46.745.351.744.834.73.48 × 10−0662.1
28Cd29.730.924.624.636.16.46 × 10−1281.2
29Cd29.732.127.023.666.36.46 × 10−1281.2
30Sb91.589.480.575.422.78.1 × 10−1383.2
31Bi11.911.09.710.9178.01.12 × 10−0664.4
32Sn12.212.412.311.7141.01.08 × 10−0559.6
Table 5. The vales of “true hardness”.
Sample No.MetalHPSRa2HPSRc2HPSRA1
1Cu65.829.364.0
2Cu74.928.170.0
3Cu76.660.276.5
4Cu83.157.578.6
5Cu137.8108.1132.0
6Al36.446.236.0
7Al27.913.926.1
8Al26.119.125.0
9Ag78.7106.473.9
10Ni236.386.3203.1
11Ni242.8159.5210.4
12Pb−0.38.54.9
13Mo180.8129.7201.7
14Mo134.882.1164.4
15Cr146.195.9163.4
16Cr160.8124.6164.3
17Fe133.394.5120.9
18Fe111.132.2103.7
19Mn78.578.180.5
20Ta182.7152.7189.4
21W499.6726.6550.5
22Zn27.43.632.6
23Ti83.975.5100.1
24Co350.0182.9317.0
25Co383.1194.9340.1
26Co309.2258.6326.2
27Mg42.818.543.4
28Cd22.822.224.6
29Cd20.717.222.8
30Sb66.063.472.1
31Bi10.115.810.5
32Sn12.18.612.1
Publisher’s Note: MDPI stays neutral with regard to jurisdictional claims in published maps and institutional affiliations.

