
Optical Conductivity Spectra of Charge-Crystal and Charge-Glass States in a Series of θ-Type BEDT-TTF Compounds

 , , , and
Abstract
:1. Introduction
2. Materials and Methods
3. Results
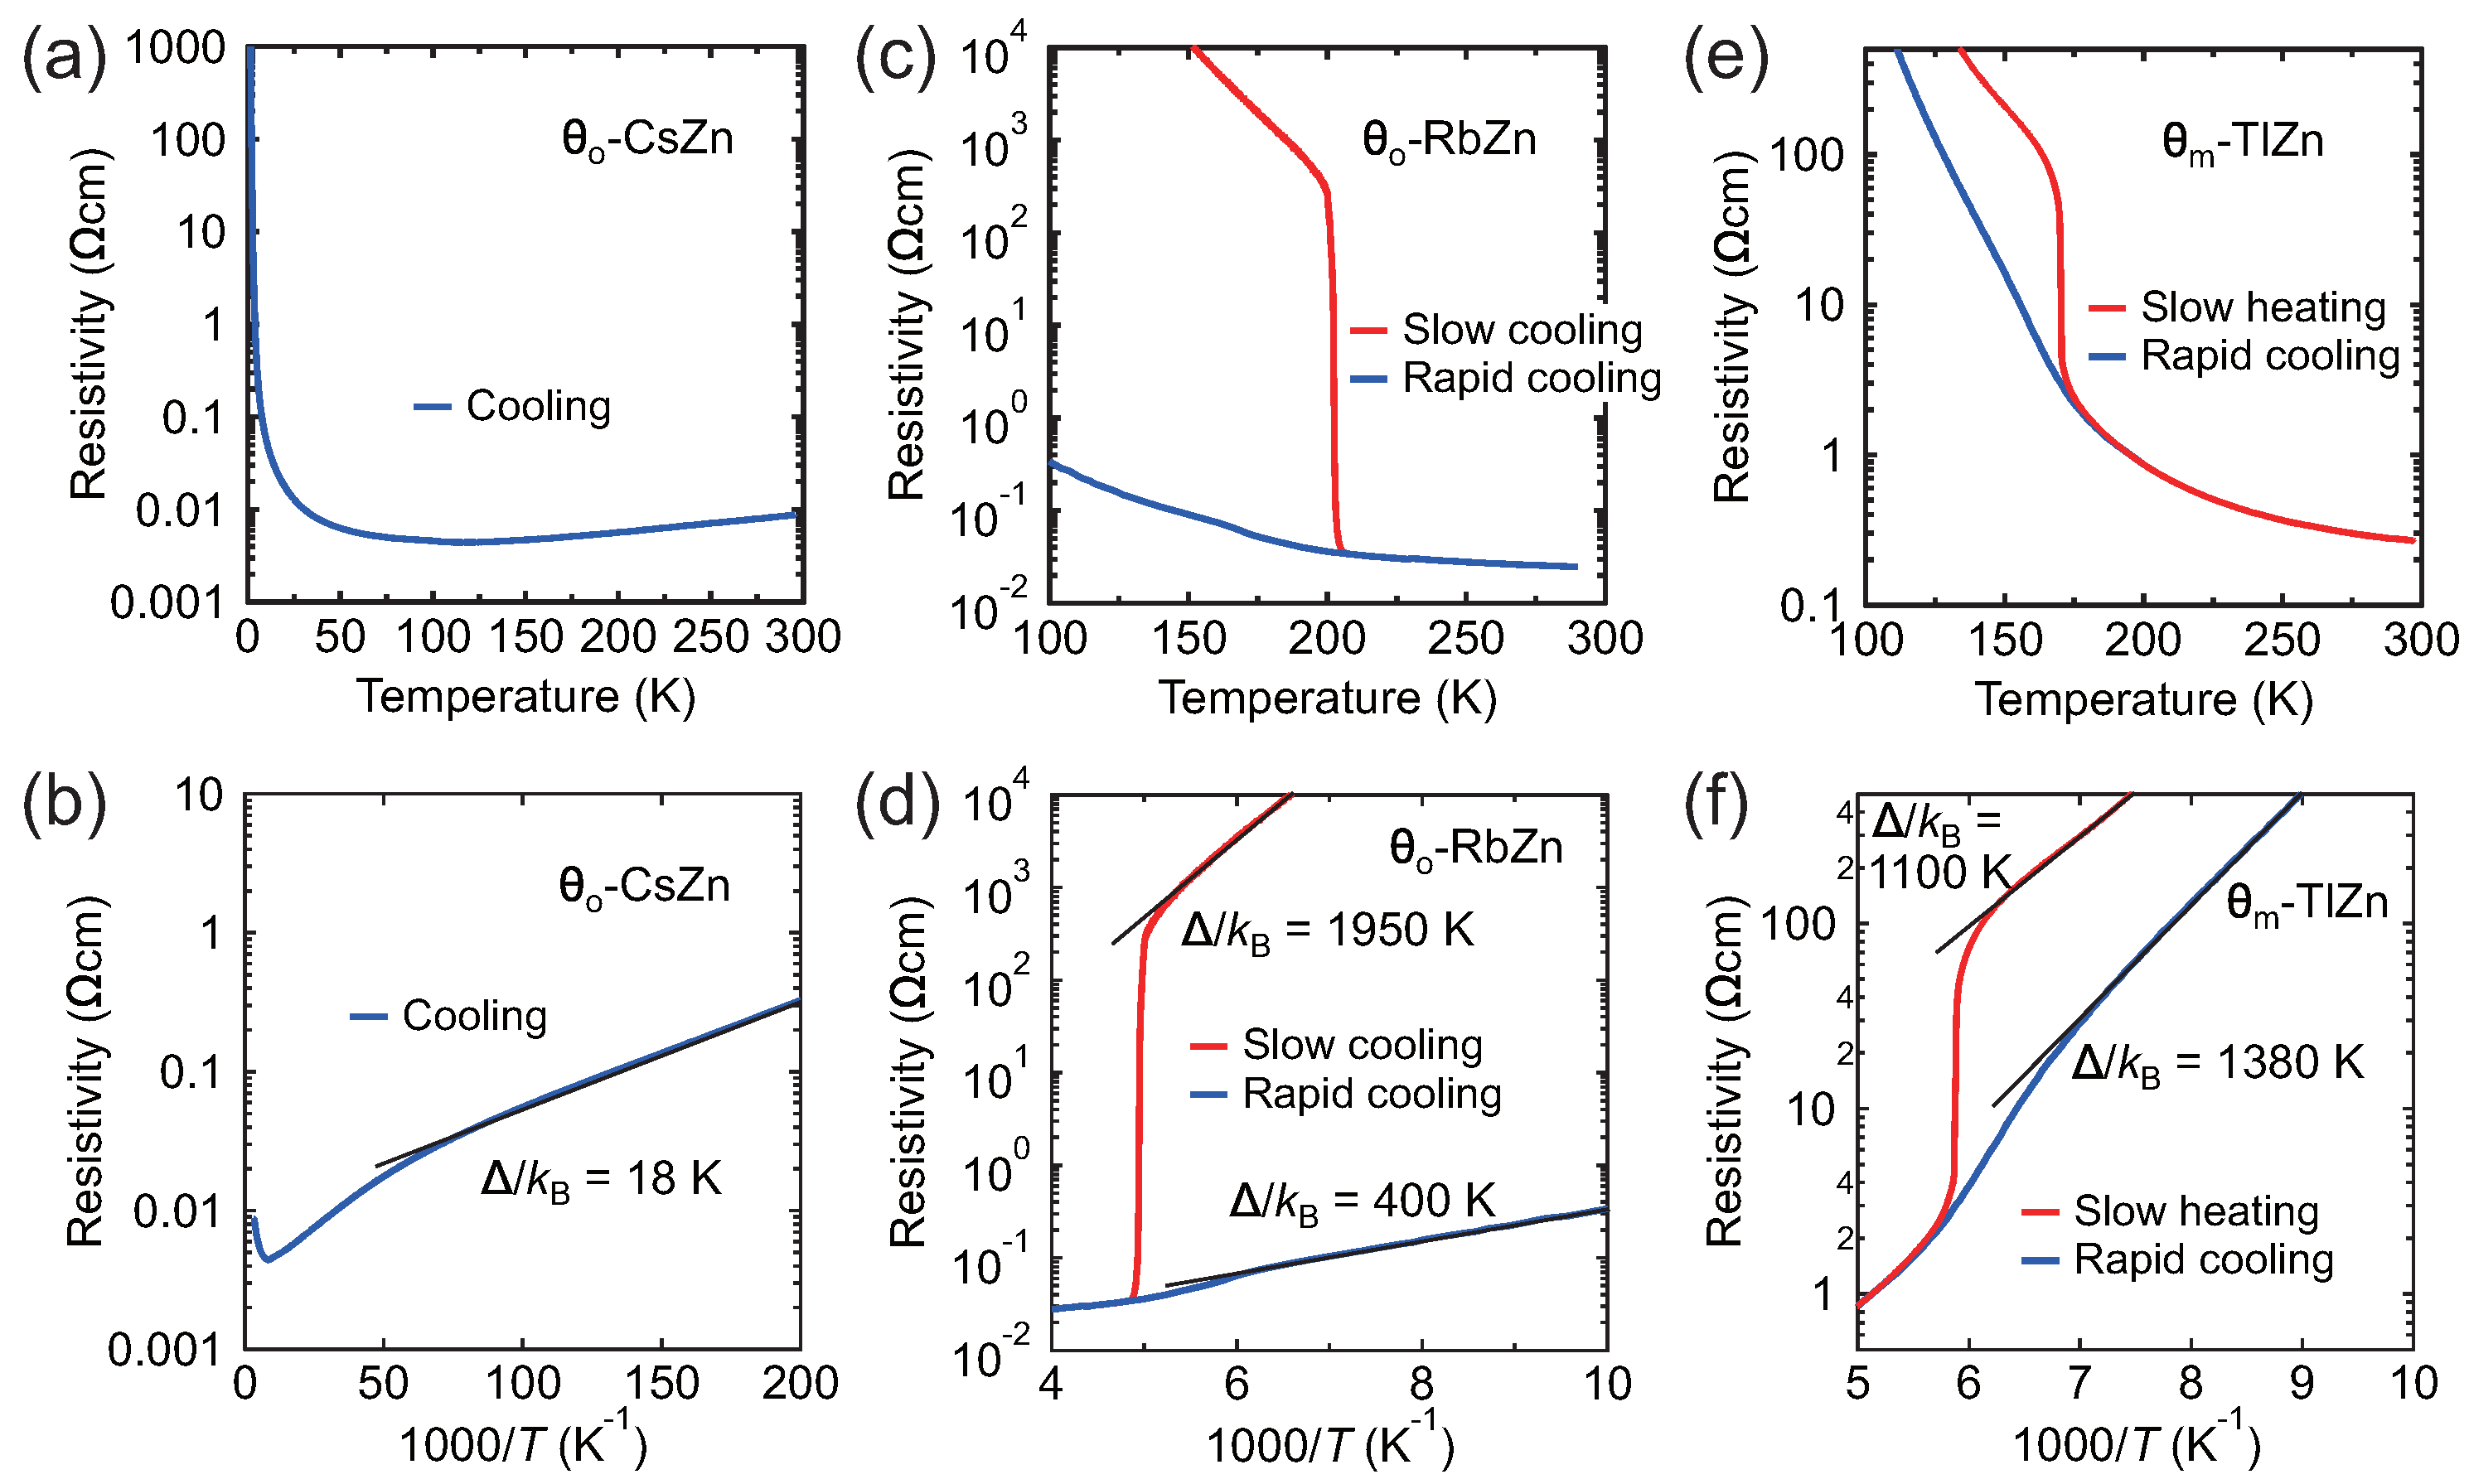
3.1. Electrical Resistivity in -CsZn, -RbZn, and -TlZn
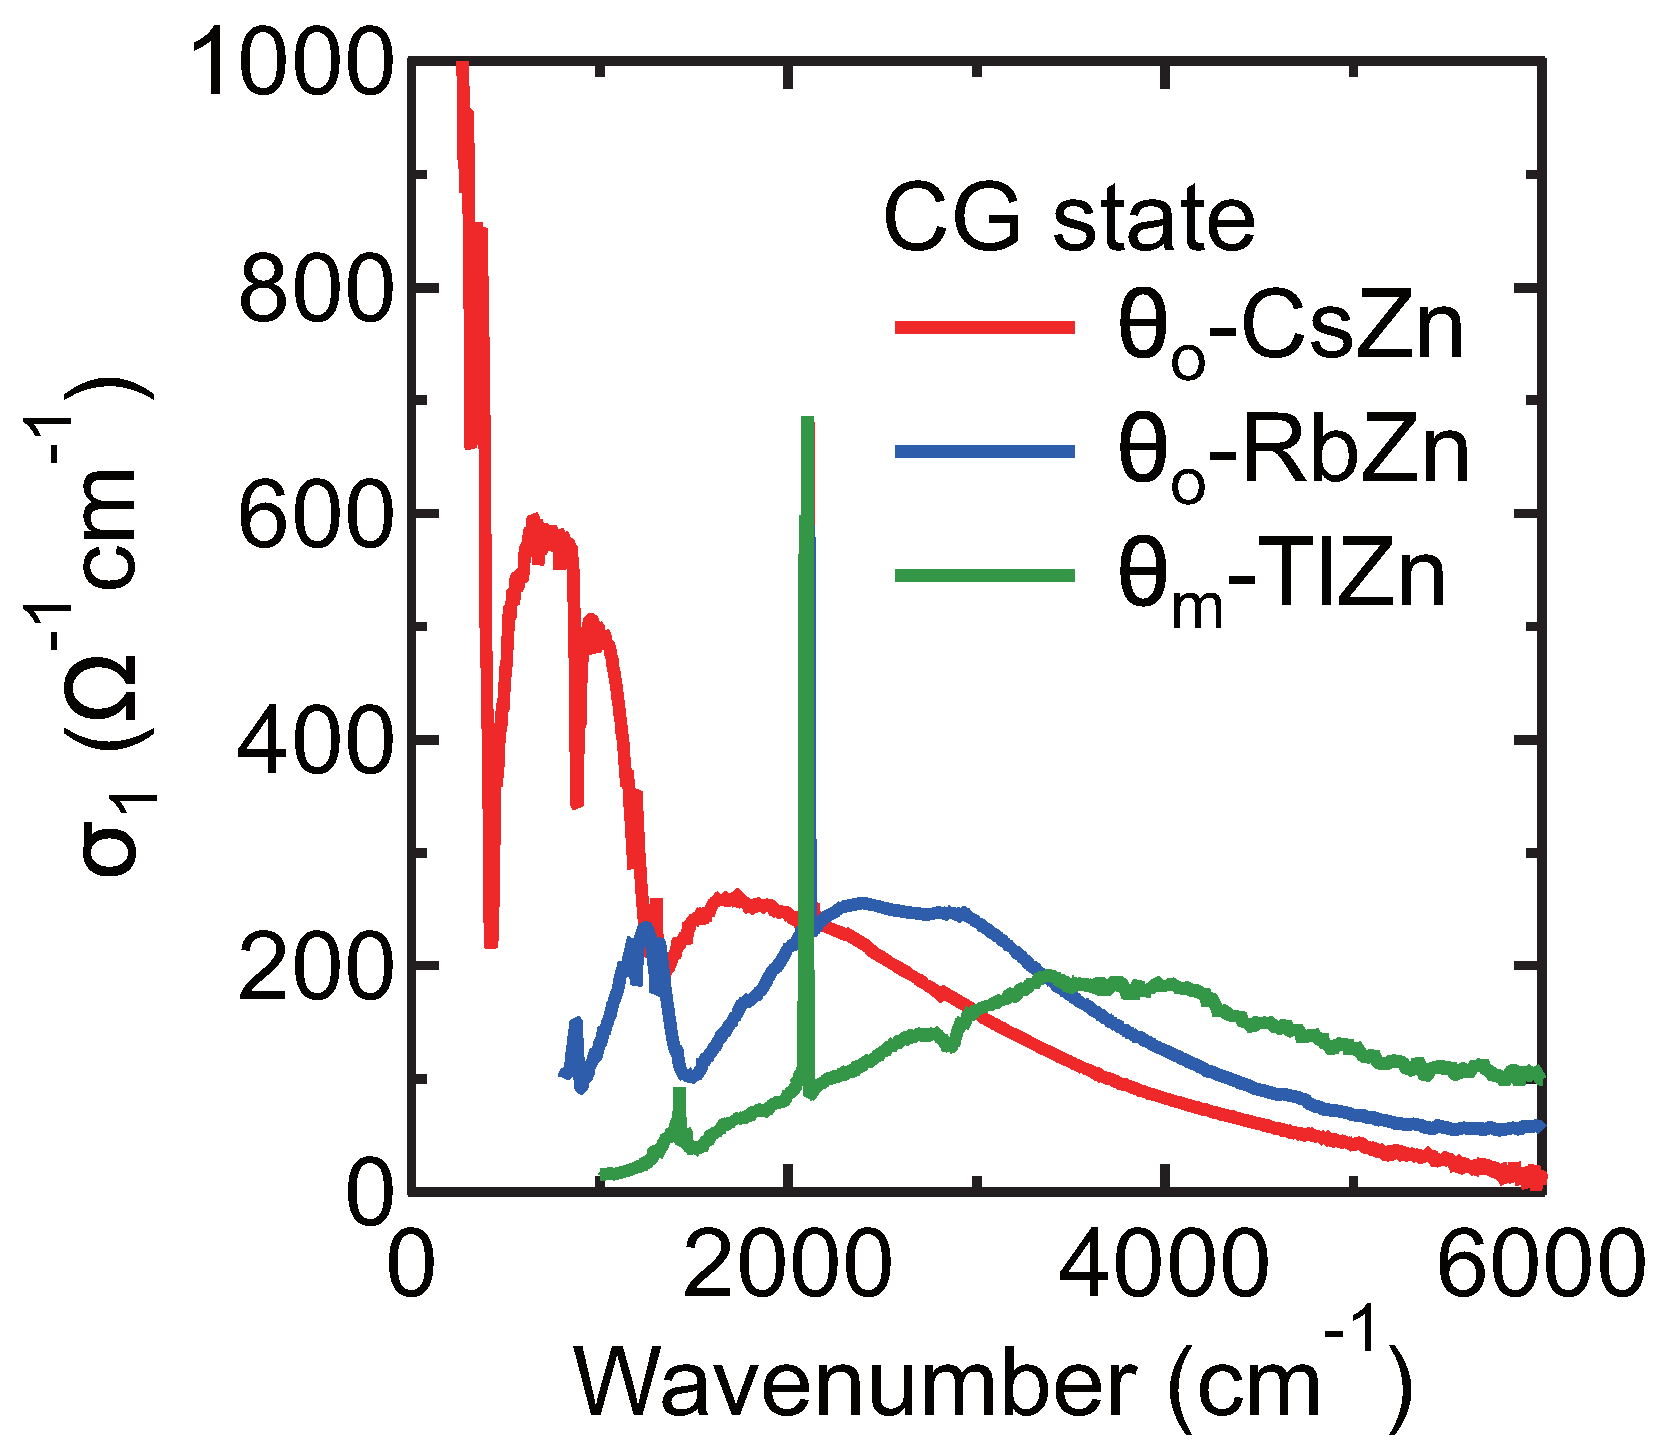
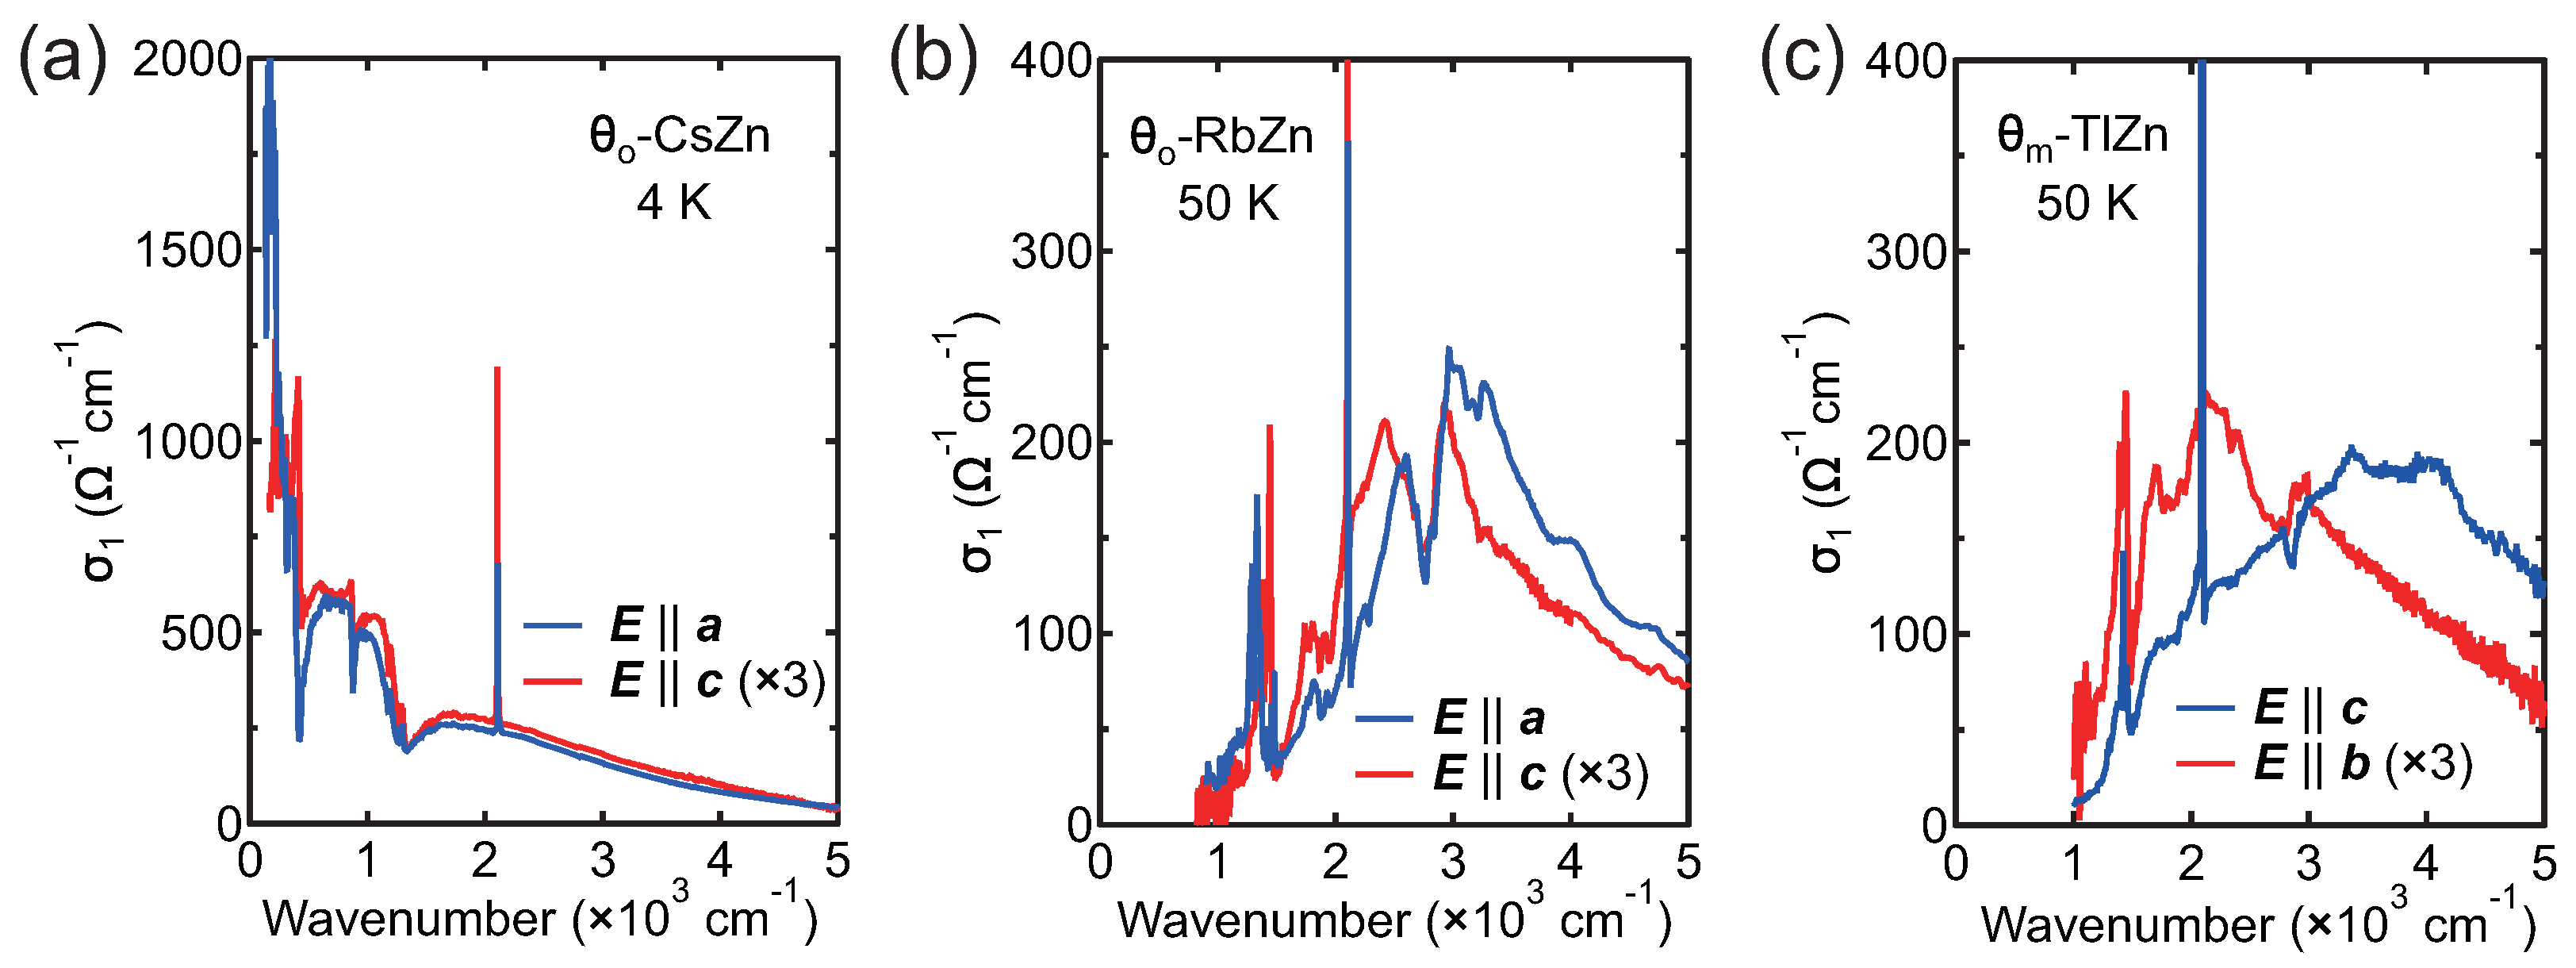
3.2. Optical Conductivity Spectra in -CsZn, -RbZn, and -TlZn
4. Discussion
5. Conclusions
Author Contributions
Funding
Institutional Review Board Statement
Informed Consent Statement
Data Availability Statement
Acknowledgments
Conflicts of Interest
References
- Takahashi, T.; Nogami, Y.; Yakushi, K. Charge ordering in organic conductors. J. Phys. Soc. Jpn. 2006, 75, 051008. [Google Scholar] [CrossRef]
- Seo, H.; Merino, J.; Yoshioka, H.; Ogata, M. Theoretical aspects of charge ordering in molecular conductors. J. Phys. Soc. Jpn. 2006, 75, 051009. [Google Scholar] [CrossRef]
- Chiba, R.; Hiraki, K.; Takahashi, T.; Yamamoto, H.M.; Nakamura, T. Charge disproportionation and dynamics in θ-(BEDT-TTF)2CsZn(SCN)4. Phys. Rev. B 2008, 77, 115113. [Google Scholar] [CrossRef]
- Kagawa, F.; Sato, T.; Miyagawa, K.; Kanoda, K.; Tokura, Y.; Kobayashi, K.; Kumai, R.; Murakami, Y. Charge-cluster glass in an organic conductor. Nat. Phys. 2013, 9, 419–422. [Google Scholar] [CrossRef]
- Sato, T.; Kagawa, F.; Kobayashi, K.; Miyagawa, K.; Kanoda, K.; Kumai, R.; Murakami, Y.; Tokura, Y. Emergence of nonequilibrium charge dynamics in a charge-cluster glass. Phys. Rev. B 2014, 89, 121102(R). [Google Scholar] [CrossRef]
- Sato, T.; Kagawa, F.; Kobayashi, K.; Ueda, A.; Mori, H.; Miyagawa, K.; Kanoda, K.; Kumai, R.; Murakami, Y.; Tokura, Y. Systematic variations in the charge-glass-forming ability of geometrically frustrated θ-(BEDT-TTF)2X organic conductors. J. Phys. Soc. Jpn. 2014, 83, 083602. [Google Scholar] [CrossRef]
- Hashimoto, K.; Zhan, S.C.; Kobayashi, R.; Iguchi, S.; Yoneyama, N.; Moriwaki, T.; Ikemoto, Y.; Sasaki, T. Collective excitation of a short-range charge ordering in θ-(BEDT-TTF)2CsZn(SCN)4. Phys. Rev. B 2014, 89, 085107. [Google Scholar] [CrossRef]
- Oike, H.; Kagawa, F.; Ogawa, N.; Ueda, A.; Mori, H.; Kawasaki, M.; Tokura, Y. Phase-change memory function of correlated electrons in organic conductors. Phys. Rev. B 2015, 91, 041101. [Google Scholar] [CrossRef]
- Sato, T.; Miyagawa, K.; Kanoda, K. Electronic crystal growth. Science 2017, 357, 1378–1381. [Google Scholar] [CrossRef]
- Sasaki, S.; Hashimoto, K.; Kobayashi, R.; Itoh, K.; Iguchi, S.; Nishio, Y.; Ikemoto, Y.; Moriwaki, T.; Yoneyama, N.; Watanabe, M.; et al. Crystallization and vitrification of electrons in a glass-forming charge liquid. Science 2017, 357, 1381–1385. [Google Scholar] [CrossRef]
- Mahmoudian, S.; Rademaker, L.; Ralko, A.; Fratini, S.; Dobrosavljević, V. Glassy dynamics in geometrically frustrated Coulomb liquids without disorder. Phys. Rev. Lett. 2015, 115, 025701. [Google Scholar] [CrossRef] [PubMed]
- Mori, H.; Tanaka, S.; Mori, T.; Kobayashi, A.; Kobayashi, H. Crystal structure and physical properties of M = Rb and Tl salts of (BEDT-TTF)2MM′(SCN)4 [M′ = Co, Zn]. Bull. Chem. Soc. Jpn. 1998, 71, 797–806. [Google Scholar] [CrossRef]
- Watanabe, M.; Nogami, Y.; Oshima, K.; Mori, H.; Tanaka, S. Novel pressure-induced 2kF CDW state in organic low-dimensional compound θ-(BEDT-TTF)2CsCo(SCN)4. J. Phys. Soc. Jpn. 1999, 68, 2654–2663. [Google Scholar] [CrossRef]
- Nogami, Y.; Pouget, J.P.; Watanabe, M.; Oshima, K.; Mori, H.; Tanaka, S.; Mori, T. Structural modulation in θ-(BEDT-TTF)2CsM′(SCN)4 [M′ = Co, Zn]. Synth. Met. 1999, 103, 1911. [Google Scholar] [CrossRef]
- Watanabe, M.; Noda, Y.; Nogami, Y.; Mori, H. Investigation of X-ray diffuse scattering in θ-(BEDT-TTF)2RbM′SCN4. Synth. Met. 2003, 135–136, 665–666. [Google Scholar] [CrossRef]
- Watanabe, M.; Noda, Y.; Nogami, Y.; Mori, H. Transfer integrals and the spatial pattern of charge ordering in θ-(BEDT-TTF)2RbZn(SCN)4 at 90 K. J. Phys. Soc. Jpn. 2004, 73, 116–122. [Google Scholar] [CrossRef]
- Mori, H.; Tanaka, S.; Mori, T. Systematic study of the electronic state in θ-type BEDT-TTF organic conductors by changing the electronic correlation. Phys. Rev. B 1998, 57, 12023–12029. [Google Scholar] [CrossRef]
- Tajima, H.; Kyoden, S.; Mori, H.; Tanaka, S. Estimation of charge-ordering patterns in θ-ET2MM′(SCN)4 (MM′= RbCo, RbZn, CsZn) by reflection spectroscopy. Phys. Rev. B 2000, 62, 9378–9385. [Google Scholar] [CrossRef]
- Miyagawa, K.; Kawamoto, A.; Kanoda, K. Charge ordering in a quasi-two-dimensional organic conductor. Phys. Rev. B 2000, 62, R7679–R7682. [Google Scholar] [CrossRef]
- Suzuki, K.; Yamamoto, K.; Yakushi, K. Charge-ordering transition in orthorhombic and monoclinic single-crystals of θ-(BEDT-TTF)2TlZn(SCN)4 studied by vibrational spectroscopy. Phys. Rev. B 2004, 69, 085114. [Google Scholar] [CrossRef]
- Sawano, F.; Terasaki, I.; Mori, H.; Mori, T.; Watanabe, M.; Ikeda, N.; Nogami, Y.; Noda, Y. An organic thyristor. Nature 2005, 437, 522. [Google Scholar] [CrossRef] [PubMed]
- Takahide, Y.; Konoike, T.; Enomoto, K.; Nishimura, M.; Terashima, T.; Uji, S.; Yamamoto, H.M. Current-voltage characteristics of charge-ordered organic crystals. Phys. Rev. Lett. 2006, 96, 136602. [Google Scholar] [CrossRef] [PubMed]
- Nad, F.; Monceau, P.; Yamamoto, H.M. Effect of cooling rate on charge ordering in θ-(BEDT-TTF)2RbZn(SCN)4. Phys. Rev. B 2007, 76, 205101. [Google Scholar] [CrossRef]
- Nogami, Y.; Hanasaki, N.; Watanabe, M.; Yamamoto, K.; Ito, T.; Ikeda, N.; Ohsumi, H.; Toyokawa, H.; Noda, Y.; Terasaki, I.; et al. Charge order competition leading to nonlinearity in organic thyristor family. J. Phys. Soc. Jpn. 2010, 79, 044606. [Google Scholar] [CrossRef]
- Mori, T. Non-stripe charge order in the θ-phase organic conductors. J. Phys. Soc. Jpn. 2003, 72, 1469–1475. [Google Scholar] [CrossRef]
- Merino, J.; Seo, H.; Ogata, M. Quantum melting of charge order due to frustration in two-dimensional quarter-filled systems. Phys. Rev. B 2005, 71, 125111. [Google Scholar] [CrossRef]
- Kaneko, M.; Ogata, M. Mean-field study of charge order with long periodicity in θ-(BEDT-TTF)2X. J. Phys. Soc. Jpn. 2006, 75, 014710. [Google Scholar] [CrossRef]
- Watanabe, H.; Ogata, M. Novel charge order and superconductivity in two-dimensional frustrated lattice at quarter filling. J. Phys. Soc. Jpn. 2006, 75, 063702. [Google Scholar] [CrossRef]
- Hotta, C.; Furukawa, N. Strong coupling theory of the spinless charges on triangular lattices: Possible formation of a gapless charge-ordered liquid. Phys. Rev. B 2006, 74, 193107. [Google Scholar] [CrossRef]
- Kuroki, K. The origin of the charge ordering and its relevance to superconductivity in θ-(BEDT-TTF)2X: The effect of the Fermi surface nesting and the distant electron-electron interactions. J. Phys. Soc. Jpn. 2006, 75, 114716. [Google Scholar] [CrossRef]
- Nishimoto, S.; Shingai, M.; Ohta, Y. Coexistence of distinct charge fluctuations in θ-(BEDT-TTF)2X. Phys. Rev. B 2008, 78, 035113. [Google Scholar] [CrossRef]
- Dressel, M.; Drichko, N.; Schlueter, J.; Merino, J. Proximity of the layered organic conductors α-(BEDT-TTF)2MHg(SCN)4 (M = K, NH4) to a charge-ordering transition. Phys. Rev. Lett. 2003, 90, 167002. [Google Scholar] [CrossRef] [PubMed]
- Drichko, N.; Dressel, M.; Kuntscher, C.A.; Pashkin, A.; Greco, A.; Merino, J.; Schlueter, J. Electronic properties of correlated metals in the vicinity of a charge-order transition: Optical spectroscopy of α-(BEDT-TTF)2MHg(SCN)4 (M= NH4, Rb, Tl). Phys. Rev. B 2006, 74, 235121. [Google Scholar] [CrossRef]
- Kaiser, S.; Dressel, M.; Sun, Y.; Greco, A.; Schlueter, J.A.; Gard, G.L.; Drichko, N. Bandwidth tuning triggers interplay of charge order and superconductivity in two-dimensional organic materials. Phys. Rev. Lett. 2010, 105, 206402. [Google Scholar] [CrossRef]
- Clay, R.T.; Mazumdar, S.; Campbell, D.K. Charge ordering in θ-(BEDT-TTF)2X materials. J. Phys. Soc. Jpn. 2002, 71, 1816–1819. [Google Scholar] [CrossRef]
- Udagawa, M.; Motome, Y. Charge ordering and coexistence of charge fluctuations in quasi-two-dimensional organic conductors θ-(BEDT-TTF)2X. Phys. Rev. Lett. 2007, 98, 206405. [Google Scholar] [CrossRef]
- Yoshimi, K.; Maebashi, H. Coulomb frustrated phase separation in quasi-two-dimensional organic conductors on the verge of charge ordering. J. Phys. Soc. Jpn. 2012, 81, 063003. [Google Scholar] [CrossRef]
- Naka, M.; Seo, H. Long-period charge correlations in charge-frustrated molecular θ-(BEDT-TTF)2X. J. Phys. Soc. Jpn. 2014, 83, 053706. [Google Scholar] [CrossRef]
- Pustogow, A.; Treptow, K.; Rohwer, A.; Saito, Y.; Alonso, M.S.; Lo¨hle, A.; Schlueter, J.A.; Dressel, M. Charge order in β′′-phase BEDT-TTF salts. Phys. Rev. B 2019, 99, 155144. [Google Scholar] [CrossRef]
- Wannier, H. Antiferromagnetism. The triangular Ising net. Phys. Rev. 1950, 79, 357–364. [Google Scholar] [CrossRef]
- Houtappel, R.M.F. Order-disorder in hexagonal lattices. Physica 1950, 16, 425–455. [Google Scholar] [CrossRef]
- Thomas, T.; Saito, Y.; Agarmani, Y.; Thyzel, T.; Hashimoto, K.; Sasaki, T.; Lang, M.; Müller, J. Involvement of structural dynamics in the charge-glass formation in molecular metals. Phys. Rev. B 2022, 105, L041114. [Google Scholar] [CrossRef]
- Thomas, T.; Thyzel, T.; Sun, H.; Müller, J.; Hashimoto, K.; Sasaki, T.; Yamamoto, H.M. Comparison of the charge-crystal and charge-glass state in geometrically frustrated organic conductors studied by fluctuation spectroscopy. Phys. Rev. B 2022, 105, 205111. [Google Scholar] [CrossRef]


Publisher’s Note: MDPI stays neutral with regard to jurisdictional claims in published maps and institutional affiliations. |
© 2022 by the authors. Licensee MDPI, Basel, Switzerland. This article is an open access article distributed under the terms and conditions of the Creative Commons Attribution (CC BY) license (https://creativecommons.org/licenses/by/4.0/).
Share and Cite
Hashimoto, K.; Kobayashi, R.; Ohkura, S.; Sasaki, S.; Yoneyama, N.; Suda, M.; Yamamoto, H.M.; Sasaki, T. Optical Conductivity Spectra of Charge-Crystal and Charge-Glass States in a Series of θ-Type BEDT-TTF Compounds. Crystals 2022, 12, 831. https://doi.org/10.3390/cryst12060831
Hashimoto K, Kobayashi R, Ohkura S, Sasaki S, Yoneyama N, Suda M, Yamamoto HM, Sasaki T. Optical Conductivity Spectra of Charge-Crystal and Charge-Glass States in a Series of θ-Type BEDT-TTF Compounds. Crystals. 2022; 12(6):831. https://doi.org/10.3390/cryst12060831
Chicago/Turabian StyleHashimoto, Kenichiro, Ryota Kobayashi, Satoshi Ohkura, Satoru Sasaki, Naoki Yoneyama, Masayuki Suda, Hiroshi M. Yamamoto, and Takahiko Sasaki. 2022. "Optical Conductivity Spectra of Charge-Crystal and Charge-Glass States in a Series of θ-Type BEDT-TTF Compounds" Crystals 12, no. 6: 831. https://doi.org/10.3390/cryst12060831